Energy dispersive X-ray fluorescence (EDXRF) - Experimental Physics
Energy dispersive X-ray fluorescence (EDXRF) - Experimental Physics
Energy dispersive X-ray fluorescence (EDXRF) - Experimental Physics
- No tags were found...

You also want an ePaper? Increase the reach of your titles
YUMPU automatically turns print PDFs into web optimized ePapers that Google loves.
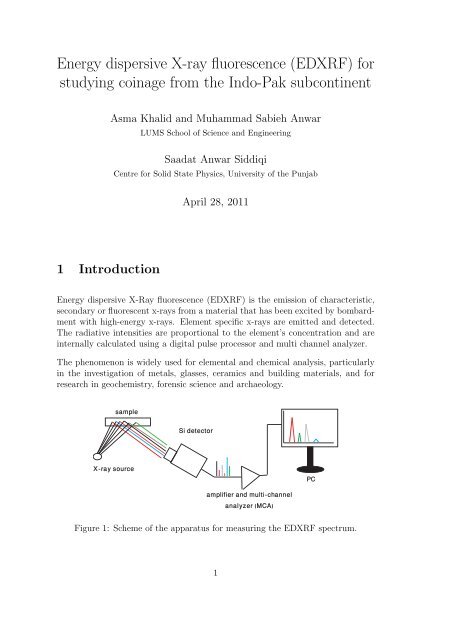
<strong>Energy</strong> <strong>dispersive</strong> X-<strong>ray</strong> <strong>fluorescence</strong> (<strong>EDXRF</strong>) forstudying coinage from the Indo-Pak subcontinentAsma Khalid and Muhammad Sabieh AnwarLUMS School of Science and EngineeringSaadat Anwar SiddiqiCentre for Solid State <strong>Physics</strong>, University of the PunjabApril 28, 20111 Introduction<strong>Energy</strong> <strong>dispersive</strong> X-Ray <strong>fluorescence</strong> (<strong>EDXRF</strong>) is the emission of characteristic,secondary or fluorescent x-<strong>ray</strong>s from a material that has been excited by bombardmentwith high-energy x-<strong>ray</strong>s. Element specific x-<strong>ray</strong>s are emitted and detected.The radiative intensities are proportional to the element’s concentration and areinternally calculated using a digital pulse processor and multi channel analyzer.The phenomenon is widely used for elemental and chemical analysis, particularlyin the investigation of metals, glasses, ceramics and building materials, and forresearch in geochemistry, forensic science and archaeology.sampleSi detectorX-<strong>ray</strong> sourceamplifier and multi-channelanalyzer (MCA)PCFigure 1: Scheme of the apparatus for measuring the <strong>EDXRF</strong> spectrum.1
2 Application of <strong>EDXRF</strong> in numismaticsCoins are an important source of history. Numismatics is the study of coins thatinvolves the analysis of the coinage materials, their metallic composition as well asthe identification of the sources of the metals. On the basis of coin archeometry,we can classify coins on the basis of their fabric (size, shape, design, thicknessand workmanship), metrology (weight), design, metallic composition, techniquesof manufacturing and message content. Various analytical techniques are used forascertaining the metal content of coins [1].Coinage is interesting from the historic point of view because it helps learn factsabout the past that are otherwise unknown. Coins are archaeological objects whichhave to be interpreted and studied to gain important historical information. Theysupply us with information about events long after their occurrence. They are alsoofficial emblems, and thus likely to provide accurate, reliable and authoritativeinformation about governments. Moreover, minting is one of the oldest forms ofmass production. Coins provide vital evidence about metallurgical history whichhas shaped the progress of civilizations [2].2.1 <strong>EDXRF</strong> and numismaticsAn important application of <strong>EDXRF</strong> is the characterization of coins. <strong>EDXRF</strong>spectrometry is a non-destructive technique. The technique does not require specialsample preparation. It is fast, non destructive, sensitive, and capable of multielemental analysis [3, 4].Coins can be sources for the following valuable information:1. coin minting methodologies,2. ores employed for coin minting,3. relative percentage of metals in coins of different reigns, regions, etc.,4. correlating variations in alloy composition with debasement of coins and thusthe economic stability of an era or a political empire,5. distinguishing imitations from authentic coin specimens, and6. detection of trace element in coins.Some vital information that can be gleaned from numismatic spectroscopy is highlightedbelow.2.2 Monetary and economic affluenceIn ancient times, the noble metal content of a coin was used to reflect its realvalue, so that the denomination of coins was directly related to the economic and2
political situation. The debasement of coins was indicative of normal inflation.The persistence of political instability, e.g., civil wars, often led to poorly mintedcoins. In turbulent times, the necessary ores or metals from mines did not reach themint and substitute elements had to be used imparting an unusual concentrationto the coins. Imitations were also made during all periods.For example, in the early medieval era (400 to 700 AD), there was a scarcity ofcoinage throughout north India which is an indicative of a low level of exchangetransactions, and hence a quiescence of trade and commerce. Gold coins wererarely issued after the fall of the Gupta Empire (320-550 AD) and even the silverand copper coins were scarce and poorly minted. In contrast, during the economicexpansion of the Mughal era (1556 to 1748 AD), the imperial reserves of preciousmetals and gems swelled, specially during Akbar’s reign (1556-1605 AD) and thehigh quality and purity of metal was maintained in coins of gold, silver and copper.In the early Mughal period, whatever the available sources of gold and silver, Indiawas the ultimate sink for these metals. Similarly, during the British rule in India,the price of silver skyrocketed after the outbreak of World War II in 1939 and thepractice of hoarding silver coins became common. This led to reducing the useof silver in coins. Hence, the tracking of elemental compositions is one importantindicator of monetary and political history.2.3 Production and manufacturing techniquesThe composition of coins has fluctuated widely in different time periods due to variationin production techniques. For example, the refinement of metals at the endof the seventeenth century has stamped its influence on the production techniques.Prior to 1700 AD, the coins of Cu and the noble metals Ag and Au containedadditional elements and impurities such as Pb, Sn, Bi, Hg, but the coins producedat the end of the 18 th century AD were found to have purity exceeding 99%.2.4 Relation to the ores and trace element detectionThe <strong>EDXRF</strong> of ancient coins can help identify the ore used in coins. The concentrationof the chief element of the coin and the trace elements present in thecoins helps guess the ore. The data can also be related to the manufacturing andminting techniques of that era. We can also predict whether the ore was minednear the mint or was traded and transported to the mint [5, 6].In short, the XRF study of sub-continent’s coins can provide useful informationof how the coins and the minting technology flourished over time, what changeswere affected in the composition and texture of the coins, how the use of preciousmetals like gold and silver started for coinage, what were the sources of thesemetals in the subcontinent, what were the weight standards for different coins andwhy the weight percentage of precious metals fluctuated in different reigns andperiods. The study can also help discover the methods of the extraction of coinageelements (gold, silver and copper) from their respective ores and the history of3
different mines in the region as well as the tracing of mercantile and trade routes.3 Proposed experimental work on coin archeometryusing <strong>EDXRF</strong>The objective of the proposed experiment is to analyze and study the historicalcoins of the sub-continent that were minted in the region from approximately 200BC to 1947 AD. For this purpose, a collaboration with the Lahore museum wouldbe beneficial since these museums possess a treasure of coins which were minted andused during different historical periods. The X-<strong>ray</strong> spectroscopy of the coins canprovide a good opportunity to understand the technology, political and economichistory of different reigns and empires of the sub-continent.The hardware components used for self-assembled <strong>EDXRF</strong> spectrometer include znX-<strong>ray</strong> source, a Si X-<strong>ray</strong> detector and a radiation shielding box, all three mountedon a transportable unit. The data will be analyzed using a digital pulse processorand personal computer. The complete setup is shown in Figure 1. The X-<strong>ray</strong>spossess an energy of 25 keV and are produced from a Ag anode.(a)1(b)432Figure 2: (a) The <strong>EDXRF</strong> hardware components including the x-<strong>ray</strong> generatorand detector mounted on the base plate, 1. X-<strong>ray</strong> tube, 2. Si-detector, 3. sampleholder and 4. radiation shielding. (b) Sample coin mounted on the sample holder.3.1 Softwares for quantitative analysis3.1.1 ADMCA 2.0: element identification softwareADMCA 2.0 is a Windows-based software package that acquires and displays thespectral data and performs the necessary signal processing. Spectral analysis featuresinclude setting regions of interest (ROI) for the peaks obtained and elementdistinction on the basis of characteristic energies of the centroid for the respective4
peak. A typical output from ADMCA is shown in Table 2 which contains a listof regions of interest, the corresponding centroid for each peak in terms of energyand the corresponding element.3.1.2 XRS-FP concentration analysis softwareThe ADMCA 2.0 has an active link to the XRS-FP software, which correlates theintensities of the characteristic X-<strong>ray</strong> lines to the elemental concentration. Theconcentrations are computed by the following processes.1. A spectrum of a reference standard sample is acquired whose elemental concentrationsare already known to us (for e.g., Steel 316, whose concentrationsin weight percentage are given for Cr, Fe, Ni, Cu, Mn, Mo). Shown belowin Table 1 is a list of the three available reference samples along with theircompositions.Sample Samplecode Elemental compositionStainless steel SS-316 Cr, Fe, Ni, Cu, Mn, MoChromium Copper IARM-158B Cr, Ag, Al, Fe, Mn, Ni, Pb, Si, Sn, Zn, Cu, As, C, Co, SbSilicon Brass 31XWSB7 Si, Zn, Cu, Al, Pb, Fe, Mn, Ni, P, Sb, Sn, As, Bi, Cd, Co, CrTable 1: Reference samples used for calibration. The samples are acquired fromAmptek [7] (SS-316) and Brammer [8] (IARM-158B, 31XWSB7).2. The spectrum from the reference sample is loaded into the XRS-FP andall the elements present in the steel sample are defined and their respectiveknown concentrations provided against them.3. The spectrum is processed according to the steps presented in Figure 3 andthen deconvoluted. The theoretical calibration coefficients (taking into theaccount the setup geometry and matrix effects) are then calculated by thesoftware.4. The calibration coefficients not only depend on the specific geometric parametersbut also on how the intensity is related to concentration for eachelement in the reference sample.5. The calibration coefficients thus obtained for the particular elements helpdetermining the concentrations of the respective elements in any unknownsample.Table 2 and 3 present the data from the ADMCA and XRS-FP softwares for astandard steel-316. The spectrum is shown in Figure 4.5
Spectrum smoothingSi peak removalSum peak removalBackground removalExtractingintensitiesGuassiandeconvolutionFigure 3: Steps in processing the spectrum inside the XRS-FP software.Intensity (counts)<strong>Energy</strong> (keV)Figure 4: <strong>EDXRF</strong> spectrum for standard stainless steel, the green regions indicatethe selected regions of interest, while blue peak is the one under observation, theunselected peaks are red in color.3.2 Corrective procedures for the <strong>EDXRF</strong> spectraIn an ideal <strong>EDXRF</strong> spectrum, the peaks of the characteristic X-<strong>ray</strong>s emitted fromeach element of the sample should be distinguished vertical lines against energy,6
Start End Net peak area Centroid Element(keV ) (keV ) (counts) (keV )5.34 5.55 13095 5.43 K α − Cr5.76 6.15 7200 5.93 K α − Mn6.25 6.54 66613 6.40 K α − F e6.88 7.20 11010 7.05 K α − Co7.38 7.62 4412 7.49 K α − Ni17.24 17.71 1729 17.48 K α − MoTable 2: Elements present in steel listed in the ADMCA software.Component Intensity Line Concentration Calib. coefficient(c/s) (mg/cm 2 )Mn 98.64 K α 1.630 7464.6Mo 58.43 K α 2.380 8165.6Cu 31.75 K α 0.169 38757.7Ni 230.55 K α 12.180 4586.4Fe 2162.29 K α 65.191 5304.3Cr 1078.80 K α 18.450 6856.5Table 3: The concentration analysis of steel through XRS-FP software. The theoreticallycalculated calibration coefficients are also listed.but in practice the spectrum is slightly different. The important factors that areresponsible for this divergence from the ideal behavior are discussed below. It isimportant to understand the various artifacts and their corrections for a precisequantitative analysis of coinage.1. Matrix effectsThe most fundamental complication in <strong>EDXRF</strong> spectrometry is that thecharacteristic x-<strong>ray</strong>s emitted by the elements in the sample interact withother atoms in the sample. For example, Fe emits 6.4 keV K α X-<strong>ray</strong>s, whichare absorbed very efficiently by Cr, which then emits additional characteristicX-<strong>ray</strong>s. The Fe line is absorbed while the Cr line is enhanced. Further, theprimary X-<strong>ray</strong>s from the excitation source are absorbed by the sample. Thecomposition and density of the sample determine how far the primary X-<strong>ray</strong>spenetrate into the sample, hence the number of atoms excited.Absorption of the primary radiation and competitive absorption and enhancementof characteristic lines are termed matrix effects. The main consequenceis that, even if a perfect X-<strong>ray</strong> source, detector, and electronics wereused, analysis software would still need to correct the measured intensitiesfor matrix effects to obtain the true concentrations.2. Attenuation of X-<strong>ray</strong>sSome of the X-<strong>ray</strong>s emitted by the sample towards the detector will not bedetected. A fraction of the higher energy X-<strong>ray</strong>s pass through the detectorwithout interacting, whereas, a fraction of the lower energy X-<strong>ray</strong>s interact7
inbetween, in the detector‘s Be window or in the intervening air. The primaryconsequence is that the sensitivity of the system is reduced at lower andhigher energies. To obtain accurate relative intensities, the software mustcorrect for these losses.3. Finite energy resolution of the detectorThe detector has a finite energy resolution, resulting in broader peaks, approximatingto the Gaussian shape. The broadening largely arises from twophysical effects: statistical fluctuations in charge production (Fano factor)and electronic noise at the preamplifier input. The primary consequence offinite energy resolution is spectral interference, i.e., overlapping peaks. Forexample, the Fe K α peak and the Ni K α peak interfere to an extent. Bothcan be detected, but to determine the net area of each, the issue of overlapmust be addressed. The software cannot simply obtain net counts in someregion but must deconvolve the spectrum, fitting it to a sum of separatepeaks.4. Bremsstrahlung and scatteringThe X-<strong>ray</strong> tube also emits Bremsstrahlung X-<strong>ray</strong>s over a wide energy range.Some X-<strong>ray</strong>s from the tube will undergo Compton (inelastic) scattering andsome will undergo Rayleigh (elastic) scattering from the sample into thedetector. This will form a continuum around a Ag peak. A filter is usuallyrequired to be placed in front of the tube to reduce backscatter at the energiesof primary interest.5. Environmental Interference There are always various materials in thevicinity of the detector. X-<strong>ray</strong>s will interact with these elements, producingenvironmental interferences, characteristic X-<strong>ray</strong> peaks and a scatteringcontinuum. For example, argon in the air produces a peak at 2.96 keV andaluminum in the detector package produces a peak at 1.48 keV [9].3.3 Mathematical model for calculating elemental concentrationsIn X-<strong>ray</strong> <strong>fluorescence</strong> analysis, the Sherman equation [10] is of chief importanceand it describes quite nicely the relationship between the measured intensitiesemitted by a specimen and its composition. Jacob Sherman, in 1955 publisheda detailed demonstration of an equation enabling one to calculate theoretical netX-<strong>ray</strong> intensities emitted by each element from a specimen of known compositionas it is irradiated by polychromatic X-<strong>ray</strong> beam. This equation can be written inthe form,I i = f(C i , C j , C k , . . . , C N ) (1)where I x and C x are the net intensity and the concentration of the N elementspresent in the sample. Unfortunately, this equation is not invertible. The inverse,8
is not straightforward. Let‘s define,C i = g(I i , I j , I k , . . . , I N ) (2)( ∑ 1 +jR i = C ϵ )ijC ji1 + ∑ j α , (3)ijC jwhich is the same as (1), except that the absolute intensity I i has been replacedby the relative intensity R i in order to allow the calculated intensities to be independentof the instrument. In this form, the equation still shows that the relativeintensity R i is proportional not only to the intrinsic concentration C i but also tothe ratio given in parentheses.The numerator contains the enhancement coefficients ϵ ij of each element j of thematrix, at concentration C j , and the denominator contains all the absorption coefficientsα ij . Thus, R i will increase with the enhancement effects and decreasewith the absorption effects.In quantitative XRF analysis, one of the major problems is the correction formatrix effects (absorption and enhancement). An algorithm is used to theoreticallycalculate the fundamental parameters, which are numerical coefficients that correctfor the effect of each matrix element on the analyte in a given specimen. However,these coefficients depend on the full sample composition to be analyzed which inpractice is unknown prior to analysis!In any case, (3) must be reversed enabling a quantitative compositional analysis,If C i = R i .M is , we obtain,C i = R i1 + ∑ j α ijC j1 + ∑ j ϵ ijC j. (4)M is = 1 + ∑ j α ijC j1 + ∑ j ϵ ijC j(5)where M is is the correction factor for the matrix effects of specimen s on analyte i.In practice, the R i intensities are measured and the M is factor is calculated fromthe Sherman equation or any theoretically valid algorithm selected by the analystin a given analytical context.For the calculation of concentrations from the measured intensities, an accuratevalue of M is is needed for each unknown sample. We need initial concentrations of astandard sample [7, 8] to find the correction factors or the fundamental parametersand then these fundamental parameters help us find the exact concentrations. Inthe experimental sample analysis, we perform the cyclic steps shown in Figure 5using the XRS-FP and a standard sample of known composition.9
using geometric factorsstep 1known sampleElementalconcentrationsunknown sampleCalibrationcoefficientscalculationstep 2Figure 5: Steps involved in finding the unknown sample’s comosition throughfundamental parameter calculation.4 Sample <strong>EDXRF</strong> spectra4.1 SteelThe <strong>EDXRF</strong> spectrum of reference sample of steel ss-316 is shown in Figure 4. Theelements were distinguished by the ADMCA software after defining the regionsof interest for every peak, shown in Table 2 and finally the concentrations werefound through the XRS-FP software after calculating the F P parameters for eachelement in the known sample of steel. The concentrations are listed in Table 3.4.2 1907 coin (1/4 anna)In 1862, during the reign of Queen Victoria, coins were introduced which werereferred to as Regal issues. Denominations were 1/12 anna, 1/4 and 1/2 anna andall were in copper [11].In 1906, King Edward VII replaced copper with bronze for the lowest three denominations.Historical bronzes are highly variable in composition, as most metalworkersprobably used whatever scrap was at hand, often containing a mixtureof copper, zinc, tin, lead, nickel, iron, antimony, arsenic and silver.The spectrum of the coin is shown in Figure 6. The elements present in the coinwere identified by the ADMCA software and the results are presented in Table 4,where as the concentration analysis is listed in Table 5.10
Intensity (counts)<strong>Energy</strong> (keV)Figure 6: <strong>EDXRF</strong> spectrum of 1907 bronze coin.Start End Net peak area Centroid Element(keV ) (keV ) (counts) (keV )7.70 8.38 16500 8.00 K α − Cu8.47 9.19 3107 8.84 K α − Zn15.71 16.51 279 16.10 No match16.67 17.35 119 16.93 No matchTable 4: <strong>EDXRF</strong> spectrum for 1907 AD bronze coin and its constituent elements.Component Intensity Line Concentration(c/s) (wt %)Fe 6.58 K α 0.138Ni 6.30 K α 0.179Zn 40.69 K α 1.343Cu 2738.34 K α 98.339Table 5: The concentration analysis of 1907 copper coin through XRS-FP software.References[1] Upinder Singh, “A History of Ancient and Early Medieval India”, PearsonEducation, 2008.[2] Philip Grierson, “Numismatics”, Oxford University Press, 1975.11
[3] V. Vijayan, T.R. Raut<strong>ray</strong>, D.K. Basa, “<strong>EDXRF</strong> study of Indian punch-markedsilver coins”, Nuclear Instruments and Methods in <strong>Physics</strong> Research B, Vol.225, 353 − 356, 2004.[4] Philip J. Potts, Andrew T. Ellis, Peter Kregsamer, Christina Streli, ChristineVanhoof, Margaret Weste and Peter Wobrauschekc, “Atomic spectrometryupdate. X-Ray <strong>fluorescence</strong> spectrometry”, Journal of Analytical AtomicSpectrometry, Vol. 20, 1124 − 1154, 2005.[5] B. Beckhoff B. Kanngieer, N. Langhoff, “Handbook of Practical X-Ray FluorescenceAnalysis”, R. Wedell, H. Wolff (Eds.), 2006.[6] John. F. Richards, “The New Cambridge History of India, The Mughal Empire”,Canbridge University Press, 1993.[7] http://www.amptek.com/products.html[8] http://www.brammerstandard.com/pdf/metal-chip-nonferrous.pdf[9] R.Redus, “XRF Spectra and Spectra Analysis Software”, Amptek Inc, 2008.[10] R.M. Rousseau, The Quest for a Fundamental Algorithm in X-Ray FluorescenceAnalysis and Calibration, The Open Spectroscopy Journal, 2009, 3,31-42.[11] http://kingedwardcoins.blogspot.com12