Content Uniformity Acceptance Testing for Large Sample Sizes - PQRI
Content Uniformity Acceptance Testing for Large Sample Sizes - PQRI
Content Uniformity Acceptance Testing for Large Sample Sizes - PQRI
- No tags were found...

Create successful ePaper yourself
Turn your PDF publications into a flip-book with our unique Google optimized e-Paper software.
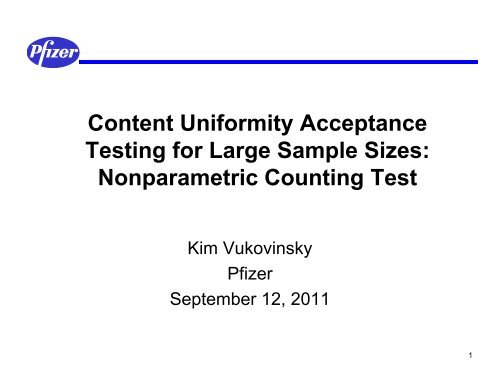
<strong>Content</strong> <strong>Uni<strong>for</strong>mity</strong> <strong>Acceptance</strong><strong>Testing</strong> <strong>for</strong> <strong>Large</strong> <strong>Sample</strong> <strong>Sizes</strong>:Nonparametric Counting TestKim VukovinskyPfizerSeptember 12, 20111
Presentation Outline• ICH UDU and Translating Quality Requirements to<strong>Large</strong> n• <strong>Large</strong> n Counting Test– 2006 to 2009 proposal– 2010 modified proposal• Comments on # Tablets outside 75 – 125%• Summary2
ICH UDU TESTTHE QUALITY STANDARD3
ICH UDU (2007+)In 2007, the EP, JP,USP harmonizedUDU test came intoeffect.• Based on old JP test(two-sided toleranceinterval)• Indifference windowarranged to achieve~constant coverage <strong>for</strong>means within ~94 –106%• Multiplication factors 2.4and 2.0 equate to 84%confidence of 91%within 85 – 115%. Thiswas not specificallycalculated at the time.StartCollect N=30Dosage UnitsAssay n1=10 units(Calc Mean Xbarand StDev s)AVNoAssay n2=20 units(Calc Mean Xbarand StDev sbased on n = 30)AVYes# of Tablets Outside(0.75M, 1.25M) %LC= 0> 0YesNo⎧ 98.5, if x < 98.5⎪M = ⎨ x,otherwise⎪⎩101.5,if x > 101.5AV = |M-Xbar|+2.4S⎧ 98.5, if x < 98.5⎪M = ⎨ x,otherwise⎪⎩101.5,if x > 101.5AV = |M-Xbar|+2.0S# of Tablets Outside(0.75M, 1.25M) %LCRejectBatch>00Pass Batch4
Interpretation of the OC CurveA lot with 96% of itstablets between 85 –115% LC has about a65% chance ofpassing ICH UDUThe OC curvesummarizes the test’sper<strong>for</strong>mance providingthe probability bilit ofpassing therequirement given acoverage (assumingdata is normallydistributed.)5
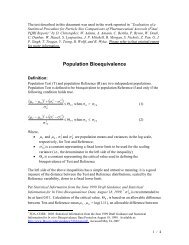
What is Coverage?A calculation based on both thebatch mean and the standarddeviation of the process (i.e.,manufacturing and assay)FrequencyMeanXbar Std Dev RSD% Tablets>115% Tablets
LARGE N LOT RELEASE7
<strong>Large</strong> N: The Issue and Considerations2003 Issue:• With PAT, n is no longer 10/30 ... a new test is required.• How are the current quality requirements translated tolarge n?• What is the appropriate acceptance test and acceptancecriteria?i Considerations:• What is the quality standard?• Is the current quality standard acceptable?• How to match the quality standard?• How will the test be used?8
<strong>Large</strong> N Test Development ConsiderationsPhRMA PAT, Quality, and Statistics Team members met withthe FDA (July 2004) to Determine Test Boundaries• Quality Standard is USP 905 (now ICH UDU)• Test should be Simple• No Normality Assumption• Match the ICH UDU at Probability of <strong>Acceptance</strong> = 50%(4.8% OOS at match point)9
<strong>Large</strong> N Test: Where to Match ICH UDU?Matching QualityMatch Point of 10%, 50%, 90% corresponds toCoverage of 88.1%, 94.7%, 98.1%<strong>for</strong> 100% LC.10
Matching Quality: Matching which 50%?• A maximal coverage of 95.17% (95.2%) is attained <strong>for</strong> a meanof 96.24% (96%) LC• In large n test development, coverage of 95.2% was used• The acceptance probability of a batch with 95% coverage of85-115% LC is (<strong>for</strong> any mean) the same or tighter than theICH-UDU test11
<strong>Large</strong> N Test: Three Options ConsideredParametric Tolerance Interval• Analyze n dosage units.• Express each individual result in % of label claim• Calculate the average and standard deviation• Look in Table <strong>for</strong> a k-value• Calculate statistic and determine lot status• Too complicated … issues with testing <strong>for</strong>normalityDistribution Free Tolerance Interval• Collect data <strong>for</strong> n dosage units; normalize to %label claim• Order sample x (1) , …, x (n)• Tolerance interval (TI) = (x (L) , x (U) ); where L & Uare determined by binomial probabilities (anddepend on n)• Accept batch if TI ⊆ (85, 115)• Cool idea ... very very complicatedNonparametric Counting Testn LC k100 100% k 1500 100% k 2100 96% k 3500 96% k 4Coverage <strong>Sample</strong> Order statisticssize(%) (n) Lower Upper87.5 100 3 9790.0 200 6 19491.5 300 9 29291.75 400 12 38992.25 500 14 48612
<strong>Large</strong> N Counting Test• Paper Published: Sandell,D.; Vukovinsky, K; Diener,M.; Hofer, J.; Pazdan, J.;Timmermans, J.“Development of a<strong>Content</strong> <strong>Uni<strong>for</strong>mity</strong> TestSuitable <strong>for</strong> <strong>Large</strong><strong>Sample</strong> <strong>Sizes</strong>,” DrugIn<strong>for</strong>mation Journal 40(3), 337-344 (2006).• One tiered counting test• Test translates to findingthe largest integer t,called c, such that:c = max{t ; Prob(Y ≤ t || p = 0.048) ≤ 0.5}.StartCollect N 0Dosage UnitsExpress Each Unitin %LC# of Tablets OutsideYes(85, 115) %LCc unitsNoc = round(-1.15+0.048*n)Pass BatchRejectBatch13
<strong>Large</strong> N Counting Test Per<strong>for</strong>manceBatch Mean at 100% LC; Std Dev ~ 7.6% at match<strong>Large</strong> N OC curves are strictly to the left of theharmonized UDU test OC curve at the 50% pass line.14
<strong>Large</strong> N Counting Test Per<strong>for</strong>mance, n=250Quality requirements tighten as the mean is off target.15
Mixed Response to Matching at 50%Negative: Some disagreement over having an area abovethe ICH UDU; Increased sample size creates increasedprobability to pass the test (depends on how quality isdefined)Positive: Accepted as a step <strong>for</strong>ward to gaining g processunderstanding and developing an acceptable test16
MODIFIED LARGE N LOT RELEASE17
Modified <strong>Large</strong> N• Two proposals evaluated:– Matching at 90%– Maintaining a constant 3% of units outside 85 – 115%• Number of tablets outside 75 – 125% considered18
90% matching point <strong>for</strong> mu = 100%The test translates to finding the largest integer t, called c, such that:c = max{t ; Prob(Y ≤ t || p = 0.02) ≤ 0.9}.50% P(accept) std dev is 6.8 to 7.2% <strong>for</strong>n=100 to 500vs. 7.7 <strong>for</strong> ICH UDUc is 3, 7, 13 <strong>for</strong> n=100, 250, 500.19
3% Outside 85 – 115% <strong>for</strong> mu = 100%Set Quality Level (QL) = 1 – coverage (e.g. 3%)C = Floor(p*N), where p = proportion of N outside [85, 115]=> Same proportion used <strong>for</strong> all N.50% P(a) std dev is 6.9 to 7.2% <strong>for</strong>n=100 to 500vs. 7.7 <strong>for</strong> ICH UDUc is 3, 7, 15 <strong>for</strong> n=100, 250, 500.20
<strong>Large</strong> N Criterion: ≤ 3% Outside 85-115% LCBergum, J.; Vukovinsky, K.; “A Proposed <strong>Content</strong> <strong>Uni<strong>for</strong>mity</strong> Test <strong>for</strong> <strong>Large</strong><strong>Sample</strong> <strong>Sizes</strong>”, Pharmaceutical Technology, 34 (11) 72 – 79 (2010)Test <strong>Sample</strong> Size <strong>Acceptance</strong> ValueICH UDU 10 0ICH UDU 30 1<strong>Large</strong> N 100 3<strong>Large</strong> N 250 7<strong>Large</strong> N 500 1521
3% <strong>Large</strong> N Criterion Protects Against ResultsOutside 75-125% LCAssuming normality … the 3% counting test provides tighter control of theproportion of results outside 75-125%. A batch with 0.3% units outside 75-125% has about 25% chance to pass the ICH-UDU test, while the chance topass the <strong>Large</strong> N 3% test is 5% <strong>for</strong> n=100 and approaches 0% <strong>for</strong> larger n.22
<strong>Large</strong> N Criterion:None Specified <strong>for</strong> 75-125% LC• Batch acceptance should depend on quality level, not sample size• Zero tolerance <strong>for</strong> tablets outside 75-125% LC is not advisable# of batches Until 1 Tablet Found Outside 75 – 125%<strong>for</strong> a Mean of 100% LC and Std Dev of 5.0%23
SummaryAdvantages of Modified Counting Test• Simple Test Mathematically• Simple to Implement (no look up table required)• <strong>Testing</strong> <strong>for</strong> Normality NOT Required• Quality Level Consistent with the ICH UDU• Increase in <strong>Sample</strong> Size Leads to a Tightened Quality Level<strong>Large</strong> N Counting controls number of tablets outside 75 – 125%to a tighter level than ICH UDU even with no control on #outside 75 – 125%Zero Tolerance of Tablets Outside 75 – 125% is not advisable;Sliding scale on quality level suggested24
Acknowledgements• Fasheng Li, Pfizer: Graphics and Discussion• Sonja Sekulic, Pfizer: Motivation and Discussion• Dennis Sandell, S5 Consulting: <strong>Large</strong> N• Myron Diener, sanofi-aventis: <strong>Large</strong> N• Jeff Hofer, Eli Lilly: <strong>Large</strong> N• Jim Pazdan, Novartis: <strong>Large</strong> N• Joep Timmermans, Pfizer: <strong>Large</strong> N• Jim Bergum, BMS: Modified <strong>Large</strong> N25