Shrimp FMP - Division of Marine Fisheries
Shrimp FMP - Division of Marine Fisheries
Shrimp FMP - Division of Marine Fisheries
- No tags were found...

Create successful ePaper yourself
Turn your PDF publications into a flip-book with our unique Google optimized e-Paper software.
2. TABLE OF CONTENTS1. ACKNOWLEDGMENTS....................................................................................................... iii2. TABLE OF CONTENTS ....................................................................................................... iv3. EXECUTIVE SUMMARY ....................................................................................................... 14. INTRODUCTION ................................................................................................................... 44.1 LEGAL AUTHORITY FOR MANAGEMENT .............................................................. 44.2 RECOMMENDED MANAGEMENT PROGRAM......................................................... 54.2.1 Goals and objectives .............................................................................. 54.2.2 Sustainable Harvest ................................................................................ 54.2.3 Management strategy.............................................................................. 54.3 DEFINITION OF MANAGEMENT UNIT ..................................................................... 64.4 GENERAL PROBLEM(S) STATEMENT .................................................................... 64.4.1 Trawling issues ....................................................................................... 64.4.2 Conflict and competition with other users............................................ 74.4.3 Insufficient assessment data ................................................................. 74.5 EXISTING PLANS STATUTES, AND RULES ........................................................... 84.5.1 Plans......................................................................................................... 84.5.2 Statutes .................................................................................................... 84.5.3 <strong>Marine</strong> <strong>Fisheries</strong> Commission Rules..................................................... 84.5.4 Other States <strong>Shrimp</strong> Rules and Regulations ...................................... 114.5.5 Federal regulations ............................................................................... 115. STATUS OF STOCK ........................................................................................................... 135.1 GENERAL LIFE HISTORY....................................................................................... 135.2 STOCK STATUS ...................................................................................................... 166. STATUS OF FISHERIES..................................................................................................... 176.1 COMMERCIAL ......................................................................................................... 176.2 RECREATIONAL...................................................................................................... 277. ECONOMIC STATUS.......................................................................................................... 317.1 COMMERCIAL FISHERY......................................................................................... 317.1.1 Harvesting sector .................................................................................. 317.1.1.1 Ex-vessel value and price...................................................... 317.1.1.2 Gear.......................................................................................... 337.1.1.3 Waterbodies ............................................................................ 357.1.1.4 Participants and trips............................................................. 367.1.1.5 Processing .............................................................................. 427.1.1.6 Marketing and distribution..................................................... 427.1.1.7 Economic impact <strong>of</strong> commercial fishery.............................. 447.1.2 Recreational fishery economics .......................................................... 457.1.2.1 <strong>Marine</strong> Recreational <strong>Fisheries</strong> Statistics Survey (MRFSS). 457.1.2.2 Recreational use <strong>of</strong> commercial gear (RCGL) ..................... 457.1.2.3 Other Recreational <strong>Fisheries</strong>................................................. 468. SOCIOECONOMIC CHARACTERISTICS .......................................................................... 478.1 Social Importance <strong>of</strong> the Fishery........................................................................... 478.1.1 Commercial fishermen.......................................................................... 478.1.1.1 Historical importance............................................................. 478.1.1.2 Community reliance on the commercial fishery.................. 478.1.1.3 Perceived conflicts................................................................. 498.1.1.4 Perception <strong>of</strong> important issues ............................................. 538.2 Recreational fishery................................................................................................ 54iv
8.2.1 Historical importance............................................................................ 548.2.2 Community reliance on the recreational fishery ................................ 548.2.3 Perceived conflicts................................................................................ 548.2.4 Perception <strong>of</strong> important issues............................................................ 548.3 Demographic Characteristics ................................................................................ 558.3.1 Commercial fishermen.......................................................................... 558.3.2 Recreational fishermen......................................................................... 568.4 RESEARCH RECOMMENDATIONS........................................................................ 578.5 Definitions and Acronyms...................................................................................... 589. ENVIRONMENTAL FACTORS ........................................................................................... 599.1 Habitat ...................................................................................................................... 599.2 Water Quality ........................................................................................................... 799.3 Habitat and Water Quality Protection.................................................................... 8410. PRINCIPAL ISSUES AND MANAGEMENT OPTIONS..................................................... 8710.1 ISSUES ................................................................................................................... 8710.1.1 Habitat .................................................................................................. 8710.1.2 Water Quality ....................................................................................... 8910.1.3 MANAGEMENT OF TRAWLING FOR HABITAT PROTECTION ........ 9010.1.4 SHRIMP TRAWL BYCATCH ................................................................ 9010.1.5 SOUTHERN FLOUNDER BYCATCH IN THE INSHORE SHRIMPTRAWL FISHERY................................................................................ 9110.1.6 SHRIMP MANAGEMENT BY SIZE IN NORTH CAROLINA ESTUARIES............................................................................................................. 9210.1.7 SHRIMP POUND NET SETS (<strong>Shrimp</strong> Traps) ..................................... 9310.1.8 MANAGEMENT OF FIXED GEAR IN THE INSHORE SHRIMP FISHERY............................................................................................................. 9410.1.9 THE RECREATIONAL SHRIMP TRAWL FISHERY IN NORTHCAROLINA .......................................................................................... 9410.1.10 GEAR SIZE RESTRICTIONS .............................................................. 9610.1.11 SHRIMP MANAGEMENT IN NEW RIVER ABOVE THE HIGHWAY 172BRIDGE ............................................................................................... 9610.1.12 SHRIMP MANAGEMENT IN CHADWICK BAY .................................. 9710.1.13 SHRIMP MANAGEMENT IN THE INTRACOASTAL WATERWAY ANDSOUNDS FROM NEW RIVER TO RICH’S INLET .............................. 9810.1.14 SHRIMP MANAGEMENT IN THE INTRACOASTAL WATERWAY ANDSOUNDS, RICH’S INLET TO CAROLINA BEACH............................. 9910.1.15 SHRIMP MANAGEMENT IN THE CAPE FEAR RIVER COMPLEX . 10010.1.16 SHRIMP MANAGEMENT IN BRUNSWICK COUNTY ...................... 10110.1.17 SHRIMP MANAGEMENT IN CORE SOUND..................................... 10210.1.18 SHRIMP MANAGEMENT IN THE NEWPORT RIVER ...................... 10310.1.19 SHRIMP MANAGEMENT IN BOGUE SOUND AND NORTH RIVER 10410.1.20 SHRIMP MANAGEMENT IN THE WHITE OAK RIVER .................... 10510.1.21 SHRIMP MANAGEMENT IN NEUSE RIVER..................................... 10610.1.22 SHRIMP MANAGEMENT IN BAY RIVER ......................................... 10710.1.23 SHRIMP MANAGEMENT IN THE PAMLICO RIVER ........................ 10810.1.24 SHRIMP MANAGEMENT IN PUNGO RIVER.................................... 10910.1.25 SHRIMP MANAGEMENT IN THE ATLANTIC OCEAN..................... 11010.1.26 SHRIMP MANAGEMENT IN PAMLICO SOUND .............................. 11110.1.27 SHRIMP MANAGEMENT IN ROANOKE SOUND............................. 11210.1.28 SHRIMP MANAGEMENT IN CROATAN SOUND ............................. 113v
10.2 SUMMARY OF MANAGEMENT ACTIONS ......................................................... 11410.2.1 Rules................................................................................................... 11410.2.2 Legislative Action.............................................................................. 11410.2.3 Processes .......................................................................................... 11410.2.4 Management Related Research ....................................................... 11510.2.5 Biological Research Needs .............................................................. 11610.2.6 Social and Economic Research Needs ........................................... 11610.7.7 Data Needs......................................................................................... 11610.2.8 Education ........................................................................................... 11610.2.9 Rule Changes other agencies .......................................................... 11611. LITERATURE CITED ...................................................................................................... 11712. APPENDICES.................................................................................................................. 12812.1 Appendix 1. SUMMARY OF SHRIMP REGULATIONS FROM OTHER STATES.................................................................................................... 12812.2 Appendix 2. MANAGEMENT OF TRAWLING FOR HABITAT PROTECTION.. 13212.3 Appendix 3. SHRIMP TRAWL BYCATCH ......................................................... 14412.4 Appendix 4. SOUTHERN FLOUNDER BYCATCH IN THE INSHORE SHRIMPTRAWL FISHERY ...................................................................... 20812.5 Appendix 5. SHRIMP MANAGEMENT BY SIZE IN NORTH CAROLINAESTUARIES ............................................................................... 21412.6 Appendix 6. SHRIMP POUND NET SETS (<strong>Shrimp</strong> Traps)............................... 21812.7 Appendix 7. MANAGEMENT OF FIXED GEAR IN THE INSHORE SHRIMPFISHERY .................................................................................... 22112.8 Appendix 8. THE RECREATIONAL SHRIMP TRAWL FISHERY IN NORTHCAROLINA................................................................................. 22612.9 Appendix 9. SHRIMP MANAGEMENT BY AREA IN NORTH CAROLINA ....... 23512.10 Appendix 10. SHRIMP MANAGEMENT IN NEW RIVER ABOVE THE HIGHWAY172 BRIDGE............................................................................... 24112.11 Appendix 11. SHRIMP MANAGEMENT IN CHADWICK BAY......................... 24912.12 Appendix 12. SHRIMP MANAGEMENT IN THE INTRACOASTAL WATERWAYAND SOUNDS FROM NEW RIVER TO RICH’S INLET ............ 25412.13 Appendix 13. SHRIMP MANAGEMENT IN THE INTRACOASTAL WATERWAYAND SOUNDS, RICH’S INLET TO CAROLINA BEACH........... 26212.14 Appendix 14. SHRIMP MANAGEMENT IN THE CAPE FEAR RIVER COMPLEX.................................................................................................... 26812.15 Appendix 15. SHRIMP MANAGEMENT IN BRUNSWICK COUNTY............... 27312.16 Appendix 16. SHRIMP MANAGEMENT IN CORE SOUND............................. 28312.17 Appendix 17. SHRIMP MANAGEMENT IN THE NEWPORT RIVER............... 28612.18 Appendix 18. SHRIMP MANAGEMENT IN BOGUE SOUND AND NORTH RIVER.................................................................................................... 28912.19 Appendix 19. SHRIMP MANAGEMENT IN THE WHITE OAK RIVER............. 29212.20 Appendix 20. SHRIMP MANAGEMENT IN THE NEUSE RIVER..................... 29412.21 Appendix 21. SHRIMP MANAGEMENT IN BAY RIVER.................................. 30312.22 Appendix 22. SHRIMP MANAGEMENT IN PAMLICO RIVER......................... 31612.23 Appendix 23. SHRIMP MANAGEMENT IN PUNGO RIVER ............................ 33112.24 Appendix 24. SHRIMP MANAGEMENT IN THE ATLANTIC OCEAN ............. 34112.25 Appendix 25. SHRIMP MANAGEMENT IN PAMLICO SOUND....................... 34912.26 Appendix 26. SHRIMP MANAGEMENT IN ROANOKE SOUND..................... 36112.27 Appendix 27. SHRIMP MANAGEMENT IN CROATAN SOUND ..................... 37012.28 Appendix 28. PROPOSED RULES .................................................................. 379vi
3. EXECUTIVE SUMMARYThe goal <strong>of</strong> the North Carolina <strong>Shrimp</strong> Fishery Management Plan is to utilize amanagement strategy that provides adequate resource protection, optimizes the long-termcommercial harvest, maximizes social and economic value, provides sufficient opportunity forrecreational shrimpers, and considers the needs <strong>of</strong> all user groups. To achieve this goal, it isrecommended that the following objectives be met:1. Minimize waste and enhance economic value <strong>of</strong> the shrimp resource by promoting moreeffective harvesting practices.2. Minimize harvest <strong>of</strong> non-target species <strong>of</strong> finfish and crustaceans and protected,threatened, and endangered species.3. Promote the protection, restoration, and enhancement <strong>of</strong> habitats and environmentalquality necessary for enhancing the shrimp resource.4. Maintain a clear distinction between conservation goals and allocation issues.5. Reduce conflicts among and within user groups, including non-shrimping user groupsand activities.6. Encourage research and education to improve the understanding and management <strong>of</strong>the shrimp resource.The three species <strong>of</strong> shrimp, brown, pink, and white, included in this FisheryManagement Plan (<strong>FMP</strong>) are essentially annual crops. Population size is regulated byenvironmental conditions, and while fishing reduces the population size over the season, fishingis not believed to have any impact on subsequent year class strength unless the spawningstock has been reduced below a minimum threshold level by environmental conditions.Estimates <strong>of</strong> population size are not available but since the fishery is considered to be fished atnear maximum levels, annual landings are probably a good indication <strong>of</strong> relative abundance.Annual variations in catch are presumed to be due to a combination <strong>of</strong> prevailing environmentalconditions and fishing effort. More recently, landings are showing the effects <strong>of</strong> changes in theeconomics <strong>of</strong> the fishery.Because <strong>of</strong> high fecundity and migratory behavior, the three species are all capable <strong>of</strong>rebounding from a very low population size in one year to a large population size in the next,provided environmental conditions are favorable. Fluctuations in abundance resulting fromchanges in environmental conditions will continue to occur. Perhaps the most serious threat tothe stocks is loss or degradation <strong>of</strong> habitat due to pollution or physical alteration. Especiallyvulnerable and critical to shrimp production is the salt marsh (for white and brown shrimp) andinshore seagrass habitat (especially for pink shrimp) which comprise the nursery areas forjuvenile shrimp. <strong>Shrimp</strong> stocks <strong>of</strong> all three species in North Carolina are considered viable.Commercial <strong>Fisheries</strong>North Carolina's shrimp fishery is unusual in the Southeast United States because threespecies are taken here and the majority <strong>of</strong> the effort is expended in internal waters. Totallandings from 1994-2003 have averaged 7,539,730 lbs per year (range 4.6-10.3 Mlb) caught onan average <strong>of</strong> 18,591 annual trips (range 14,399-23,901 trips). Inshore waters account for 76%1
and ocean waters 24% <strong>of</strong> the total harvest.For the most recent five year period 51% <strong>of</strong> the landings are from Pamlico Sound, 24%from the Atlantic Ocean and 10% from Core Sound. There has been a change in the speciescomposition <strong>of</strong> the fishery. While brown shrimp comprise about two/ thirds <strong>of</strong> the harvest,historically pink shrimp made up 29% <strong>of</strong> the landings followed by white shrimp at 8%. For themost recent five year period the contribution has reversed with total landings <strong>of</strong> pink shrimp 5%and white shrimp 28%.The majority <strong>of</strong> the shrimp harvest (93%) is taken by otter trawls followed by skimmertrawls (4%) and channel nets (3%). This represents a shift toward the use <strong>of</strong> skimmers andchannel nets over what was observed in the past.About 73-80% <strong>of</strong> the shrimp trawl trips occur in estuarine waters, with the remainder inocean waters. Most <strong>of</strong> these Ocean trips are within state territorial seas (
for specific water bodies. The need to quantify the magnitude and to reduce the bycatch in thefishery statewide remains the most pressing research need.Protection <strong>of</strong> vulnerable habitats from the effects <strong>of</strong> trawling has been achieved througharea closures in the past. Recommendations in this plan propose additional closures, seasonrestrictions, and the increased use <strong>of</strong> gears that are more habitat friendly. Proposals that wouldprotect habitat and water quality, which are essential for the maintenance <strong>of</strong> healthy shrimppopulations, are also contained in the plan.Many <strong>of</strong> the recommendations for changes in the management <strong>of</strong> specific water bodiesaddress user conflicts through season and area and gear restrictions. A 90 foot headrope limitin internal waters, with the exception <strong>of</strong> Pamlico Sound and portions <strong>of</strong> the Neuse, Pamlico andPungo rivers, would reduce conflict as well as decrease bycatch.The use <strong>of</strong> trawls by RCGL holders and the significance <strong>of</strong> its impact on the shrimpfishery was examined. Recommendations include; a 48-quart limit on RCGL shrimp catches,allowing skimmer trawls as a RCGL gear and defining dimensions <strong>of</strong> a shrimp trap for use as aRCGL gear.The advisory committee made recommendations to increase the minimum shrimp size(count) at which some water bodies are opened to trawling to help economic conditions in thefishery. While it is not possible for North Carolina to affect the volume <strong>of</strong> imports and their effecton shrimp prices, participation in national efforts is important to help alleviate the dire economicsituation facing the domestic industry.3
4. INTRODUCTION4.1 LEGAL AUTHORITY FOR MANAGEMENT<strong>Fisheries</strong> management includes all activities associated with maintenance, improvement,and utilization <strong>of</strong> the fisheries resources <strong>of</strong> the coastal area, including research, development,regulation, enhancement, and enforcement.Many different state laws (General Statutes - G.S.) provide the necessary authority forfishery management in North Carolina. General authority for stewardship <strong>of</strong> the marine andestuarine resources by the North Carolina Department <strong>of</strong> Environment and Natural Resources(NCDENR) is provided in G.S. 113-131. The <strong>Division</strong> <strong>of</strong> <strong>Marine</strong> <strong>Fisheries</strong> (DMF) is the arm <strong>of</strong>the Department that carries out this responsibility. Enforcement authority for DMF enforcement<strong>of</strong>ficers is provided by G.S. 113-136. General Statute 113-163 authorizes research andstatistical programs. The North Carolina <strong>Marine</strong> <strong>Fisheries</strong> Commission (MFC) is charged to“manage, restore, develop, cultivate, conserve, protect, and regulate the marine and estuarineresources <strong>of</strong> the State <strong>of</strong> North Carolina” (G.S. 143B-289.51). The MFC can regulate fishingtimes, areas, fishing gear, seasons, size limits, and quantities <strong>of</strong> fish harvested and possessed(G.S. 113-182 and 143B-289.52). General Statute 143B-289.52 allows the MFC to delegateauthority to implement its regulations for fisheries “which may be affected by variable conditions”to the Director <strong>of</strong> DMF by issuing public notices called “proclamations”. Thus, North Carolinahas a very powerful and flexible legal basis for coastal fisheries management. The GeneralAssembly has retained for itself the authority to establish commercial fishing licenses andmandates that there will be no fees charged for permits. It has delegated to the MFC authorityto establish permits for various commercial fishing activities.The <strong>Fisheries</strong> Reform Act <strong>of</strong> 1997 (FRA) establishes a process for preparation <strong>of</strong> coastalfisheries management plans in North Carolina (G.S. 113-182). The Act was amended in 1998and again in 2004. The FRA states that “the goal <strong>of</strong> the plans shall be to ensure the long-termviability <strong>of</strong> the State’s commercially and recreationally significant species or fisheries. Eachplan shall be designed to reflect fishing practices so that one plan may apply to a specificfishery, while other plans may be based on gear or geographic areas. Each plan shall:a. Contain necessary information pertaining to the fishery or fisheries, includingmanagement goals and objectives, status <strong>of</strong> the relevant fish stocks, stock assessmentsfor multi-year species, fishery habitat and water quality considerations consistent withCoastal Habitat Protection Plans adopted pursuant to G.S. 143B-279.8, social andeconomic impact <strong>of</strong> the fishery to the State, and user conflicts.b. Recommend management actions pertaining to the fishery or fisheries.c. Include conservation and management measures that will provide the greatest overallbenefit to the State, particularly with respect to food production, recreationalopportunities, and the protection <strong>of</strong> marine ecosystems, and will produce a sustainableharvest, andd. Specify a time period, not to exceed 10 years from the date <strong>of</strong> adoption <strong>of</strong> the plan, forending overfishing and achieving a sustainable harvest. This subdivision shall applyonly to a plan for a fishery that is overfished. This subdivision shall not apply to a planfor a fishery where the biology <strong>of</strong> the fish or environmental conditions make endingoverfishing and achieving a sustainable harvest within 10 years impracticable.4
Sustainable harvest is defined in the FRA as “The amount <strong>of</strong> fish that can be taken from afishery on a continuing basis without reducing the stock biomass <strong>of</strong> the fishery or causing thefishery to become overfished. Overfished is defined as the condition <strong>of</strong> a fishery that occurswhen the spawning stock biomass <strong>of</strong> the fishery is below the level that is adequate to replacethe spawning class <strong>of</strong> the fishery. Overfishing is defined as fishing that causes a level <strong>of</strong>mortality that prevents a fishery form producing a sustainable harvest.4.2 RECOMMENDED MANAGEMENT PROGRAM4.2.1 Goals and objectivesThe goal <strong>of</strong> the North Carolina <strong>Shrimp</strong> Fishery Management Plan is to utilize amanagement strategy that provides adequate resource protection, optimizes the long-termcommercial harvest, maximizes social and economic value, provides sufficient opportunity forrecreational shrimpers, and considers the needs <strong>of</strong> all user groups. To achieve this goal, it isrecommended that the following objectives be met:1. Minimize waste and enhance economic value <strong>of</strong> the shrimp resource by promoting moreeffective harvesting practices.2. Minimize harvest <strong>of</strong> non-target species <strong>of</strong> finfish and crustaceans and protected,threatened, and endangered species.3. Promote the protection, restoration, and enhancement <strong>of</strong> habitats and environmentalquality necessary for enhancing the shrimp resource.4. Maintain a clear distinction between conservation goals and allocation issues.5. Reduce conflicts among and within user groups, including non-shrimping user groupsand activities.6. Encourage research and education to improve the understanding and management <strong>of</strong>the shrimp resource.4.2.2 Sustainable HarvestSustainable harvest for the penaeid shrimp fishery in North Carolina is defined as theamount <strong>of</strong> harvest that can be taken by fishermen without reducing the spawning stock belowthe level necessary to ensure adequate reproduction. This is appropriate for an annual cropsuch as shrimp when recruitment is dependent largely on environmental conditions rather thanfemale biomass. That is, a relatively small number <strong>of</strong> mature shrimp can provide sufficientrecruits for the subsequent year’s production. The sustainable harvest for the <strong>Shrimp</strong> <strong>FMP</strong> inNorth Carolina is the annual harvest <strong>of</strong> the three species <strong>of</strong> shrimp combined.4.2.3 Management strategyThe proposed management strategy for the shrimp fisheries in North Carolina is to 1)optimize resource utilization over the long-term, and 2) minimize waste. The first strategy willbe accomplished by protection <strong>of</strong> critical habitats, and gear and area restrictions to protect thestock. Minimization <strong>of</strong> waste will be accomplished by gear modifications (trawl mesh size,5
ycatch reduction devices, area closures, etc.), culling practices, and harvest restrictions. Toachieve this management strategy, it will be necessary to prioritize management issues.Highest priority will be given to biological issues (habitat, water quality, stock protection, wastereduction, etc.), followed by social issues, and economic issues.4.3 DEFINITION OF MANAGEMENT UNITThe management unit includes the three major shrimp species <strong>of</strong> shrimp: brown(Farfantepenaeus aztecus), pink (Farfantepenaeus duorarum), and white (Litopenaeussetiferus) and its fisheries in all coastal fishing waters <strong>of</strong> North Carolina, which includes theAtlantic Ocean <strong>of</strong>fshore to three miles.4.4 GENERAL PROBLEM(S) STATEMENT4.4.1 Trawling issues<strong>Shrimp</strong> management has evolved into its present form over the past 30 years, withdesignated primary and secondary nursery areas as well as no trawling areas permanentlyclosed to shrimping and shrimp trawling, and other areas opened and closed based on shrimpsize as determined by DMF sampling. “Target” opening sizes have been determined regionallyand closed areas are opened when that size is reached Dissatisfaction on the part <strong>of</strong> somefishermen and dealers with the areas opened or closed and the size <strong>of</strong> the shrimp at openingwarrant a look into our present management scheme.Inshore shrimp trawling has long been a source <strong>of</strong> controversy. Proposed legislation toban trawling entirely or in specific portions <strong>of</strong> the state comes up every few years and the timing<strong>of</strong> this <strong>FMP</strong> was influenced by such a proposal. The Plan will examine the presentmanagement regime, current scientific evaluation <strong>of</strong> its effects on habitat and incidental catch,and look at the appropriateness <strong>of</strong> trawling in certain areas at certain times <strong>of</strong> year.The two major issues <strong>of</strong> concern with inshore trawling are its effects on habitat and itsimpact on the non-targeted species that are caught incidentally to trawling. The destructiveeffects <strong>of</strong> trawling on bottom structure, sea grass beds, oyster rocks, etc. are well documented.Not so well understood are the impacts to benthic organisms, trawling’s role in oxygenatingsediments, supporting other fisheries such as the blue crab, and disturbing heavy metaldeposits.The impact <strong>of</strong> discarding bycatch, or incidentally captured non-targeted species, on fishpopulations is not well understood. Very little information exists to characterize and enumeratethe discards <strong>of</strong> certain species so that those numbers can be incorporated into a stockassessment. It is harder still to determine what effect trawling has in relation to habitat loss,natural population fluctuations, hurricanes, and poor water quality. With the development <strong>of</strong> this<strong>FMP</strong>, the questions surrounding trawling were addressed and methods <strong>of</strong> dealing with thisharvest method discussed and handled. The incidental catch <strong>of</strong> finfish by trawls and thediscarded portion <strong>of</strong> that bycatch is the major problem, real or perceived, with the shrimpfishery. The DMF has been a leader among the south Atlantic states in requiring bycatchreduction devices (BRD’s) in the tailbags <strong>of</strong> shrimp trawls in 1992 to eliminate as much bycatchas possible, but more research and trials on more devices is needed. Existing BRD’s are veryineffective at excluding southern flounder and other demersal species from the trawls and theAdvisory Committee <strong>of</strong> the Southern Flounder <strong>FMP</strong> has recommended that the issue beaddressed in the <strong>Shrimp</strong> <strong>FMP</strong>.6
4.4.2 Conflict and competition with other usersAlthough not as controversial as in the past, conflicts still exist within the shrimp fisherysuch as, fixed gear (crab pots, gill nets, pound nets, etc.) versus mobile gear (shrimp trawls),and large trawlers versus smaller trawlers. The DMF’s management practices <strong>of</strong> when to closeand open areas to shrimping are frequently debated. When an area is “closed”, is it closed toall shrimping, or just shrimp trawling? Should there be a more formally adopted averageminimum shrimp size that must be reached before an area is considered for opening? Are thereareas <strong>of</strong> the state that are presently opened to trawling that should be closed? Should there belimits placed on the amount <strong>of</strong> shrimp Recreational Commercial Gear License (RCGL) holderscan retain to discourage illegal selling? Measures to address these conflicts will be covered inthe Plan.The present method <strong>of</strong> dealing with a relatively new “shrimp trap” idea is to classify it asa shrimp pound net set and require that the owner have a Standard Commercial FishingLicense (SCFL) and apply for a permit to set them. The application process includes a publiccomment period to ensure that traditional uses <strong>of</strong> an area such as fishing, navigation, etc. arenot impacted by the proposed set. These “traps” are very effective and non-bottom disturbingand may be useful in reducing some Recreational Commercial Gear License (RCGL) trawlinggear use if allowed under some system to be discussed. Proliferation <strong>of</strong> these traps in smallbays and waterways and the displacement <strong>of</strong> traditional uses are major concerns to be dealtwith, but a small scale trap <strong>of</strong> this nature could be a beneficial alternative to shrimp trawling.Another relatively new source <strong>of</strong> concern that has the potential to influence all <strong>of</strong> theabove issues is the increase in imported shrimp from Asian and Central American countries.The importation <strong>of</strong> shrimp and prawns into the United States has increased significantly inrecent years, driving down prices for domestic wild-caught shrimp. Should North Carolina’s<strong>Shrimp</strong> Plan attempt to set us on a better footing to compete internationally, or should our focusbe to maintain the traditional, community-based fisheries economy?4.4.3 Insufficient assessment dataBecause <strong>of</strong> tremendous variation in the bycatch based on seasonal, day vs. night, area,gear, and other parameters, the characterization and quantification <strong>of</strong> bycatch is very difficultand costly. Determining its effects on fish populations when combined with poor water quality,high natural mortality among juvenile shrimp, natural population fluctuations, weather events,and many other factors is even harder. Thus far, the DMF’s limited resources have beendevoted to research on bycatch reduction devices (BRD’s) that work and meet the requirements<strong>of</strong> the SAFMC. Characterizing the composition and amount <strong>of</strong> bycatch and discards has notbeen a priority. The prevention <strong>of</strong> catching it in the first place has been NC’s goal.7
4.5 EXISTING PLANS STATUTES, AND RULES4.5.1 PlansThere are currently no state or interstate <strong>FMP</strong>s that apply specifically to the shrimpfishery in North Carolina. There is a South Atlantic Fishery Management Council (SAFMC)<strong>Shrimp</strong> Fishery Management Plan and Amendments that have, until now, not been an issue thataffects NC fishermen. In December 2003, as part <strong>of</strong> Amendment 6, the Council voted toestablish a control date <strong>of</strong> December 10, 2003 for the shrimp fishery in the Atlantic ExclusiveEconomic Zone (EEZ). This control date was set to place the industry on notice that a limitedaccess program may be developed. The amendment also includes options to monitor andmeasure bycatch within the fishery. The Council’s preferred monitoring option is theimplementation <strong>of</strong> the Atlantic Cooperative Statistics Program Release, Discard and ProtectedSpecies Module. This module establishes a minimum set <strong>of</strong> standard data to be collected tocharacterize and estimate levels <strong>of</strong> bycatch. This is the first North Carolina <strong>Shrimp</strong> <strong>FMP</strong>. The<strong>FMP</strong> will be reviewed and updated at least every five years.4.5.2 StatutesAll management authority for North Carolina’s shrimp fishery is vested in the State <strong>of</strong>North Carolina. Statutes that have been applied to the shrimp fishery include:‚ It is unlawful to fish in the ocean from vessels or with a net within 750 feet <strong>of</strong> a properlylicensed and marked fishing pier. G.S. 113-185‚ It is unlawful to engage in trash or scrap fishing (the taking <strong>of</strong> young <strong>of</strong> edible fish beforethey are <strong>of</strong> sufficient size to be <strong>of</strong> value as individual food fish) for commercialdisposition as bait, for sale to any dehydrating or nonfood processing plant, or for sale orcommercial disposition in any manner. The MFC’s rules may authorize the disposition <strong>of</strong>the young <strong>of</strong> edible fish taken in connection with the legitimate commercial fishingoperations, provided it is a limited quantity and does not encourage “scrap fishing”. G.S.113-185‚ It is unlawful to willfully take, disturb or destroy any sea turtles including green,hawksbill, loggerhead, Kemp’s ridley, and leatherback turtles, or their nests or eggs. Itshall be unlawful willfully to harm or destroy porpoises. G.S. 113-189‚ It is unlawful for any person without the authority <strong>of</strong> the owner <strong>of</strong> the equipment to takefish from nets, traps, pots, and other devices to catch fish which have been lawfullyplaced in the open waters <strong>of</strong> the State. G.S. 113-268 (a)‚ It is unlawful for any vessel in the navigable waters <strong>of</strong> the State to willfully, wantonly, andunnecessarily do injury to any seine, net or pot. G.S. 113-268 (b)‚ It is unlawful for any person to willfully destroy or injure any buoys, markers, stakes,nets, pots, or other devices or property lawfully set out in the open waters <strong>of</strong> the state inconnection with any fishing or fishery. G.S. 113-268 (c)4.5.3 <strong>Marine</strong> <strong>Fisheries</strong> Commission RulesDefinitions: Several <strong>of</strong> the definitions in the North Carolina <strong>Fisheries</strong> Rules for Coastal Watershave a bearing on the <strong>Shrimp</strong> <strong>FMP</strong>. Mesh length is defined as the diagonal distance from theinside <strong>of</strong> one knot to the outside <strong>of</strong> the other knot, when the net is stretched hand-tight. Apound net set is a fish trap consisting <strong>of</strong> a holding pen, one or more enclosures, lead or leaders,and stakes or anchors used to support such trap. The leads(s), enclosures, and holding penare not conical, nor are they supported by hoops or frames. 15A NCAC 3I .0101 (b) (3) and8
(29).Endangered or Threatened Species: The <strong>Fisheries</strong> Director may close any area or restrictthe harvest <strong>of</strong> anything by proclamation if the methods involved in taking threaten endangeredor threatened species. No commercial fishing equipment can be used in the sea turtlesanctuary <strong>of</strong>f Onslow County. 15A NCAC 3I .0107 (b) and (c).Recreational Harvest: One <strong>of</strong> the commercial fishing gears authorized for use under theRCGL is a shrimp trawl with a headrope length <strong>of</strong> 26 feet or less. One <strong>of</strong> these can be used pervessel and mechanical means (hand winches and block and tackle) for pulling the trawl incannot be used. <strong>Shrimp</strong> trawls for recreational purposes must be marked by attaching to thecodend (tailbag), one floating buoy, any shade <strong>of</strong> hot pink in color, made <strong>of</strong> solid foam or othersolid buoyant material and be no less than 5 inches in diameter and length. The buoy must beidentified by being engraved with the owner’s last name and initials or have that identificationengraved on metal or plastic tags. If a vessel is used, the buoy must also be engraved with thegear owner’s current motorboat registration number or owner’s U.S. vessel documentationname. The RCGL allows the use <strong>of</strong> up to five eel, fish, shrimp or crab pots, in any combination.It is unlawful for a person to use more than one shrimp pot attached to the shore along privatelyowned land or to a privately owned pier without possessing a valid RCGL. Buoys must be anyshade <strong>of</strong> hot pink in color, be no less than 5 inches in diameter and length, and be engravedwith the owner’s last name and initials. If a vessel is used the buoy must also be engraved withthe gear owner’s current motor boat registration number or owner’s U.S. vessel documentationname. Crab trawls are not permitted to be used by holders <strong>of</strong> the RCGL. 15A NCAC 3J .0302,and 15A NCAC 3O .0302 (a) (2).Trawls:‚ The Brant Island and Piney Island military prohibited areas are closed to fishing andnavigation at all times. 15A NCAC 3I .0110 (a) and 3R .0102‚ It is unlawful to use trawl nets for the taking <strong>of</strong> finfish in internal waters, except that itshall be permissible to take or possess finfish incidental to crab or shrimp trawling inaccordance with the following limitations: it is unlawful to possess more than 500 pounds<strong>of</strong> finfish from December 1 through February 28 and 1,000 pounds <strong>of</strong> finfish from March1 through November 30. The Director may close by proclamation any area to trawlingfor specific time periods in order to secure compliance with this rule. 15A NCAC 3J.0104 (a)‚ It is unlawful to use trawl nets in internal coastal waters from 9:00 p.m. on Friday through5:00 p.m. on Sunday except for the areas described in the next bullet. 15A NCAC 3J.0104 (b) (1)‚ It is unlawful to use trawl nets from December 1 through February 28 from one hour aftersunset to one hour before sunrise in portions <strong>of</strong> the Pungo, Pamlico, Bay, Neuse, andNew rivers. 15A NCAC 3J .0104 (b) (5) (A) (B) (C) (D) (E).‚ It is unlawful to use trawl nets in Albemarle Sound and its tributaries. 15A NCAC 3J.0104 (b) (3)‚ Trawls cannot be used to take oysters. 15A NCAC 3J.0104 (2)‚ The Director may by proclamation, require bycatch reduction devices or codendmodifications in trawl nets to reduce the catch <strong>of</strong> finfish that do not meet size limits orare unmarketable as individual foodfish by reason <strong>of</strong> size. 15A NCAC 3J .0104 (d)‚ It is unlawful to use shrimp trawls for the taking <strong>of</strong> blue crabs in internal waters, exceptthat it shall be permissible to take or possess blue crabs incidental to commercial shrimptrawling provided that the weight <strong>of</strong> the crabs shall not exceed 50 percent <strong>of</strong> the totalweight <strong>of</strong> the combined crab and shrimp catch; or 300 pounds, whichever is greater. For9
RCGL trawling, 50 crabs, not to exceed 100 blue crabs if two or more RCGL holders areon board. The <strong>Fisheries</strong> Director may, by proclamation, close any area to trawling forspecific time periods in order to secure compliance with this rule. 15A NCAC 3J .0104(f) and (g)‚ It is unlawful to use nets from June 15 through August 15 in the waters <strong>of</strong> MasonboroInlet or in the ocean within 300 yards <strong>of</strong> the beach between Masonboro Inlet and a linerunning 138° through the water tank on the northern end <strong>of</strong> Wrightsville Beach, adistance parallel with the beach <strong>of</strong> 4,400 yards. It is unlawful to use trawls withinone-half mile <strong>of</strong> the beach between the Virginia line and Oregon Inlet. 15A NCAC 3J.0202 (1) (2)‚ From December 1 through March 31 it is unlawful to possess finfish caught incidental toshrimp and crab trawling in the Atlantic Ocean unless the weight <strong>of</strong> the combined catch<strong>of</strong> shrimp and crabs exceeds the weight <strong>of</strong> finfish; except that crab trawlers workingsouth <strong>of</strong> Bogue Inlet may keep up to 300 pounds <strong>of</strong> kingfish, regardless <strong>of</strong> their shrimpor crab catch weight. 15A NCAC 3J .0202 (5) (a) (b)‚ It is unlawful to use trawl nets upstream <strong>of</strong> the Highway 172 Bridge in New River from9:00 p.m. through 5:00 a.m. when opened by proclamation from August 15 throughNovember 30. 15A NCAC 3J .0208‚ In Dare County commercial fishing gear may not be used within 750 feet <strong>of</strong> licensedfishing piers when opened to the public. Commercial fishing gear may not be used inthe Atlantic Ocean <strong>of</strong>f <strong>of</strong> portions <strong>of</strong> Onslow, Pender, and New Hanover counties duringspecified time frames. 15A NCAC 3J .0402 (a) (1) (A) (ii) (2) (A) (B) (i) (ii) (3) (A) (B) (i)(ii) (iii)‚ It is unlawful to take or possess crabs aboard a vessel taken by trawl in internal watersexcept in areas and during such times as the <strong>Fisheries</strong> Director may specify byproclamation. 15A NCAC 3L .0202 (a)‚ It is unlawful to use a trawl net in any primary or permanent secondary nursery area.15A NCAC 3N .0104, 3N .0105 (a), 3R .0103 and 3R .0104‚ Special secondary nursery areas may be opened to shrimp and crab trawling fromAugust 16 through May 14. 15A NCAC 3N .0105 (b), and 3R .0105Channel Nets:‚ It is unlawful to use a channel net until the Director specifies by proclamation when andwhere channel nets and other fixed nets for shrimping can be used. 15A NCAC 3J.0106 (a)(1).‚ It is unlawful to set a channel net without yellow light reflective tape on the staffs, stakesand buoys. 15A NCAC 3J .0106 (a)(2).‚ Channel nets can not be set with any portion <strong>of</strong> the set within 50 feet <strong>of</strong> the center line <strong>of</strong>the Intracostal Waterway (ICW) channel or in the middle third <strong>of</strong> any navigation channelmarked by the Corps <strong>of</strong> Engineers or the Coast Guard. Fishermen must attend channelnets by being no more than 50 yards from the set at all times. 15A NCAC 3J .0106(a)(3), (4) and (5).‚ The maximum corkline length <strong>of</strong> a channel net that can be used or possessed is 40yards. No channel net, net buoys or stakes can be left in coastal waters from December1 through March 1. From March 2 through November 30, cables and any attached buoymust be connected together with non-metal line when not attached to the net. Metallicfloats or buoys to mark sets are unlawful. 15A NCAC .0106 (b) (c) (d) and (e).‚ Channel nets must be properly marked with yellow light reflective tape and the owner’sidentification on each buoy. Identification includes one <strong>of</strong> the following: owner’s NCmotorboat registration number or the US vessel documentation number or owner’s lastname and initials. Channel nets, anchor lines or buoys are not to be used in any way10
that constitutes a hazard to navigation. 15A NCAC .0106 (f) and (g).Pound Net Sets: <strong>Shrimp</strong> pound net set initial applications, renewals and transfers are tocomply with the permitting procedures and requirements for obtaining all DMF-issued permits.Identification requirements, application process, criteria for the granting <strong>of</strong> the permit,operational requirements and other elements <strong>of</strong> the shrimp pound net set permits are found in15A NCAC 3J .0107. A permittee must hold a valid SCFL or RSCFL in order to hold a PoundNet Set Permit. 3O .0501(b)(1)<strong>Shrimp</strong>-specific Rules: The Director has proclamation authority to open the state’s waters tothe taking <strong>of</strong> shrimp. This authority includes hours <strong>of</strong> harvest and any other conditionsappropriate to management <strong>of</strong> the fishery. If sampling indicates that undersized shrimp or otherspecies are present, the Director may close waters to shrimping and prohibit the use <strong>of</strong> any netsbut cast nets. In closing waters, prominent landmarks or other permanent type markers shouldbe considered. 15A NCAC 3L .0101The taking <strong>of</strong> shrimp by any method is prohibited from 9:00 p.m. on Friday through 5:00 p.m. onSunday except in the Atlantic Ocean, and with the use <strong>of</strong> fixed and channel nets, hand seines,shrimp pots, and cast nets. 15A NCAC 3L .0102Trawl nets must have a minimum mesh size <strong>of</strong> 1 ½ inches; fixed nets, channel nets, float netsand hand seines must be at least 1 ¼ inches; cast nets have no minimum mesh size. <strong>Shrimp</strong>cannot be taken with a net constructed in such a manner as to contain an inner or outer liner <strong>of</strong>any mesh size. Chafing gear shall be no less than 4 inches mesh length, except small meshedchafing gear can be used only on the bottom one-half <strong>of</strong> the tailbag as long as it is not tied t<strong>of</strong>orm another tailbag. 15A NCAC 3L .0103Channel nets cannot take shrimp unless they are in compliance with 3J .0106. <strong>Shrimp</strong> potsmust be used in compliance with 3J .0301. There is a limit <strong>of</strong> 100 shrimp per person per daytaken with a cast net in closed area. 15A NCAC 3L .0104It is unlawful to use pots with leads or leaders to take shrimp. Leads or leaders for this purposeare defined as any fixed or stationary net or device used to direct fish into any gear used tocapture fish. Any device with leads or leaders used to capture fish is not a pot. 3J .0301 (l)No Trawling Areas: Trawl nets cannot be used in any <strong>of</strong> the Primary Nursery Areas describedin 15A NCAC 3R .0103 or in any <strong>of</strong> the Secondary Nursery Areas described in 15A NCAC 3R.0104. Trawl nets can not be used in any Special Secondary Nursery Area designated in 15ANCAC 3R .0105 except that the Director may open any <strong>of</strong> the Special Secondary Nursery Areasto shrimp or crab trawling from August 16 through May 14 subject to the provisions <strong>of</strong> 15ANCAC 3L .0100 and .0200. Trawl nets are also prohibited in the Trawl Nets Prohibited areasdescribed in 15A NCAC 3R .0106. 15A NCAC 3N .0104 and .0105 and 3R .0104, .0105 and.0106.4.5.4 Other States <strong>Shrimp</strong> Rules and RegulationsSee Appendix 1 for a list <strong>of</strong> rules and regulations for other shrimp producing states.4.5.5 Federal RegulationsPursuant to Title 33 United States Code Section 3, the United States Army Corps <strong>of</strong>Engineers has adopted regulations which restrict access to and activities within certain areas <strong>of</strong>11
coastal and inland fishing waters. Federal Rules codified at 33 CFR 334.410 through 334.450designate prohibited and restricted military areas, including locations within North Carolinacoastal fishing waters, and specify activities allowed in these areas.12
5. STATUS OF STOCK5.1 GENERAL LIFE HISTORYThere are three shrimp species that make up the shrimp fishery in North Carolina.These are the brown shrimp, Farfantepenaeus aztecus, the pink shrimp, F. duorarum and thewhite shrimp, Litopenaeus setiferus. The lifecycle <strong>of</strong> these three species are similar in that theadults spawn <strong>of</strong>fshore and eggs are hatched into free-swimming larvae. These larvae developthrough several stages into post-larvae. Once post-larval shrimp enter the estuaries growth israpid and is dependent on salinities and temperatures. After reaching sub-adult sizes between70 - 120 mm TL, they migrate seaward. It is hypothesized that as shrimp increase in size, theyseek higher more stable salinities because <strong>of</strong> a decrease in the ability to osmoregulate (Bishopet al. 1980). In general, shrimp are omnivorous, feeding primarily on sediment, detritus, algae,and benthic organisms. Feeding occurs mostly at night, although some daytime feeding willoccur in turbid water. <strong>Shrimp</strong> are dioecious (separate sexes) with females growing larger thanmales. <strong>Shrimp</strong> copulate with the male depositing spermatophore onto the female’s thelycom.Fertilization takes place when the female expels ova and spermatozoa simultaneously. <strong>Shrimp</strong>are very fecund with females expelling between 500,000 to 1,000,000 eggs. Spawning occursbefore they reach 12 months old. Environmental requirements for the three species are listed inTable 5.1.Brown shrimp:Brown shrimp occur from Massachusetts to the Florida Keys and into the Gulf <strong>of</strong> Mexicoto northwestern Yucatan. Highest abundances occur in the Gulf <strong>of</strong> Mexico, <strong>of</strong>f Mississippi,Louisiana, and Texas. The species supports a major commercial fishery along the SouthAtlantic coast, primarily in North and South Carolina.Brown shrimp reach sexual maturity at 140-145 mm and spawn in the ocean in deepwater during February and March. Larvae are then transported by wind and currents from thehigh salinity ocean waters in the estuaries. Ten to 17 days later, the larval shrimp have growninto postlarvae and are approximately between 8-14mm. They generally enter on a flood tide.They are then carried by wind driven currents to the upper reaches <strong>of</strong> the estuaries beginning inFebruary with peaks occurring in mid-March through mid-April (Williams 1955a, 1965). It takesapproximately 4-6 weeks for postlarvae to grow to the juvenile stage. Rapid development intosub-adults begins to occur with reported growth rates ranging from 1-2.5 mm per day and isdependent on temperature and salinities (Williams 1955; Steele 2002). Significant growthoccurs between 11 O C and 18 O C (Zein-Eldin and Aldrich 1965; Steele 2002). Growth isenhanced if salinities are greater than 10 ppt (Amant et al. 1966; Steele 2002). As theindividuals increase in size, they move to the deeper, saltier waters <strong>of</strong> the sound and return tothe sea in late fall. Brown shrimp are omnivorous, and feed on different plants and animals andorganic debris (Steele 2002). Juveniles between 25-65 mm feed on detritus andmicroorganisms from the top layer <strong>of</strong> sediment while larger shrimp (65-104 mm) became activepredators feeding on polychaetes, amphipods, nematodes as well as detritus and algae (Jones1973; Steele 2002). Brown shrimp prefer peat and muddy bottoms but are also found on sand,silt, or clay mixed with shell and rock fragments (Steele 2002). They also are found on bottomscovered with plant debris (Williams 1959). They are <strong>of</strong>ten more active in open waters at nightthan in daytime. They have a maximum life span <strong>of</strong> 18 months, although few live this long.13
Pink shrimp:Pink shrimp are found from southern Chesapeake Bay to the Florida Keys, and aroundthe coast through the Gulf <strong>of</strong> Mexico to Yucatan. The largest population <strong>of</strong> pink shrimp is <strong>of</strong>fsouthwestern Florida in the Tortugas and Sanibel as well as in the southeastern portion <strong>of</strong> Golfode Campeche. However, significant quantities <strong>of</strong> pink shrimp are also found <strong>of</strong>f North Carolina,and along the northeast Florida coast (Steele 2002).Spawning occurs in ocean waters from April through July with postlarvae being carriedinto the estuary on wind-driven currents from May through November (Williams 1965). Thenorthernmost breeding population <strong>of</strong> pink shrimp is <strong>of</strong>f North Carolina (Williams 1955a). Oncein the nursery areas, the shrimp undergo rapid growth (1 to 1.8 mm/day). As they grow anddevelop, they move toward the deeper waters <strong>of</strong> the sound and eventually into the ocean. Pinkshrimp are active at night and burrow into the bottom during the day. A significant number <strong>of</strong>pink shrimp overwinter in the North Carolina estuaries before moving into the ocean thefollowing spring. Pink shrimp are bottom feeders and feed primarily in shallow waters amongmarine plants. As with brown shrimp, the majority <strong>of</strong> feeding occurs at night, but feeding mayalso occur during the day when the water is turbid. Stomach content analysis <strong>of</strong> shrimp inTampa Bay revealed sand, debris, algae, diatoms, seagrass particles, din<strong>of</strong>lagellates,foraminiferans, nematodes, polychaetes, ostracods, copepods, mysids, isopods, carideanshrimp, caridean eggs, mollusks and fish scales. Female pink shrimp reach sexual maturity at85 mm while males are sexually mature at 74 mm. They have a maximum life span <strong>of</strong> 24months and can reach a size <strong>of</strong> 10-11 in.White <strong>Shrimp</strong>:White shrimp occur along the Atlantic coast from Fire Island, New York to Saint LucieInlet Florida (Steele 2002). They also are found in the Gulf <strong>of</strong> Mexico from the mouth <strong>of</strong> theOchlockonee River, Florida to the Golfo de Campeche to the vicinity <strong>of</strong> Ciudad Campechusually in depths less than 90 ft. (Muncy 1984; Steele 2002).Spawning occurs in the ocean at depths greater than 30 ft and within five miles <strong>of</strong> shorefrom March to November, peaking from April to October. It appears to be triggered byincreasing bottom water temperatures in the spring and decreases with decreasing watertemperature in the fall (Muncy 1984). Planktonic postlarvae move inshore with tidal currents,entering estuaries two to three weeks after hatching where they then become benthic. Shallowmuddy bottoms in waters <strong>of</strong> low to moderate salinity serve as optimum nursery grounds forjuvenile white shrimp. Juveniles reach lengths <strong>of</strong> about 2-3.1 cm by June or July, and movefrom shallow marshes into deeper creeks, rivers, and bays. White shrimp migrate out <strong>of</strong> theestuaries and southward during fall and early winter, and make up the valuable spring fishery foradult females in Georgia, South Carolina, and southern North Carolina. Some <strong>of</strong> the slowergrowingindividuals overwinter in the estuaries, but usually do not survive in North Carolina.White shrimp mortality has been reported at water temperatures <strong>of</strong> 46 o F and lower, with totalmortality occurring at 37 o F or lower. Winter water temperatures in North Carolina sometimesare lethal for white shrimp. White shrimp are omnivorous, selective particulate feeders thatsearch the sand grains and pass bits <strong>of</strong> food forward to the mouth. Gut content analysisfindings include inorganic and organic debris, as well as fragments <strong>of</strong> different animals includingnematodes, annelids, mollusks and crustaceans, particles <strong>of</strong> higher plants and a variety <strong>of</strong>diatoms and algae (Steele 2002). S<strong>of</strong>t muddy bottoms are the preferred habitat <strong>of</strong> white shrimpwith highest abundances in areas <strong>of</strong> extensive brackish marshes14
Table 5.1.Environmental Requirements <strong>of</strong> three shrimp species found in North Carolina.Species Salinity Temperature Oxygen Recruit SeasonBrown<strong>Shrimp</strong> 2-35 ppt7 o to 37 o C (44.6 oto 98.6 o F)Less than 2 ppmcauses stressFeb-MarchSummer andfallPink <strong>Shrimp</strong> 0-45 ppt6 o to 38 o C (42.8 oto 100.4 o F) 0.2 to 6.0 ppmJune-October Spring7 o to 38 o C (44.6 o Less than 2 ppmLate SummerWhite <strong>Shrimp</strong> 2-35 ppt to 100.4 o F) causes stress April-May and fallMovement:DMF conducted several tagging studies on the three species <strong>of</strong> shrimp in the 1960sthrough the early 1970s (Table 2). <strong>Shrimp</strong> were marked with biological stains and fluorescentpigments and released throughout this time period within different areas <strong>of</strong> Pamlico Sound,Core Sound, Bogue Sound, New River and Cape Fear River. These shrimp were recovered inshrimp houses throughout the coastal counties. Rewards ranged from .50 cents to $1.00 perreturned shrimp.McCoy and Brown (1967) marked brown and pink shrimp from Jarrett Bay and NorthRiver in Core Sound and white shrimp in Dutchman Creek-Elizabeth River and Cape Creek <strong>of</strong>the lower Cape Fear River. A combined average <strong>of</strong> 65% <strong>of</strong> all returned shrimp were recapturedbefore reaching the Atlantic ocean with resulting movement toward the higher salinity areas <strong>of</strong>Beaufort Inlet from Core Sound and Cape Fear Inlet from Cape Fear River.Table 5.2.Migration studies in North Carolina <strong>of</strong> three shrimp species found in North Carolina.Study Year Waterbodies SpeciesReleasenumberPercentreturnMcCoy andCore Sound Brown, Pink,Brown, 1967 April-Oct 1966 Lower Cape Fear White 26,989 6.2June-Sept,McCoy, 1968 1967 Pamlico Sound Brown, Pink 11,414 10.5May, July,1968Core and BogueSound, New River Brown, Pink 9,231 42.4McCoy, 1972Purvis andMcCoy, 1974 1971-1972 Pamlico Sound Brown 7,325 19.1White shrimp did move upriver in the Cape Fear River. However, this was caused bythe strong tidal influences in the river. Of those shrimp that made it to the Atlantic Ocean, allthree species had a pronounced southward coastal migration. It was concluded in this studythat the brown and pink shrimp are more endemic to North Carolina while the white shrimp fromthe southeastern coastal NC contribute to the shrimp fishery <strong>of</strong> South Carolina, Georgia, andFlorida.McCoy (1968) marked pink shrimp from West Bay that moved to the Atlantic Oceanthrough Core Sound and through Drum and Beaufort inlets. Pink shrimp from Adams Creekmoved toward Beaufort Inlet and through southern Pamlico Sound to Drum Inlet and BardensInlet. This suggests that a significant portion <strong>of</strong> Pamlico Sound pink shrimp reach the oceanthrough Beaufort and Bardens inlets by migrating through Core Sound.15
Brown shrimp marked by McCoy (1968) in Swan Quarter Bay and Jones Bay generallymoved toward the central and southern Pamlico Sound area. Data were unclear as to the mostprobable route to the Atlantic Ocean but it did suggest that few shrimp from the northern andwestern sound reached the ocean. Brown shrimp randomly released in Pamlico Sound in 1972generally moved toward the nearest inlet (Ocracoke). However, no mass migration from thesound to the ocean occurred to any appreciable degree resulting in the conclusion that thePamlico Sound brown shrimp fishery is a self contained fishery with shrimp growing to largesizes (16 - 30 count heads <strong>of</strong>f) before migrating to the ocean (Purvis and McCoy 1972).Pink shrimp marked in Core Sound moved to the ocean through Barden and Beaufortinlets with the majority <strong>of</strong> the movement through Beaufort Inlet. Bogue Sound pink shrimpmoved toward the ocean via Beaufort and Bogue inlets with the largest number <strong>of</strong> recapturesoccurring from the western half <strong>of</strong> the sound. There appeared to be no significant movement <strong>of</strong>pink shrimp between Core and Bogue Sound. Brown shrimp released in New River moved in asoutherly direction along the coast (McCoy 1972).5.2 STOCK STATUSAll three species <strong>of</strong> shrimp included in this Fishery Management Plan (<strong>FMP</strong>) areessentially annual crops. Population size is regulated by environmental conditions, and whilefishing reduces the population size over the season, fishing is not believed to have any impacton subsequent year class strength unless the spawning stock has been reduced below aminimum threshold level by environmental conditions. Estimates <strong>of</strong> population size are notavailable but since the fishery is considered to be fished at near maximum levels, annuallandings are probably a good indication <strong>of</strong> relative abundance. Annual variations in catch arepresumed to be due to a combination <strong>of</strong> prevailing environmental conditions and fishing effort.More recently, landings are showing the effects <strong>of</strong> changes in the economics <strong>of</strong> the fishery.Because <strong>of</strong> high fecundity and migratory behavior, the three species are all capable <strong>of</strong>rebounding from a very low population size in one year to a large population size in the next,provided environmental conditions are favorable. Fluctuations in abundance resulting fromchanges in environmental conditions will continue to occur. Perhaps the most serious threat tothe stocks is loss <strong>of</strong> habitat due to pollution or physical alteration. Especially vulnerable andcritical to shrimp production is the salt marsh (for white and brown shrimp) and inshoreseagrass habitat (especially for pink shrimp) which comprise the nursery areas for juvenileshrimp. <strong>Shrimp</strong> stocks <strong>of</strong> all three species in North Carolina are considered viable.16
6. STATUS OF FISHERIES6.1 COMMERCIAL6.1.1 HistoryBetween the Civil War and the end <strong>of</strong> the first decade <strong>of</strong> the twentieth century, shrimpwere caught with dip nets, cast nets and seines. Most were consumed locally but some wereused as bait and fertilizer. Distant markets were limited by little interest in shrimp for food,production capability, few transportation options, and the lack <strong>of</strong> refrigeration (Maiolo 2004;Maiolo et al. 1980).Just after the turn <strong>of</strong> the twentieth century, the South Atlantic and Gulf states becamethe center <strong>of</strong> the commercial shrimp fishery in the United States. Interest in the fisherydeveloped rapidly in the Southport, NC area. The adoption <strong>of</strong> the otter trawl completelychanged the means <strong>of</strong> harvesting, which fit nicely with the earlier innovations in power boatingat the end <strong>of</strong> the previous century and market stimulation from the New York area. The creation<strong>of</strong> canning factories in Southport followed (Maiolo 2004; Maiolo et al. 1980).The introduction <strong>of</strong> the otter trawl technology in North Carolina seems to have firstinvolved sampling nets used by the U.S Bureau <strong>of</strong> <strong>Fisheries</strong> in Beaufort in 1912. Even with thisnew and efficient capture technology, interest in the fishery was not uniform among coastalfishing villages. As late as the 1920s many fishermen still referred to shrimp as pests thatfouled their nets and many residents, both coastal and inland, did not consider the animalssuitable to eat.In March <strong>of</strong> 1916, a New Jersey fisherman brought a shrimp trawler to Southport andtaught local fishermen how to use the otter trawl in the near shore ocean waters. Interestamong fishermen expanded quickly in spite <strong>of</strong> a sluggish local market. By 1925, over 300 NorthCarolina fishermen were engaged in the shrimp fishery, mostly in Brunswick County.The use <strong>of</strong> the otter trawl net technology prompted the development <strong>of</strong> trawl vessels.The type that was first used in the fishery involved open skiffs from 15-20 ft in length that werepowered by small gasoline engines. “Decked” trawlers were introduced in the 1920s.Refrigeration (in the form <strong>of</strong> production <strong>of</strong> ice for shipment <strong>of</strong> fishery products), rail and trucktransportation, and a close proximity to the eastern markets (as opposed to Florida and the Gulfstates) began to make the North Carolina shrimp fishery lucrative. More than two hundredseasonal and part time workers found employment in the Southport packinghouses where manyheaded shrimp for a nickel per five gallon bucket. The majority <strong>of</strong> shrimp were shipped tomarkets in northeastern New York because local markets were still not developed (Maiolo 2004;Maiolo et al. 1980).The first shrimp trawling in Carteret County occurred around 1930 after local fishermenlearned how to harvest the resource from the Southport fishermen. At first shrimping onlyoccurred in between finfishing seasons. At the same time, a channel net fishery wasdeveloping near Harkers Island and in other communities in eastern Carteret County. A series<strong>of</strong> local customs developed among the fishermen by which the fishery was prosecuted. Manyremain in place even today. A similar fishery has recently developed near Sneed’s Ferry, butwithout the same kinds <strong>of</strong> local customs (Maiolo 2004).17
Pamlico County fishermen began landing shrimp caught in pound nets about this time aswell, and shrimp trawling caught on in northern Pamlico Sound in the late 1930s when aLouisiana fisherman demonstrated the use <strong>of</strong> the otter trawl. <strong>Shrimp</strong>ing in the northern countieswas conducted both nearshore and in the Pamlico Sound. In 1934, the Sound was closed totrawling to prevent finfish bycatch. But the following year the regulation was modified to allowshrimp trawling from 15 August to 1 December (Maiolo et al. 1980; and Maiolo 2004).Like fishermen in other coastal communities in North Carolina who stitched shrimpharvesting into their patterns <strong>of</strong> annual rounds, fishermen in the northern part <strong>of</strong> the statepursued shrimping during the summer between oyster dredging and fall finfishing. Just astoday, in the southern part <strong>of</strong> the state, some fishermen followed the shrimp south into SouthCarolina and Georgia in late summer and into fall (Maiolo 2004; Maiolo et al. 1980).As the fishery expanded during the 1930s, the construction <strong>of</strong> larger vessels specificallydesigned for shrimp trawling expanded. Two <strong>of</strong> the most common vessels were the “Floridatrawler” for ocean trawling in the southern part <strong>of</strong> the state, and the “Core Sounder” for estuarinetrawling. Along with this, masts and booms, or masts and “A” frames, were developed.Additionally, power winches replaced retrieval <strong>of</strong> the nets by hand. The construction <strong>of</strong> trawlsand doors locally which, up to then had occurred in Florida and Louisiana, began during thisperiod (Maiolo 2004, and Maiolo et al 1980).Difficulties in organizing production and distribution capacity, along with the failure toexpand markets into the interior <strong>of</strong> the state, resulted in inconsistencies in the demand for NorthCarolina shrimp prior to the outbreak <strong>of</strong> World War II. Additionally, poor ex-vessel priceshampered development <strong>of</strong> the state’s fishery. The War created a jolt in the popularity <strong>of</strong> theshrimp with consumers, because, unlike meat products, seafood was not rationed. There werestill problems in the industry. The supply <strong>of</strong> seafood products, including shrimp decreasedbecause <strong>of</strong> the war effort. There were fewer fishermen, boats, and equipment, until about 1944when restrictions on strategic materials were eased. Also during this period trawling wasrestricted to inside waters because <strong>of</strong> the threat <strong>of</strong> German submarine attacks outside <strong>of</strong> theinlets. One result <strong>of</strong> this was increased effort in Pamlico Sound (Maiolo 2004).Quick freezing technology was developed during the war years as well. <strong>Shrimp</strong> was nolonger a perishable product, but a relatively stable commodity that the producer could control byfreezing and holding for better prices when the market changed. However, this seems to havehad a limited effect on North Carolina harvesting and distribution. Frozen shrimp from otherregions had an impact on the markets, but most <strong>of</strong> North Carolina’s product was still shippedfresh to Northern markets (Maiolo 2004).When the war concluded, and a recovering economy was redirected toward domesticmatters, the fishing industry benefited along with the rest <strong>of</strong> the nation. There was a boom inconstruction <strong>of</strong> diesel-powered, large trawlers, and a considerable increase in shrimping effort.Prices increased dramatically, and North Carolina’s contribution to the Southeast shrimplandings became significant. Vessels were equipped with radar, fathometers, radios, steelcables and drum hoists (Maiolo 2004; and Maiolo et al 1980).Technological advances in the shrimping industry have increased the catching efficiency<strong>of</strong> larger boats, particularly in Pamlico Sound. In the 1940s and early 1950s, a 45-60 ft vesselpulled a single trawl with a headrope length <strong>of</strong> 60-65 ft. Now, with “four-barreled rigs” the samevessel can pull four nets with a combined headrope length <strong>of</strong> 120-160 ft. Four-barreled rigsallow fishermen to pull two nets from each outrigger. Conventional two-seam otter trawls are18
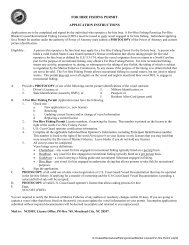
used for the bottom-hugging pink and brown shrimp, while four seam and tongue trawls withfloats on the headrope are used for the white shrimp which have the ability to jump over twoseamtrawls when disturbed. In Pamlico Sound, these large vessels stay out four or five daysand tow from one to three hours, <strong>of</strong>ten working day and night. Smaller vessels make daily tripsand employ shorter tow times. In the Core Sound area, the fishery occurs mainly at night, withtrips lasting one night. In the southern area, fishing is conducted on a day-trip basis, mostlyduring daylight hours.Modern safety and navigation equipment have allowed North Carolina shrimpers tosteam longer distances, for longer periods <strong>of</strong> time to shrimp; and also to engage in a constantlychanging variety <strong>of</strong> harvesting activities other than shrimping throughout the calendar year.This widely recognized diversity <strong>of</strong> fishing activity occurs all along the Atlantic coastline and inthe Gulf <strong>of</strong> Mexico. It is a continuation <strong>of</strong> adaptive strategies to changing resource opportunitiesand regulations as well as technology that dates back before the shrimp industry was born. Inthis respect, the history and development <strong>of</strong> harvesting activity in the shrimp industry may beseen as one more addition to the annual cycle <strong>of</strong> North Carolina’s commercial (and to someextent, recreational) fishermen (Maiolo 2004; Orbach and Johnson 1988).Small scale fishermen generally, and shrimpers specifically, historically have beenloathe to accept assistance from outside the community or to become active in organizationsthat promote their interests. In regard to assistance, it is anathema to their culture <strong>of</strong> selfrelianceand this was demonstrated just recently when <strong>of</strong>fered compensation for losses due toHurricane Floyd. In regard to the latter, beginning with attempts to shore up the harvestingsector with government sponsored cooperatives in the 1930s, and through the development <strong>of</strong>the North Carolina Fishermen’s Association in mid-century, either because <strong>of</strong> a distrust <strong>of</strong>organizational structures and/or the difficulty <strong>of</strong> participating in them because <strong>of</strong> time constraintsshrimpers have been reluctant to organize or unite (Maiolo 2004).6.1.2 Status12,000,00010,000,0008,000,000InshoreOceanPounds6,000,000Inshore average4,843,3654,000,0002,000,0000196219641966196819701972197419761978198019821984198619881990199219941996199820002002Figure 6.1. Annual shrimp landings (lbs) for North Carolina: 1962 – 2003.YearOcean average1,659,93519
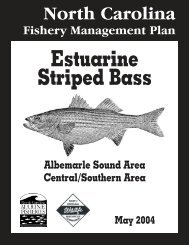
6.1.3 State Landings and EffortLandings in the North Carolina shrimp fishery vary from year to year and are dependentprimarily on environmental conditions (Figure 6.1 and Table 6.1). The annual average was6,503,301 lbs for the period 1962-2003; 74% were harvested from inshore waters and 26% fromthe Atlantic Ocean. This management plan will concentrate on landings from 1983-1993 andfrom the most recent ten year period, 1994-2003, to evaluate trends in the fishery. Theinformation from the earlier period will be used to illustrate historical trends while that from thelater period will demonstrate changes in the fishery, especially species composition. NorthCarolina instituted a trip ticket program in 1994 that has produced more accurate informationthan what was available prior to 1994. However, species composition was not recorded from1994-1998. Total landings from 1994-2003 have averaged 7,356,983 lbs per year (range 4.6-10.3 Mlb) caught on an average <strong>of</strong> 18,319 annual trips (range 14,102-23,886 trips). Thecontribution to the landings continues to be 75% for inshore waters and 25% for the AtlanticOcean.Pounds10,000,0009,000,0008,000,0007,000,0006,000,0005,000,0004,000,0003,000,0002,000,0001,000,0000Inshore landings Ocean landingsInshore trips Ocean trips1994 1995 1996 1997 1998 1999 2000 2001 2002 2003Year25,00020,00015,00010,0005,0000TripsFigure 6.2. Landings (lbs) and trips for 1994-2003.Annual effort for commercial shrimp trawls in North Carolina waterbodies is shown inTable 6.1 (DMF, unpub. data). About 78-86% <strong>of</strong> the shrimp trawl trips occur in estuarinewaters, with the remainder in ocean waters, primarily within state territorial seas (
from RCGL licenses is not included in the data shown in Table 6.1. In 2002 and 2003 5,373and 2,646, respectively, RCGL trips for shrimp were estimated (DMF, unpub. data).Regionally, shrimp trawl effort has generally been greatest in Core and Bogue soundsand associated estuaries [5,115-9,964 trips/year (Table 6.1)]. The Southern estuaries accountfor the second largest number <strong>of</strong> inside trawl trips per year, ranging from 3,095-4,814 trips/year.In ocean waters, shrimp trawling is highly concentrated in the southern portion <strong>of</strong> the state[Onslow through Brunswick counties (2,371-3,455 trips/year)], primarily in the summer (Table6.1). In contrast, the annual effort in the central district (Carteret County) has ranged from 130to 391 trips per year, and in the northern district (Virginia line through Hyde County) has rangedfrom 2 to 47 trips per year. Commercial shrimp trawl effort has remained relatively stable overtime in the southern ocean waters <strong>of</strong> the state.Table 6.1. Annual number <strong>of</strong> trips reported for shrimp trawls in inside and ocean waters 1 ,1994-2003 (DMF, unpub. data).Rivers and soundsOcean waters (< 3 miles)PercentinsidetripsPercentOceantripsAlbemarle Core/Bouge PamlicoSouthernNorthern Central SouthernYear estuaries estuaries estuaries estuaries district district district Total1994 2 9,495 4,602 3,892 2 186 3,380 21,559 83.45% 16.55%1995 0 9,964 5,090 4,814 47 303 3,391 23,609 84.15% 15.85%1996 4 7,615 2,814 3,412 12 280 2,611 16,748 82.67% 17.33%1997 0 8,189 4,515 4,530 18 183 2,715 20,150 85.53% 14.47%1998 0 6,006 1,750 3,630 2 348 2,816 14,552 78.24% 21.76%1999 0 6,946 3,969 4,762 18 391 3,455 19,541 80.23% 19.77%2000 4 5,511 5,426 4,414 10 266 2,672 18,303 83.89% 16.11%2001 7 5,115 3,148 3,095 6 130 2,497 13,998 81.19% 18.81%2002 5 6,602 4,862 4,282 0 198 2,371 18,320 85.98% 14.02%2003 0 5,887 1,737 3,540 1 306 2,493 13,964 79.95% 20.05%Average 2 7,133 3,791 4,037 12 259 2,840 18,074 82.79% 17.21%1Albemarle Area: Albemarle Sound, Currituck sound, and all tributaries <strong>of</strong> Albemarle Sound.Pamlico Area: Pamlico, Croatan, and Roanoke sounds; Pamlico, Bay, Neuse, and Pungo rivers.Core/Bogue Area: Core and Bogue sounds; Newport, White Oak, and North rivers.Southern Area: Masonboro, Stump, and Topsail sounds; Cape Fear, New, Shallotte, andLockwood Folly rivers; ICW.Northern district ocean waters: Virginia line through Hyde County.Central district ocean waters: Carteret County.Southern district ocean waters: Onslow County to the South Carolina line.A trip may consist <strong>of</strong> multiple days in Pamlico Sound and the Atlantic Ocean.6.1.4 Landings by WaterbodyAn examination <strong>of</strong> harvest by waterbody for the most recent five year period shows that53% <strong>of</strong> the landings are from Pamlico Sound, 23% from the Atlantic Ocean and 8% from CoreSound (Table 6.2). No other water bodies contribute more than 4% to the state’s total landings.The totals for some water bodies have been combined for purposes <strong>of</strong> this discussion. Forexample, some <strong>of</strong> the water bodies in the southern part <strong>of</strong> the state where shrimp trawling is notallowed have been combined into the Inland Waterway; the shrimping activity took place in theWaterway that runs through the waterbody where the landings were recorded. It must also betaken into consideration that species composition was not noted on trip tickets for the years1994 – 1998.21
Table 6.2.Percent contribution <strong>of</strong> landings (1999 – 2003) by waterbody and species.Percent Percent Percent Percent PercentWaterbdybrown pink white unclassified totalPamlico Sound 67.22 27.96 24.78 60.50 53.15Ocean 16.13 11.61 40.97 15.99 22.87Core Sound 7.24 48.22 3.69 11.91 8.31New River 1.57 7.56 9.23 1.72 3.94Newport River 1.44 0.51 6.54 1.62 2.85Neuse River 2.14 1.38 0.61 3.68 1.88North River-Carteret 0.88 1.01 4.55 0.36 1.85Other 0.84 0.43 1.73 1.10 1.11Cape Fear River 0.02 0.02 2.76 0.97 0.90Inland Waterway 0.58 0.35 1.57 0.76 0.87White Oak River 0.14 0.02 2.78 0.10 0.86Bogue Sound 0.60 0.88 0.75 0.14 0.59Pamlico River 0.81 0.03 0.04 0.64 0.55Bay River 0.26 0.01 0.00 0.51 0.21Pungo River 0.12 0.00 0.00 0.00 0.076.1.5 Landings by GearThe vast majority <strong>of</strong> the shrimp harvest (93%) is taken by otter trawls however, there hasbeen a slight shift in the types <strong>of</strong> gear used to harvest shrimp in North Carolina in recent years(Figure 6.3). A type <strong>of</strong> trawl that has gained wide popularity in the central and southern areassince about 1991 is the skimmer trawl. This gear originated in the Gulf Coast states and is veryeffective at capturing white shrimp. Skimmers are modified wing nets sewn to an aluminum orsteel pipe frame. The bottom <strong>of</strong> each outside pipe has a skid that rides over the bottom. Thevessel can work in depths from two to fifteen feet and the tailbags can be hauled in more <strong>of</strong>tenwithout stopping to haul back. This increases the efficiency <strong>of</strong> the harvest and allows thebycatch to be released more frequently, thus reducing mortality. An increasing number <strong>of</strong>vessels in Carteret, Onslow, and Pender counties are switching from otter trawls to skimmers astheir efficiency on brown shrimp harvest is improved. Skimmer nets account for 2% <strong>of</strong> theaverage annual state landings.Channel nets are stationary nets that fish the surface and middle depths on an outgoingtide. They resemble a staked-out trawl anchored and staked to the bottom to keep it open. Thenets are set at night on an ebb tide across a channel or slough in the path <strong>of</strong> seaward- migratingshrimp. The mouth <strong>of</strong> the net is oriented toward the direction <strong>of</strong> the oncoming current. Thetailbag <strong>of</strong> the channel net is emptied into a skiff every 15 to 30 minutes. The net is retrievedfrom the water before the tide changes to prevent it from being turned inside out. The channelnet must be set near inlets where the current is strong and where shrimp have concentrated tomove out to sea. This activity is concentrated from Beaufort Inlet to Rich’s Inlet. Channel netsaccount for 2% <strong>of</strong> the average annual shrimp landings.22
Although not a significant contributor to shrimp landings, shrimp pound nets haverecently been developed and employed in the taking <strong>of</strong> primarily brown shrimp. <strong>Shrimp</strong> poundnets are trap nets with a V-shaped lead that directs a shrimp to a funnel connected to a boxshapedpound. One <strong>of</strong> the leads extends to the shoreline and the other extends out towards achannel or deeper water. <strong>Shrimp</strong> enter the nets at night and can swim back out <strong>of</strong> the netsduring the day, so the nets must be fished every day around dawn to prevent loss. Interest inthe use <strong>of</strong> shrimp pounds has increased since 2003 and issues raised are addressed in thisplan.Figure 6.3. Inshore shrimp landings by gear for North Carolina: 1972 – 2003.The cast net is another type <strong>of</strong> gear used to harvest shrimp. A few pink and brownshrimp are captured around the marshes and shallows during the summer with this circular netweighted around the perimeter that is thrown out over the shrimp. The weighted edges <strong>of</strong> thecast net sink to the bottom entrapping the shrimp, and they are pulled in to the catcher by a lineattached to the top <strong>of</strong> the net. The cast net is most successful on white shrimp in the fall asthey school in large concentrations and leave the creeks and tributaries and head for thesounds and, eventually, the ocean. Throwing from boats or bridges over creeks is productivewhen they are migrating.6.1.6 Landings by SpeciesThe North Carolina shrimp fishery harvests three species: brown, pink, and white. Dataon the species composition <strong>of</strong> the shrimp catch were not collected prior to 1983 or from 1994through 1998 so discussion <strong>of</strong> the contribution <strong>of</strong> each species to the total landings willconcentrate on the time periods 1983-1993 and 1999-2003. Historically (1983-1993) brownshrimp accounted for 62.7% <strong>of</strong> the state total, averaged 4.6 Mlb and annual totals ranged from1.1 Mlb in 1987 to 10.3 Mlb in 1985 (Figure 6.4). North Carolina brown shrimp commerciallandings have averaged 4.5 Mlb since 1999 (Figure 6.5). During this time, landings havefluctuated from a high <strong>of</strong> 6.5 Mlb in 2000 to a low <strong>of</strong> 1.7 Mlb in 1999. Environmental factors,principally temperature and salinity, have a major influence on the yearly harvest. Generally,84% <strong>of</strong> all brown shrimp landed are caught in estuarine waters with Pamlico Sound, CoreSound, New River, and Neuse River accounting for most <strong>of</strong> the harvest (Table 6.2). Over 95%<strong>of</strong> all brown shrimp landed are caught by shrimp trawls. Channel nets and skimmer trawls23
account for the remaining landings. South Atlantic commercial brown shrimp landings haveaveraged 8.5 Mlb since 1985. North Carolina is the largest producer <strong>of</strong> brown shrimp on theAtlantic Coast, accounting for 61% <strong>of</strong> the total. Pink shrimp have historically (1983-1993)accounted for about 28.8% <strong>of</strong> the shrimp landings. North Carolina commercial pink shrimplandings averaged 2.1 Mlb from 1983-1993 (Figure 6.4). Environmental factors especiallyseverity <strong>of</strong> winter temperatures, have a significant influence on the yearly harvest. However,since 1999, pink shrimp landings have averaged only 0.3 Mlb. despite a series <strong>of</strong> mild winters inthe late 1990’s and early 2000’s. Pink shrimp have accounted for 4% <strong>of</strong> the state’s harvestduring the last five years (Figure 6.5). The cause <strong>of</strong> this decrease is not known. The majority <strong>of</strong>pink shrimp landed are caught in estuarine waters (88%). There are two seasonally distinctfisheries one from late April through June, and the fall fishery that runs from September throughNovember. Core Sound accounts for 48% <strong>of</strong> the landings, followed by Pamlico Sound (27%),and the ocean [12% (Table 6.2)]. Over 87% <strong>of</strong> all pink shrimp landed are caught by shrimptrawls. Channel nets (10%) and skimmer trawls (2%) account for the remainder.Figure 6.4. North Carolina landings <strong>of</strong> shrimp by species 1983-1993.24
Figure 6.5. North Carolina landings <strong>of</strong> shrimp by species: 1994 – 2003.During the period 1983-1993, North Carolina commercial white shrimp landingsaveraged 0.6 Mlb heads-on (Figure 6.4). Landings fluctuated from a high <strong>of</strong> 1.7 Mlb in 1993 toa low <strong>of</strong> 44,666 pounds in 1985 (Figure 6.4). The landings increased significantly for the mostrecent five years to an average <strong>of</strong> 2.2 Mlb that was 28% <strong>of</strong> the state landings (Figure 6.5).These fluctuations are not unusual for a species so vulnerable to environmental conditions,especially low winter water temperatures. The percentage <strong>of</strong> the white shrimp catch taken inthe ocean is higher (41%) than the other two species, which reflects its greater abundance inthe southern part <strong>of</strong> the state where the majority <strong>of</strong> the ocean fishery occurs. Over 76% <strong>of</strong> whiteshrimp landed were caught in shrimp trawls. The other 24% were captured in channel nets(5%) or skimmer trawls (19%). On average, during 1978-90, 70% <strong>of</strong> all white shrimp werelanded in the southern coastal area (Onslow, Pender, New Hanover and Brunswick counties)and 26% in the central area (Pamlico and Carteret counties), and the remaining 4% were takenin the northern area. Since 1999 the majority <strong>of</strong> white shrimp have been harvested from theOcean (41%), Pamlico Sound (25%) and New River (9%) (Table 6.4) which reflects the effects<strong>of</strong> a series <strong>of</strong> mild winters that has allowed white shrimp populations to be abundant in thenorthern portion <strong>of</strong> the state.There are two seasonal fisheries for white shrimp in North Carolina. The spring fisherylasts from late April until June and the fall fishery that begins in late August and may lastthrough December. In the spring fishery, "roe" (female) white shrimp are caught by trawlersprimarily targeting the more abundant pink shrimp. The majority <strong>of</strong> white shrimp landed come25
from the fall fishery, where it is the target species in the southern coastal area and other areas ifthey are abundant.North Carolina's shrimp fishery is unusual in the southeast because all three species aretaken here and the majority <strong>of</strong> the effort, about 76%, is expended in internal waters. WhileGeorgia and Florida allow limited inside shrimping, the majority <strong>of</strong> their and South Carolina’sfisheries are conducted in the Atlantic Ocean and white shrimp comprise the most <strong>of</strong> theirharvest (Table 6.3). North Carolina’s landings for the period 1999-2002 were 32% <strong>of</strong> the totalfor the South Atlantic followed by South Carolina (26%), Georgia (23%) and Florida (19%).Table 6.3. <strong>Shrimp</strong> landings in pounds from the South Atlantic, 1999-2002.Area Brown <strong>Shrimp</strong> Pink <strong>Shrimp</strong> White <strong>Shrimp</strong> Grand TotalFlorida East Coast 1999 750,416 779,190 3,742,541 5,272,1472000 543,328 896,301 2,365,320 3,804,9492001 1,219,258 554,680 2,361,459 4,135,3972002 1,000,400 575,965 3,225,038 4,801,403Florida Total 3,513,402 2,806,136 11,694,358 18,013,896Georgia 1999 1,352,545 5,340,885 6,693,4302000 772,932 4,599,183 5,372,1152001 1,432,459 2,730,175 4,162,6342002 682,247 4,182,129 4,864,376Georgia Total 4,240,183 0 16,852,372 21,092,555North Carolina 1999 1,672,959 10,060 3,659,314 5,342,3332000 6,489,508 161,424 3,214,295 9,865,2272001 3,920,556 211,864 863,159 4,995,5792002 6,015,420 879,673 2,503,681 9,398,774North Carolina Total 18,098,443 1,263,021 10,240,449 29,601,913South Carolina 1999 2,018,660 8,744 5,949,805 7,977,2092000 1,428,585 1,880 4,608,530 6,038,9952001 2,327,931 1,462 2,095,295 4,424,6882002 1,480,591 904 3,700,097 5,181,592South Carolina Total 7,255,767 12,990 16,353,727 23,622,484Grand Total 33,107,795 4,082,147 55,140,906 92,330,8486.1.7 Regional SummaryThe shrimp fishery in the northern portion <strong>of</strong> the state is conducted in Pamlico, Croatan,and Roanoke sounds and Pamlico, Pungo, Bay and Neuse rivers. The otter trawl is thepredominant gear used in this portion <strong>of</strong> the state. Commercial activity occurs in all waters,while recreational activity usually occurs in the rivers and nearshore areas <strong>of</strong> the sounds.A variety <strong>of</strong> methods are used to catch shrimp in the central area including trawls,skimmers, channel nets, shrimp pounds, and cast nets. Trawls are used on all three species inboth the estuary and the ocean with two seam trawls used for brown and pink shrimp and fourseam and tongue trawls for white shrimp, which tend to swim higher in the water column andhave the ability to jump to the surface when disturbed. Most trawling in the central portion <strong>of</strong> thestate is conducted at night.In the southern portion <strong>of</strong> the state, the fishery is characterized by a large number <strong>of</strong>26
small boats fishing internal waters (primarily the Intracoastal Waterway, New and Cape Fearrivers) and larger craft fishing the Atlantic Ocean primarily <strong>of</strong>f New River, Carolina Beach, andBrunswick County. Many <strong>of</strong> the small boats are fished by individuals who shrimp part-time orfor personal consumption. Use <strong>of</strong> gears other than trawls has increased primarily in the areafrom New River to Rich's Inlet. Channel, float, and butterfly nets make use <strong>of</strong> tidal currents topush shrimp into the nets and <strong>of</strong>fer the advantages <strong>of</strong> less fuel consumption and less bycatchthan traditional shrimp trawls. Channel nets are fished extensively in the areas around NewRiver and Topsail inlets. To shrimp with a “float net”, fishermen attach large floats to the doorsand top lines <strong>of</strong> trawls to make the net fish up in the water column and are pulled slowly forwardto harvest shrimp that are migrating to the inlets at night. Butterfly nets utilize this same harveststrategy but are attached to a metal frame and are held stationary in the water column tocapture shrimp as the current carries them into the net. Skimmer trawls have become morepopular around New River and Topsail Sound. These alternative gears are employed very littlein areas south <strong>of</strong> Rich's Inlet, however tidal conditions seem favorable for their use. Cast netsand seines are also used to harvest shrimp primarily for recreational uses, personalconsumption, and to harvest live shrimp for the commercial bait fishery.6.2 RECREATIONALRecreational Fishery<strong>Shrimp</strong> are harvested recreationally throughout the state by otter trawls, seines, shrimppots and cast nets. No license is required to use cast nets and they are allowed in all areas.There is a 100 shrimp per person limit in those areas closed to other methods <strong>of</strong> shrimping.Otter trawls, seines, and shrimp pots require a Recreational Commercial Gear License(RCGL) for their use and can be used in areas open to those gears. The RCGL limits the size<strong>of</strong> the gear to a 26 foot head rope for trawls, a 100 foot seine and five shrimp pots.The DMF conducted surveys <strong>of</strong> RCGL holders in 2002 and 2003 concerning their use <strong>of</strong>this license. RCGL use <strong>of</strong> seine and shrimp pots is negligible [
NorthernPamlicoCentralSouthernFigure 6.6. Regions used to describe distribution <strong>of</strong> RCGLs.The amount <strong>of</strong> trips and landings relative to the four coastal regions were similar in 2002and 2003 (Figure 6.7). The Pamlico region had the highest proportion <strong>of</strong> landings andeffort/trips followed by the Southern region. Landings and effort showed little change in either <strong>of</strong>these areas between 2002 and 2003. In the Northern area, effort increased from 15 to 20% andlandings increased from 8 to 18%. Both effort and landings decreased between years in theCentral region, from 19 to 11% and 19 to 09% respectively.28
Figure 6.7. Distribution <strong>of</strong> shrimp trawl effort and landings in North Carolina.Acreages <strong>of</strong> estuarine waters where RCGL harvesting activities occur is different acrossthe Northern, Pamlico , Central, and Southern regions (Figure 6.8). The Southern area has only3% <strong>of</strong> the total waters but averaged 25.5% <strong>of</strong> the RCGL shrimp harvest in 2002-2003. ThePamlico area, with 56% <strong>of</strong> the acreage, had the highest shrimp harvest with an average <strong>of</strong>46.5% during 2002-03. The Central Area has 8% <strong>of</strong> the total acreage and averaged 15% <strong>of</strong> thelandings in 2002-03. The Northern area has the second highest acreage (33%) and the lowestaverage landings (13%) over 2002-03.29
Figure 6.8. Acreages <strong>of</strong> North Carolina coastal waters by region.The 2001 survey provided statistics that characterize the gear and effort generated byRCGL shrimp trawlers (Table 6.4). These statistics are based on data collected during 2002and 2003. These numbers reveal that the typical RCGL shrimper makes four trips a yearconsisting <strong>of</strong> 13 tows and most likely uses a trawl with a 22 foot headrope.Table 6.4.Yearly statistics on trips, tows and trawl headrope size for RCGL users.Minimum Maximum Mean Median RangeNumber <strong>of</strong> trips 1 20 4 3 1 to 8Number <strong>of</strong> tows 6 25 13 13 10 to 15Size <strong>of</strong> headrope 10 26 22 24 20 to 2530
7. ECONOMIC STATUS7.1 COMMERCIAL FISHERY7.1.1 Harvesting sector7.1.1.1 Ex-vessel value and priceDMF began collecting commercial value statistics in 1972. The trip ticket programbegan in 1994 and it was mandated that all commercial landings be reported to DMF.Reporting the value <strong>of</strong> the landing continues to remain optional. It is useful in economicanalyses to tie the value <strong>of</strong> annual landings back to an established baseline to control for theeffects <strong>of</strong> inflation. Changes in landings values from year to year since 1972 can be moreclearly understood after removing the influence <strong>of</strong> changing dollar values.The annual inflated value <strong>of</strong> shrimp landings typically has been volatile with largechanges between years. The lowest inflated value was $3.5 million in 1972. The highestinflated value was $25.4 million in 2000. Relatively speaking, 1981 represented a 69% drop inthe value <strong>of</strong> landings from 1980. However, the fishery rebounded in 1982 with a 210% increasein the inflated value <strong>of</strong> landings over 1981. The value <strong>of</strong> the fishery dropped by 53% in 2001from the record high 2000 value. In 2002 the value increased 54% over the 2001 value, but stillconsiderably lower than 2000. The inflated value hit a 20 year low in 2003, dropping 40% overthe previous years value (see Figure 7.1).Consumer Price Index (CPI) inflation-adjusted figures (deflated to the value <strong>of</strong> a dollar in1972) typically show less volatility. Nonetheless, significant volatility from year to year can beseen in the landings values from 1978 to 1987. With a few exceptions, the total deflated value<strong>of</strong> landings has hovered around the $4 – 5 million from 1972 until 2000. The deflated value <strong>of</strong>annual landings has been in an overall downward trend in recent years. The deflated value <strong>of</strong>landings in 2003 was less than $2.5 million, lower than any year in over 30 years. Changes inannual values can largely be attributed to three major causes; pounds landed, price per poundreceived by fishermen, and in recent years, the impacts <strong>of</strong> imports. The recent history <strong>of</strong>imports and their impact on the price <strong>of</strong> shrimp is further discussed in section 7.1.1.6 <strong>of</strong> thisdocument.The average inflated price per pound paid to the fisherman generally rose between 1972and 1982 (Figure 7.2), rising from a low <strong>of</strong> $.64 in 1972 to $2.34 in 1982. From 1983 through1994, the price per pound fluctuated between a high <strong>of</strong> $2.61 in 1994 and a low <strong>of</strong> $1.73 in1991. From 1994 to 2000, the price per pound averaged just below $2.50 per pound. However,since 2000, the inflated price per pound paid to fishermen dropped to a low <strong>of</strong> $1.77 in 2003.31
$30,000,000$25,000,000Inflated ValueCPI Deflated Value$20,000,000Value$15,000,000$10,000,000$5,000,000$01972197419761978198019821984198619881990199219941996199820002002YearFigure 7.1.Value <strong>of</strong> shrimp landings in North Carolina, 1972 – 2003 (DMF Trip TicketProgram).Beginning in 1992 the US Department <strong>of</strong> Labor began tracking a Producer Price Index(PPI) for unprocessed shrimp. Figure 7.2 shows how the PPI has tracked against the actualprice paid per pound to fishermen relative to the initial 1992 value. Years in which the PPI valueis above the 1992 value show relative increases. However, in 2002 and 2003, the last twoyears for which data are available, the value <strong>of</strong> shrimp per pound was approximately 25% lessthan the 1992 value. These trends mirror those reported by Maiolo (2004).The trend in price per pound received by fishermen becomes clearer when one takesinto account the impact <strong>of</strong> inflation. The CPI shows that with the exception <strong>of</strong> 1972 and 1974,the average deflated price <strong>of</strong> shrimp was nearly $1.00 per pound until 1982. However, since1983 there has been a trend towards decline in the average value per pound. The lowest value<strong>of</strong> $.40 in 2003 is 37% lower than the deflated price received in 1972, and represents the lowestprice received per pound in over 30 years.Supply and demand largely determine the price per pound paid to shrimp fishermen.Farm raised imports, mostly from Asia and Latin America, have increased to meet increasingdemand and, indeed, appear to have fostered it. Following the poor domestic harvest years <strong>of</strong>the late seventies and early eighties, imports had increased from fairly modest levels to 341million pounds in 1983, 500 million in 1989 and 1990 and 759 pounds in 2000 (Maiolo 2004).The impact <strong>of</strong> imports has been especially hard on shrimp fishermen since 2001. In that year,price per pound dropped 24% over the previous year. In 2002, the price dropped an additional32% over the 2001 price received by fishermen. A small gain was realized in 2003 when theprice per pound increased by about 13% over the 2002 price. Nonetheless, the PPI deflatedprice per pound <strong>of</strong> shrimp went from $2.70 in 2000 down to $1.44 in 2002. It only recovered to$1.63 in 2003, only 60% <strong>of</strong> the value in 2000. The price per pound reduction received byfishermen since 2000 can largely be attributed to the impact <strong>of</strong> imports. A record one billion,one hundred and forty million pounds were imported in 2004.32
Price Per Pound$3.50$3.00$2.50$2.00$1.50$1.00$0.50InflatedCPIPPI$0.001972197419761978198019821984198619881990199219941996199820002002YearFigure 7.2. Average price per pound <strong>of</strong> shrimp landings in North Carolina, 1972 – 2003(DMF Trip Ticket Program).Table 7.1 show a summary <strong>of</strong> the data presented in section 7.1.1.1 indicating by year,the number <strong>of</strong> pounds <strong>of</strong> shrimp landed, inflated values (indexed to 1972), the CPI deflatedvalue, inflated price per pound, CPI deflated price per pound, the PPI price per pound, and therate <strong>of</strong> change from one year to the next for all years in which data were available since 1972.7.1.1.2 GearFrom 1994 through 2003, 96% to 97% <strong>of</strong> all shrimp were caught using trawls. Anadditional 3-4% were caught using channel nets and less than 1% in other gears (Figure 7.3).100%90%80%70%60%50%40%30%20%10%0%Trawls Channel Nets Other GearsFigure 7.3. Percent <strong>of</strong> landings by gear used to harvest shrimp in all North Carolina waters, 1994 –2003 (DMF Trip Ticket Program).33
Table 7.1.Detail values <strong>of</strong> pounds landed, total value, deflate value, price per pound, and percent changefrom year to year for shrimp landed in North Carolina, 1972 – 2003 (DMF Trip Ticket Program).Pounds % ChangeCPI Deflated % Change Inflated Price CPI Price per % Change PPI for % PPIYear Landed Pounds Inflated Value Conversion Value Value per Pound Pound per Pound <strong>Shrimp</strong> Change1972 5,563,261 --- $3,549,492 1.0000 $3,549,492 --- $0.64 $0.64 ---1973 5,003,417 -10% $4,738,223 0.9414 $4,460,759 26% $0.95 $0.89 40%1974 8,440,203 69% $4,606,363 0.8479 $3,905,598 -12% $0.55 $0.46 -48%1975 5,163,610 -39% $5,053,944 0.7770 $3,926,670 1% $0.98 $0.76 64%1976 6,642,713 29% $8,171,394 0.7346 $6,002,887 53% $1.23 $0.90 19%1977 5,600,329 -16% $7,239,080 0.6898 $4,993,293 -17% $1.29 $0.89 -1%1978 2,960,762 -47% $3,883,836 0.6411 $2,489,944 -50% $1.31 $0.84 -6%1979 4,941,240 67% $9,728,917 0.5758 $5,601,498 125% $1.97 $1.13 35%1980 9,823,490 99% $17,184,994 0.5073 $8,717,630 56% $1.75 $0.89 -22%1981 2,557,426 -74% $5,295,209 0.4598 $2,434,981 -72% $2.07 $0.95 7%1982 7,027,164 175% $16,411,472 0.4332 $7,108,803 192% $2.34 $1.01 6%1983 6,114,099 -13% $13,564,106 0.4197 $5,692,567 -20% $2.22 $0.93 -8%1984 5,036,749 -18% $10,475,665 0.4023 $4,214,464 -26% $2.08 $0.84 -10%1985 11,676,679 132% $21,124,922 0.3885 $8,206,522 95% $1.81 $0.70 -16%1986 6,134,774 -47% $13,903,999 0.3814 $5,302,803 -35% $2.27 $0.86 23%1987 4,413,078 -28% $8,155,548 0.3680 $3,000,897 -43% $1.85 $0.68 -21%1988 8,110,777 84% $16,486,042 0.3533 $5,825,161 94% $2.03 $0.72 6%1989 8,922,807 10% $15,620,305 0.3371 $5,265,554 -10% $1.75 $0.59 -18%1990 7,801,605 -13% $15,838,593 0.3198 $5,065,441 -4% $2.03 $0.65 10%1991 10,731,041 38% $18,578,905 0.3069 $5,701,896 13% $1.73 $0.53 -18%1992 5,495,811 -49% $10,859,113 0.2979 $3,235,288 -43% $1.98 $0.59 11% $1.98 ---1993 6,778,762 23% $13,590,460 0.2893 $3,931,358 22% $2.00 $0.58 -1% $2.05 4%1994 7,294,043 8% $19,001,297 0.2821 $5,359,340 36% $2.61 $0.73 27% $2.96 44%1995 8,669,398 19% $20,319,177 0.2743 $5,573,108 4% $2.34 $0.64 -13% $2.45 -17%1996 5,271,731 -39% $13,378,358 0.2664 $3,564,151 -36% $2.54 $0.68 5% $2.38 -3%1997 6,988,825 33% $18,203,356 0.2604 $4,740,812 33% $2.60 $0.68 0% $3.08 30%1998 4,636,343 -34% $10,858,872 0.2564 $2,784,668 -41% $2.34 $0.60 -11% $2.17 -30%1999 9,004,430 94% $22,095,815 0.2509 $5,543,848 99% $2.45 $0.62 3% $2.33 7%2000 10,334,915 15% $25,400,172 0.2427 $6,165,663 11% $2.46 $0.60 -3% $2.70 16%2001 5,254,214 -49% $11,906,335 0.2360 $2,810,191 -54% $2.27 $0.53 -10% $2.12 -21%2002 9,969,026 90% $18,364,776 0.2324 $4,267,080 52% $1.84 $0.43 -20% $1.44 -32%2003 6,167,371 -38% $10,945,676 0.2272 $2,486,572 -42% $1.77 $0.40 -6% $1.62 13%34
Table 7.2 shows the number <strong>of</strong> pounds landed, the total value, and the price per poundfor each <strong>of</strong> the gears listed in Figure 7.3 by year from 1994 – 2003. Inflated values refer to theactual dollar amount paid by fish dealers to shrimp fishermen. The deflated values referred to inthis table refer to the PPI values for unprocessed shrimp.Trawls were the primary gears used to land shrimp in every year. Trawls brought in thehighest price per pound in most years. The difference in price per pound was as much as $.46in 1999 and as little as $.07 per pound in 2000.Table 7.2.Pounds, price per pound, and total value <strong>of</strong> shrimp landings by gear in all NorthCarolina waters, 1994 – 2003 (DMF Trip Ticket Program).Year Gear Pounds Inflated ValueDeflatedDeflated Value Price/Lb Price/Lb1994 Trawls 7,091,538 $18,572,279 $18,572,279 $2.62 $2.62Channel Net 186,029 $403,636 $403,636 $2.17 $2.17Other Gears 8,780 $21,303 $21,303 $2.43 $2.431995 Trawls 8,350,411 $19,657,278 $20,567,752 $2.35 $2.46Channel Net 273,092 $569,050 $595,407 $2.08 $2.18Other Gears 45,426 $92,447 $96,729 $2.04 $2.131996 Trawls 5,057,320 $12,901,194 $12,105,402 $2.55 $2.39Channel Net 199,915 $457,279 $429,072 $2.29 $2.15Other Gears 4,247 $9,824 $9,218 $2.31 $2.171997 Trawls 6,793,752 $17,734,939 $20,999,375 $2.61 $3.09Channel Net 191,188 $459,801 $544,435 $2.40 $2.85Other Gears 3,302 $8,034 $9,512 $2.43 $2.881998 Trawls 4,450,334 $10,451,933 $9,694,151 $2.35 $2.18Channel Net 181,917 $399,736 $370,754 $2.20 $2.04Other Gears 2,939 $6,049 $5,610 $2.06 $1.911999 Trawls 8,711,223 $21,512,340 $20,406,424 $2.47 $2.34Channel Net 284,443 $571,531 $542,150 $2.01 $1.91Other Gears 8,542 $11,832 $11,224 $1.39 $1.312000 Trawls 10,069,905 $24,767,058 $27,212,506 $2.46 $2.70Channel Net 260,321 $621,456 $682,818 $2.39 $2.62Other Gears 4,689 $11,658 $12,809 $2.49 $2.732001 Trawls 5,065,311 $11,503,607 $10,780,745 $2.27 $2.13Channel Net 185,567 $395,288 $370,449 $2.13 $2.00Other Gears 3,253 $7,318 $6,858 $2.25 $2.112002 Trawls 9,713,944 $17,914,881 $14,014,164 $1.84 $1.44Channel Net 250,656 $436,803 $341,695 $1.74 $1.36Other Gears 4,417 $13,080 $10,232 $2.96 $2.322003 Trawls 5,909,728 $10,514,436 $9,622,889 $1.78 $1.63Channel Net 255,892 $420,269 $384,633 $1.64 $1.50Other Gears 1,751 $10,971 $10,040 $6.27 $5.747.1.1.3 Water bodiesThe majority <strong>of</strong> inshore shrimp are landed from the Pamlico and Core sounds. In everyyear since 1994 with the exception <strong>of</strong> 1998, Pamlico Sound landed the greatest amount <strong>of</strong>shrimp in terms <strong>of</strong> pounds and value compared to all other trip ticket water bodies. On average35
from 1994 through 2003, 50% <strong>of</strong> all shrimp landed in NC came from Pamlico Sound alone. Alltrip ticket water bodies south <strong>of</strong> the Albemarle Sound showed some landings in at least most <strong>of</strong>the years. Pamlico and Core sounds along with ocean landings south <strong>of</strong> Cape Hatteras eachaccount for over $1 million in landings each year.Table 7.3 shows shrimp landings for all water bodies that had at least 5,000 poundslanded. Waterbodies that are listed and show no landings for a given year does not mean thatwaterbody had no landings. It may mean the waterbody did not meet the 5,000-poundthreshold for that year. Also, the names <strong>of</strong> water bodies and how they are used has changedover time. For example, Inland waterway was separated into Inland Waterway – Brunswick andInland Waterway – Onslow in 2003. Ocean landings were separated into landings north andsouth <strong>of</strong> Cape Hatteras. Wherever it was possible, landings using old waterbody names wererecoded in this analysis to indicate the current waterbody designation.7.1.1.4 Participants and tripsDMF began a new licensing system in 1999. This new system allows for easieridentification <strong>of</strong> specific fishermen with their individual landings by species and the number <strong>of</strong>trips taken where a given species was landed. Table 7.4 shows the number <strong>of</strong> participants inthe shrimp fishery by year and the ex-vessel value <strong>of</strong> their landings.The number <strong>of</strong> fishermen who participate in the fishery seems to follow the abundance<strong>of</strong> shrimp or when fishermen are receiving a good price. This indicates that at least somefishermen are able to rely on other species or other work when shrimping is not as lucrative.The years 1999 and 2000 saw the greatest number <strong>of</strong> participants in the fishery at over 900.Yet 2003 had the least number <strong>of</strong> participants with only 594.On average, in the five years from 1999 through 2003, nearly half <strong>of</strong> all fishermen whocaught shrimp had ex-vessel landings values less than $5,000. The percentage <strong>of</strong> fishermenwho landed ex-vessel values <strong>of</strong> between $35,000 and $50,000 remained fairly constant at about10% <strong>of</strong> all participants. The percentage <strong>of</strong> fishermen who had ex-vessel landings valuesbetween $50,001 and $75,000 in a given year showed a slight increasing trend amongparticipants. However, there is great variability among years as to the percentage <strong>of</strong> fishermenwho are able to land more than $75,000 ex-vessel value <strong>of</strong> shrimp.36
Table 7.3.Pounds and value <strong>of</strong> shrimp landed from North Carolina water bodies from 1994 – 2003 (DMF Trip Ticket Program).Year1994 1995 1996 1997Water body Pounds Ex-Vessel Value Pounds Ex-Vessel Value Pounds Ex-Vessel Value Pounds Ex-Vessel ValueBay River 20,051 $54,588 10,021 $19,981 6,052 $14,231 16,409 $40,222Bogue Sound 23,344 $49,666 34,345 $65,683 45,689 $92,875 17,009 $33,178Cape Fear River 149,791 $302,890 114,261 $186,102 80,380 $189,553 138,424 $273,720Core Sound 864,599 $1,837,495 1,069,258 $2,272,494 738,396 $1,690,725 636,805 $1,423,443Croatan Sound 7,701 $17,963 13,768 $36,115 6,590 $18,242 12,539 $32,248Masonboro Sound --- --- --- --- 5,973 $12,699 5,715 $10,681Ocean 0-3 mi, N <strong>of</strong> Cape Hatteras --- --- 55,686 $168,765 13,318 $31,018 21,710 $66,132Ocean 0-3 mi, S <strong>of</strong> Cape Hatteras --- --- 337,606 $862,315 1,232,910 $3,177,581 1,030,217 $2,618,096Ocean >3 mi, N <strong>of</strong> Cape Hatteras --- --- --- --- 16,546 $46,974 7,028 $20,066Ocean >3 mi, S <strong>of</strong> Cape Hatteras --- --- --- --- 180,351 $475,194 205,008 $571,463Ocean less than 3 miles 1,372,958 $3,621,439 1,478,122 $3,190,108 329,751 $788,445 243,964 $643,107Ocean more than 3 miles 277,855 $763,765 303,217 $846,978 49,752 $139,195 32,609 $89,451Neuse River 115,689 $320,348 114,705 $284,780 111,098 $311,250 164,538 $441,101New River 103,078 $284,059 274,212 $689,719 148,264 $420,146 244,360 $636,979Newport River 166,828 $311,459 275,058 $386,857 125,092 $270,483 213,818 $424,616Pamlico River 47,621 $133,354 34,756 $86,079 23,078 $64,410 39,793 $116,922Pamlico Sound 3,861,499 $10,720,672 4,096,435 $10,313,455 1,934,512 $5,147,780 3,722,785 $10,230,968Stump Sound 8,553 $21,719 25,546 $47,773 27,088 $65,610 29,139 $65,943Topsail Sound 29,485 $71,715 59,202 $139,414 21,898 $47,900 22,508 $54,216White Oak River 45,019 $83,167 39,311 $47,476 23,825 $46,005 12,986 $24,578North River/Back Sound 127,327 $257,580 196,322 $417,171 56,511 $132,456 92,489 $224,554Roanoke Sound 14,776 $30,690 5,632 $12,482 7,811 $19,305 8,568 $21,619Inland Waterway - Brunswick 20,377 $36,999 47,264 $80,186 41,431 $74,062 31,182 $61,262Inland Waterway - Onslow 30,559 $68,141 63,147 $111,917 43,199 $97,621 35,493 $71,04437
Table 7.3 (cont.) Pounds and value <strong>of</strong> shrimp landed from North Carolina water bodies from 1994 – 2003 (DMF Trip Ticket Program).Year1998 1999 2000 2001Water body Pounds Ex-Vessel Value Pounds Ex-Vessel Value Pounds Ex-Vessel Value Pounds Ex-Vessel ValueBay River --- --- 27,913 $69,034 35,348 $78,462 5,935 $13,383Bogue Sound 41,849 $70,963 48,220 $94,783 23,875 $38,287 9,906 $13,483Cape Fear River 82,592 $150,219 118,742 $215,260 46,058 $79,358 17,850 $51,736Core Sound 547,488 $991,399 884,330 $1,598,475 464,917 $901,322 431,489 $839,705Croatan Sound --- --- 3,793 $8,370 40,989 $96,493 --- ---Ocean 0-3 mi, N <strong>of</strong> Cape Hatteras --- --- 6,638 $21,241 36,319 $98,856 --- ---Ocean 0-3 mi, S <strong>of</strong> Cape Hatteras 1,493,238 $3,696,510 2,468,260 $668,902 1,397,907 $3,565,806 1,157,075 $2,296,261Ocean >3 mi, N <strong>of</strong> Cape Hatteras 14,516 $42,551 51,502 $174,186 29,997 $84,160 --- ---Ocean >3 mi, S <strong>of</strong> Cape Hatteras 380,907 $1,002,549 236,725 $584,197 133,048 $349,046 100,069 $206,999Ocean less than 3 miles 344,408 $811,075 67,420 $214,004 --- --- --- ---Ocean more than 3 miles 18,602 $47,937 5,007 $17,816 --- --- --- ---Neuse River 83,765 $177,305 216,922 $485,133 210,970 $471,183 19,942 $43,962New River 259,274 $661,700 271,883 $626,671 483,739 $1,351,747 189,084 $430,682Newport River 71,793 $126,691 307,504 $456,164 240,583 $304,929 176,502 $241,288Pamlico River 14,664 $37,043 43,794 $120,732 44,710 $109,849 20,203 $43,487Pamlico Sound 1,115,961 $2,720,959 3,876,339 $10,191,283 6,708,334 $17,185,783 2,890,943 $7,334,297Shallotte River --- --- --- --- --- --- 6,123 $11,180Stump Sound 16,038 $36,094 20,522 $38,276 21,888 $45,129 11,795 $26,149Topsail Sound 36,579 $73,701 72,561 $134,762 39,152 $84,958 21,888 $35,849White Oak River 23,582 $37,844 37,984 $36,346 62,164 $55,993 62,361 $75,326North River/Back Sound 27,391 $53,045 160,649 $193,871 216,045 $309,502 71,739 $133,631Roanoke Sound --- --- --- --- 7,298 $15,732 --- ---Pungo River --- --- 7,029 $19,554 6,926 $17,482 6,887 $11,814Inland Waterway - Brunswick 23,951 $42,742 21,913 $41,129 38,487 $60,556 19,450 $35,254Inland Waterway -Onslow 30,818 $61,108 44,593 $77,669 40,976 $87,833 32,088 $55,93738
Table 7.3 (cont.) Pounds and value <strong>of</strong> shrimp landed from North Carolina water bodies from1994 – 2003 (DMF Trip Ticket Program).Year2002 2003Water body PoundsEx-Vessel Value PoundsEx-Vessel ValueBay River 14,070 $19,787 --- ---Bogue Sound 31,389 $55,013 127,781 $155,212Cape Fear River 82,868 $109,384 101,428 $162,548Core Sound 783,852 $1,235,756 821,174 $1,392,239Croatan Sound 10,010 $18,063 --- ---Masonboro Sound --- --- 6,561 $7,473Ocean 0-3 mi, S <strong>of</strong> Cape Hatteras 1,288,291 $2,438,7202,008,504 $3,365,084Ocean >3 mi, N <strong>of</strong> Cape Hatteras 21,337 $38,855 --- ---Ocean >3 mi, S <strong>of</strong> Cape Hatteras 60,109 $137,491 242,477 $413,615Neuse River 213,697 $373,058 102,366 $166,627New River 428,783 $871,912 230,381 $454,378Newport River 292,696 $289,219 142,654 $190,706Pamlico River 102,459 $176,545 11,934 $25,129Pamlico Sound 6,147,806 $11,977,3562,023,826 $4,115,221Stump Sound 48,099 $84,230 25,010 $37,392Topsail Sound 14,383 $22,975 43,141 $69,255White Oak River 137,397 $128,142 52,052 $49,960North River/Back Sound 186,314 $212,358 117,353 $175,649Roanoke Sound 31,342 $57,581 --- ---Pungo River 7,870 $14,036 --- ---Inland Waterway - Brunswick 25,332 $38,907 31,005 $50,432Inland Waterway - Onslow 32,947 $53,059 66,857 $94,79739
Table 7.4.Number <strong>of</strong> participants in the shrimp fishery by value <strong>of</strong> landings and year in NorthCarolina, 1999 – 2003. (DMF Trip Ticket Program).Year1999 2000 2001 2002 2003 Total$1 - $1,000 273 272 199 189 112 1,045% within year 30% 29% 28% 24% 19% 26%$1,001 - $5,000 198 170 153 176 148 845% within year 21% 18% 21% 22% 25% 21%$5,001 - $10,000 120 120 103 91 89 523% within year 13% 13% 14% 12% 15% 13%$10,001 -$20,000 78 76 61 92 62 369% within year 8% 8% 9% 12% 10% 9%$20,001 -$35,000 36 39 41 36 40 192% within year 4% 4% 6% 5% 7% 5%$35,001 -$50,000 79 96 84 76 76 411% within year 9% 10% 12% 10% 13% 10%$50,001 -$75,000 44 42 44 50 45 225% within year 5% 5% 6% 6% 8% 6%> $75,000 94 112 32 76 22 336% within year 10% 12% 4% 10% 4% 9%Total participants 922 927 717 786 594% change --- 1% -23% 10% -24%Table 7.5 shows the number <strong>of</strong> fisherman and the number <strong>of</strong> trips they took in whichthey landed shrimp for the years 1999 through 2003. From 1999 through 2003 an average <strong>of</strong>12% <strong>of</strong> all participants only had one trip with shrimp landings. An average <strong>of</strong> 65% <strong>of</strong> all personsreporting shrimp landings had 20 or fewer trips in a given year. Only 17% <strong>of</strong> all fishermenreported taking 41 or more trips per year. Again, abundance <strong>of</strong> shrimp, prices received for thecatch, and weather events such as hurricanes greatly affect the number <strong>of</strong> trips a fishermanmight make.40
Table 7.5.Number <strong>of</strong> participants and the number <strong>of</strong> trips taken that landed shrimp in NorthCarolina, 1999 – 2003 (DMF Trip Ticket Program).Year1999 2000 2001 2002 2003 Total1 Trip 121 117 94 80 57 469% within year 13% 13% 13% 10% 10% 12%2 - 10 Trips 328 309 245 256 181 1,319% within year 36% 33% 34% 33% 30% 33%11 - 20 Trips 173 180 158 163 123 797% within year 19% 19% 22% 21% 21% 20%21 - 30 Trips 102 128 85 96 67 478% within year 11% 14% 12% 12% 11% 12%31 - 40 Trips 47 59 35 51 43 235% within year 5% 6% 5% 6% 7% 6%41 - 50 Trips 36 39 28 34 34 171% within year 4% 4% 4% 4% 6% 4%51 - 60 Trips 32 22 21 24 27 126% within year 3% 2% 3% 3% 5% 3%61 - 70 Trips 25 25 17 17 21 105% within year 3% 3% 2% 2% 4% 3%71 - 80 Trips 18 13 8 23 16 78% within year 2% 1% 1% 3% 3% 2%81 - 90 Trips 12 17 7 13 12 61% within year 1% 2% 1% 2% 2% 2%91 – 100 Trips 7 7 11 9 6 40% within year 1% 1% 2% 1% 1% 1%More than 100 Trips 21 11 8 20 7 67% within year 2% 1% 1% 3% 1% 2%Total 922 927 717 786 594 3,946In North Carolina, licensed commercial fishermen are allowed only to sell their catch tolicensed fish dealers. Figure 7.4 shows the number <strong>of</strong> North Carolina fish dealers whopurchased shrimp from licensed fishermen each year from 1999 through 2003. There is a fairamount <strong>of</strong> change in the number <strong>of</strong> dealers purchasing shrimp from year to year with a low <strong>of</strong>225 in 2001 to a high <strong>of</strong> 284 in 2002. The annual differences are due largely to availability <strong>of</strong>local shrimp as well as availability and price <strong>of</strong> imported processed or frozen shrimp.41
Number <strong>of</strong> Dealers3102902702502302101901701501994 1995 1996 1997 1998 1999 2000 2001 2002 2003YearFigure 7.4.Number <strong>of</strong> dealers who purchased shrimp from 1994 to 2003 (DMF Trip TicketProgram).Table 7.6 shows the number <strong>of</strong> fish dealers who purchased specific amounts <strong>of</strong> shrimpin a given year. An average <strong>of</strong> 9% <strong>of</strong> dealers purchase fewer than 100 pounds <strong>of</strong> shrimp in agiven year. All told, about 35% <strong>of</strong> dealers purchase 1,000 or fewer pounds <strong>of</strong> shrimp a year.About 23% <strong>of</strong> dealers purchase more than 20,000 pounds <strong>of</strong> shrimp from fishermen. Only 9%purchase more than 100,000 pounds <strong>of</strong> shrimp.7.1.1.5 ProcessingSome dealers will go so far as to head shrimp for customers, but the majority <strong>of</strong> shrimpare sold heads on. <strong>Shrimp</strong> that cannot be sold fresh are frozen and sold that way. A fewdealers sell shrimp to be processed into other consumable products such as frozen breadedshrimp, however, there are no shrimp processors currently operating in North Carolina.7.1.1.6 Marketing and distributionFish dealers sell shrimp to other dealers, restaurateurs, retail outlets and directly to theconsumer. There is no specific information available as to how much North Carolina shrimp issold through each <strong>of</strong> these venues.According to the US Department <strong>of</strong> Commerce (2003) there was a 3.7 pound per capitaconsumption <strong>of</strong> shrimp by Americans in 2002. This represented an all-time record amount <strong>of</strong>shrimp consumed. The North Carolina State Demographics (2004) website indicates that therewere 8,196,195 residents <strong>of</strong> North Carolina in July <strong>of</strong> 2002.42
Table 7.6.Pounds <strong>of</strong> shrimp purchased by North Carolina fish dealers from North Carolina fishermen, 1994 – 2003 (DMFTrip Ticket Program). * Denotes confidential data. Data are included with the preceding category.YearPounds 1994 1995 1996 1997 1998 1999 2000 2001 2002 2003 TotalLess than 100 lbs. 17 27 22 22 26 28 28 23 23 20 236% within year 7% 10% 9% 9% 11% 10% 11% 10% 8% 8% 9%101 - 500 lbs. 38 35 50 30 36 56 47 40 47 25 404% within year 16% 13% 19% 12% 15% 21% 19% 18% 17% 10% 16%501 - 1,000 lbs. 26 25 21 30 30 23 21 24 31 23 254% within year 11% 10% 8% 12% 13% 8% 8% 11% 11% 9% 10%1,001 - 2,000 lbs. 19 30 28 32 26 31 26 22 41 39 294% within year 8% 11% 11% 13% 11% 11% 10% 10% 14% 16% 12%2,001 - 5,000 lbs. 31 36 43 36 32 35 36 34 39 36 358% within year 13% 14% 17% 15% 14% 13% 14% 15% 14% 15% 14%5,001 - 10,000 lbs. 19 21 19 17 16 17 16 19 23 29 196% within year 8% 8% 7% 7% 7% 6% 6% 8% 8% 12% 8%10,001 - 20,000 lbs. 17 21 17 22 14 15 18 13 21 18 176% within year 7% 8% 7% 9% 6% 6% 7% 6% 7% 7% 7%20,001 - 35,000 lbs. 12 8 11 8 12 11 11 10 12 13 108% within year 5% 3% 4% 3% 5% 4% 4% 4% 4% 5% 4%35,001 - 50,000 lbs. 9 7 18 11 13 6 5 5 5 10 89% within year 4% 3% 7% 4% 6% 2% 2% 2% 2% 4% 4%50,001 - 75,000 lbs. 13 9 6 12 8 7 6 9 6 7 83% within year 6% 3% 2% 5% 3% 3% 2% 4% 2% 3% 3%75,001 - 100,000 lbs. 9 18 9 6 8 8 9 8 3 5 83% within year 4% 7% 3% 2% 3% 3% 4% 4% 1% 2% 3%100,001 - 150,000 lbs. 10 9 5 10 8 17 10 11 11 8 99% within year 4% 3% 2% 4% 3% 625% 4% 5% 4% 3% 4%150,001 - 200,000 lbs. 3 7 5 5 * 10 5 4 8 8 55% within Year 1% 3% 2% 2% * 4% 2% 2% 3% 3% 2%More than 200,000 lbs. 9 10 4 7 5 8 16 3 14 6 82% within year 4% 4% 2% 3% 2% 3% 6% 1% 5% 2% 3%Total 232 263 258 248 234 272 254 225 284 247percent change 13% -2% -4% -6% 16% -7% -11% 26% -13%43
These two numbers estimate that over 30 million pounds <strong>of</strong> shrimp were consumed byNorth Carolina residents in 2002, over three times the number <strong>of</strong> pounds actually landed fromNorth Carolina waters. Even if all shrimp caught in North Carolina remained in the state, itwould only supply one third <strong>of</strong> the state’s consumption needs. There is a large reliance onshrimp imported into North Carolina from other states, and foreign countries. Thus it appearsimports represent a two edged sword. On the one hand, they have increased the supply, andalso demand because <strong>of</strong> the effect on price. On the other hand, the effect on price has greatlydiminished the economic returns to domestic fishermen. One result is that some fishermen lookfor more land based work. In other cases, wives take full time jobs to supplement theirhusband’s income so they can continue shrimping (Maiolo 2004).Concerned about the rising tide <strong>of</strong> imports, a group <strong>of</strong> shrimping industry individuals fromthe Gulf and South Atlantic formed the Southern <strong>Shrimp</strong> Alliance (SSA), made up <strong>of</strong> the shrimpproducing states from North Carolina through Texas. The SSA hired two firms: one to do theresearch for possible trade action, and the other for lobbying.The SSA decided to file petitions with the Federal government alleging several countrieshad been dumping shrimp on the US market at below cost. SSA filed trade action against 6countries, and the petition was filed on December 31, 2003. Preliminary antidumping dutieswere imposed by the US Department <strong>of</strong> Commerce in July <strong>of</strong> 2004. The duties ranged from3.4% to 67.8% on companies from the countries <strong>of</strong> Brazil, Ecuador, India, and Thailand.Additionally, The Commerce Department found that shrimp from China and Vietnam weredumped on US markets at a rate <strong>of</strong> up to 113% below cost (NCFA 2004).Additionally, the lobbying efforts <strong>of</strong> SSA helped to persuade the United States Congressin 2003 to set aside $35 million to <strong>of</strong>fset the economic losses suffered by shrimp fishermen fromsoutheastern states. North Carolina received $4.9 million <strong>of</strong> the total. Of the total, $4.1 millionwas sent directly to fishermen based on their percent total <strong>of</strong> 2002 landings. An additional$200,000 was used by DMF to cover the costs <strong>of</strong> administering the program.As part <strong>of</strong> the Federal shrimp economic assistance program <strong>of</strong> 2003, approximately$600,000 (13.3%) <strong>of</strong> the shrimp economic assistance Federal aid was given to the NorthCarolina Department <strong>of</strong> Agriculture (NCDA) to develop a three-year marketing program formarketing wild-caught North Carolina shrimp. The money was used to market North Carolinawild caught shrimp in trade and consumer publications, billboards, in-store consumerawareness, and recipe cards. Wild caught shrimp are also being marketed through the NCDA’s“Freshness from North Carolina Waters” seafood promotion program.7.1.1.7 Economic impact <strong>of</strong> commercial fisheryTable 7.7 shows the economic impact <strong>of</strong> commercial fishing for shrimp in North Carolinato the state’s overall economy. These impacts were calculated using the number <strong>of</strong> personsharvesting shrimp and the value <strong>of</strong> those landings (IMPLAN, 2000). The numbers provided areto be considered an underestimate <strong>of</strong> the total impact because there are no North Carolinaspecific data available that accurately describe the business-to-business cash flow betweencommercial fishermen and those who provide services to them. However, the impacts doinclude the added value to the economy by commercial fishermen based on their spending justfrom the money they received for the annual catch <strong>of</strong> shrimp. The multiplier shown for eachyear is a mathematical representation <strong>of</strong> the additional value <strong>of</strong> the shrimp as it moves throughNorth Carolina’s economy. Once the shrimp leave North Carolina, it no longer has a directimpact on the economy <strong>of</strong> North Carolina, although it will have impact elsewhere. The annualimpact <strong>of</strong> shrimp on the North Carolina economy is approximately $18.9 to $42.5 million in the44
years 2000 to 2003.Table 7.7. Economic impact <strong>of</strong> the commercial shrimp fishery in North Carolina, 1999 – 2003(IMPLAN, 2000).YearEx-vesselValue NC Economic Impact1999 $22,095,815 $36,955,2042000 $25,400,172 $42,481,5022001 $11,906,335 $19,488,6012002 $18,364,776 $30,059,4822003 $10,945,676 $18,934,449In 2003, shrimp landings accounted for about 15% <strong>of</strong> all the pounds and 20.5% <strong>of</strong> thetotal value <strong>of</strong> shellfish landed in North Carolina. When all finfish are added in, shrimpaccounted for 4.4% <strong>of</strong> all the pounds and 12.6% <strong>of</strong> the total value <strong>of</strong> seafood landed in NorthCarolina.7.1.2 Recreational fishery economicsThere are two survey programs in North Carolina that collect data from recreationalfishermen. The <strong>Marine</strong> Recreational <strong>Fisheries</strong> Statistics Survey (MRFSS) collects data fromanglers and includes ocean landings 0 – 3 miles from the coast and inside waters from south <strong>of</strong>the Albemarle Sound to the South Carolina border. The DMF also collects data fromrecreational fishermen who are licensed to use limited amounts <strong>of</strong> commercial gear.7.1.2.1 <strong>Marine</strong> Recreational <strong>Fisheries</strong> Statistics Survey (MRFSS)MRFSS captures catch and angler participation data for finfish only. No data from anyshellfish species are collected. However, some anglers may catch limited amounts <strong>of</strong> shrimp forbait using a cast net. There are no data on the economic value <strong>of</strong> this practice. The SaltwaterFishing License (SFL) legislation recently passed by the NC General Assembly will provide asampling frame <strong>of</strong> these individuals for future research. Additionally, there are live shrimp baitdealers that operate in the fall as live shrimp have become a popular bait among spottedseatrout fishermen. This live bait market has grown considerably, as a result, over the past 10years.7.1.2.2 Recreational use <strong>of</strong> commercial gear (RCGL)Along with the heavy participation <strong>of</strong> part time commercial fishermen in the shrimpindustry, the recreational use <strong>of</strong> commercial gear has had a long and contentious history. Priorto the <strong>Fisheries</strong> Reform At <strong>of</strong> 1997, there was a growing number <strong>of</strong> participants in both usercategories resulting in increased competition in the shrimp fishery. In 2002, the DMF beganinterviewing recreational fishermen who have purchased a license that allows them to uselimited amounts <strong>of</strong> commercial gear. These fishermen are prohibited from selling their catch asit is intended solely for personal use. The RCGL holder surveys do not specifically determinethe final disposition <strong>of</strong> the shrimp landed by these anglers. However, it is presumed they use theshrimp primarily for personal consumption.Table 7.8 gives an indication <strong>of</strong> the direct economic impact <strong>of</strong> the recreational shrimpfishery by RCGL fishermen in 2003. The data are separated by those who made overnight trips45
as opposed to those who made day trips. In the case <strong>of</strong> the shrimp trawl fishery, the majority <strong>of</strong>fishing does occur at night. A day trip is one in which a person left their home specifically forone fishing trip and then returned to their regular residence once the fishing activity wascompleted. An overnight trip is defined as one in which the fishermen spent a longer period <strong>of</strong>time away from home.Table 7.8.Economic impact <strong>of</strong> RCGL fishing trips for shrimp in 2003 (DMF RCGL SurveyProgram).OvernightTripsDayTripsAvg. # <strong>of</strong> nights 2.83Avg. # <strong>of</strong> miles traveled 132.75 58.78Avg. # <strong>of</strong> people on the trip 3.87 2.98% <strong>of</strong> people on trips wh<strong>of</strong>ished 88% 91%Avg. cost <strong>of</strong> lodging/night $18.00Avg. cost <strong>of</strong> food/trip $53.30 $21.73Avg. cost <strong>of</strong> ice/trip $11.64 $6.07Avg. cost <strong>of</strong> fuel & oil/trip $65.42 $25.96The economic figures are based on an expansion <strong>of</strong> the actual values reported by RCGLfishermen and are considered the best available estimates. The direct economic impactsdescribed below are those that can be attributed only to shrimp landings by these fishermen. Insome instances, the fishermen and the non-fishers who accompanied them, engaged in other,non-fishing activities. The total expenditures were adjusted based on the average proportion <strong>of</strong>people on the trip who actually engaged in fishing activity.The expenditures shown in table 7.8 relate to the overall proportion <strong>of</strong> shrimp landed.Other species were typically caught and kept along with the shrimp. The economic impact wasbased on the percent <strong>of</strong> shrimp in the total pounds <strong>of</strong> all species kept by the fishermen on anygiven trip where shrimp were landed. The total pounds <strong>of</strong> shrimp landed were 50,961 poundsout <strong>of</strong> a total 60,752 pounds landed and kept. <strong>Shrimp</strong> accounted for 84% <strong>of</strong> the total catch ontrips in which shrimp were landed.Expenditures by those who made overnight trips tend to be greater when compared today trips because <strong>of</strong> the increased costs <strong>of</strong> lodging and meals. An average overnight trip lastedapproximately 3 days and resulted in total expenditures <strong>of</strong> $226.10 attributable to shrimplandings. The total direct economic impact <strong>of</strong> overnight RCGL trips for just shrimp in 2003 was$316,120. The average expenditures for day trip fishermen were approximately $73.17attributable to shrimp landings. The total economic impact <strong>of</strong> shrimp caught on day trips for was$113,565. The total combined economic impact <strong>of</strong> all RCGL trips for shrimp in 2003 wasapproximately $429,685.7.1.2.3 Other Recreational <strong>Fisheries</strong>Some people use cast nets to catch shrimp for personal consumption in addition tothose who use cast nets to land shrimp for bait. Again, currently there are no data on theselandings or their economic impacts. Landings and economic data collection will be possibleonce the SFL is implemented.46
8.1 Social Importance <strong>of</strong> the Fishery8.1.1 Commercial fishermen8. SOCIOECONOMIC CHARACTERISTICSThere are two primary sources <strong>of</strong> recent data or accounts available that help to explainthe social importance <strong>of</strong> the commercial fishery. First is a book published on the shrimpindustry in North Carolina, Hard Times and a Nickel a Bucket: Struggle and survival in NorthCarolina’s shrimp industry (Maiolo 2004). Secondly, researchers at the DMF have beenconducting in-depth socioeconomic interviews with commercial fishermen since 2001(Cheuvront 2002; 2003). More than 900 fishermen have been interviewed to date. In thesenearly identical surveys, 182 fishermen who identified themselves as shrimp fishermen wereinterviewed. However, at the time <strong>of</strong> this report, similar interviews had not yet been completedwith shrimp fishermen north <strong>of</strong> Core Sound. Those data will be available for future analyses.8.1.1.1 Historical importanceElsewhere in this document is a history <strong>of</strong> the commercial shrimp fishery in NorthCarolina. The DMF surveys asked the fishermen for their opinion as to how historicallyimportant they think commercial fishing is to their community. On a scale <strong>of</strong> one to ten, with onebeing not at all important to ten being extremely important, the average rating across all 182persons interviewed was 9.6, indicating almost universal agreement that fishing has beenhistorically important to their community. However, when asked how much does theircommunity support commercial fishing now (using the same 10-point scale), the rating was 8.1,indicating they largely feel supported.8.1.1.2 Community reliance on the commercial fisheryNorth Carolina coastal communities rely significantly less on commercial fishing nowthan in the past (Maiolo 2004). This is the result <strong>of</strong> the development <strong>of</strong> the communities asmultiple use zones, with retirement, light industry, recreation, and tourism becoming thedominant domains <strong>of</strong> the local economies. Fewer and fewer native born residents make a fulltime living as fishermen like those in previous generations. Cheuvront (2002; 2003) found theamong Core Sound fishermen and south <strong>of</strong> that location, the average fisherman earned about76% <strong>of</strong> his income from commercial fishing. More specifically Cheuvront found that just underhalf (48%) were totally reliant on fishing for their incomes. This compares with data gathered inthe late 1980s where nearly all full time fishermen captains were committed to fishing for nearlyall (95%) <strong>of</strong> their incomes (Maiolo 2004).The 182 shrimp fishermen came from 38 separate communities in five southeasternNorth Carolina counties (Carteret, Onslow, Pender, New Hanover, and Brunswick). Table 8.1shows the communities that had the greatest number <strong>of</strong> shrimp fishermen who participated inthe survey. The largest number <strong>of</strong> fishermen in the surveys who fished for shrimp came fromSneads Ferry, followed by Harkers Island, Atlantic, Beaufort, and Cedar Island, all communitiesknown to have sizable shrimp fleets.47
Table 8.1. Most frequently cited communities where shrimp fishermen live (Cheuvront, 2002;2003).Percent <strong>of</strong>Community RespondentsSneads Ferry 12.6%Harkers Island 9.9%Atlantic 6.6%Beaufort 4.9%Cedar Island 4.9%Davis 4.4%Morehead City 4.4%Hampstead 3.8%Otway 3.8%Sea Level 3.8%Wilmington 3.8%Studies in the 1970s and eighties revealed that shrimp fishermen engage in a variety <strong>of</strong>both land and water based activities. Fishing activities required moving from one target speciesto another as opportunities prevailed, even though shrimping involved most <strong>of</strong> the effortthroughout the year (Maiolo 2004). Cheuvront (2002; 2003) found that shrimp fishermencontinue to engage in a variety <strong>of</strong> capture activities throughout the year. Like most <strong>of</strong> NorthCarolina’s commercial fishermen, these fishermen tend to diversify the species they target,gears they use, and water bodies they fish. <strong>Shrimp</strong> constituted an average <strong>of</strong> 59% <strong>of</strong> the fishingincome earned by these fishermen. Table 8.2 shows the preference for other species targetedand the average percent <strong>of</strong> fishing income earned by those who the 182 shrimp fishermen whoparticipated in the surveys. Clams (Mercenaria mercenaria) were cited by 45% <strong>of</strong> the fishermenas another species they target. Of those who also land clams, they earn an average <strong>of</strong> 33% <strong>of</strong>their income from clams. Other species frequently targets by these fishermen included oysters(Crassostrea virginica), striped mullet (Mugil cephalus), spot (Leiostomus xanthurus), blue crabs(Callinectes sapidus), and flounder (Paralichthys spp.). <strong>Shrimp</strong> fishermen targeted scallops(Argopecten irradians), Atlantic croaker (Micropogonias undulatus), and weakfish (Cynoscionregalis) less <strong>of</strong>ten.48
Table 8.2. Prevalent species targeted by shrimp fishermen (Cheuvront, 2002;2003)SpeciesPercentwho landPercentincome<strong>Shrimp</strong> 100% 59%Clams 45% 33%Oysters 32% 19%Striped mullet 21% 31%Spot 19% 25%Blue crabs 14% 44%Flounder 14% 28%Scallops 6% 10%Atlantic croaker 3% 7%Weakfish 2% 18%8.1.1.3 Perceived conflictsThere are largely two kinds <strong>of</strong> conflicts that have been measured, those betweencommercial fishermen and those between commercial fishermen and others who use the water.Conflicts between the users <strong>of</strong> the public resource are not uncommon, as no one individualactually owns any part <strong>of</strong> the water, yet all citizens own the water and its resources. Conflictstend to be reported more frequently as the demand for use <strong>of</strong> the resource increases.Extensive competition, and <strong>of</strong>ten ill will between the full timers, part timers, andrecreational fishermen, characterized the shrimp fishery according to research conducted in theseventies and eighties. At that time the competition was most intense in the estuaries in July,when shrimping was at its peak. The part timers and recreational users viewed ownership <strong>of</strong>the resource as much theirs as that <strong>of</strong> the full timers (Maiolo 2004).One <strong>of</strong> the purposes <strong>of</strong> the Fishery Reform Act was to address the intense and <strong>of</strong>tenuncontrolled competition and conflict between and among the user groups, and recent dataindicate there has been some success in this area. The majority <strong>of</strong> the shrimp fishermeninterviewed by Cheuvront (2002; 2003) reported not having any conflicts with other commercialfishermen in the past year (70%). Six percent <strong>of</strong> the fishermen reported having daily or morethan 20 conflicts with other commercial fishermen in the past year (see Figure 8.1).49
Figure 8.1. Frequency <strong>of</strong> conflict experiences with other commercial fishermen in the past year(Cheuvront 2002; 2003)Slightly fewer (66%) <strong>of</strong> the fishermen interviewed by Cheuvront (2002; 2003) reportednot having any negative experiences with recreational fishermen. The number who hadfrequent conflicts with recreational fishermen was the same as the number who had conflictswith commercial fishermen (Figure 8.2).50
Figure 8.2. Frequency <strong>of</strong> conflict experiences with recreational fishermen in the past year(Cheuvront 2002; 2003)Over a third <strong>of</strong> the fishermen interviewed (35%) reported having negative experienceswith state regulations (Figure 8.3). The DMF <strong>Marine</strong> Patrol is responsible for enforcing the rulesand proclamations governing marine resources. The DMF also has the authority to open andclose shrimp seasons in areas where fishermen may catch shrimp. Twenty two percent <strong>of</strong> thefishermen interviewed say they have daily negative experiences with state regulations.51
Figure 8.3. Frequency <strong>of</strong> negative experiences with state regulations in the past year(Cheuvront 2002; 2003).<strong>Shrimp</strong>ing that occurs <strong>of</strong>f the coast in the Exclusive Economic Zone (from 3 to 200miles) is governed by Federal regulations. The South Atlantic Fishery Management Council iscurrently developing Amendment 6 <strong>of</strong> its management plan for shrimp in the ocean. Asignificant amount <strong>of</strong> shrimp landed in North Carolina is from trawlers that work these waters.Many fishermen who land shrimp never work these waters. Consequently, when asked aboutnegative experiences with federal regulations, 58% say they have not had any negativeinteractions with federal regulations in the past year. Nonetheless, 26% indicated fairly frequentor daily negative interactions (Figure 8.4).52
Figure 8.4. Frequency <strong>of</strong> negative experiences with federal regulations in the past year(Cheuvront, 2002; 2003)Maiolo (2004) reported that because many commercial fishermen feel it is their inherentright to sell what they can catch, they frequently are in favor <strong>of</strong> regulatory actions that limit theactivities <strong>of</strong> fishermen other than themselves. However, not all conflicts are resolved by relyingon governmental regulatory agencies. In some areas <strong>of</strong> the state there is potential for conflictsbetween shrimp channel net fishermen and shrimp trawl fishermen. It is worth noting that <strong>of</strong>f <strong>of</strong>Harkers Island in Carteret County, the channel net and trawl fishermen have a solution thatworks for all concerned. Channel netters stay far enough away from each other so that each isstill able to land a reasonable catch. Channel netters carry lights that allow them to signaltrawlers as to where they are working. Also the channel netters pull up their net anchors aftereach fishing trip. Although not mandated by outside regulatory authorities, actions such asthese allow the channel netters and trawl fishermen to work in the same area and minimizeconflicts (Maiolo 2004).8.1.1.4 Perception <strong>of</strong> important issuesThe fishermen interviewed by Cheuvront (2002; 2003) were asked to state the businessissues they found to be the most important they were currently facing. The most importantissue to these fishermen was the need to keep up with rules and proclamations. Not surprising,these fishermen stated that low prices for seafood was a very important issue, followed closelyby a feeling that there are too many imports. Table 8.3 lists the eight most commonly citedissues facing these fishermen.53
Table 8.3.Fishing related issues considered most important to shrimp fishermen (Cheuvront,2002; 2003)RankingIssueKeeping up with rules and1 proclamations2 Low prices for seafood3 Imported seafood4 Overfishing5 Business costs6 Too many areas are <strong>of</strong>f limits to fishing7 Too many regulations overall8 Outside competition8.2 Recreational fisheryAll data regarding the social importance <strong>of</strong> the fishery come from the first annual survey<strong>of</strong> RCGL fishermen conducted in 2001. In-depth socioeconomic data will be collected from thisuser group every three to five years.8.2.1 Historical importanceNorth Carolina has a long history <strong>of</strong> fishermen using commercial gear for recreationalpurposes. The RCGL license was put into effect in 1999 as a result <strong>of</strong> the <strong>Fisheries</strong> Reform Act<strong>of</strong> 1997. Prior to that, recreational fishermen who wished to use commercial gear purchased acommercial vessel license, but did not sell their catch. The RCGL fishermen who reportedlanding shrimp stated that they had been fishing commercial gear on average for 20 years. It islikely that using shrimp trawls for personal harvest has been occurring ever since commercialfisherman have been harvesting shrimp using trawls.8.2.2 Community reliance on the recreational fisheryThere are no data available to indicate the level <strong>of</strong> community reliance on therecreational shrimp fishery.8.2.3 Perceived conflictsThirty-five percent <strong>of</strong> the RCGL fishermen felt that there was too much fishing gear in thewater where they fish. An additional 17% weren’t sure if there was too much gear in the areaswhere they fish. The remaining 48% felt that there wasn’t too much gear in the water.Over 73% <strong>of</strong> all RCGL fishermen who land shrimp say they do not have any conflictswith commercial fishermen. Nearly 90% <strong>of</strong> them stated they do not have conflicts withrecreational anglers.8.2.4 Perception <strong>of</strong> important issuesRCGL fishermen were asked for their opinions about two issues they find to beimportant. Of those who land shrimp, 73% agreed with the statement that they ought to beallowed to use more commercial gear. An additional 13% disagreed indicating they felt theywere allowed to use plenty <strong>of</strong> gear, while 14% indicated they were not sure whether they should54
e allowed to use more gear.8.3 Demographic Characteristics8.3.1 Commercial fishermenTable 8.4 shows a summary <strong>of</strong> the demographic characteristics <strong>of</strong> the 182 shrimpfishermen interviewed by Cheuvront (2002; 2003). Nearly all <strong>of</strong> the shrimp fishermen werewhite males. They averaged 45 years old and had over 25 years fishing experience. Theaverage shrimp fisherman was currently married and had a high school diploma or lesseducation. Approximately 37% <strong>of</strong> the fishermen had incomes <strong>of</strong> $15,000 to $30,000. Another29.7% had total household incomes <strong>of</strong> $30,001 to $50,000.Approximately 64% <strong>of</strong> the fishermen interviewed said they fished all year long. Of thosewho didn’t fish all year, fishing activity was lowest from January through March. The peakfishing participation months for these fishermen were May through November. Seventy-sevenpercent <strong>of</strong> the fishermen indicated that fishing was their sole source <strong>of</strong> income. Of those whohad other sources <strong>of</strong> income, the most frequently cited sources <strong>of</strong> additional income includedcarpentry, machinery mechanic, government, and retirement pensions.Nearly 96% <strong>of</strong> the fishermen owned their fishing operation as a sole proprietorship. Theaverage boat was 28.47 ft. long, was 10 years old and had a current market value <strong>of</strong> just under$26,000. The average shrimp fisherman (including full and part time) earned just under $11,720pr<strong>of</strong>it from all <strong>of</strong> their fishing activities. They averaged $96.85 for routine fishing trip costs (fuel,ice, groceries, etc.). They averaged nearly $13,250 in annual fixed business costs (newequipment, repairs, business loan payments, etc.).55
Table 8.4. Demographic characteristics <strong>of</strong> shrimp fishermen (Cheuvront, 2002; 2003).Variablen = 182Category ValuesAverageor percentYears Fishing 25.4Age 45.2GenderMale 98.4%Female 1.6%RaceWhite 98.9%Hispanic 0.6%Black 0.6%Education LevelLess than HS 36.8%HS Grad 46.2%Some College 11.0%College Graduate 6.0%Marital StatusMarried 78.0%Divorced 10.4%Widowed 1.1%Never Married 0.5%Separated 9.9%Total Household IncomeLess than $15,000 12.1%$15,001 - $30,000 37.4%$30,001 - $50,000 29.7%$50,001 - $75,000 12.1%More than $75,000 13.2%Refused to answer 7.6%8.3.2 Recreational fishermenThe average RCGL holder who targeted shrimp was 51.4 years old and 76% were bornin North Carolina (Table 8.5). The vast majority were males. Most <strong>of</strong> these fishermen had atleast some college education and had total household incomes <strong>of</strong> greater than $30,000 peryear. On average they had been using commercial gear for nearly 20 years.56
Table 8.5.Sociodemographic data <strong>of</strong> RCGL holders who targeted shrimp in 2001. (DMFRCGL Survey Program).Sample Average/Variable Category Values Size PercentYears ExperienceFishingCommercial Gear 324 19.8Born in NC 323 76%Age 32060 years 87 27%Marital Status 318Married 281 88%Divorced 17 5%Widowed 3 1%Separated 3 1%Never Married 14 4%Ethnic Group 319Hispanic/Latino 1 0%Caucasian/White 299 94%African-American/Black 2 1%Native American 17 5%Gender 318Male 307 97%Female 11 3%Education 316< High School 38 12%High School Diploma 76 24%Some College 131 41%College Diploma 7 2%Total Household Income 299< $5,000 2 1%$5,000 tp $15,000 9 3%$15,001 to $30,000 48 16%$30,001 to $50,000 80 27%$50,001 to $75,000 85 28%$75,001 to $100,000 37 12%> $100,000 38 13%8.4 Research RecommendationsOnce the Saltwater Fishing License (SFL) is established, research ought to beundertaken to determine the extent <strong>of</strong> non-RCGL recreational harvest that is occurring. Thisgroup primarily is those who use cast nets to take shrimp either for bait or personalconsumption.57
8.5 Definitions and AcronymsCommercial Fishing – Fishing in which fish harvested, either in whole or in part, are intended toenter commerce or enter commerce through sale, barter or trade. Since 1999, a commercialfisherman in North Carolina is required to have a license issued by the North Carolina <strong>Division</strong><strong>of</strong> <strong>Marine</strong> <strong>Fisheries</strong> (DMF) and is allowed only to sell to a licensed dealer.CPI (Consumer Price Index) – The CPI measures the price paid by consumers for a fixed group<strong>of</strong> goods and services. Changes in the CPI over time constitute a common measure <strong>of</strong> inflation.Deflated (Inflation-adjusted) price and value – Inflation is a general upward price movement <strong>of</strong>goods and services in an economy, usually as measured by the Consumer Price Index (CPI).Ex-vessel prices and values can be adjusted (deflated) according to the CPI to remove theeffects <strong>of</strong> inflation so that the value <strong>of</strong> a dollar remains the same across years. Inflationadjusted values allow for easier understanding and analysis <strong>of</strong> changes in values. Someproducts allow for a Producer Price Index (PPI). The PPI measures inflation in wholesalegoods. It is considered a more reliable indicator than CPI because it is related to a specificproduct or group <strong>of</strong> products. The PPI is related to the CPI in that PPI is considered a precursorto CPI because fluctuations in production costs are usually associated with general measures <strong>of</strong>inflation.Fishing Trip – A period <strong>of</strong> time over which fishing occurs. The time spent fishing includesconfiguring, deploying, and retrieving gear, clearing animals from the gear, and storing,releasing or discarding catch. When watercraft are used, a fishing trip also includes the timespent traveling to and from fishing areas or locales and ends when the vessel <strong>of</strong>floads productat sea or returns to the shore. When fishing from shore or man-made structures, a fishing tripmay include travel between different fishing sites within a 24-hour period.Inflated (Ex-vessel) price and value - The total landed dollar amount <strong>of</strong> a given species (orspecies landing condition and market category). Example: 100 lbs. <strong>of</strong> shrimp at a PRICE <strong>of</strong>$1.50 per pound will have a VALUE <strong>of</strong> $150. These values represent the amounts paid to afisherman by a seafood dealer.MRFSS – <strong>Marine</strong> Recreational <strong>Fisheries</strong> Statistical SurveyDMF – North Carolina <strong>Division</strong> <strong>of</strong> <strong>Marine</strong> <strong>Fisheries</strong>PPI (Producer Price Index) – The PPI is a price index that measures the average level <strong>of</strong>producers' prices for a given product or group <strong>of</strong> products. Because it reflects the costs <strong>of</strong>getting specific products to the market, and price to consumers is based in part on producercosts, it is considered a good economic indicator <strong>of</strong> the rate <strong>of</strong> inflation for the specifiedproducts.RCGL – Recreational Commercial Gear LicenseRecreational Fishing – A recreational fishing trip is any trip for the purpose <strong>of</strong> recreation fromwhich none <strong>of</strong> the catch is sold or bartered. This includes trips with effort but no catch.Fishermen who wish to use limited amounts <strong>of</strong> commercial fishing gear in joint and coastalwaters under DMF jurisdiction are required to have a Recreational Commercial Gear License(RCGL).SFL – Saltwater Fishing LicenseSSA – Southern <strong>Shrimp</strong> Alliance58
9. ENVIRONMENTAL FACTORS9.1 HabitatPenaeid shrimp utilize a system <strong>of</strong> interdependent habitats throughout their life cycle.Brown, white, and pink shrimp utilize similar habitats with minor differences in substrate andsalinity preferences. Environmental preferences (salinity, temperature, oxygen, substrate) weredescribed in the Life History section. The slightly different preferences in bottom substrate andsalinity affect their general position in the estuary and ocean. Each habitat provides ecologicalservices that aid in maintaining and enhancing shrimp stock sustainability, and also influencesthe functioning <strong>of</strong> the ecosystem overall. Protecting the integrity <strong>of</strong> the entire system istherefore necessary to manage this species. Although ecosystem protection is <strong>of</strong> vitalimportance to penaeid shrimp, it may be difficult to detect a cause and effect relationshipbetween habitat protection/enhancement and shrimp stock condition due to the large naturalvariation in environmental conditions in North Carolina, and the relatively short life cycle <strong>of</strong>penaeid shrimp.The South Atlantic <strong>Fisheries</strong> Management Council (SAFMC) designated inshoreestuarine nursery areas, <strong>of</strong>fshore marine habitats used for spawning and growth to maturity,and all connecting waterbodies as Essential Fish Habitat for penaeid shrimp (SAFMC 1998).Inshore nursery areas listed by SAFMC included wetlands, submerged aquatic vegetation(SAV), and subtidal and intertidal non-vegetated bottom (s<strong>of</strong>t bottom). Designated HabitatAreas <strong>of</strong> Particular Concern (HAPC) for penaeid shrimp include all coastal inlets, all statedesignated nursery habitats used by shrimp, and state-identified overwintering areas. In NorthCarolina, specific HAPC includes SAV and estuarine shorelines. In areas lacking SAV, marshwith shell hash and mud bottoms, and adjoining bottoms are <strong>of</strong> particular concern (SAFMC1998).Water columnAdult shrimp spawn <strong>of</strong>fshore in ocean waters. Brown and pink shrimp spawn in deepwater over the continental shelf, while white shrimp remain nearshore in relatively shallow water(SAFMC 1993). Adult shrimp are demersal oriented in all life stages, except as larvae and postlarvae.Larvae and post-larvae depend on ocean currents to be transported through inlets intoestuarine nursery grounds. Inlets are critical bottlenecks through which shrimp and many otherocean-spawned larvae must pass to complete their life cycle (Hettler and Barker 1993). Inletsaccessing Pamlico Sound are limited in number and therefore are particularly important torecruitment into Pamlico Sound and its tributaries. The time <strong>of</strong> spawning varies with species,with brown shrimp spawning earliest in winter and early spring, and white and pink shrimpspawning in late spring and early summer (Table 9.1). <strong>Shrimp</strong> are transported by watercirculation throughout the estuary and back into the ocean. Water quality in estuarine watersaffects viability <strong>of</strong> shrimp populations.59
Table 9.1.Spawning seasons for Penaeid shrimp species in North Carolina (Pattilo et al.1997).SpeciesBrown shrimpPink shrimpWhite shrimpSpawning seasonFeb-AprApr-JulMay-JulWetlandsWetlands are defined by federal regulations [40 CFR 230.3(t)] and EMC rules [15ANCAC 2B .0202(71)] as areas that are inundated or saturated by an accumulation <strong>of</strong> surface orgroundwater at a frequency and duration sufficient to support, under normal conditions, aprevalence <strong>of</strong> vegetation typically adapted for life in saturated soil conditions. Estuarinewetlands, which include salt and brackish marsh and estuarine shrub/scrub, generally occursalong the edge <strong>of</strong> estuaries and sounds. Riverine wetlands, which includes freshwatermarshes, bottomlands hardwood forest and swamp forest, generally occurs in low-salinity t<strong>of</strong>resh water along streams, creeks, and rivers. It is estimated that over 95% <strong>of</strong> commerciallyharvested finfish and invertebrates in the United States are wetland dependent, a strongindication <strong>of</strong> their high habitat value (Feierabend and Zelanzy 1987).The combination <strong>of</strong> shallow water and thick vegetation provides excellent nursery andforaging habitat for juvenile shrimp and many other fish species (Graff and Middleton 2003).Shallow wetlands also provide refuge from large fish predators and a safe corridor for migrationto other habitats within the system (Rozas and Odum 1987; Mitsch and Gosselink 1993).Riparian wetlands are also highly effective and well recognized for their ability to trap and filterpollutants from upland run<strong>of</strong>f, and store, spread, and slow stormwater run<strong>of</strong>f prior to enteringsurface waters (Mitsch and Gosselink 1993).Primary production in salt/brackish marshes is converted into shrimp production in twoways. Wetland plants decay into detritus, which accumulates in the wetlands and adjacent s<strong>of</strong>tbottom areas and is a food source for shrimp and other small organisms. Also, nutrients fromthe broken down organic matter support growth <strong>of</strong> benthic microalgae on, between, and nearwetland vegetation (Peterson and Howarth 1987). Productivity in riverine forested wetlands inNorth Carolina is reported to be lower than in estuarine marsh (Brinson 1977). It is estimatedthat 45% <strong>of</strong> salt marsh production is exported to the estuarine system in the form <strong>of</strong> detritus,dissolved organic matter, and transient fish, including shrimp (Teal 1962).<strong>Shrimp</strong> are considered critically linked to marsh edge habitat (SAFMC 1998; Clark et al.2004). Studies in Texas estuaries have documented that juvenile brown shrimp and whiteshrimp were more abundant along the salt/brackish marsh edge than in shell bottom, SAV, s<strong>of</strong>tbottom, or inner marsh (Minello 1999; Rozas and Zimmerman 2000). Turner (1977) found apositive relationship between commercial yields <strong>of</strong> penaeid shrimp and the area <strong>of</strong> intertidalvegetation present at multiple estuarine locations. This suggests that preserving existingcoastal wetlands and restoring former wetlands, where possible, would be directly beneficial toshrimp populations and harvest.Coastal wetlands were mapped by DCM in 1994 and are shown in Figures 9.1 a-c, alongwith distribution <strong>of</strong> juvenile shrimp. Riparian wetlands covered 7% <strong>of</strong> the land in coastal riverbasins, and riverine forested wetlands were the most abundant type. The Cape Fear, Neuse,and Albemarle river basins have the largest acreage <strong>of</strong> riparian wetlands, primarily riverine60
wetlands. Pamlico, Core, and Bogue sounds, and estuaries south <strong>of</strong> Bogue Sound, have thehighest percentages <strong>of</strong> estuarine wetlands. The largest acreage <strong>of</strong> salt/brackish marsh is in thePamlico Sound region.Distribution, size, and abundance <strong>of</strong> shrimp are monitored in the juvenile fish samplingprogram (Program 120) and the shrimp sampling program (Program 510). The distribution andabundance <strong>of</strong> juvenile brown, white, and pink shrimp in estuarine waters can be seen in Figures9.1 a-c. The sampling gear <strong>of</strong> the two programs differs slightly, but results are shown togetherto spatially depict general distribution patterns. The majority <strong>of</strong> shrimp are collected in closeproximity to shallow wetland systems. Brown shrimp are widely distributed throughout NorthCarolina’s estuaries in both low and high salinity areas, and support relatively higherconcentrations in the Neuse tributaries, Core Sound, Stump Sound, and Intracoastal Waterwayin Brunswick County. White shrimp abundance is most concentrated in the Cape Fear Riverestuary, Brunswick County estuaries, New River, and tributaries along the western shoreline <strong>of</strong>Pamlico Sound, north <strong>of</strong> the Tar-Pamlico River. Pink shrimp occur in relatively lowerconcentrations along the western shoreline <strong>of</strong> Pamlico Sound, Bogue Sound, New River, lowerCape Fear River, and Intracoastal Waterway in Brunswick County. However, current DMFsampling locations do not target the primary nursery grounds <strong>of</strong> pink shrimp, and therefore, maynot accurately represent juvenile pink shrimp distribution and abundance.It is estimated that as much as 34-50% <strong>of</strong> North Carolina’s original wetland coveragehas been lost, primarily due to ditching, channelization, and filling for agriculture anddevelopment (Dahl 1990; DWQ 2000). According to the North Carolina <strong>Division</strong> <strong>of</strong> WaterQuality (DWQ 2000), approximately 88% <strong>of</strong> salt/brackish marsh, 81-88% <strong>of</strong> riverine forestedwetlands, and 48% <strong>of</strong> pocosins remain. From the early 1800s to the early 1900s, ditching anddraining for agriculture accounted for the majority <strong>of</strong> wetland losses (Heath 1975). From 1950to the 1990s, conversion <strong>of</strong> wetlands to managed forest and agriculture accounted for 53% and42%, respectively, with commercial and residential development activities responsible for theremaining 5% (Bales and Newcomb 1996). Since 1990, losses from agriculture and forestrydecreased, but losses from development increased. The primary threats to wetland habitattoday are dredging, filling, and hydrological alterations associated with development. Althoughthe rate <strong>of</strong> wetland loss has slowed, losses continue to occur. Mitigation for permitted lossesand voluntary restoration efforts in some areas have partially <strong>of</strong>fset some recent losses.61
Figure 9.1a.Distribution <strong>of</strong> riparian wetlands and juvenile brown shrimp abundance from DMF juvenile fish and shrimpsampling programs, 1978-2003.62
Figure 9.1b.Distribution <strong>of</strong> riparian wetlands and juvenile white shrimp abundance from DMF juvenile fish and shrimpsampling programs, 1978-2003.63
Figure 9.1c.Distribution <strong>of</strong> riparian wetlands and juvenile pink shrimp abundance from DMF juvenile fish and shrimpsampling programs, 1978-2003.64
One activity that has a cumulative impact on wetlands is estuarine shorelinestabilization. Hardened estuarine shorelines cause gradual, long-term wetland loss by limitingsediment inputs needed for maintenance and expansion <strong>of</strong> wetlands, and by blocking landwardmigration as sea level rises. Garbisch et al. (1973) showed that marsh vegetation waterward <strong>of</strong>bulkheads experienced a 63% post-construction mortality due to stress from increasedturbulence and scour resulting from vertical hardened structures. Scouring action at the toe <strong>of</strong>bulkheads also deepened the adjacent water, thus reducing or eliminating intertidal habitat.The added turbulence at the base <strong>of</strong> bulkheads and deepened water depth prevents vegetationfrom reestablishing after construction (Knutson 1977). Several studies have found thatabundance <strong>of</strong> shrimp and other organisms adjacent to bulkheaded shorelines was much lessthan what occurred adjacent to unaltered naturally vegetated shorelines (80-300% less) (Mock1966; Gilmore and Trent 1974; Peterson et al. 2000). The difference was attributed to lowerabundance <strong>of</strong> organic detritus and small benthic invertebrates, deeper water, and less intertidalvegetation.Ongoing initiatives such as wetland restoration, land acquisition and preservation, andagricultural cost-share BMPs (Best Management Practices) need to be enhanced. Thereshould also be additional initiatives implemented to protect and enhance wetland habitat. Themany fishery and water quality functions provided by wetlands make their preservation andrestoration along North Carolina’s coast a high priority for protection <strong>of</strong> all coastal fish habitats.S<strong>of</strong>t bottomS<strong>of</strong>t bottom habitat is unconsolidated, unvegetated sediment that occurs in freshwater,estuarine, and marine systems. Sediment composition varies with geomorphology and locationwithin the system and may be a factor in juvenile shrimp distribution. Juvenile white shrimpprefer shallow muddy substrate. In contrast, juvenile brown shrimp prefer peat and muddybottoms but also occur where the bottom is composed <strong>of</strong> sand, silt, clay, or shell fragments(SAFMC 1993). Although s<strong>of</strong>t bottom habitat is defined as “unvegetated” and lacks visiblestructural habitat, the surface sediments support an abundance <strong>of</strong> microscopic plants (benthicmicroalgae) and numerous burrowing animals hidden below the surface.S<strong>of</strong>t bottom plays a very important role in the ecology <strong>of</strong> estuarine ecosystems as astorage reservoir <strong>of</strong> nutrients, chemicals and microbes. Biogeochemical processing andrecycling establishes a filter to trap and reprocess natural and human-induced nutrients andtoxic substances or release them into the water column (Matoura and Woodward 1983),allowing chemicals to pass quickly or over several seasonal cycles through the estuary (Uncleset al. 1988). S<strong>of</strong>t bottom also provides a rich food base for juvenile and adult shrimp due to thenumerous plants and animals living on and in the sediment (Peterson and Peterson 1979;Currin et al. 1995). At different life stages, shrimp feed on various organisms in bottomsediments, including micr<strong>of</strong>auna such as protozoans, mei<strong>of</strong>auna, such as nematodes andcopepods, and macr<strong>of</strong>auna such as amphipods, polychaetes, and other crustaceans (Petersonand Peterson 1979). Once shrimp enter ocean waters, they continue foraging on subtidalbottom, particularly on muddier bottom. Although there is little structure to hide behind, shrimpcan find refuge from predators by remaining on very shallow flats that predators cannot accessor by burrowing beneath s<strong>of</strong>t bottom during the day, and actively foraging and moving at night(Peterson and Peterson 1979; Ross and Epperly 1985).S<strong>of</strong>t bottom also plays a key role as a nursery area for shrimp. Primary nursery areasfor juvenile brown, white, and to a lesser extent pink shrimp, include shallow s<strong>of</strong>t bottom habitat,usually adjacent to wetlands (Noble and Monroe 1991). Most larval settlement occurs in the65
uppermost portion <strong>of</strong> shallow creek systems. Areas that have been documented to consistentlysupport large numbers <strong>of</strong> juvenile shrimp and other species have been designated by the MFCas Primary Nursery Areas (Figure 9.2a-b). For 1990-2003, data from DMF’s ongoing juvenilefish monitoring program indicate that brown shrimp is one <strong>of</strong> the most abundant species foundalong the entire coast, along with spot, Atlantic croaker, pinfish, bay anchovy, blue crab, silverperch, and Atlantic menhaden. In the southern portion <strong>of</strong> the coast, white shrimp were alsoamong the most abundant species (DMF, unpub. data). During 1990-2003, a total <strong>of</strong> 178species was collected from juvenile sampling stations (DMF, unpub. data). Consequently,protection <strong>of</strong> these areas is a high priority for shrimp management, as well as other species.The loss <strong>of</strong> structured habitats, such as SAV and shell bottom, over time, has most likelyled to gains in the amount <strong>of</strong> s<strong>of</strong>t bottom habitat, but it may be <strong>of</strong> lower quality in some areas iftoxins have accumulated in the sediment. Activities that lead to the deepening, loss, orchemical contamination <strong>of</strong> shallow and intertidal habitat are the greatest threat to this habitat.Refer to the water quality section for more information on chemical contamination <strong>of</strong> bottomsediments.S<strong>of</strong>t bottom habitat may be affected by marina and dock facilities through alteration <strong>of</strong>the shoreline configuration, circulation patterns, and subsequently, changes in bottom sedimentcharacteristics (Wendt et al. 1990). Because benthic microalgae, an important component <strong>of</strong>primary production in s<strong>of</strong>t bottom habitat, are light-dependent, bottom sediments in dredgedmarinas will have reduced light availability due to the deeper water depth and shading fromdocking structures. A study estimating macroalgae and microalgae productivity before and afterconstruction <strong>of</strong> a marina in Long Island Sound found that microalgae production on s<strong>of</strong>t bottomwould decline by 48% post-construction and macroalgae production would decline by 17%(Ianuzzi et al. 1996). However, the authors concluded that some <strong>of</strong> this loss would be <strong>of</strong>fset byadditional microalgal production on hard structures in the marina. Operation <strong>of</strong> a marina canalso affect productivity <strong>of</strong> the s<strong>of</strong>t bottom community due to introduction <strong>of</strong> heavy metals,hydrocarbons, and bacteria (Chmura and Ross 1978; Marcus and Stokes 1985; Voudrias andSmith 1986). Heavy metals and hydrocarbons are toxic to many s<strong>of</strong>t bottom dwellinginvertebrates and benthic feeding fish (Weis and Weis 1989). Dissolved oxygen (DO) maybecome depleted or below optimum thresholds in dredged marina basins and channels. ANorth Carolina marina study found significantly lower DO concentrations (less than 5.0 mg/l)inside some marinas compared to samples from outside marinas (DEHNR 1990). Cumulatively,docks may also negatively impact shrimp populations (Sanger and Holland 2002). Research isneeded to better assess the impacts <strong>of</strong> multiple docks on shrimp and other species.66
Figure 9.2a. <strong>Shrimp</strong> nursery areas, including MFC designated nursery areas and SAV beds, northern coast <strong>of</strong> NC.67
Figure 9.2b.<strong>Shrimp</strong> nursery areas, including MFC designated nursery areas and SAV beds, southern coast <strong>of</strong> NC.68
In addition to impacting wetlands, estuarine shoreline stabilization can degrade s<strong>of</strong>tbottom habitat by reducing or eliminating the intertidal zone, deepening shallow s<strong>of</strong>t bottomhabitat, or contaminating sediment from leaching <strong>of</strong> toxic preservatives from wood structures(Weis et al. 1998). Multiple studies have shown that the diversity and abundance <strong>of</strong>invertebrates and juvenile fish over s<strong>of</strong>t bottom are reduced adjacent to bulkheaded areas(Mock 1966; Ellifrit et al. 1972; Gilmore and Trent 1974; O’Rear 1983; Byrne 1995; Peterson etal. 2000; Waters and Thomas 2001). Beach nourishment along ocean shorelines can alter thesediment composition <strong>of</strong> nearshore s<strong>of</strong>t bottom to a condition less favorable for shrimp or resultin a temporary reduction in food availability (Hackney et al. 1996). Local fishermen have noteda shift in shrimp distribution to waters further <strong>of</strong>fshore at Carolina Beach and Wrightsville Beach,where storm damage reduction projects have been ongoing for many years. This change maybe associated with a shift in sediment composition from muddy to sandy substrate.While MFC rules are designed to minimize commercial fishing gear impacts to fisherieshabitat, these restrictions primarily focus on restricting the use <strong>of</strong> highly destructive bottomdisturbing gear from most structural habitats such as oyster or SAV beds. S<strong>of</strong>t bottom habitat,because <strong>of</strong> its low structure and dynamic nature, has historically been considered the mostappropriate location to use bottom disturbing gear. Existing fishery rules that restrict bottomdisturbing gears in s<strong>of</strong>t bottom habitat include prohibition <strong>of</strong> trawls, dredges, and long haulseines in PNAs, [15A NCAC 3N .0104] and prohibition <strong>of</strong> trawls, or mechanical shellfish gear incrab spawning sanctuaries [15A NCAC 3L .0205] in the five northern-most inlets <strong>of</strong> NorthCarolina during the blue crab spawning season (March-August).Fishing gears documented to have the greatest potential to damage or degrade s<strong>of</strong>tbottom or other habitats are dredges, followed by trawls (DeAlteris et al. 1999; Collie et al.2000). Bottom trawling is used more extensively than dredging on s<strong>of</strong>t bottom habitat in bothestuarine and coastal ocean waters. <strong>Shrimp</strong> trawling accounts for the majority <strong>of</strong> bottomtrawling effort in North Carolina. The effect <strong>of</strong> bottom trawls on s<strong>of</strong>t bottom and other habitats isdiscussed separately in an issue paper (Effects <strong>of</strong> shrimp trawling on habitat).Various types <strong>of</strong> dredges used on s<strong>of</strong>t bottom habitat in North Carolina cause similarbottom disturbance: crab dredges, oyster dredges, and hydraulic clam dredges. Because <strong>of</strong> thegears’ teeth, crab and oyster dredges can dig deep into the sediment and cause extensivesediment disturbance. Mechanical methods for the taking <strong>of</strong> crabs is prohibited in designatedCrab Spawning Sanctuaries from March through August. Although the amount <strong>of</strong> fishing effortis low, this gear is documented to cause significant damage (DeAlteris et al. 1999; Collie et al.2000).Hydraulic clam dredging, as well as clam “kicking”, a specialized type <strong>of</strong> trawl, createstrenches and mounds <strong>of</strong> discarded material in s<strong>of</strong>t bottom habitat, redistributing andresuspending sediment (Adkins et al. 1983). Water jets from the hydraulic dredge canpenetrate 18 inches into bottom sediments, and uproot any biotic structure present (Godcharles1971). Dredge tracks can remain present from a few days to more than one year, andrecolonization by vegetation can take months to begin. Recruitment <strong>of</strong> clams and other benthicinvertebrates does not appear to be affected by hydraulic dredging (Godcharles 1971).Because <strong>of</strong> the severe impacts to habitats, both hydraulic clam dredging and clam kicking arerestricted to open sand and mud bottoms, usually deeper waters, including areas frequentlydredged as navigational channels. Overwintering pink or white shrimp could potentially beaffected by this activity, although they usually overwinter in shallow vegetated areas. However,Freeman (1988) examined the effects <strong>of</strong> clam kicking on pink shrimp in Core Sound and foundno significant differences in mean CPUE between an area opened to mechanical harvest and69
an area closed to mechanical harvest.SAVSubmerged aquatic vegetation (SAV) is bottom that is recurrently vegetated bysubmerged, rooted vascular plants (roots, rhizomes, leaves, stems, or propagules), as well astemporarily unvegetated areas between vegetated patches (Street et al. 2005). Submergedaquatic vegetation occurs in both subtidal and intertidal zones and may be colonized byestuarine species, such as eelgrass (Zostera marina), shoalgrass (Halodule wrightii), orwidgeon grass (Ruppia maritima) or freshwater species, such as wild celery (Vallisneriaamericana) and sago pondweed (Potamogeton pectinatus). Under MFC rules, SAV is a CriticalHabitat Area [MFC rule 15A NCAC 03I .0100 (b)(20)].SAV enhances the ecosystem by stabilizing and trapping sediment, reducing waveenergy and cycling nutrients within the system (Thayer et al. 1984). The three-dimensionalstructure provides a surface for small plants and animals to attach to and provides a safe refugeand foraging area for a large number <strong>of</strong> juvenile fish and invertebrates (SAFMC 1998). Beds <strong>of</strong>SAV also produce large quantities <strong>of</strong> organic matter, which supports a complex food base fornumerous fish and other organisms (Thayer et al. 1984). Similar to wetlands, the structure <strong>of</strong>SAV grass blades provides an excellent nursery area and enhances safe corridor betweenhabitats, reducing predation (Micheli and Peterson 1999). While white shrimp may utilizefreshwater SAV to some extent, brown and pink shrimp primarily utilize estuarine SAV because<strong>of</strong> salinity preferences.Many important commercial and recreational fishery species use SAV as a nursery(Thayer et al.1984). The blades <strong>of</strong> SAV provide protection and food for post-larvae and juvenileshrimp. Of the three penaeid shrimp species, SAV is particularly critical as a nursery area forpink shrimp (Murphey and Fonseca 1995). Juvenile pink shrimp abundance was greater inestuarine SAV beds compared to s<strong>of</strong>t bottom, marsh edge, or shell bottom (Minello 1999).Brown shrimp also utilize SAV to some extent. Data from Texas estuaries suggest that brownshrimp show greater preference for SAV rather than marsh edge where both habitats occur(Clark et al. 2004). The configuration <strong>of</strong> a grass bed may also be a factor in juvenile and adultshrimp distribution (Murphey and Fonseca 1995). The juvenile fish abundance maps (Figures9.1a-c) underestimate the use <strong>of</strong> high salinity SAV by brown and pink shrimp, due to the lownumber <strong>of</strong> sampling stations in those locations. Additional sampling in SAV is needed to betterassess the relationship <strong>of</strong> SAV condition and spatial changes to shrimp enhancement.Several studies in North Carolina have shown that shrimp abundance was greater onSAV beds than on oyster beds (Ellis et al. 1996) or unvegetated s<strong>of</strong>t bottom (Murphey andFonseca 1995). These studies showed similar trends for other species as well. In Florida Bay,changes in animal abundances were compared between the 1980s and 1990s when significantloss <strong>of</strong> SAV occurred (Matheson et al. 1999). A decrease in SAV coverage appeared to resultin a decrease in abundance <strong>of</strong> small fish and invertebrates that live within the seagrass canopy(such as shrimp and pipefish), while larger demersal predatory fish (such as toadfish andsharks) increased. Similarly, increases in SAV density were characterized by significantincreases in crustaceans. In another study in Florida Bay, reductions in pink shrimp abundancewere greater in seagrass die-<strong>of</strong>f areas than in nearby undamaged or recovering areas (Robleeand DiDomenico 1992).The presence <strong>of</strong> SAV may be the reason pink shrimp can overwinter in temperate NorthCarolina and thus supports North Carolina’s spring pink shrimp harvest (T. Murphey, DMF, pers.70
com. 2003). From 1983-1989 average pink shrimp landings comprised 30% <strong>of</strong> North Carolina’stotal shrimp landings and from 1999-2003 average pink shrimp landings comprised 3% <strong>of</strong> totalshrimp landings (DMF, unpub. data). In contrast, in South Carolina and Georgia, where no SAVis present, pink shrimp comprise a negligible portion <strong>of</strong> the shrimp landings. The location <strong>of</strong>SAV beds in North Carolina is shown in Figure 9.2a-b, along with wetland dominated, MFCdesignated nursery areas.The amount <strong>of</strong> SAV in North Carolina was estimated to be between 134,000 and200,000 acres around 1990 (Orth et al. 1990; Ferguson and Wood 1994). However the currentspatial distribution and acreage <strong>of</strong> SAV may be somewhat different since some areas thathistorically supported SAV were not mapped, and changes may have occurred since the originalmapping. Along the Atlantic coast, North Carolina supports more SAV than any other state,except for Florida. The majority <strong>of</strong> SAV occurs in eastern Pamlico Sound and Core Sound inhigh salinity waters (Figure 9.2a-b). Because light is the primary limiting factor affecting itsdistribution, SAV is restricted to relatively shallow waters, usually less than 1 m in depth.Historical accounts indicate that there have been large-scale losses <strong>of</strong> SAV in NorthCarolina’s low salinity tributaries on the mainland side <strong>of</strong> Pamlico Sound and along much <strong>of</strong> theshoreline <strong>of</strong> western Albemarle Sound (North Carolina Sea Grant 1997; J. Hawkins, DMF, pers.com, 2003) while the high salinity grass beds to the east appear relatively stable (Ferguson andWood 1994). Loss <strong>of</strong> low salinity SAV habitat could negatively affect white or brown shrimp.Impacts to high salinity SAV beds could be especially detrimental to pink shrimp. Protection,enhancement, and restoration <strong>of</strong> this habitat are high priorities for sustained shrimp populations.The greatest threat to SAV is large-scale nutrient enrichment and sediment loading,which increases turbidity, reduces light penetration, and subsequently impacts SAV growth,survival, and productivity (Goldsborough and Kemp 1988; Kenworthy and Haunert 1991;Funderburk et al. 1991; Stevenson et al. 1993). Catastrophic losses <strong>of</strong> seagrass beds havebeen correlated with these water quality problems in other states in the past (Twilley et al. 1985;Orth et al. 1986; Durako 1994). Nutrient enrichment and/or increased sediment loads impactSAV growth, survival, and productivity by increasing chronic turbidity in the water column fromsuspended sediment or phytoplankton associated with algal blooms. Also, sediment, epiphytes,or drift algae can cover the surface <strong>of</strong> blades (Dennison et al. 1993; SAFMC 1998; Fonseca etal. 1998). Elevated nitrogen concentrations have also been shown to be toxic to eelgrass(Burkholder et al. 1992). In North Carolina, most <strong>of</strong> the low salinity areas that have experiencedlarge reductions in SAV coverage (Tar-Pamlico River and Neuse River) are also designatedNutrient Sensitive Waters. Once SAV is lost, increased turbidity and sediment destabilizationcan result in accelerated shoreline erosion and make recolonization more difficult (Durako 1994;Fonseca 1996). Therefore prevention <strong>of</strong> any additional SAV loss through water qualitymaintenance and improvement is a high priority for shrimp management.Increased sediment and nutrient loading in the water column can enter coastal watersfrom point source discharges, nonpoint stormwater run<strong>of</strong>f, or resuspension <strong>of</strong> bottom sediments.Specific sources that contribute to increased sediment loading include construction activities,unpaved roads, road construction, golf courses, uncontrolled urban run<strong>of</strong>f, mining, silviculture,row crop agriculture, and livestock operations (DWQ 2000). Urbanization can increase the flowand velocity <strong>of</strong> stormwater run<strong>of</strong>f, which in turn leads to increased stream bank erosion. Streambank erosion is a significant source <strong>of</strong> sediment loading (DWQ 2000). Specific sources thatcontribute to increased nutrient loading include agricultural and urban run<strong>of</strong>f, wastewatertreatment plants, forestry activities, and atmospheric deposition. Nutrients in point sourcedischarges are primarily from human waste and industrial processes. The primary contributors71
<strong>of</strong> nutrients from non-point sources are fertilizer and animal wastes (DWQ 2000).In addition to effects from water quality degradation, SAV can be removed or damagedby water-based activities. Dredging for navigational channels, marinas, or infrastructure suchas bridges, submarine pipelines, or cables can result in large, direct losses <strong>of</strong> SAV. Docksconstructed over SAV can cause immediate loss during construction or gradual loss due toshading effects. Several studies in Florida have shown that SAV was significantly reduced oreliminated under and around docks that were less than 5.5 ft about mean high water or wherelight received was less than 14% <strong>of</strong> the surface light availability (L<strong>of</strong>lin 1995; Shafer 1999). Inaddition to direct damage from docks and marinas, indirect damage to SAV can result fromboating activity associated with these structures. Shoals and other shallow bottoms supportingSAV may become scarred as boating activity to and from the docking areas increases. Boatwakes can destabilize and erode SAV beds, or resuspend sediment, reducing light penetration.As additional docks and marinas are constructed along the coast, the potential for boatingrelateddamage increases.Along the southeast coast <strong>of</strong> Florida, there are stringent standards for dock constructionto minimize impacts to SAV, including dock height above the water, minimum water depth, andmaximum square footage. In North Carolina, the depth <strong>of</strong> water at the dock end is notconsidered in Coastal Resource Commission (CRC) rules. To minimize shading effects towetland plants, CRC rules require a dock height <strong>of</strong> at least three feet (0.91 m) above thewetland substrate, and a pier width <strong>of</strong> no greater than six feet (1.83 m) [CRC rule 15A NCAC07H.0208 (6)]. However, there is no requirement for height above the water surface. Resultsfrom Connell and Murphey (2004) indicate that current dock designs over SAV beds in NorthCarolina result in a reduction in SAV coverage and density. Dock criteria should be evaluatedby CRC to determine if existing requirements are adequate for SAV survival and growth andwhat changes would be needed to allow adequate light beneath docks. The permitrequirements for docks and piers may need to be changed accordingly.Several bottom disturbing fishing gears have the potential to destroy or damage SAV.The DMF issued a report on shrimp and crab trawling impacts (DMF 1999). Also, the <strong>Fisheries</strong>Moratorium Steering Committee’s Habitat Subcommittee identified specific habitat impacts fromvarious commercial and recreational fishing gears used in North Carolina waters, and maderecommendations to minimize such impacts (MSC 1996). The <strong>Fisheries</strong> Moratorium SteeringCommittee presented the summary <strong>of</strong> findings to the Joint Legislative Commission on Seafoodand Aquaculture <strong>of</strong> the General Assembly. Fishing gear found to be potentially damaging toSAV is listed in Table 9.2.72
Table 9.2.Fishing gears used in North Carolina identified as potentially damaging tosubmerged aquatic vegetation habitat. [Source: MSC 1996]Severe damage Moderate damage Low damage or unsureOyster dredge Crab trawl Long haul seineCrab dredge Clam Tongs Otter trawlHydraulic clam dredgeClam hand rakeClam trawl (kicking)Bay scallop dredge (very little)Bull rakeDamage from fishing gear varies in severity. Hand gear, such as bull rakes and largeoyster tongs, can uproot SAV and cause substantial damage, but generally to smaller areasthan mechanical gears (Thayer et al. 1984). Current MFC rules prohibit use <strong>of</strong> rakes more thantwelve inches wide or weighing more than six pounds SAV [MFC rule 15A NCAC 03K.0304 (a)(2)]. Use <strong>of</strong> hand rakes and clamming by hand are allowed.Mobile gear, such as long haul seines or bottom trawls, can shear or cut the blades <strong>of</strong>SAV, or uproot plants without major disruption <strong>of</strong> the sediment (ASMFC 2000). Shearing <strong>of</strong>above-ground plant biomass does not necessarily result in mortality <strong>of</strong> SAV, but productivity isreduced since energy is diverted to replace the damaged plant tissue, and the nursery andrefuge functions are reduced in the absence <strong>of</strong> structure. Other fishing practices can causesevere disruption <strong>of</strong> the sediment and damage the roots <strong>of</strong> SAV. Gears that disturb thesediment and below-ground plant structures, like toothed dredges, heavy trawls, and boatpropellers, may cause total loss <strong>of</strong> SAV in the affected area, requiring extensive time to recover(ASMFC 2000). SAV can also be buried by excessive sedimentation associated with trawling,dredging, and propeller wash. High turbidity from use <strong>of</strong> bottom-disturbing fishing gear canreduce water clarity, affecting SAV growth, productivity, and in some cases, survival (ASMFC2000).All toothed dredges can cause severe damage when pulled through SAV. Becauseoyster dredges, crab dredges, and hydraulic clam dredges severely impact bottom structure,there are strict limits on their use in North Carolina. Use <strong>of</strong> crab dredges is restricted to an areain northern Pamlico Sound southwest <strong>of</strong> Oregon Inlet [MFC rule 15A NCAC 03R.0109] thatexcludes SAV beds. Use <strong>of</strong> oyster dredges is currently restricted to parts <strong>of</strong> Pamlico Sound andits tributaries (Figure 9.3a-c). The majority <strong>of</strong> high salinity SAV occurs in areas wheremechanical methods for oyster harvesting are prohibited. However, brackish and freshwaterSAV in western Pamlico Sound is generally unprotected from dredging, except in PNAs andSNAs. Submerged aquatic vegetation will not be able to recolonize areas that historicallysupported SAV if they continue to be dredged. Oyster dredging should be prohibited from someshallow waters along the Albemarle-Pamlico shoreline that historically supported SAV, to allowfor restoration and expansion <strong>of</strong> SAV in those areas.Clam kicking can also severely impact SAV since substrate is displaced by propellerbackwash (Guthrie and Lewis 1982). Peterson and Howarth (1987) found that clam kickingsignificantly reduced plant biomass in eelgrass and shoalgrass beds. It is likely that SAV wasdamaged by kicking in the past since this technique has been used in North Carolina for over 60years, effort was high in areas known to support SAV (Carteret County), and kicking vesselstended to operate in shallow waters (Guthrie and Lewis 1982). Because <strong>of</strong> the severedisturbance to the bottom, clam kicking is restricted to sandy bottom, in waters more than 10 ftdeep, in Core and Pamlico sounds, and Newport, North, New, and White Oak rivers. Thefishery is managed intensively, with strong enforcement to prevent clam kicking outside the73
designated areas. Much <strong>of</strong> the designated mechanical clamming areas have SAV in closeproximity to them, so vessels that fish illegally outside the open areas may severely impactSAV. Turbidity generated by clam kicking may also affect adjacent SAV beds. High salinitySAV species are more likely to be impacted by mechanical clamming practices due to thelocation <strong>of</strong> the fishery.Bay scallop dredges, in contrast to oyster and crab dredges, cause less severe damageto SAV because they are smaller [not over 50 lb (22.68 kg)] and have no teeth. They areintended to glide along the substrate surface, taking bay scallops lying on the surface withinSAV beds. Most damage observed by DMF staff has not been from the dredge, but frompropeller scarring while pulling the dredge, particularly when the season opening coincides withlow tide (T. Murphey, DMF, pers. com., 2002). To reduce SAV impacts, DMF allows handharvest methods for bay scallops early in the season, followed by proclamations to open scallopdredging later in the season, starting on a high tide. This management practice minimizesdamage to SAV from propeller scarring by dredging vessels (T. Murphey, DMF, pers. com.,2002).Fishery restrictions already exist for most <strong>of</strong> the gears used in North Carolina that arepotentially damaging to SAV. Additional law enforcement may be needed to enforce buffersaround SAVs. In addition, the boundaries <strong>of</strong> areas where dredging or trawling is allowed shouldbe evaluated and adjusted, if necessary, to adequately protect all SAV beds and provide abuffer <strong>of</strong> unvegetated area to reduce turbidity impacts. Because <strong>of</strong> the location and magnitude<strong>of</strong> fishing effort and SAV beds, it appears that trawling in Core and Bogue sounds has thegreatest potential for significant fishing gear impacts on existing SAV beds. The effect <strong>of</strong>trawling on habitat is discussed in a separate issue paper (Section 10.1.3).74
Figure 9.3a. Areas where mechanical oyster gears and bottom trawling are prohibited in the Pamlico Sound system.75
Figure 9.3b. Areas where mechanical oyster gears and bottom trawling are prohibited in central coastal areas.76
Figure 9.3c. Areas where mechanical oyster gears and bottom trawling are prohibited in southern central coastal areas.77
Shell bottomShell bottom habitat is estuarine intertidal or subtidal bottom having concentrations <strong>of</strong>shell, including living or dead oysters (Crassostrea virginica), hard clams (Mercenariamercenaria), or other shellfish (Street et al. 2005). In the 1990s, fisheries managementagencies began to formally recognize shell bottom habitat as critical to fisheries production.The North Carolina <strong>Marine</strong> <strong>Fisheries</strong> Commission (MFC), South Atlantic Fishery ManagementCouncil (SAFMC), and Atlantic States <strong>Marine</strong> <strong>Fisheries</strong> Commission (ASMFC) all recognize theimportance <strong>of</strong> shell bottom.Common terms used to describe shell bottom habitats in North Carolina are “oysterbeds,” “oyster rocks,” “oyster reefs,” “oyster bars,” and “shell hash.” Shell hash is a mixture <strong>of</strong>sand or mud with gravel and/or unconsolidated broken shell (clam, oyster, scallop, and/or othershellfish). Shell bottom is enhanced in some areas by the addition <strong>of</strong> cultch material. Cultchmaterial (hard material to which oysters attach) can consist <strong>of</strong> oyster, clam, or scallop shells;gravel or marl; or other hard materials. Cultch exists naturally, as shell hash and oyster rocks.DMF’s Shellfish Rehabilitation Program staff also plant cultch to enhance and restoreestuarine shell bottom for oyster and hard clams.Shell bottom is both intertidal and subtidal, and can consist <strong>of</strong> fringing or patch reefs(Coen et al. 1999). Intertidal oyster reefs in the central and southern estuarine systems mayonly be a few oysters thick. However, subtidal oyster mounds in Pamlico Sound may have beenseveral meters tall (Lenihan and Peterson 1998). In North Carolina, oysters attach to andaccumulate on existing oyster beds, other shell, outcroppings <strong>of</strong> fossil shell beds, exposedSpartina roots, pilings, and rip-rap (DMF 2001). Intertidal oyster reefs in North Carolina mayoccur along the edges and points <strong>of</strong> salt marsh, between salt marsh and seagrass beds, or asisolated reef features, away from other structure (Grabowski et al. 2000).Shell bottom provides many important functions that enhance the health <strong>of</strong> the entireecosystem for fishery and non-fishery species. Oysters filter sediment and pollutants from thewater column, enhancing water quality and improving conditions for SAV growth (Coen andLuckenbach 1998). The hard multi-faceted shell structure aids in reducing wave energy,stabilizing sediment, and reducing shoreline erosion (Lowery and Paynter 2002). Oysters, likeSAV and benthic microalgae, facilitate storage and cycling <strong>of</strong> nutrients. This process reducesthe likelihood <strong>of</strong> coastal eutrophication and its detrimental effects on fish and fisheries. Oysterbeds also increase shoreline complexity, modify circulation patterns, and enhance fish use <strong>of</strong>marsh edge habitat (Grabowski et al. 2000).The complex three-dimensional structure provides protective cover for juvenile and adultshrimp. The shell structure also provides an area for small plant and invertebrate attachment,which shrimp may feed on or hide among (Meyer et al. 1996; Lenihan and Peterson 1998; Coenet al 1999). However, predatory finfish around the reefs feed, in part, on penaeid shrimp(Grabowski et al. 2000). Fringing shell bottom or shell hash also serves as a nearshore corridorbetween habitats such as salt marsh and SAV, which shrimp also utilize (Coen et al. 1999;Micheli and Peterson 1999).Brown, white, and pink shrimp have been documented to utilize shell bottom habitat inSouth Carolina and Texas estuaries (Coen and Luckenbach 1998; Zimmerman et al. 1989),although shell bottom does not appear to be the preferred habitat, compared to salt marsh edgeor SAV (Minello 1999). In North Carolina, some studies indicate use <strong>of</strong> oyster beds by pink,white, and brown shrimp (Meyer et al. 1996; Grabowski et al. 2000; Lenihan et al. 2001).78
Analysis <strong>of</strong> these studies in Peterson et al. (2003) concluded that pink, white, and brown shrimpwere not recruitment or growth enhanced by the presence <strong>of</strong> shell bottom. In sounds and thelower portions <strong>of</strong> estuaries where SAV is not present, shell bottom may be more critical topenaeid shrimp. In addition, the ecosystem benefits provided by the habitat would still indirectlyenhance shrimp populations.Oysters are found along a majority <strong>of</strong> the North Carolina coast from extremesoutheastern Albemarle Sound to the estuaries <strong>of</strong> the southern part <strong>of</strong> the state to the SouthCarolina border (DMF 2001). Oyster reefs occur at varying distances up North Carolina’sestuaries, depending upon salinity, substrate, and flow regimes. In the wind-driven PamlicoSound system north <strong>of</strong> Cape Lookout, oyster reefs consist overwhelmingly <strong>of</strong> subtidal beds.South <strong>of</strong> Cape Lookout, subtidal rocks also occur in the New, Newport, and White Oak rivers(DMF 2001). Extensive intertidal oyster rocks occur in North Carolina’s southern estuaries,where the lunar tidal ranges are higher. Substantial shell hash is present in New River, easternBogue Sound, and along the edges <strong>of</strong> many streams and channels, such as portions <strong>of</strong> theAtlantic Intracoastal Waterway (ICW) in the southern coastal area. In the Albemarle-Pamlicoestuary, oysters are concentrated in the lower portion <strong>of</strong> Pamlico Sound tributaries, along thewestern shore <strong>of</strong> Pamlico Sound, and to a lesser extent, behind the Outer Banks (Epperly andRoss 1986).The current distribution <strong>of</strong> shell bottom is much less than what historically occurred(Newell 1988). Mechanical harvesting <strong>of</strong> oysters (oyster dredging) was the primary and initialcause <strong>of</strong> habitat loss (DMF 2001). Most shell bottom losses have been to subtidal beds inPamlico Sound, where DMF has also found declines in oyster recruitment. Althoughmechanical harvesting <strong>of</strong> oysters has been greatly restricted, reefs have not recovered, possiblydue to stress from water quality degradation and increased occurrence <strong>of</strong> disease (Dermo,MSX) (DMF 2001). Oyster dredging removes oysters and reduces the vertical pr<strong>of</strong>ile <strong>of</strong> oysterrocks, increasing the susceptibility <strong>of</strong> remaining shell bottom at that location to low DO andpossible mortality (Lenihan and Peterson 1998; Lenihan et al. 1999). Although commercialoyster dredging has been greatly reduced, current activities continue to reduce and degrade ahabitat that is utilized by shrimp. Hand harvest methods for oysters and clams can also bedestructive, but on a much smaller scale. Other bottom disturbing fishing gears, such as trawls,prevent the re-establishment <strong>of</strong> oyster reefs within their historic range.Other causes <strong>of</strong> shell bottom losses include dredging for navigation channels or marinabasins. These activities can physically remove or damage existing shell bottom or result inturbidity that clogs oyster gills or covers sediment completely. Hydrologic modifications in theNeuse and Pamlico rivers have decreased salinity in the downstream portions <strong>of</strong> those riversand resulted in a downstream displacement <strong>of</strong> oysters since the 1940s (Jones and Sholar1981). While drainage for agriculture has changed little in recent years, drainage forurban/suburban development is increasing steadily.9.2 Water QualityAdequate water quality is necessary to maintain the chemical properties <strong>of</strong> the watercolumn that are needed by shrimp, as well as sustain SAV, shell bottom, and s<strong>of</strong>t bottomhabitats that support shrimp. Human activities that degrade water quality or alter water flow cannegatively impact shrimp growth or survival. For example if salinity or DO concentrations arealtered beyond the known preferences <strong>of</strong> shrimp, shrimp distribution or growth rates may beaffected. Toxins can be assimilated into shrimp tissue and alter growth and reproduction. Themost common causes <strong>of</strong> water quality use support impairment in North Carolina’s coastal river79
asins are excessive sediment loading and low DO (DWQ 2000). Hydrological modifications,low DO and toxin contamination are probably the greatest water quality concerns for penaeidshrimp.Hydrological modificationsHydrological modifications occur when streams and creeks are channelized (deepenedand straightened), dredged, or ditched to improve drainage <strong>of</strong> adjacent lands or for navigation(North Carolina Sea Grant 1997), and <strong>of</strong>ten result in increased run<strong>of</strong>f. Run<strong>of</strong>f from agriculture,urban/suburban development, and transportation infrastructure carries sediment, nutrient, andtoxic chemical pollutants (DWQ 2000). Sediment, the number one pollutant <strong>of</strong> waterways in theUnited States, clogs oyster gills and buries shells (Coen et al. 1999). Excess nutrients can fuelalgal blooms and low DO events, and in turn, cause mortality <strong>of</strong> benthic organisms on deep,subtidal shell bottom (Lenihan and Peterson 1998). Heavy metals, petroleum products,pesticides, and other toxic chemicals in the run<strong>of</strong>f can kill sensitive oyster larvae (Wendt et al.1990; Funderburk et al. 1991).Channelized streams are <strong>of</strong>ten deeper, with more extreme flows, less woody debris andless variable depth than natural streams. These changes primarily affect smaller species andearly life stages that use shallow stream margins, since these areas are reduced withchannelization. Channelization potentially affects shrimp in several ways. By removing themeanders <strong>of</strong> the channel and increasing the slope <strong>of</strong> the shoreline, water velocities in thealtered stream are higher and erosion <strong>of</strong> the shoreline and sediment loading increases. Inmany channelized streams, storm flows are confined primarily to the main channel rather thanpassing through wetlands and achieving some filtration <strong>of</strong> pollutants, deposition <strong>of</strong> sediment,and water storage. In addition, the natural woody vegetation along the sides <strong>of</strong> the stream is<strong>of</strong>ten removed in the process <strong>of</strong> channelization. Consequently, loading and movement <strong>of</strong>sediment and other nonpoint source pollutants are <strong>of</strong>ten greater in channelized sections thannatural streams, which can have negative impacts on water quality and therefore fish habitat(White 1996; EPA 2001). Nutrient concentrations, particularly for nitrogen and phosphorus, mayincrease with channelization. Elevated water velocities can also deter or prevent movement <strong>of</strong>adult and juvenile fish. In addition, spoil banks created by dredge disposal along the shorelineprevents shrimp from accessing adjacent wetlands.Several studies have found that the size, number, and species diversity <strong>of</strong> fish inchannelized streams are reduced and the fisheries associated with them are less productivethan those associated with unchannelized reaches <strong>of</strong> streams (Tarplee et al. 1971; Hawkins1980; Scho<strong>of</strong> 1980). Pate and Jones (1981) compared nursery areas that were altered andunaltered by channelization and found that brown shrimp, spot, croaker, southern flounder, andblue crab were more abundant in nursery habitats with no man-made drainage. They attributedthis reduction in organisms to the unstable salinity conditions that occurred in areas adjacent tochannelized systems following moderate to heavy rainfall (>1 inch/24 hr).Low oxygenAdequate supply <strong>of</strong> DO is critical to survival <strong>of</strong> benthic invertebrates and fish. Lowoxygenconditions (hypoxia) can occur naturally in a system from flushing <strong>of</strong> swamp waters,which characteristically have low DO, or from stratification <strong>of</strong> the water column due to wind,temperature, and salinity conditions. However, low-oxygen conditions can also be fueled byincreased stormwater run<strong>of</strong>f carrying nutrients and oxygen-consuming wastes, which result inexcessive oxygen demand in the water column or sediment. Algal blooms deplete the water80
column <strong>of</strong> DO as respiration from the dense concentrations <strong>of</strong> plants consumes oxygen at night(DWQ 2000). Dissolved oxygen can be further depleted as bacteria use oxygen to decomposethe algae’s organic material. Algal blooms may occur naturally in coastal waters or occur withgreater frequency or intensity upon inputs <strong>of</strong> nutrients. Dissolved oxygen depletion in the watercolumn occurs most <strong>of</strong>ten in summer. Warmer water holds less DO and increases microbialdecomposition. In addition, warmer water, calm winds, and reduced freshwater inflow in thesummer reduce mixing and aeration <strong>of</strong> water. The stratified bottom layer <strong>of</strong> water is preventedfrom receiving oxygenated surface waters and rapidly becomes depleted <strong>of</strong> oxygen. Shallowwater estuaries with less frequent flushing <strong>of</strong>ten develop persistent stratification and bottomwaterhypoxia that can last for weeks to months (Tenore 1972). Low oxygen events in coastalwaters <strong>of</strong> the United States are becoming more frequent, larger in extent, and longer lasting dueto increasing eutrophication (Cooper and Brush 1991; Breitberg 1992; Lenihan and Peterson1998).In freshwater streams, DWQ water quality (use support) data indicate low DO as a majorcause <strong>of</strong> impairment in the Neuse River basin (132 mi), Chowan River basin (46 mi),Pasquotank River basin (40 mi), Roanoke River basin (24 mi), Tar-Pamlico River basin (13 mi),and White Oak River basin (8 mi) (DWQ 2000). In estuarine waters, low DO was a majorsource <strong>of</strong> impairment in the Cape Fear (5,000 acres) and the Pasquotank river basins (1,125acres). In the Neuse River, recent estimates suggest that up to 30-50% <strong>of</strong> the estuarine bottomduring summer is unsuitable habitat due to hypoxia (Seldberg et al. 2001; Eby and Crowder2002). Since shrimp live on the bottom in estuaries where hypoxia and anoxia (no oxygen)have been reported to occur, the species may be negatively affected by low oxygen events.Brown shrimp and some other organisms are capable <strong>of</strong> detecting and avoiding waterswith low oxygen concentrations (Wannamaker and Rice 2000). Where shrimp had access towater with 4 or 2 mg/l DO rather than 1 mg/l DO, shrimp strongly preferred and moved to thehigher oxygenated waters. Migration <strong>of</strong> benthic organisms from hypoxic or anoxic waters canlead to high densities <strong>of</strong> organisms in oxygenated areas, increased competition, and increasedpredation by opportunistic predators (Eby and Crowder 2002; Seldberg et al. 2001). Althoughfish have the ability to migrate away from hypoxic areas and seek refuge in shalloweroxygenated waters, wind-driven circulation can rapidly transport the hypoxic bottom-water intoshallow waters, so that fish cannot escape (Paerl et al. 1998). The Neuse, Tar-Pamlico andCape Fear river basins had the largest numbers <strong>of</strong> reported fish kills in North Carolina, from1996 to 2001 (DWQ 2001), with low DO being a common cause. However, the absence <strong>of</strong>shrimp in recent reported fish kills (DWQ 2001) suggests that shrimp may successfully avoidlethal anoxic waters.Although direct mortality does not appear to be a significant factor for shrimp, prolongedperiods <strong>of</strong> hypoxia could stress and negatively impact penaeid shrimp and significantly alter theestuarine system. Studies on white shrimp found that growth rates <strong>of</strong> white shrimp werereduced in waters having less than 3.5 mg/l DO, feeding was affected in waters 2-3 mg/l DO,and oxygen uptake was reduced by 50-70% in 2 mg/l DO (Gray et al. 2002). When a benthiccommunity is severely depleted by a low oxygen event, ecological successional patterns <strong>of</strong> thebenthos are altered (Luettich et al. 1999). The various successional stages may affect orbenefit different benthic feeders to differing extents. For example, early successionalcommunities composed <strong>of</strong> very small, shallow-burrowing opportunists (capitellid worms) andmei<strong>of</strong>auna may favor small species, such as penaeid shrimp and larval and juvenile croaker andred drum, but not provide food for large adult fish species. Partially recovered benthiccommunities consisting <strong>of</strong> polychaetes and small juvenile clams could benefit demersal specieslike spot, croaker and blue crabs. A fully recovered community with deep burrowing81
polychaetes and large clams might benefit adult spot and hogchoker, but not shrimp (Luettich etal. 1999).While hypoxia and anoxia can occur naturally, they can also be attributed, in part, toanthropogenic changes in the system, including excess nutrient and organic loading from wastedischarges, nonpoint run<strong>of</strong>f, streambank erosion, and sedimentation (Schueler 1997). Oxygendepletion in the water column was positively correlated with accumulation <strong>of</strong> organic material inthe sediments (Luettich et al. 1999). Several studies have indicated that the frequency,duration, and spatial extent <strong>of</strong> low oxygen events have increased over the years due toincreasing eutrophication <strong>of</strong> coastal waters from human and animal waste discharges, greaterfertilizer use, loss <strong>of</strong> wetlands, and increased atmospheric nitrogen deposition (Cooper andBrush 1991; Dyer and Orth 1994; Paerl et al. 1995; Buzzelli et al. 2002). More information isneeded to understand consequences on the estuarine food web and to what extent anoxiaaffects the s<strong>of</strong>t bottom community. Efforts are needed to reduce anthropogenic nutrient loading,particularly in systems that have a history <strong>of</strong> hypoxia and anoxia.ToxinsWhile toxins can fluctuate between the sediment and water column, concentrations <strong>of</strong>toxic chemicals tend to accumulate in sediments at concentrations several orders <strong>of</strong> magnitudegreater than in overlying waters (Kwon and Lee 2001). The bioavailability and transport <strong>of</strong> achemical depends on the form <strong>of</strong> the chemical incorporated into the sediments, the feedinghabits and condition <strong>of</strong> aquatic organisms, and the physical and chemical conditions <strong>of</strong> theenvironment. Toxic chemicals can become active in s<strong>of</strong>t bottom sediment or overlying watersthrough several mechanisms, including resuspension from natural weather events or humanactivities, such as dredging and trawling.Toxins in sediments or the water column can affect benthic invertebrates by inhibiting oraltering reproduction or growth, or causing mortality in some situations (Weis and Weis 1989).Early life stages are most vulnerable to toxins (Funderburk et al. 1991). Becausemacroinvertebrate diversity significantly declines with increasing sediment contamination, foodresources for benthic feeders, like shrimp, may be limited in highly contaminated areas (Weis etal. 1998; Brown et al. 2000; Dauer et al. 2000). While the survival <strong>of</strong> some aquatic organisms isaffected by toxins, other organisms survive and bioaccumulate the chemicals to toxic levels,passing them along in the food chain. Multiple studies have shown clear connections betweenconcentrations <strong>of</strong> toxins in sediments and those in benthic feeding fish and invertebrates (Kirbyet al. 2001; Marburger et al. 2002). Heavy metal contamination <strong>of</strong> sediments has beendocumented to result in elevated trace metal concentrations in shrimp, striped mullet, oysters,and flounder (Kirby et al. 2001; Livingstone 2001).There is some information available on the effect <strong>of</strong> certain toxic chemicals on differentshrimp species. A study on the effect <strong>of</strong> copper, a common chemical associated with marinas,on a penaeid sprimp (Metapenaeus dobsoni) found that shrimp were tolerant to lowconcentrations <strong>of</strong> copper (0.05 mg Cu 1 super (-1)). However shrimp growth was significantlyreduced when exposed to higher concentrations (0.15 mg Cu 1 super (-1)) (Manisseri andMenon 2001). Cellular damage to the hepatopancreas also occurred to shrimp exposed to 50-150 ppb Cu (Manisseri and Menon 1995). Another study examined mercury concentrations inboth shrimp and blue crab, and found that blue crabs collected in the field with pink shrimp hadhigher mercury concentrations. The lower levels found in pink shrimp were attributed to shorterresidence times in the contaminated area, differences in feeding habits, and the ability toexcrete mercury somewhat faster (Evans et al. 2000).82
Toxic chemicals come from localized point sources, as well as from diffuse nonpointsources. Point sources include industrial and municipal waste discharges. Nonpoint sources <strong>of</strong>toxins include urban run<strong>of</strong>f containing household and yard chemicals, roadways, marinas anddocks, boating activity, run<strong>of</strong>f from agriculture and forestry, industrial emissions, spills fromindustrial shipping, and dredge spoil disposal (Wilbur and Pentony 1999).Because low concentrations <strong>of</strong> heavy metals in the water column can be easilyincorporated into fine-grained sediment, chemicals can accumulate in the sediment to toxiclevels and be resuspended into the water column (Riggs et al. 1991). Studies have shown thatfine-grained sediments are the primary reservoir for heavy metals, particularly organic rich muds(ORM) (Riggs et al. 1991). Since organic rich muds are the most extensive sediment type inNorth Carolina’s estuaries, and since many primary nursery areas are composed <strong>of</strong> ORM,resuspension <strong>of</strong> contaminated ORM sediments in PNAs is <strong>of</strong> particular concern.The extent <strong>of</strong> sediment contamination in North Carolina coastal waters is not well known.Sediment sampling is not conducted by the DWQ since there are no sediment standards in thestate. Studies examining sediment contamination at sites in North Carolina s<strong>of</strong>t bottom areashave found various levels <strong>of</strong> contamination. The EPA Environmental Monitoring andAssessment Program surveyed 165 sites within North Carolina’s sounds and rivers during 1994-1997 to evaluate condition <strong>of</strong> bottom sediments (Hackney et al. 1998). Highest contaminationlevels occurred in low salinity areas with low flushing and high river discharge. Benthicpopulations were dominated by tolerant opportunistic species and benthic communities had lowspecies richness. Laboratory bioassays showed that sediments from many sites were toxic tobiological organisms. However, because <strong>of</strong> the low sample size, frequency <strong>of</strong> sampling, and theconfounding effects <strong>of</strong> hypoxia in areas sampled, results from this study may not accuratelyassess the condition <strong>of</strong> North Carolina sediments (C. Currin, NOAA, pers. com., 2003).Concentrations <strong>of</strong> heavy metals in the Neuse and Pamlico estuaries have beenassessed (Riggs et al. 1989; Riggs et al. 1991). In the Neuse River, surface sedimentscontained elevated levels <strong>of</strong> several heavy metals, including zinc, copper, lead, and arsenic.Furthermore, 17 areas between New Bern and the mouth <strong>of</strong> the river were identified as“contaminated areas <strong>of</strong> concern”. The contaminated sites were primarily attributed to permittedmunicipal and industrial treatment plant discharges. Marinas were also found to contributesubstantial amounts <strong>of</strong> copper and variable amounts <strong>of</strong> zinc and lead. Nonpoint sources weremore difficult to evaluate. In the Pamlico River, heavy metal contamination was less severe,although arsenic, cobalt, and titanium exceeded the levels found in the Neuse River. Thesestudies suggest that sediment contamination in some estuarine areas especially those whereboth organic rich mud and waste water discharges are present, may be significant and couldaffect fish populations and the base <strong>of</strong> their food chain. To better determine if contaminatedsediment is a significant threat to shrimp habitat, the distribution and concentration <strong>of</strong> heavymetals and other toxic contaminants in freshwater and estuarine sediments need to beadequately assessed and areas <strong>of</strong> greatest concern need to be identified. Continuedminimization <strong>of</strong> point and nonpoint sources <strong>of</strong> toxic contaminants is vital for protection <strong>of</strong> theentire ecosystem.Parasites and DiseaseDiseases and parasites in penaeid shrimps come in the forms <strong>of</strong> viruses, bacteria, fungi,protozoa, flatworms and nematodes. Disease ranks second only to predation and mass kills <strong>of</strong>natural populations in the Gulf and South Atlantic (Couch 1978) in shrimp mortality. TheBaculovirus infects larval and adult shrimp and is associated with mortality, especially in larval83
shrimp. The effect <strong>of</strong> bacteria on mortality is unclear, however Vibrio, Beneckea, and Leucothrixare associated with disease in penaeid shrimps. Several types <strong>of</strong> fungi can be very destructiveto tissue <strong>of</strong> larval shrimp. There are several types <strong>of</strong> protozoa that are parasitic and commensaland include Microsporidia which cause the condition commonly known as “cotton shrimp” andCiliatea which causes black gill disease. Flatworms and nematodes can also be found inmuscles and viscera <strong>of</strong> penaeid shrimp (Couch 1978).Cotton disease is widespread and is found in all three species <strong>of</strong> shrimp on the SouthAtlantic and Gulf coasts. There are several species <strong>of</strong> Microsporidia that infects the tail muscle<strong>of</strong> the shrimp, as well as the organs and tissues with masses <strong>of</strong> spores. These spores causethe white discoloration <strong>of</strong> muscle giving infected shrimp a cotton or paper-white color. Thisparasite kills shrimp. A typical catch <strong>of</strong> wild shrimp contains a few infected individuals, whichare usually discarded.Black gill disease results from infection by a single-celled protozoan called a Ciliatea(SC DNR 2002). It attaches itself to a thin area around the gills <strong>of</strong> the shrimp’s shell. Thisattachment either causes structural damage or erodes a hole through the shell, causinginflammation. The black pigmentation <strong>of</strong> the gill results from an immune response to theinflammation. The infestation <strong>of</strong> black gill disease does not result in any noticeable mortality inthe wild and appear to attach in mass when shrimp are stressed (SC DNR 2002).Several penaeid shrimp viruses may be carried by imports from Asia and South Americaas well as from expanding aquaculture. These viruses enter processing facilities andaquaculture facilities through infected brood stock, contaminated feed, infected transportcontainers or by migratory birds. These viruses may infect our three species <strong>of</strong> native shrimpbut there is little information on the presence <strong>of</strong> exotic shrimp viruses in populations <strong>of</strong> ournative shrimp in North Carolina. There are currently no aquaculture facilities for shrimp in thestate though there were two permitted facilities in 2003.9.3 Habitat and Water Quality ProtectionMFC AuthorityPresently, the MFC has authority to manage, restore, develop, cultivate, conserve, protect,and regulate marine and estuarine resources. <strong>Marine</strong> and estuarine resources are defined as“All fish [including marine mammals, shellfish, and crustaceans], except inland game fish, foundin the Atlantic Ocean and in coastal fishing waters; all fisheries based upon such fish; alluncultivated or undomesticated plant and animal life, other than wildlife resources, inhabiting ordependent upon coastal fishing waters; and the entire ecology supporting such fish, fisheries,and plant and animal life.” (G.S. 113-129).Although MFC’s primary responsibilities are management <strong>of</strong> fisheries (seasons, size andbag limits, licensing, etc.), the MFC also has authority to comment on State permit applicationsthat may have an effect on marine and estuarine resources or water quality, regulate placement<strong>of</strong> fishing gear, develop and improve mariculture, and regulate location and utilization <strong>of</strong> artificialreefs. MFC authority is found at G.S. 143B-289.51 and 289.52. As discussed previously, theMFC prohibits certain bottom-disturbing gears from areas supporting SAV, shell bottom, orjuvenile fish populations to protect these resources.84
Authority <strong>of</strong> Other AgenciesSeveral divisions within the North Carolina Department <strong>of</strong> Environment and NaturalResources are responsible for providing technical and financial assistance, planning, permitting,certification, monitoring, and regulatory activities that have a direct or indirect impact on coastalwater quality and habitat. The North Carolina <strong>Division</strong> <strong>of</strong> Coastal Management (DCM) isresponsible for development permits along the estuarine shoreline in 20 coastal counties.Wetland development activity throughout North Carolina is permitted through the United StatesArmy Corps <strong>of</strong> Engineers (COE) and the North Carolina <strong>Division</strong> <strong>of</strong> Water Quality (DWQ; 401-certification program). The DWQ permits and regulates discharges to surface waters, andmonitors water quality throughout the state. DWQ has established a water quality classificationand standards program for “best usage” to promote protection <strong>of</strong> surface water supplywatersheds, high quality waters, ecosystem functions, and the protection <strong>of</strong> unique and specialpristine waters with outstanding resource values. Classifications, particularly for High QualityWaters (HQW), Outstanding Resource Waters (ORW), Nutrient Sensitive Waters (NSW) andWater Supply (WS) waters, outline protective management strategies aimed at controlling pointand nonpoint source pollution. Various federal and state agencies, including DMF, evaluateprojects proposed for permitting and provide comments and recommendations to the DCM,DWQ, and COE on potential habitat and water quality impacts. Various public agencies (stateand federal) and private groups acquire and manage natural areas as parks, refuges, reserves,or protected lands, which helps to protect adjacent public trust estuarine water quality.Coastal Habitat Protection PlansThe <strong>Fisheries</strong> Reform Act <strong>of</strong> 1997 (FRA 1997) mandated the Department <strong>of</strong>Environment and Natural Resources (DENR) to prepare a Coastal Habitat Protection Plan(CHPP -- G. S. 143B-279.8). The legislative goal for the CHPP is long-term enhancement <strong>of</strong>the coastal fisheries associated with coastal habitats and provides a framework formanagement actions to protect and restore habitats critical to North Carolina’s coastal fisheryresources. The Coastal Resources Commission, Environmental Management Commission, andthe <strong>Marine</strong> <strong>Fisheries</strong> Commission must each approve and implement the plan for it to beeffective. These three Commissions have regulatory jurisdiction over the coastal resources,water, and marine fishery resources. The CHPP was approved in December 2004 and animplementation plan is to be developed by July 2005. Actions taken by all three commissionspertaining to the coastal area, including rule making, are to comply, “to the maximum extentpracticable” with the plans. The CHPP will help to ensure consistent actions among these threecommissions as well as their supporting Department <strong>of</strong> Environment and Natural Resourcesagencies and will be reviewed every five years.The CHPP describes and documents the use <strong>of</strong> habitats by species supporting coastalfisheries, status <strong>of</strong> these habitats, and the impacts <strong>of</strong> human activities and natural events onthose habitats. Fish habitat is defined as freshwater, estuarine, and marine areas that supportjuvenile and adult populations <strong>of</strong> economically important fish, shellfish, and crustacean species(commercial and recreational), as well as forage species important in the food chain (Street etal. 2005). Fish habitat also includes land areas that are adjacent to, and periodically flooded byriverine and coastal waters. Six fish habitats are discussed and designated based on distinctivephysical properties, ecological functions, and habitat requirements for living components <strong>of</strong> thehabitat: wetlands, submerged aquatic vegetation (SAV), s<strong>of</strong>t bottom, shell bottom, ocean hardbottom, and water column.The CHPP recommends that some areas <strong>of</strong> fish habitat be designated as “Strategic85
Habitat Areas” (SHAs). Strategic Habitat Areas are defined as specific locations <strong>of</strong> individualfish habitat or systems <strong>of</strong> habitat that have been identified to provide critical habitat functions orthat are particularly at risk due to imminent threats, vulnerability or rarity. While all fish habitatsare necessary for sustaining viable fish populations, some areas may be especially important t<strong>of</strong>ish viability and productivity. Protection <strong>of</strong> these areas would therefore be a high priority (Streetet al. 2005). The process <strong>of</strong> identifying and designating SHAs was initiated in 2005. SeeSection 10 for recommended habitat and water quality actions.86
10. PRINCIPAL ISSUES AND MANAGEMENT OPTIONSA summary <strong>of</strong> the major issues and management options identified during thedevelopment <strong>of</strong> the <strong>FMP</strong> are contained in this section. Each issue is briefly described alongwith potential management options, recommended strategies, and actions to be taken by theMFC, DMF, and others. An in-depth discussion <strong>of</strong> habitat and water quality is found in Section9 (Environmental Factors), while the remaining issues are discussed in Section 12(Appendices).10.1 ISSUES10.1.1 Habitat10.1.1.1 Issue/ Purpose Protect, enhance, and restore habitats utilized by shrimp.Suitable and adequate habitat is a critical element in the ecology and productivity <strong>of</strong>estuarine systems. Degradation or improvement in one aspect <strong>of</strong> habitat may have acorresponding impact on water quality. Maintenance and improvement <strong>of</strong> suitable estuarinehabitat and water quality are probably the most important factors in providing sustainable shrimpstocks.10.1.1.2 Management Options1. No regulatory action.2. MFC rule changes to protect additional critical habitats for shrimp.3. Rule changes by other agencies (North Carolina Coastal Resources Commission, NorthCarolina Environmental Management Commission, and others) to protect critical habitatsfor shrimp and water quality.Option two would require rule changes by the MFC.10.1.1.3 Recommended Management StrategyHabitat protection, conservation, and restoration are essential to accomplish the goaland objectives <strong>of</strong> this plan. The MFC, North Carolina Coastal Resources Commission (CRC),and North Carolina Environmental Management Commission (EMC) should adopt rules toprotect critical habitats for shrimp as outlined in the Coastal Habitat Protection Plan (CHPP).The Department <strong>of</strong> Environment and Natural Resources (DENR) should develop a strategy t<strong>of</strong>ully support the CHPPs process with additional staff and funding. The MFC and DMF shouldcontinue to comment on activities that may impact aquatic habitats and work with permittingagencies to minimize impacts and promote restoration and research. Research must beconducted to investigate the impacts <strong>of</strong> trawling on various habitats.A strategy should be developed and adopted by the MFC and DENR to accomplish the actionsoutlined in Section 10.1.1.4. These strategies would address objectives 3, and 6 <strong>of</strong> this plan.10.1.1.4 ActionsActions 2, 3, 4, 5, 11, 12, and 13 would need to be implemented through the cooperativeefforts <strong>of</strong> the N.C. General Assembly and several divisions within the Department <strong>of</strong>Environment and Natural Resources. The involvement <strong>of</strong> federal agencies and increased87
funding (state and federal) may be necessary to accomplish these actions.Strategic Habitat AreasAction 1: Identify and delineate Strategic Habitat Areas that will enhance protection <strong>of</strong>penaeid shrimp.WetlandsAction 2:Action 3:Action 4:Action 5:S<strong>of</strong>t bottomAction 6:Action 7:Action 8:Prevent loss <strong>of</strong> any additional riparian wetlands through the permitting process,land acquisition, or land use planning.Accelerate restoration <strong>of</strong> wetlands to enhance nursery habitat for shrimp andimprove water quality.Increase use <strong>of</strong> effective vegetated upland and wetland buffers along coastalstreams and rivers to enhance wetlands and improve water quality.Minimize wetland losses to estuarine shoreline stabilization by:o Revising CRC estuarine and public trust shoreline stabilization rules usingbest available information.o Incorporating estuarine erosion rates in siting criteria for shorelinedevelopment and stabilization measures.o Developing and promoting incentives for use <strong>of</strong> alternatives to verticalshoreline stabilization measures.Protect shallow s<strong>of</strong>t bottom habitat in areas that are highly utilized as shrimpnursery or foraging grounds.Assess the distribution, concentration, and threat <strong>of</strong> heavy metals and other toxiccontaminants in freshwater and estuarine sediments and identify the areas <strong>of</strong>greatest concern to focus water quality improvement efforts.Evaluate the effects <strong>of</strong> clam kicking and crab dredging on s<strong>of</strong>t bottom habitat andshrimp.Submerged Aquatic Vegetation (SAV)Action 9: Completely map all low and high salinity SAV in North Carolina.Action 10: Expand nursery sampling to include high and low salinity SAV beds toadequately evaluate their use by penaeid shrimp and other species, and trendsin those species.Action 11: Reduce nutrient and sediment loading in the Albemarle-Pamlico system,particularly the Neuse and Tar-Pamlico rivers, to levels that will support SAV,using regulatory and non-regulatory actions.Action 12: Evaluate dock criteria to determine if existing requirements are adequate for SAVsurvival and growth and modify accordingly.Action 13: Develop and implement a comprehensive coastal marina and dock managementplan and policy to minimize impacts to SAV, shell bottom, s<strong>of</strong>t bottom, and waterquality.Action 14: Expand areas where dredging and trawling is not allowed to allow some recovery<strong>of</strong> SAV and shell bottom where those habitats historically occurred.Action 15: Seek additional resources to enhance enforcement <strong>of</strong> and compliance withbottom disturbing gear restrictions that protect SAV and other habitats utilized byshrimp.88
Shell bottomAction 16: Accelerate restoration <strong>of</strong> oyster sanctuaries.Action 17: Conduct research to evaluate the role <strong>of</strong> shell hash and shell bottom for penaeidshrimp recruitment or other ecological functions, particularly where SAV isabsent.10.1.2 Water Quality10.1.2.1 Issue/ Purpose Protect, enhance, and restore estuarine water quality.Suitable water quality is a critical element in the ecology and productivity <strong>of</strong> estuarinesystems. Degradation or improvement in one aspect <strong>of</strong> water quality may have a correspondingimpact on habitat. Maintenance and improvement <strong>of</strong> suitable estuarine water quality and habitatare probably the most important factors in providing a sustainable shrimp stock.10.1.2.2 Management OptionsThe MFC has no regulatory authority over water quality impacts. The MFC and DMFshould highlight problem areas and advise other regulatory agencies (EMC, <strong>Division</strong> <strong>of</strong> WaterQuality, <strong>Division</strong> <strong>of</strong> Environmental Health – Shellfish Sanitation, <strong>Division</strong> <strong>of</strong> Land Resources, USArmy Corps <strong>of</strong> Engineers, and local governments) on preferred options and potential solutions.10.1.2.3 Recommended Management StrategyThe MFC and DMF should continue to comment on activities (state, federal, and localpermits) that may impact estuarine water quality and work with permitting agencies to minimizeimpacts. Additionally, the MFC and DMF should solicit and support Fishery Resource Grant(FRG) projects that may provide information necessary for protection, management, andrestoration <strong>of</strong> water quality. Water quality standards should be based on the assimilativecapacity <strong>of</strong>, and impacts to, the entire system. Several plans for water quality managementhave recommended strategies that need to be implemented to improve water quality. Astrategy should be developed and adopted by the MFC and DENR to accomplish the actionsoutlined in Section 10.1.2.4, and to assure that recommendations <strong>of</strong> existing and future waterquality plans are addressed in a timely manner. The DENR should develop a strategy to fullysupport the CHPPs process with additional staff and funding. Water quality protection andrestoration are essential to accomplish the goal and objectives <strong>of</strong> this plan. This strategy wouldaddress objectives 3 and 6 <strong>of</strong> this plan.10.1.2.4 ActionsActions would need to be implemented through the cooperative efforts <strong>of</strong> the N.C.General Assembly and several divisions within the Department <strong>of</strong> Environment and NaturalResources. The involvement <strong>of</strong> federal agencies and funding (state and federal) will benecessary to accomplish these actions.Action 1:Action 2:Action 3:Action 4:Improve methods to reduce sediment and nutrient pollution from constructionsites, agriculture, and forestry.Increase on-site infiltration <strong>of</strong> stormwater through voluntary or regulatorymeasures.Provide more incentives for low-impact development.Reduce impervious surfaces where feasible and reduce the maximum amount <strong>of</strong>impervious surfaces allowed in the absence <strong>of</strong> engineered stormwater controls.89
Action 5:Current Phase II stormwater rules should be implemented and modified if foundto be ineffective.10.1.3 MANAGEMENT OF TRAWLING FOR HABITAT PROTECTION10.1.3.1 Issue/ Purpose How does North Carolina manage estuarine trawling tominimize effects on habitat?<strong>Shrimp</strong> trawling is a bottom disturbing fishing activity and affects hard bottom, shellbottom, submerged aquatic vegetation and s<strong>of</strong>t bottom habitats where it occurs. These criticalhabitats provide commercially and recreationally valuable fish species with food resources,living space, and protection from predators during part <strong>of</strong> or all <strong>of</strong> their life cycle. Trawling altersthese habitats by reducing structure, changing sediment size and distribution, and increasingturbidity. This in turn affects ecosystem processes such as growth <strong>of</strong> primary producers (algaeand plants), nutrient regeneration, growth <strong>of</strong> secondary producers (organisms that consumeother organisms), and the character <strong>of</strong> the feeding relationships <strong>of</strong> organisms within theecosystem (the food web).10.1.3.2 Management Options1. Status Quo2. Partition trawling activities from fixed gear activities3. Decrease the amount <strong>of</strong> area open to shrimp trawling harvest4. Modify trawl gear5. Establish a reduced trawling season6. Rotate trawling in existing sites7. Use only stationary fishing gear8. Close all trawling9. Re-examine habitats needing protection and modify rules10.1.3.3 Recommended Management StrategySee area specific recommendations and action items for habitat and water quality and researchrecommendations. These strategies would address objectives 3 and 6 <strong>of</strong> this plan. The actionsin Section 10.1.3.4 need to be implemented to accomplish these strategies.10.1.3.4 ActionsAction 1:Action 2:Implement area specific recommendations.Conduct necessary research.10.1.4 SHRIMP TRAWL BYCATCH10.1.4.1 Issue/ Purpose Bycatch in the shrimp trawl fishery.Over the last few years, bycatch has become one <strong>of</strong> the more controversial topics infisheries management both in the United States and around the world (Alverson et al. 1994;Crowder and Murawski 1998). In spite <strong>of</strong> increased public awareness, greater managementagency scrutiny, and significant research efforts, many basic issues remain unresolved. Onlyrecently has the term bycatch been defined in any standard manner, and important informationon the magnitude <strong>of</strong> bycatch is severely lacking for many fisheries. Given this situation, it is not90
surprising that little is known <strong>of</strong> the impacts <strong>of</strong> bycatch on specific fisheries, fish populations,and marine communities. However, this lack <strong>of</strong> basic information has not dulled the public’sinterest and may, in fact, catalyze such concerns. As a result, recent public policy dictates thatbycatch be either eliminated or reduced to insignificant levels (Crowder and Murawski 1998).As perhaps the prime example <strong>of</strong> the new policy positions, the re-authorized Magnuson-StevensFishery Conservation and Management Act (MSFCMA) contains a National Standard (#9)requiring bycatch minimization (USDOC 1996). National Standard 9 states: “Conservation andmanagement measures shall, to the extent practicable, (A) minimize bycatch and (B) to theextent bycatch cannot be avoided, minimize the mortality <strong>of</strong> such bycatch." Additionally, in1991the North Carolina <strong>Marine</strong> <strong>Fisheries</strong> Commission (MFC) adopted a policy directing the <strong>Division</strong><strong>of</strong> <strong>Marine</strong> <strong>Fisheries</strong> (DMF) to establish the goal <strong>of</strong> reducing bycatch losses to the absoluteminimum and to consciously incorporate that goal into all its, management considerations(Murray et. al. 1991).10.1.4.2 Management Options1. No rule change2. Gear modifications3. Catch Restrictions4. Harvest seasons5. Time restrictions6. Area restrictions7. Limited entry8. Ban shrimp trawling10.1.4.3 Recommended Management StrategySee area specific recommendations and bycatch research recommendations in Appendix 3.This strategy would meet objectives 1, 2, and 6 <strong>of</strong> this plan. The actions in Section 10.1.4.4need to be implemented to accomplish these strategies.10.1.4.4 ActionsAction 1:Action 2:Action 3:Action 4:Action 5:Action 6:Action 7:Effort data needs to be collected to provide estimates based on actual timefished (or number <strong>of</strong> tows), rather than number <strong>of</strong> trips.Characterization work (shrimp) needs to be conducted across all strata (forexample; season, areas, vessel type, and dominant species).Obtain mortality (immediate and post harvest) estimates <strong>of</strong> culled, active andpassive, bycatch.Develop standard protocol for bycatch estimations.Continue to develop and test methods to reduce bycatch in the commercial andrecreational shrimp trawl fisheries.Continue to develop and test alternate gears for shrimp harvest.Implement area specific recommendations.10.1.5 SOUTHERN FLOUNDER BYCATCH IN THE INSHORE SHRIMP TRAWL FISHERY10.1.5.1 Issue/ Purpose Southern flounder bycatch in the inshore shrimp trawlfishery.Bycatch <strong>of</strong> southern flounder were a topic <strong>of</strong> concern for the Southern Flounder Advisory91
Committee. Bycatch characterization studies indicate that bycatch reduction devices currentlyin place are not effective for reducing southern flounder bycatch. The Southern flounderAdvisory Committee recommended that <strong>Shrimp</strong> Advisory Committee address the issue <strong>of</strong>discard <strong>of</strong> sublegal southern flounder in the shrimp trawl fishery within the <strong>Shrimp</strong> <strong>FMP</strong>.10.1.5.2 Management Options1. No rule change2. Gear modifications3. Catch Restrictions4. Harvest seasons5. Time restrictions6. Area restrictions7. Limited entry8. Ban shrimp trawling10.1.5.3 Recommended Management StrategySee area specific recommendations and research recommendations in Appendix 3. Thisstrategy would meet objectives 1, 2, and 6 <strong>of</strong> this plan. The actions in Section 10.1.5.4 need tobe implemented to accomplish these strategies.10.1.5.4 ActionsAction 1:Action 2:Action 3:Action 4:Action 5:Action 6:Action 7:Effort data needs to be collected to provide estimates based on actual timefished (or number <strong>of</strong> tows), rather than number <strong>of</strong> trips.Characterization work (shrimp) needs to be conducted across all strata (forexample; season, areas, vessel type, and dominant species).Obtain mortality (immediate and post harvest) estimates <strong>of</strong> culled, active andpassive, bycatch.Develop standard protocol for bycatch estimations.Continue to develop and test methods to reduce bycatch in the commercial andrecreational shrimp trawl fisheries.Continue to develop and test alternate gears for shrimp harvest.Implement area specific recommendations.10.1.6 SHRIMP MANAGEMENT BY SIZE IN NORTH CAROLINA ESTUARIES10.1.6.1 Issue/ Purpose At what shrimp size should waterbodies be opened toshrimp trawling?<strong>Shrimp</strong> area openings and closures are based primarily on the size <strong>of</strong> most <strong>of</strong> the shrimppresent in an area determined by extensive DMF sampling. Other factors considered in adecision to open or close an area include biological, environmental, economic and social issuesin an “optimum utilization” scheme. The social aspects <strong>of</strong> management are addressed byevaluating the subjective knowledge <strong>of</strong> experienced DMF field personnel, shrimp fishermen,dealers, and others associated with the industry. When personal preferences or circumstancescloud this information, the size <strong>of</strong> the shrimp and the number <strong>of</strong> juvenile finfish in the samplesassume the greatest weight in the decision.92
10.1.6.2 Management Options1. Status quo, with specific target size for openings: Pamlico Sound to White Oak River-26-302. Keep all areas closed that are currently intensively managed areas3. Set dates for opening and closing areas each year4. Management by strict minimum count rule5. Restrict the size or number <strong>of</strong> shrimp trawls per vessel in inside waters6. Close inside shrimping10.1.6.3 Recommended Management StrategySee area specific recommendations. This strategy would meet objectives 1, 2, 4, 5, and 6 <strong>of</strong>this plan. The actions in Section 10.1.6.4 need to be implemented to accomplish thesestrategies.10.1.6.4 ActionsAction 1:Implement area specific recommendations.10.1.7 SHRIMP POUND NET SETS (<strong>Shrimp</strong> Traps)10.1.7.1 Issue/ Purpose What is the appropriate definition and allowable use <strong>of</strong>shrimp traps?In 2003, the DMF became aware <strong>of</strong> the emergence <strong>of</strong> a new form <strong>of</strong> shrimp pot/trap withwings. These traps are constructed <strong>of</strong> 5/8” rigid hardware cloth and have two V-shaped wingsto direct the shrimp into the traps. These wings can be up to 50 feet in length and the distancebetween the ends <strong>of</strong> the wings is approximately 80 feet. The traps are most successful whenset during a flood tide with one <strong>of</strong> the wings against a bulkhead or marsh shoreline. Thedevices are staked or anchored in place. The ends <strong>of</strong> the wings face away from the direction <strong>of</strong>the tide flow when deployed.The proliferation <strong>of</strong> these shrimp traps in the relatively confined waters <strong>of</strong> the SouthernDistrict caused concern due to interference with traditional uses <strong>of</strong> the waters for shrimptrawling and navigation. The solution adopted to prevent this possible problem was todesignate these shrimp traps as shrimp pound net sets. This designation requires a permit thatis only available to applicants that have a Standard or Retired Commercial Fishing License(SCFL). After the proposed sets are marked and the application is completed, there is a 20-daypublic comment period, during which the public has an opportunity to see where the nets areproposed and comment on activities that the set would possibly interfere with. The pound netdesignation has had the desired effect <strong>of</strong> preventing the rapid and uncontrolled growth <strong>of</strong> thesedevices. Four applications in the Southern District have been denied by the Director and threeadditional pound net application packages have been sent out as <strong>of</strong> August 19, 2004.10.1.7.2 Management Options1. Status Quo2. Define a scaled-down “recreational” version <strong>of</strong> this device in MFC Rule and add it to alist <strong>of</strong> “recreational” commercial gear in 15A NCAC 3O .0302.93
10.1.7.3 Recommended Management StrategyInvestigate the use <strong>of</strong> shrimp traps as RCGL gear including size, and locationrestrictions. This strategy would meet objectives 1, 2, 3, 4, 5, and 6 <strong>of</strong> this plan. The actions inSection 10.1.7.4 need to be implemented to accomplish these strategies.10.1.7.4 ActionsAction 1:Action 2:Action 3:Continue to develop and test alternate gears (shrimp traps) for shrimp harvest.Define a scaled-down “recreational” version <strong>of</strong> this device in MFC Rule and add itto a list <strong>of</strong> “recreational” commercial gear in 15A NCAC 3O .0302.Investigate the use <strong>of</strong> shrimp traps as RCGL gear including size, and locationrestrictions.10.1.8 MANAGEMENT OF FIXED GEAR IN THE INSHORE SHRIMP FISHERY10.1.8.1 Issue/ Purpose Management <strong>of</strong> Channel nets.The use <strong>of</strong> fixed gear to harvest shrimp in areas that are closed to the use <strong>of</strong> mobilegears (trawls, skimmers, seines and butterfly nets) is a common practice in the areas betweenHarkers Island and Topsail Inlet. The primary fixed gear used to catch shrimp in these areas isa channel net. While channel nets are allowed in areas closed to trawling, insufficient tidalcurrent throughout much <strong>of</strong> southeastern North Carolina limits their use to only a small portion<strong>of</strong> these closed areas.10.1.8.2 Management Options1) Status quo2) Restrict use to areas and times available to mobile gears10.1.8.3 Recommended Management StrategyAreas upstream <strong>of</strong> the Highway 172 bridge over New River and those north <strong>of</strong> theHighway 50 swing bridge in Surf City would open to channel nets when they open to mobilegears. No part <strong>of</strong> a channel net set will be allowed in the marked navigation channel from NewRiver Inlet to the Intracoastal Waterway. This strategy would meet objectives 4, and 5 <strong>of</strong> thisplan. The actions in Section 10.1.8.4 need to be implemented to accomplish these strategies.10.1.8.4 ActionsAction 1:Issue a proclamation to close these areas to channel netting.10.1.9 THE RECREATIONAL SHRIMP TRAWL FISHERY IN NORTH CAROLINA10.1.9.1 Issue/ Purpose The harvest <strong>of</strong> Penaid shrimp using the RecreationalCommercial Gear License.<strong>Shrimp</strong> are harvested recreationally throughout the state by otter trawls, seines, shrimppots and cast nets. No license is required to use cast nets and they are allowed in all areas.94
There is a 100 shrimp per person limit in those areas closed to other methods <strong>of</strong> shrimping.Otter trawls, seines, and shrimp pots require a Recreational Commercial Gear License(RCGL) for their use and can be used in areas open to those gears. The RCGL limits the size<strong>of</strong> the gear to a 26 foot head rope for trawls, a 100 foot seine and five shrimp pots.The DMF conducted surveys <strong>of</strong> RCGL holders in 2002 and 2003 concerning their use <strong>of</strong>this license. RCGL use <strong>of</strong> seine and shrimp pots is negligible (
10.1.10 GEAR SIZE RESTRICTIONS10.1.10.1 Issue/ Purpose Gear Size RestrictionsThe size <strong>of</strong> gear allowed in the shrimp fishery has been the subject <strong>of</strong> debate particularlywith respect to trawls. There are size limits on channel nets and on trawls utilized for therecreational harvest <strong>of</strong> shrimp but no restriction on the size <strong>of</strong> trawls used in the commercialshrimp fishery. Many fishermen feel that there should be a maximum limit placed on the size <strong>of</strong>trawls particularly in some <strong>of</strong> the smaller water bodies. They cite unfairness in allowing largervessels into these areas especially on opening days when many boats crowd into an area. Thefeeling is that these operations take most <strong>of</strong> the shrimp, rendering areas unproductive forseveral days, and then leave to fish in more open waters unworkable by the smaller vessels. Inaddition to fairness the reduction in bycatch and decreased affect on the habitat are reasonsgiven for a net size limit.10.1.10.2 Management Options1) Status quo2) Restrict the size <strong>of</strong> gear used in the shrimp fishery.10.1.10.3 Recommended Management StrategyImplement a 90 foot total headrope limit for all internal waters <strong>of</strong> North Carolina exceptPamlico Sound and portions <strong>of</strong> the Neuse and Pamlico Rivers. This strategy would meetobjectives 1, 2, 3, 4 and 5 <strong>of</strong> this plan. The actions in Section 10.1.10.4 need to beimplemented to accomplish these strategies.10.1.10.4 ActionsAction 1:Modify rule 03L .0103 by adding sections (c) and (d) and rule 03R .0114 toimplement the 90 foot total headrope limit for all internal waters <strong>of</strong> North Carolinaexcept Pamlico Sound and portions <strong>of</strong> the Neuse and Pamlico Rivers.10.1.11 SHRIMP MANAGEMENT IN NEW RIVER ABOVE THE HIGHWAY 172 BRIDGE10.1.11.1 Issue/ Purpose <strong>Shrimp</strong> Management in New River.The waters upstream <strong>of</strong> the Highway 172 bridge were designated by rule as a SpecialSecondary Nursery Area (SSNA) in 1996. The areas <strong>of</strong> the SSNA that are impacted by thetrawling opening include the river above the bridge up to the marked closure line running fromGrey’s Point to the opposite side <strong>of</strong> the river. Trawling in any <strong>of</strong> the tributary creeks isprohibited. The river consists mostly <strong>of</strong> shallow bays with the exception <strong>of</strong> the markednavigation channel. Bottom types range from sand and sand/mud to live shell bottom. DMFactively manages eight Shellfish Management Areas (SMAs) in this portion <strong>of</strong> New River.The increasing use <strong>of</strong> skimmers in the New River SSNA has positive implications for theresource in terms <strong>of</strong> minimizing waste/bycatch and disturbance to the bottom. Additionally, thetrip ticket harvest data indicate this gear is more effective catching the target species thanconventional otter trawls. A skimmer trawl study conducted by Sea Grant found skimmers muchmore effective on white shrimp than otter trawls in water less than 12 feet (most all <strong>of</strong> the waterabove the bridge in New River) and in some cases outfished otter trawls as much as 5-to-1.96
Unlike otter trawls, the tailbag in skimmers is emptied while fishing is still underway.Consequently, the bag is emptied much more frequently, leading to significant increases insurvivability <strong>of</strong> most all finfish species (Coale, et al. 1994). The majority <strong>of</strong> shrimp openings inthe New River SSNA are for white shrimp since by late summer most <strong>of</strong> the brown shrimp havealready emigrated.10.1.11.2 Management Options1. Status quo (potential opening dates set by rule and determined by sampling)2. Prohibit otter trawls (not skimmers) as an allowable gear in New River SSNA3. Establish timeline when otter trawls would be prohibited4. Prohibit all trawlers and skimmers in New River SSNA5. Net size restrictions in New River SSNA6. Status quo but with reduction in days <strong>of</strong> week trawling allowed (Tues,Thur)10.1.11.3 Recommended Management StrategyProhibit otter trawls after a four year phase in period to allow those who wish to convertto skimmers to do so. This strategy would meet objectives 1, 2, 3, 4, and 5 <strong>of</strong> this plan. Theactions in Section 10.1.11.4 need to be implemented to accomplish these strategies.10.1.11.4 ActionsAction 1: Phase out the use <strong>of</strong> otter trawls in New River after four years.10.1.12 SHRIMP MANAGEMENT IN CHADWICK BAY10.1.12.1 Issue/ Purpose <strong>Shrimp</strong> Management in Chadwick Bay.Chadwick Bay is a small high salinity waterbody encompassing 841 acres located justsouth <strong>of</strong> the mouth <strong>of</strong> New River and adjacent to the IWW and the New River Inlet. Thesouthern portion <strong>of</strong> the bay is classified as a Primary Nursery Area (PNA) characterized byshallow water depth (< 5 feet) and a sandy mud substrate with patches <strong>of</strong> submerged aquaticvegetation (SAV). Fullard Creek is the major tributary <strong>of</strong> Chadwick Bay and minor tributariesinclude Charles Creek and Bumps Creek. The upper portion <strong>of</strong> Fullard and all <strong>of</strong> Charles Creekand Bumps Creek are designated by DMF as PNAs. Although the lower portion <strong>of</strong> FullardCreek is not currently classified as a nursery area, it is not opened to shrimping because <strong>of</strong> theabundance <strong>of</strong> juvenile finfish. The remainder <strong>of</strong> Chadwick Bay is opened by proclamation toshrimping when the shrimp reach a harvestable size (30-40 heads-on count). The area thatmay open to shrimping is approximately 132 acres or 16% <strong>of</strong> the waterbody. The bottoms in theopen shrimping area lacks SAV and are sandier, a little deeper than the PNAs, but still supportslarge numbers <strong>of</strong> juvenile and sub-adult finfish.DMF has utilized two different strategies in managing Chadwick Bay. In some yearswhen brown shrimp are abundant and large, the bay is opened in July along with the White OakRiver, Queen’s Creek and Bear Creek. In other years when brown shrimp are less abundant, aChadwick Bay shrimp opening on white shrimp may occur in August or September inconjunction with the openings in New River and/or Stump Sound.The Chadwick Bay shrimp fishery is primarily conducted with trawls, although, in recentyears, the use <strong>of</strong> skimmers has increased in the commercial portion <strong>of</strong> the fishery. The bay is97
frequently shrimped by Recreational Commercial Gear License holders, especially on openingdays.10.1.12.2 Management Options1) Status quo (potential opening dates set by rule and determined by sampling)2) Prohibit otter trawls (not skimmers) as an allowable gear in Chadwick Bay3) Establish timeline when otter trawls would be prohibited4) Prohibit all trawlers and skimmers in Chadwick Bay5) Net size restrictions in Chadwick Bay6) Status Quo but with reduction in days <strong>of</strong> week trawling allowed (Tues,Thur)10.1.12.3 Recommended Management StrategyStatus quo (potential opening dates set by rule and determined by sampling) and initiatesampling to investigate if Chadwick Bay functions as a Special Secondary Nursery Area. Thisstrategy would meet objectives 1, 2, 3, 4, and 5 <strong>of</strong> this plan. The actions in Section 10.1.12.4need to be implemented to accomplish these strategies.10.1.12.4 ActionsAction 1: Initiate sampling to investigate if Chadwick Bay functions as a Special SecondaryNursery Area.10.1.13 SHRIMP MANAGEMENT IN THE INTRACOASTAL WATERWAY ANDSOUNDS FROM NEW RIVER TO RICH’S INLET10.1.13.1 Issue/ Purpose <strong>Shrimp</strong> Management in the Intracoastal waterway andsounds from New River to Rich’s inlet.The estuarine waters <strong>of</strong> the IWW channel and the adjacent sounds and bays betweenNew River Inlet and Rich’s Inlet are managed as a single waterbody by the DMF. A section <strong>of</strong>this waterbody bounded by Marker #17 to the north and the Surf City swing bridge to the southis designated as SSNA. SSNA status (15A NCAC 03R.0105) makes it unlawful to use trawlnets in these waters except that the <strong>Fisheries</strong> Director may, by proclamation, open any portion<strong>of</strong> this area to shrimp or crab trawling from August 16 through May 14. Management rationalefor this rule included minimizing bycatch by delaying the trawl opening date to reduce the finfishbycatch and to reduce user conflicts. Historical data (since 1972) collected by DMF indicatesthese waters support large aggregations <strong>of</strong> commercially important finfish as well as shellfishand crustaceans.Bottom types range from mud and muddy/sand in the IWW to mostly sand near theinlets. The shallow waters <strong>of</strong> Topsail Sound and some <strong>of</strong> the estuarine areas around New RiverInlet contain patches <strong>of</strong> SAV.There are active clam and oyster fisheries in the entire area. Hand harvest for oystersand clams take place in the shallow areas throughout these waters on both public bottom andleased areas, while mechanical harvest <strong>of</strong> clams is allowed in the IWW from New River to south<strong>of</strong> the Surf City bridge (“BC” Marker). DMF maintains Shellfish Management Areas throughoutthe area, all <strong>of</strong> which are located in waters closed to shrimping with mobile gears. DMF and theCoastal Federation have collaborated to begin construction <strong>of</strong> oyster sanctuaries in Stump98
Sound.The typical management cycle for these waters is; the IWW north <strong>of</strong> Marker #17, theIWW south <strong>of</strong> the Surf City swing bridge and Banks Channel in Topsail Sound remain openduring the entire year unless unusually high rainfall amounts or overcrowded nursery areasforce large numbers <strong>of</strong> small shrimp into them prematurely. Waters in the SSNA, with theexception <strong>of</strong> the middle portion <strong>of</strong> the SSNA, are typically opened sometime after August 15.The middle portion <strong>of</strong> the SSNA from Marker #45 to the Highway 210-50 highrise bridge usuallyremains closed until late in the season because <strong>of</strong> the abundance <strong>of</strong> small shrimp.The fishing is dominated by small boats that trawl, float net and skim in the main channel<strong>of</strong> the IWW and in a 100- foot strip on the side <strong>of</strong> the IWW that is open from Marker #49 toMarker #105. Channel nets are set outside <strong>of</strong> the marked channel from Marker #15 at NewRiver to just south <strong>of</strong> the Surf City bridge and in Topsail Sound. Banks Channel serves as amigration route for emigrating shrimp and gears used there includes trawls, skimmers and mostrecently shrimp traps.10.1.13.2 Management Options1. Status quo (potential opening dates set by rule and determined by sampling)2. Prohibit otter trawls (not skimmers) as an allowable gear in Stump/Topsail Sound3. Establish timeline when otter trawls would be prohibited4. Prohibit all trawlers and skimmers in Topsail/Stump Sound5. Net or vessel size restrictions6. Status Quo but with reduction in days <strong>of</strong> week trawling allowed (Tues,Thur)10.1.13.3 Recommended Management StrategyNo changes to the current management strategy (potential opening dates set by rule anddetermined by sampling) is recommended. This strategy would meet objectives 1, 2, 3, 4, and 5<strong>of</strong> this plan.10.1.13.4 ActionsNo new actions are required.10.1.14 SHRIMP MANAGEMENT IN THE INTRACOASTAL WATERWAY ANDSOUNDS, RICH’S INLET TO CAROLINA BEACH10.1.14.1 Issue/ Purpose <strong>Shrimp</strong> Management in the Intracoastal waterway andsounds, Rich’s inlet to Carolina Beach.The estuarine waters <strong>of</strong> the IWW channel and adjacent sounds between Rich’s Inlet andCarolina Beach stretch over 21 miles and include four inlets separating four barrier islands,three <strong>of</strong> which (Figure 8, Wrightsville, Carolina Beach) are heavily developed. These waters arebordered on the north by Rich’s Inlet and to the south by the Carolina Beach Yacht Basin(CBYB). The largest inlet is Masonboro Inlet and it is located approximately in the center <strong>of</strong>these estuaries where it separates Wrightsville Beach from Masonboro Island.Bottom types are primarily sand throughout the area with the exception <strong>of</strong> more s<strong>of</strong>tmuddy substrates in the sounds and portions <strong>of</strong> the IWW. Submerged aquatic vegetation (SAV)99
is limited to a few patches in the shallow sound areas. There are active oyster, clam, and crabfisheries throughout the area. These fisheries are prosecuted in the sounds and along theedges <strong>of</strong> the IWW. The waters contain a few shellfish leases and DMF maintains six SMA’sfrom Hewletts Creek north to Rich’s Inlet. In addition, DMF and the Coastal Federation havecollaborated on construction <strong>of</strong> an oyster sanctuary in the mouth <strong>of</strong> Hewlett’s Creek. Closedshellfish areas are abundant and include all or portions <strong>of</strong> creeks on the mainland side <strong>of</strong> theIWW as well as most <strong>of</strong> the Wrightsville Beach area and buffers around numerous marinas.Most all <strong>of</strong> these areas receive very minimum shrimping effort with little or no impact onshellfish resources. Exceptions are a section <strong>of</strong> the IWW in Myrtle Grove Sound (Williamslanding) and the CBYB. Additionally, some <strong>of</strong> the channels around Wrightsville Beach alsoreceive shrimping effort at various times during a typical year. Both commercial andrecreational shrimpers utilize these waters.The William’s Landing area has been difficult to manage because the shrimp <strong>of</strong>tenmigrate before reaching larger sizes (30-40 count, heads-on) except in the fall. In some years,large concentrations <strong>of</strong> algae (Grassilaria and Ulva, spp) prevent the use <strong>of</strong> trawls until theshrimp grow to an acceptable count while in other years there has been harvest <strong>of</strong> small shrimp.The CBYB is opened and closed based on the size <strong>of</strong> shrimp present. Channels aroundWrightsville Beach remain open to allow harvest <strong>of</strong> shrimp migrating to the ocean. The area <strong>of</strong>the IWW from the Wrightsville Beach Drawbridge to Marker # 105 at Green’s Channel alwaysremains open to shrimping but historically, has received little effort from commercial orrecreational fisherman.10.1.14.2 Management Options1. Status quo (potential opening dates set by proclamation and determined by sampling)2. Modify existing management strategy as needed to address concerns3. Prohibit all trawling10.1.14.3 Recommended Management StrategyClose IWW to trawling from Marker # 105 to Wrightsville Beach drawbridge. Managetrawling in the IWW from Marker #139 to Marker # 146 as if it were a Special SecondaryNursery Area. This strategy would meet objectives 1, 2, 3, 4, and 5 <strong>of</strong> this plan. The actions inSection 10.1.14.4 needs to be implemented to accomplish these strategies.10.1.14.4 ActionsAction 1: Modify rule 03R .0106 by adding section (9) which closes the IWW from Marker #105 to the Wrightsville Beach Drawbridge.Action 2:Issue proclamations to manage the IWW from Marker # 139 to Marker # 146 as aSpecial Secondary Nursery area.10.1.15 SHRIMP MANAGEMENT IN THE CAPE FEAR RIVER COMPLEX10.1.15.1 Issue/ Purpose <strong>Shrimp</strong> Management in the Cape Fear River Complex.The waters <strong>of</strong> the Cape Fear River, the Basin, Second Bay, Buzzard’s Bay (the Bays)and Bald Head, Cape and Bay Creeks (the Creeks) are part <strong>of</strong> the Cape Fear estuarine system.The area in the Cape Fear that is open to shrimping is dredged on a regular basis for100
navigation purposes. The river is managed on the size <strong>of</strong> shrimp and various parts <strong>of</strong> the Riverare opened and closed based on the DMF’s samples.The bays south <strong>of</strong> Fort Fisher known as the Basin or First Bay, Second Bay andBuzzard’s Bay have been managed as a unit with openings and closings based on the DMF’ssamples. New Inlet drained these areas but closed after a series <strong>of</strong> hurricanes in the late1990’s and circulation is now through the Cape Fear. Since the inlet closing, DMF hasobserved a shift in the biological character <strong>of</strong> these waters towards more <strong>of</strong> a nursery area.Consequently, the size <strong>of</strong> the shrimp tends to remain small and the waters have not openedsince 2001.The Bald Head Creeks are usually opened in late June or early July based on the size <strong>of</strong>shrimp. Areas opened include the lower portions <strong>of</strong> the Creeks. The fishery is prosecuted bysmall skiffs. However, due to a lack <strong>of</strong> effort over the last few years, these creeks have notbeen opened since 2002.10.1.15.2 Management Options1) Status quo (potential opening dates set by proclamation and determined by sampling)2) Status quo for the main river but establish no trawling areas in the bays south <strong>of</strong> FortFisher and the Bald Head creeks3) Prohibit all trawling in Cape Fear10.1.15.3 Recommended Management StrategyStatus quo (potential opening dates set by rule and determined by sampling) for themain river and establish no trawling areas in the bays south <strong>of</strong> Fort Fisher and the Bald Headcreeks. This strategy would meet objectives 1, 2, 3, 4, and 5 <strong>of</strong> this plan. The actions inSection 10.1.15.4 need to be implemented to accomplish these strategies.10.1.15.4 ActionsAction 1:Action 2:Modify rule 03R .0106 by adding section (10) which closes the Bays adjacent tothe Cape Fear River to trawling.Modify rule 03R .0106 by adding sections (11 and 12) which close Cape andBald Head Creeks to trawling.10.1.16 SHRIMP MANAGEMENT IN BRUNSWICK COUNTY10.1.16.1 Issue/ Purpose <strong>Shrimp</strong> Management in Brunswick County.The Brunswick County coastline stretches for approximately 33 miles and is bound bythe Cape Fear River Inlet on the east end and by the Little River Inlet on the west end. Fourbarrier islands, all <strong>of</strong> which are densely developed, are separated by five inlets along thecoastline.The IWW in Brunswick County is managed based on the size and abundance <strong>of</strong> theshrimp taken in the DMF’s samples. The area is usually open until the beginning <strong>of</strong> June whenit is closed because <strong>of</strong> small brown shrimp. In most years, portions may be opened in late Juneor early July to allow harvest <strong>of</strong> brown shrimp and then closed in late July or early August when101
small white shrimp recruit to the area. Occasionally, small white shrimp may appear before thebrown shrimp reach a harvestable size, thus delaying an opening until the whites areharvestable, usually in September but sometimes as late as November. Principle harvest areasare behind Oak Island, from the Holden Beach bridge to Shallotte River and from the Ocean Islebeach bridge to the Sunset Beach bridge.The IWW channel from the Sunset Beach bridge to the South Carolina StateLine and the Calabash River are rarely opened to trawling because <strong>of</strong> the abundance <strong>of</strong> smallshrimp. The area from Sunset Beach bridge to Calabash River is usually opened toward theend <strong>of</strong> the season so that the shrimp won’t be “lost” to South Carolina.The channels that connect the IWW with the Atlantic Ocean usually remain open duringthe entire year to allow harvest <strong>of</strong> shrimp that are migrating to the ocean. In rare instances <strong>of</strong>very heavy rainfall, these channels may be closed. The areas include Elizabeth River,Dutchman Creek, Montgomery Slough, Jink’s Creek and Bonaparte Creek. Trawling inMontgomery Slough and the Elizabeth River has become the subject <strong>of</strong> discussion amongstshrimpers as well as the public because <strong>of</strong> concerns about bycatch as well as interference withnavigation.Eastern Channel, located behind Ocean Isle Beach, is a shallow channel (less than 1meter at mean low tide) that connects the IWW at Marker 93 to Jink’s Creek. These watershave not been opened to harvest in the last 15 years.The Shallotte River was opened and closed to shrimp trawling based on size andabundance until 1998. However, DMF sampling has shown that shrimp rarely reach large sizesand the head-on counts remain greater than 60 during most <strong>of</strong> the season. Consequently, thelast time DMF opened Shallotte River was a span <strong>of</strong> time in 1998 between July 8 andSeptember 9. There is a small channel net fishery (
The banks side <strong>of</strong> Core Sound north <strong>of</strong> Drum Inlet is a shallow sand bottom area withpatches <strong>of</strong> SAVs. This shallow water/SAV habitat in Core Sound south <strong>of</strong> Drum Inlet and insouthern Pamlico Sound from Wainwright Island north to Oregon Inlet is protected from shrimptrawling and mechanical clam harvest by different methods. The Wainwright Island to OregonInlet zone along the banks is designated as a no trawl area. The area from Drum Inlet south toCape Lookout is also a no trawl area.The tributaries <strong>of</strong> Core Sound on the mainland side are designated as SpecialSecondary Nursery Areas (SSNA). They include Jarrett Bay, Brett Bay, Nelson Bay, Thor<strong>of</strong>areBay-Barry Bay and Cedar Island Bay. These bays can be opened after August 16 th whenshrimp reach a harvestable size and fish abundance is at relatively lower levels. Historicallythese openings have been coordinated whenever possible with the October opening <strong>of</strong> NewportRiver to diffuse effort, even though they can now be opened as early as mid-August.10.1.17.2 Management Options1. Status quo (potential to open up to PNA line when shrimp size sufficient)2. Prohibit all shrimp trawlers in SSNAs <strong>of</strong> Core Sound3. Status quo (Core Sound banks side opened)4. Close grassbed areas on the banks side <strong>of</strong> northern Core Sound10.1.17.3 Recommended Management StrategyMake banks side north <strong>of</strong> Drum Inlet to Wainwright Island a Trawl Net Prohibited Area.This strategy would meet objectives 1, 2, 3, 4, and 5 <strong>of</strong> this plan. The actions in Section10.1.17.4 need to be implemented to accomplish these strategies.10.1.17.4 ActionsAction 1:Modify rule 03R .0106 by modifying section (1) to include the area from DrumInlet to Wainwright Island as a Trawl Net Prohibited area.10.1.18 SHRIMP MANAGEMENT IN THE NEWPORT RIVER10.1.18.1 Issue/ Purpose <strong>Shrimp</strong> Management in the Newport River.The Newport River is relatively small estuary <strong>of</strong> about 63 square miles located north <strong>of</strong>Morehead City in Carteret County. Its average depth is three feet with maximum depth innatural channels <strong>of</strong> six feet and 40 feet in the dredged channels near the State Port. Thewestern portion <strong>of</strong> Newport River has bottoms composed <strong>of</strong> silts, clays and oyster rocks and theeastern part is composed <strong>of</strong> firm sand bottom. The river has a long history <strong>of</strong> disagreementsconcerning where the proper location <strong>of</strong> the shrimp line should be. During the long period <strong>of</strong>conflict that peaked in the mid-1980s, the line would be moved three or four times a season inresponse to political lobbying and shrimp size variation.<strong>Shrimp</strong> harvest generally begins in June when there are pink shrimp present and cancontinue into November when white shrimp are abundant. Although the conflict over thelocation <strong>of</strong> the line has greatly decreased in recent years, Newport River is still the source <strong>of</strong>controversy at times in the fall. The primary conflict is between the full-time commercialfishermen, who generally want a line downstream where the bigger shrimp will migrate to them103
when they reach a marketable size, and the part-time fishermen, who want a line fartherupstream to access the shrimp in shallower water, harvest the majority <strong>of</strong> them, and return tojobs or hunting season.10.1.18.2 Management Options1. Status quo (potential to open to PNA line when shrimp size sufficient)2. Establish timeline when otter trawls would be prohibited3. Implement permanent line at Penn Point-Hardesty Farm line4. Prohibit all shrimp trawlers in Newport River10.1.18.3 Recommended Management StrategyImplement permanent Penn Point-Hardesty Farms line. This strategy would meetobjectives 1, 2, 3, 4, and 5 <strong>of</strong> this plan. The actions in Section 10.1.18.4 need to beimplemented to accomplish these strategies.10.1.18.4 ActionsAction 1:Modify rule 03R .0106 by adding section (7) to implement a permanent PennPoint-Hardesty Farms line in Newport River upstream <strong>of</strong> which is close dtotrawling.10.1.19 SHRIMP MANAGEMENT IN BOGUE SOUND AND NORTH RIVER10.1.19.1 Issue/ Purpose <strong>Shrimp</strong> Management in Bouge Sound and North River.Bogue Sound is located in Carteret County and lies between the State Port in MoreheadCity to the east and the town <strong>of</strong> Emerald Isle to the west. The sound is closed to trawling north<strong>of</strong> the IWW on the mainland side because <strong>of</strong> SAV and some shellfish beds. The tributaries <strong>of</strong>Broad, Gales, Jumping Run, and Saunders creeks are designated Primary Nursery Areas. Theclosure <strong>of</strong> the mainland side <strong>of</strong> the ICW serves as a buffer zone to the PNAs and shrimp areharvested from the ICW as they are migrating toward the inlets (Beaufort and Bogue). Therehave been requests to open the northern side <strong>of</strong> the ICW, particularly around Broad Creek whenwhite shrimp are abundant. These requests usually come from skimmer trawl fishermen whohave problems fishing in the waterway.There is also a rectangular section <strong>of</strong> Bogue Sound in the western portion that is closedto trawling in order to protect seagrass beds with bay scallops which are located there. Most <strong>of</strong>Bogue Sound outside <strong>of</strong> the IWW is too shallow to trawl in, but there is a channel on the banksside that runs along the village <strong>of</strong> Salter Path and one that runs along Pine Knoll Shores thatare trawled.North River is located west <strong>of</strong> Beaufort and east <strong>of</strong> Harkers Island. It also has a history<strong>of</strong> line moving disputes between a downstream line at Long Point line and an upstream linecalled the Oyster House line. Both lines were established to protect small brown shrimp in theearly summer (Long Point line) and small white shrimp in the fall (Oyster House line). Thesource <strong>of</strong> conflict was the appropriate time to open trawling up to the Oyster House line.Concerns with opening the area too late include the shrimp running on a northeast wind as wellas running on rain and/or full or new moon because <strong>of</strong> its close proximity to Beaufort Inlet.104
10.1.19.2 Management Options1. Status quo (opening dates determined by shrimp size)2. Establish a timeline when otter trawls would be prohibited in Bogue Sound3. Prohibit all otter trawls and skimmer trawls in Bogue Sound10.1.19.3 Recommended Management StrategyNo changes to the current management strategy (opening dates determined by shrimpsize) is recommended. This strategy would meet objectives 1, 2, 3, 4, and 5 <strong>of</strong> this plan.10.1.19.4 ActionsNo new action is needed.10.1.20 SHRIMP MANAGEMENT IN THE WHITE OAK RIVER10.1.20.1 Issue/ Purpose <strong>Shrimp</strong> Management in the White Oak River.White Oak River is located on the Onslow/Carteret County line and has the town <strong>of</strong>Swansboro at its mouth. Due to the presence <strong>of</strong> oyster rocks and shoals, there are only a fewplaces that are able to be trawled in the White Oak. They are Hills Bay below Jones Island, themouth <strong>of</strong> Pettiford Creek, the Turnstake, Cahoon’s Slough above Jones Island, and the GatorGap upstream near Bluff Point.The river is closed at the Highway 24 Bridge with the issuance <strong>of</strong> the first shrimpproclamation in early June. Sampling for opening White Oak River generally begins around theend <strong>of</strong> June because <strong>of</strong> the tendency for shrimp there to migrate out before they “normallyshould”. Historically, the DMF has opened White Oak between July 10 and July 20. For years,the river was opened to the Gator Gap where the river widens near Bluff Point. Small shrimpwere <strong>of</strong>ten forced across that line and the DMF has tried alternative line locations with varyingsuccess that allow for shrimping in the lower portion <strong>of</strong> the river while protecting small brownand white shrimp upstream. Adjusting the line is difficult due to the amount <strong>of</strong> oyster rocks inthe river. <strong>Shrimp</strong>ers like to tow on the line, therefore placement <strong>of</strong> the line over oyster rock canlead to habitat destruction <strong>of</strong> those rocks.Issues that must be considered in the management <strong>of</strong> this river besides shrimp size areweather conditions and lunar stage. Early northerly winds with a lot <strong>of</strong> rain or a hurricane canforce the small shrimp to run before the normal opening dates. A full or new moon on top <strong>of</strong> thatmay also cause the DMF to open on a smaller count so they can be caught.Occasionally, shrimp will not reach a 45-55 count but will remain at a small sizethroughout the season. In this case, the DMF may open on a smaller count. The river may ormay not close due to small white shrimp. Over the past few years, once the river has beenopen, a closure for small whites has not been needed as the two species seem to segregatewithin the river very well with small whites staying up the river above the closure line in the lowersalinities while the larger brown shrimp have moved down in the open area. However, whenthere is good sign <strong>of</strong> small white shrimp, the river has been closed in September.With the bridge being the closure line, there is no shrimp trawling allowed in White OakRiver when it is closed. If the shrimp leave before the river is opened, then the only fishermen105
who benefit are a few channel net fishermen and maybe ocean trawlers. Options have beenconsidered to leave the river closed at all times to protect the oyster rocks, but that isinconsistent with permitting mechanical clam harvest up to the Turnstake and does not allowtrawlers to catch the shrimp at all.10.1.20.2 Management Options1. Status quo (opening dates determined by shrimp size)2. Establish a “permanent” line from the Turnstake downstream to allow harvest whenshrimp begin to migrate3. Establish a timeline when otter trawls would be prohibited in White Oak River4. Prohibit all otter trawls and skimmer trawls in White Oak River10.1.20.3 Recommended Management StrategyStraighten the Hancock Point area line for ease <strong>of</strong> enforcement. However, the line shallnot be placed upstream <strong>of</strong> the Hancock Point area for protection <strong>of</strong> oyster rocks and smallshrimp. This strategy would meet objectives 1, 2, 3, 4, and 5 <strong>of</strong> this plan. The action in Section10.1.20.4 needs to be implemented to accomplish these strategies.10.1.20.4 ActionsAction 1:Modify rule 03R .0106 by adding section (8) to implement a permanent line inWhite Oak River upstream <strong>of</strong> which is closed to trawling.10.1.21 SHRIMP MANAGEMENT IN NEUSE RIVER10.1.21.1 Issue/ Purpose <strong>Shrimp</strong> Management in the Neuse River.The Neuse River is one <strong>of</strong> the state’s larger rivers and separates Pamlico County to thenorth from Craven and Carteret counties to the south. The river is one mile wide at New Bernand five miles wide near its mouth, with depths in that stretch ranging from 12 to 23 feet.Although shrimp and crab trawling are technically permitted from New Bern downstream to thePamlico Sound (except when closed due to small shrimp size), shrimp are only found as farupstream as Slocum Creek. The majority <strong>of</strong> the Neuse tributaries are designated primary(2,835 acres), secondary (2,358 acres), or special secondary (963 acres) nursery areas.<strong>Shrimp</strong> generally grow in these nursery areas during the early spring and begin migrating out <strong>of</strong>them and into the river proper in July. Once in the river, they migrate around Cedar Island intoCore Sound, or down Adams and Clubfoot creeks toward Beaufort Inlet to the ocean.Neuse River ranks third in the state behind Pamlico and Core sounds in shrimp trawllandings. From 1994 to 2003 landings have ranged from 19,942 pounds to 216,922 poundsand averaged 135,369 pounds. Value <strong>of</strong> shrimp catches during those years ranged from$43,989 to $471,504 and averaged $ 304,502. Of the commercial landings in Neuse River from1994 through 2003, 95.72% were harvested by shrimp trawls, 3.84% by skimmer nets, and0.25% by channel nets. During that period, 4,542 trawl trips were made by 824 licensees for anaverage <strong>of</strong> 452 trips per year by 82 participants.10.1.21.2 Management Options1. Status quo (potential to close and open when shrimp are <strong>of</strong> sufficient size)106
2. Implement closure <strong>of</strong> Neuse River and Adams Creek with initial June proclamation andopen in mid July when the majority <strong>of</strong> the shrimp reach 30-35 count (heads on)3. Prohibit all shrimp trawlers in Neuse River and tributaries4. Prohibit shrimp and crab trawling (Prohibited Trawling Area) upstream <strong>of</strong> a line fromWilkinson Point to Cherry Point10.1.21.3 Recommended Management StrategyRestrict total headrope to 90 feet upstream <strong>of</strong> a line between Windmill Point at Orientaland Winthrop Point at Adams Creek. Never open above Wilkinson Point to Cherry Point toreduce overall trawling impact on river bottom and crabs and finfish. This strategy would meetobjectives 1, 2, 3, 4, and 5 <strong>of</strong> this plan. The actions in Section 10.1.21.4 need to beimplemented to accomplish these strategies.10.1.21.4 ActionsAction 1:Action 2:Modify Rule 3R 0.006 (7) TRAWL NETS PROHIBITED, to close waters to shrimptrawling above Wilkinson Point to Cherry Point.Modify Rule 3L 0.0103 PROHIBITED NETS AND MESH SIZES, to restrict totalheadrope to 90 feet upstream <strong>of</strong> a line between Windmill Point at Oriental andWinthrop Point at Adams Creek.10.1.22 SHRIMP MANAGEMENT IN BAY RIVER10.1.22.1 Issue/ Purpose <strong>Shrimp</strong> Management in Bay River.Bay River is a tributary <strong>of</strong> Pamlico Sound, located in Pamlico County, between thePamlico and Neuse rivers. The main bottom type in Bay River is s<strong>of</strong>t mud, with patches <strong>of</strong> hardsand bottom. The shallow waters <strong>of</strong> the feeder creeks and bays contain patches <strong>of</strong> submergedaquatic vegetation (wild celery, and widgeongrass). Trawling (shrimp and crab) is only allowedin the main stem <strong>of</strong> the river. All feeder creeks and bays are classified as either Nursery Areas(Primary or Secondary) or no trawl areas.Bay River accounts for 0.2% <strong>of</strong> the total statewide shrimp production. Average annualshrimp landings are 13,917 pounds, with an average dockside value <strong>of</strong> $31,562. Ninety-sevenpercent <strong>of</strong> the shrimp landed from Bay River are caught by shrimp trawls.10.1.22.2 Management Options1. Status quo (potential to close and open when shrimp are <strong>of</strong> sufficient size)2. Harvest Season (Month (s), or Month (s)/Day (s) closures)a) Implement closure <strong>of</strong> Bay River with initial June proclamation and open in midJuly (based on predetermined heads-on count).b) Implement split season for commercial and RCGL shrimpers (same as # 2 aboveexcept open to RCGL harvest 1 or 2 weeks prior to commercial opening)c) Open in July (based on predetermined heads-on count or pre determined date)and close to shrimp trawling in mid to late August3. Area Closuresa) Prohibit all shrimp trawlers in Bay Riverb) Close portions <strong>of</strong> the river to shrimp trawl harvest.4. Regulate Means and Methods (gear and vessel)107
a) Implement headrope size limit on shrimp trawlers working in Bay River+ Allows for all size classes <strong>of</strong> vessels to workb) Increase tailbag mesh size.c) Implement maximum vessel length restriction on shrimp trawlers working in BayRiver10.1.22.3 Recommended Management StrategyOpen in July and close to shrimp trawling in mid to late August. Implement 90 footheadrope size limit on shrimp trawlers working in Bay River. This strategy would meetobjectives 1, 2, 3, 4, and 5 <strong>of</strong> this plan. The actions in Section 10.1.22.4 need to beimplemented to accomplish these strategies.10.1.22.4 ActionsAction 1:Action 2:Modify existing proclamations to open and close based on count size andabundance.Modify Rule 3L 0.0103 PROHIBITED NETS AND MESH SIZES, to restrict totalheadrope to 90 feet upstream <strong>of</strong> a line between Maw Point and Bay River Point10.1.23 SHRIMP MANAGEMENT IN THE PAMLICO RIVER10.1.23.1 Issue/ Purpose <strong>Shrimp</strong> Management in the Pamlico River.The Pamlico River is a tributary <strong>of</strong> Pamlico Sound. The main bottom type is s<strong>of</strong>t mud,with patches <strong>of</strong> hard sand bottom in waters less than six feet deep. The shallow waters <strong>of</strong> thefeeder creeks and bays contain patches <strong>of</strong> submerged aquatic vegetation (wild celery, andwidgeongrass).Trawling (shrimp and crab) is only allowed in the main stem <strong>of</strong> the river. All feedercreeks and bays are classified as either Nursery Areas (Primary, Secondary, SpecialSecondary) or Inland Waters all <strong>of</strong> which are closed to trawling. Overall this system isapproximately 82,705 acres in size. 76,516 acres are under DMF jurisdiction. 1,414 acres areclassified as Primary Nursery areas, 11,231 acres as Secondary Nursery areas, 2,736 acres asSpecial Secondary Nursery areas, and 1,184 acres <strong>of</strong> no trawl areas. Seventy-nine percent <strong>of</strong>the water under DMF jurisdiction is open to trawling.Pamlico River accounts for 0.6% <strong>of</strong> the total statewide shrimp production. Averageannual shrimp landings are 38,301 pounds, with an average dockside value <strong>of</strong> $91,355. Ninetyeightpercent <strong>of</strong> the shrimp landed from the Pamlico River are caught by shrimp trawls (1994 –2003 Trip ticket Data). Other gears with reported shrimp landings are; skimmer trawls (0.96%),crab trawls (0.49%), crab pots (0.14%), seines (0.06%), and sink gill net (0.02%).10.1.23.2 Management Options1. Status quo (potential to close and open when shrimp are <strong>of</strong> sufficient size)2. Harvest Season (Month (s), or Month (s)/Day (s) closures)a) Implement closure <strong>of</strong> Pamlico River with initial June proclamation and open inmid July (based on predetermined heads-on count).b) Implement split season for commercial and RCGL shrimpers (same as # 2 aboveexcept open to RCGL harvest 1 or 2 weeks prior to commercial opening)108
c) Open in July (based on predetermined heads-on count or pre determined date)and close to shrimp trawling in mid to late August3. Area Closuresa) Prohibit all shrimp trawlers in Pamlico Riverb) Close portions <strong>of</strong> the river to shrimp trawl harvest.4. Regulate Means and Methods (gear and vessel)a) Implement headrope size limit on shrimp trawlers working in Pamlico Riverb) Increase tailbag mesh size.c) Implement maximum vessel length restriction on shrimp trawlers working inPamlico River10.1.23.3 Recommended Management StrategyOpen in July and close to shrimp trawling in August (July 7 through August 7). Allwaters upstream <strong>of</strong> a line from Wades Point to Goose Creek will be closed to shrimp trawlingand implement a 90 feet maximum combined headrope length in the open portion <strong>of</strong> thePamlico River (upstream <strong>of</strong> a line from Pamlico Point to Willow Point). This strategy would meetobjectives 1, 2, 3, 4, and 5 <strong>of</strong> this plan. The actions in Section 10.1.23.4 need to beimplemented to accomplish these strategies.10.1.23.4 ActionsAction 1:Action 2:Modify Rule 3L 0.0103 PROHIBITED NETS AND MESH SIZES, to restrict totalheadrope to 90 feet upstream <strong>of</strong> a line between Pamlico Point and Willow Point.Modify Rule 3R 0.006 (7) TRAWL NETS PROHIBITED, to close waters totrawling upstream <strong>of</strong> a line between Wades Point and Goose Creek.10.1.24 SHRIMP MANAGEMENT IN PUNGO RIVER10.1.24.1 Issue/ Purpose <strong>Shrimp</strong> Management in the Pungo River.The Pungo River is a tributary <strong>of</strong> Pamlico Sound. The main bottom type is s<strong>of</strong>t mud,with patches <strong>of</strong> hard sand bottom. The shallow waters <strong>of</strong> the feeder creeks contain patches <strong>of</strong>submerged aquatic vegetation (wild celery, eel grass, and widgeongrass).Trawling (shrimp and crab) is only allowed in the main stem <strong>of</strong> the river. All feedercreeks are classified as either Nursery Areas (Primary, Secondary, Special Secondary) orInland waters all <strong>of</strong> which are closed to trawling. Overall the Pungo River is approximately32,741 acres in size. Of that 25,530 acres are open to trawling. The remainder is eithernursery areas (4,361 acres) or inland waters (3,850 acres) all <strong>of</strong> which is closed to trawling.Other commercial fisheries in the Pungo River include crab pot, crab trawl, gill net, eel potting,pound netting, and long-haul.The Pungo River accounts for 0.05% <strong>of</strong> the total statewide shrimp production. Averageannual shrimp landings are 3,862 pounds, with an average dockside value <strong>of</strong> $8,565. Ninetyninepercent <strong>of</strong> the shrimp landed from Pungo River are caught by shrimp trawls (1996 – 2003Trip ticket Data). The remaining shrimp landings were reported from crab pots, and dip nets.10.1.24.2 Management Options1. Status quo (potential to close and open when shrimp are <strong>of</strong> sufficient size)109
2. Harvest Season (Month (s), or Month (s)/Day (s) closures)a) Implement closure <strong>of</strong> Pungo River with initial June proclamation and open in midJuly (based on predetermined heads-on count).b) Implement split season for commercial and RCGL shrimpers (same as # 2 aboveexcept open to RCGL harvest 1 or 2 weeks prior to commercial opening)c) Open in July (based on predetermined heads-on count or pre determined date)and close to shrimp trawling in mid to late August3. Area Closuresa) Prohibit all shrimp trawlers in Pungo Riverb) Close portions <strong>of</strong> the river to shrimp trawl harvest.4. Regulate Means and Methods (gear and vessel)a) Implement headrope size limit on shrimp trawlers working in Pungo Riverb) Increase tailbag mesh size.c) Implement maximum vessel length restriction on shrimp trawlers working inPungo River10.1.24.3 Recommended Management StrategyAll waters upstream <strong>of</strong> a line from Wades Point to Abels Bay will be closed to shrimptrawling. This strategy would meet objectives 1, 2, 3, 4, and 5 <strong>of</strong> this plan. The action inSection 10.1.24.4 needs to be implemented to accomplish this strategy.10.1.24.4 ActionsAction 1:Modify Rule 3R 0.006 (7) TRAWL NETS PROHIBITED, to close waters totrawling upstream <strong>of</strong> a line between Wades Point and Abels Bay (DMF option).10.1.25 SHRIMP MANAGEMENT IN THE ATLANTIC OCEAN10.1.25.1 Issue/ Purpose <strong>Shrimp</strong> Management in the Atlantic Ocean.North Carolina’s coastline on the Atlantic Ocean is comprised <strong>of</strong> barrier islands thatstretch approximately 484 kilometers. Shoals extending perpendicular from shore accompanycapes and inlets along North Carolina’s coastal ocean. On average, 24% <strong>of</strong> shrimp landed inNorth Carolina are harvested from these nearshore (< 3 miles) ocean waters. Near-shorehardbottom areas, dense concentrations <strong>of</strong> marine algae, artificial reefs and shipwrecks limit theamount <strong>of</strong> trawlable bottom available to commercial fishers.Since shrimp that migrate from the estuaries are usually large, the DMF does notactively manage the ocean waters. However, during the past few years and exclusively <strong>of</strong>f theBrunswick county coast, DMF has been requested by the fishermen to take a more active role inthe management <strong>of</strong> the ocean shrimp fishery. These requests were precipitated as result <strong>of</strong> theheavy hurricane or tropical storm induced rains that have impacted southeastern North Carolinawith regularity since the mid 1990s. Fresh water from these heavy rains dramatically reducessalinities in the estuaries causing the shrimp to prematurely migrate from the estuaries into theocean. When this occurs, DMF generally closes the impacted ocean and estuarine waters.With the exception <strong>of</strong> 2001, closures <strong>of</strong> this nature have occurred each year during the period1999-2003.An average <strong>of</strong> 221 vessels landed shrimp from the ocean during 1994-2003.110
10.1.25.2 Management Options1. Status quo (potential opening dates set by proclamation and determined by sampling)2. Allow night-time trawling <strong>of</strong>f Brunswick County.3. Prohibit weekend trawling <strong>of</strong>f Brunswick County4. Prohibit all trawling10.1.25.3 Recommended Management StrategyStatus quo (potential opening dates set by proclamation and determined by sampling). Thisstrategy would meet objectives 1, 2, 3, 4, and 5 <strong>of</strong> this plan.10.1.25.4 ActionsNo new action is required.10.1.26 SHRIMP MANAGEMENT IN PAMLICO SOUND10.1.26.1 Issue/ Purpose <strong>Shrimp</strong> Management in Pamlico Sound.The Pamlico Sound system extends from Oregon Inlet south to Core Sound. Salinityvaries from 25 - 30 ppt near the three inlets to near zero in the upper tributaries. Two large riversystems (Neuse and Tar-Pamlico) provide the major fresh water inputs. The average depth <strong>of</strong>the sound is 16 ft. Numerous small creeks and bays surround Pamlico Sound. The Sound isdivided into two basins east and west <strong>of</strong> Bluff Shoal. Extensive low salinity Juncus marshesborder the sound and many <strong>of</strong> the tributary bays and creeks. Significant SAV beds occur in thesound, with high salinity species (e.g., eel grass) along the shoals behind the Outer Banks inthe east and low salinity species (e.g., widgeon grass, wild celery) along some <strong>of</strong> the westernshores. There are diurnal tides <strong>of</strong> 2 - 3 ft near the three inlets, but virtually no lunar tides awayfrom the inlet areas. However, wind tides exceeding 2 ft regularly occur during storms.Trawling (shrimp and crab) is only allowed in the main portion <strong>of</strong> the sound. All feedercreeks and bays are classified as either Nursery Areas (Primary, Secondary, SpecialSecondary) or no trawl areas all <strong>of</strong> which are closed to trawling (Map 2). Overall this system isapproximately 1,129,577 acres in size. 1,088,258 acres are under DMF jurisdiction (coastaland joint waters). 5,400 acres are classified as Primary Nursery areas, 30,184 acres asSecondary Nursery areas, 1,916 acres as Special Secondary Nursery areas, and 172,128 acres<strong>of</strong> no trawl areas. Seventy-nine percent <strong>of</strong> the water under DMF jurisdiction is open to trawling.Other commercial fisheries in Pamlico Sound include crab pot, crab trawl, crab dredging, oysterdredging, clam kicking, gill net, pound netting, and long-haul. Over the last 11 years, portions <strong>of</strong>western Pamlico Sound (Mouth’s <strong>of</strong> Rose, Spencer, SwanQuater, and Juniper bay’s) have beenclosed six times to shrimp trawling.Pamlico Sound accounts for 51% <strong>of</strong> the total statewide shrimp production. Averageannual shrimp landings are 3,637,844 pounds, with an average dockside value <strong>of</strong> $8,993,767.Ninety-nine percent <strong>of</strong> the shrimp landed from the Pamlico Sound are caught by shrimp trawls(1994 – 2003 Trip ticket Data). Other gears with reported shrimp landings are; channel net(0.01%) skimmer trawls (0.03%), and crab trawls (0.03%).111
10.1.26.2 Management Options1. Status quo (potential to close and open when shrimp are <strong>of</strong> sufficient size)2. Harvest Season (Month (s), or Month (s)/Day (s) closures)a) Implement closure <strong>of</strong> Pamlico Sound with initial June proclamation and open inmid July (based on predetermined heads-on count).b) Implement split season for commercial and RCGL shrimpers (same as # 2 aboveexcept open to RCGL harvest 1 or 2 weeks prior to commercial opening)c) Open in July (based on predetermined heads-on count or pre determined date)and close to shrimp trawling in mid to late August3. Area Closuresa) Prohibit all shrimp trawlers in Pamlico Soundb) Close portions <strong>of</strong> the river to shrimp trawl harvest.4. Regulate Means and Methods (gear and vessel)a) Implement headrope size limit on shrimp trawlers working in Pamlico Soundb) Increase tailbag mesh size.c) Implement maximum vessel length restriction on shrimp trawlers working inPamlico Sound10.1.26.3 Recommended Management StrategyStatus quo, potential to close and open when shrimp are <strong>of</strong> sufficient size. This strategywould meet objectives 1, 2, 3, 4, and 5 <strong>of</strong> this plan.10.1.26.4 ActionsNo new action is required.10.1.27 SHRIMP MANAGEMENT IN ROANOKE SOUND10.1.27.1 Issue/ Purpose <strong>Shrimp</strong> Management in the Roanoke Sound.Roanoke Sound system extends from Oregon Inlet north, along the east side <strong>of</strong>Roanoke Island to Albemarle Sound. Trawling (shrimp and crab) is only allowed in the mainportion <strong>of</strong> the sound. With the exception <strong>of</strong> Outer Broad Creek, all feeder creeks and bays areclassified as either Nursery Areas (Primary, Secondary, Special Secondary) or no trawl areas,all <strong>of</strong> which are closed to trawling. This system is approximately 21,168 acres in size. Onehundred sixty seven acres are classified as Primary Nursery areas, 168 acres as SecondaryNursery areas, and 468 acres as Special Secondary Nursery areas. The majority <strong>of</strong> the shrimptrawling in Roanoke Sound occurs in Roanoke channel, Outer Broad Creek, and the WancheseChannel. Special secondary nursery areas <strong>of</strong> Outer Shallowbag Bay, and Kitty Hawk Bay-Buzzard Bay, are also popular, when open. Other commercial fisheries in Roanoke Soundinclude crab pot, crab trawl, gill net, pound netting, fyke net and long-haul.Roanoke Sound accounts for 0.11% <strong>of</strong> the total statewide shrimp production. Averageannual shrimp landings are 7,959 pounds, with an average dockside value <strong>of</strong> $16,514. Ninetyfivepercent <strong>of</strong> the shrimp landed from the Roanoke Sound are caught by shrimp trawls (1994 –2003 Trip ticket Data). Other gears with reported shrimp landings are crab pots (3.09%), peelerpots (1.45%), and crab trawls (0.02%).112
10.1.27.2 Management Options1. Status quo (potential to close and open when shrimp are <strong>of</strong> sufficient size)2. Harvest Season (Month (s), or Month (s)/Day (s) closures)a) Implement closure <strong>of</strong> Roanoke Sound with initial June proclamation and open inmid July (based on predetermined heads-on count).b) Implement split season for commercial and RCGL shrimpers (same as # 2 aboveexcept open to RCGL harvest 1 or 2 weeks prior to commercial opening)c) Open in July (based on predetermined heads-on count or pre determined date)and close to shrimp trawling in mid to late August3. Area Closuresa) Prohibit all shrimp trawlers in Roanoke Soundb) Close portions <strong>of</strong> the Sound to shrimp trawl harvest.4. Regulate Means and Methods (gear and vessel)a) Implement headrope size limit on shrimp trawlers working in Roanoke Soundb) Increase tailbag mesh size.c) Implement maximum vessel length restriction on shrimp trawlers working inRoanoke Sound10.1.27.3 Recommended Management StrategyStatus quo, potential to close and open when shrimp are <strong>of</strong> sufficient size. This strategywould meet objectives 1, 2, 3, 4, and 5 <strong>of</strong> this plan.10.1.27.4 ActionsNo new action is needed.10.1.28 SHRIMP MANAGEMENT IN CROATAN SOUND10.1.28.1 Issue/ Purpose <strong>Shrimp</strong> Management in the Croatan Sound.Croatan Sound is bound by Pamlico Sound to the south, extends along the west side <strong>of</strong>Roanoke Island, to Albemarle Sound to the North This system is approximately 26,272 acres insize. There is one nursery areas in Croatan Sound, Spencers Creek, which is closed totrawling. Additionally, one hundred and thirty five acres are classified as inland areas and areclosed to trawling. The majority <strong>of</strong> the shrimp trawling in Croatan Sound occurs in deep holesand sloughs. Other commercial fisheries in Croatan Sound include crab pot, crab trawl, gill net,and pound netting,Croatan Sound accounts for 0.14% <strong>of</strong> the total statewide shrimp production. Averageannual shrimp landings are 9,605 pounds, with an average dockside value <strong>of</strong> $23,067. Ninetyeightpercent <strong>of</strong> the shrimp landed from the Croatan Sound are caught by shrimp trawls (1994 –2003 Trip ticket Data). Other gears with reported shrimp landings are crab pots (1.3%), andcrab trawls (0.1%).10.1.28.2 Management Options1. Status quo (potential to close and open when shrimp are <strong>of</strong> sufficient size)2. Harvest Season (Month (s), or Month (s)/Day (s) closures)a) Implement closure <strong>of</strong> Croatan Sound with initial June proclamation and open in113
mid July (based on predetermined heads-on count).b) Implement split season for commercial and RCGL shrimpers (same as # 2 aboveexcept open to RCGL harvest 1 or 2 weeks prior to commercial opening)c) Open in July (based on predetermined heads-on count or pre determined date)and close to shrimp trawling in mid to late August3. Area Closuresa) Prohibit all shrimp trawlers in Croatan Soundb) Close portions <strong>of</strong> the Sound to shrimp trawl harvest.4. Regulate Means and Methods (gear and vessel)a) Implement headrope size limit on shrimp trawlers working in Croatan Soundb) Increase tailbag mesh size.c) Implement maximum vessel length restriction on shrimp trawlers working inCroatan Sound10.1.28.3 Recommended Management StrategyStatus quo, potential to close and open when shrimp are <strong>of</strong> sufficient size. This strategywould meet objectives 1, 2, 3, 4, and 5 <strong>of</strong> this plan.10.1.28.4 ActionsNo new action is needed.10.2 SUMMARY OF MANAGEMENT ACTIONS10.2.1 Rules (new, modifications, or technical changes)See Appendix 28 for proposed rules.10.2.2 Legislative ActionNo legislative action is required.10.2.3 Processes1. Identify and delineate Strategic Habitat Areas (shallow s<strong>of</strong>t bottom, low and highsalinity SAV, and shell bottom) that will enhance protection <strong>of</strong> penaeid shrimp.2. Prevent loss <strong>of</strong> any additional riparian wetlands through the permitting process, landacquisition, or land use planning.3. Accelerate restoration <strong>of</strong> wetlands to enhance nursery habitat for shrimp andimprove water quality.4. Increase use <strong>of</strong> effective vegetated upland and wetland buffers along coastalstreams and rivers to enhance wetlands and improve water quality.5. Minimize wetland losses to estuarine shoreline stabilization by:I. Revising CRC estuarine and public trust shoreline stabilization rules using bestavailable information.II. Incorporating estuarine erosion rates in siting criteria for shoreline developmentand stabilization measures.III. Developing and promoting incentives for use <strong>of</strong> alternatives to vertical shorelinestabilization measures.114
6. Protect shallow s<strong>of</strong>t bottom habitat in areas that are highly utilized as shrimp nurseryor foraging grounds.7. Assess the distribution, concentration, and threat <strong>of</strong> heavy metals and other toxiccontaminants in freshwater and estuarine sediments and identify the areas <strong>of</strong>greatest concern to focus water quality improvement efforts.8. Evaluate the effects <strong>of</strong> clam kicking and crab dredging on s<strong>of</strong>t bottom habitat andshrimp.9. Completely map all low and high salinity SAV in North Carolina.10. Expand nursery sampling to include high and low salinity SAV beds to adequatelyevaluate their use by penaeid shrimp and other species, and trends in those species.11. Reduce nutrient and sediment loading in the Albemarle-Pamlico system, particularlythe Neuse and Tar-Pamlico rivers, to levels that will support SAV, using regulatoryand non-regulatory actions.12 Evaluate dock criteria to determine if existing requirements are adequate for SAVsurvival and growth and modify accordingly.13. Develop and implement a comprehensive coastal marina and dock managementplan and policy to minimize impacts to SAV, shell bottom, s<strong>of</strong>t bottom, and waterquality.14. Expand areas where dredging and trawling is not allowed to allow some recovery <strong>of</strong>SAV and shell bottom where those habitats historically occurred.15. Seek additional resources to enhance enforcement <strong>of</strong> and compliance with bottomdisturbing gear restrictions that protect SAV and other habitats utilized by shrimp.16 Accelerate restoration <strong>of</strong> oyster sanctuaries.17. Conduct research to evaluate the role <strong>of</strong> shell hash and shell bottom for penaeidshrimp recruitment or other ecological functions, particularly where SAV is absent.18. Improve methods to reduce sediment and nutrient pollution from construction sites,agriculture, and forestry.19. Increase on-site infiltration <strong>of</strong> stormwater through voluntary or regulatory measures.20. Provide more incentives for low-impact development.21. Reduce impervious surfaces where feasible and reduce the maximum amount <strong>of</strong>impervious surfaces allowed in the absence <strong>of</strong> engineered stormwater controls.22. Current Phase II stormwater rules should be implemented and modified if found tobe ineffective.10.2.4 Management Related Research (not ranked in order <strong>of</strong> priority)1. Bycatch characterization work needs to be conducted across all strata (for example;season, areas, vessel type, and dominant species).2. Obtain mortality (immediate and post harvest) estimates <strong>of</strong> culled, active and passive,bycatch.3. Develop standard protocol for bycatch estimations.4. Continue to develop and test methods to reduce bycatch in the commercial andrecreational shrimp trawl fisheries.5. Continue to develop and test alternate gears (shrimp traps) for shrimp harvest.6. Initiate sampling to investigate if Chadwick Bay functions as a Special SecondaryNursery Area115
10.2.5 Biological Research Needs (not ranked in order <strong>of</strong> priority)1. Define and quantify the intensity, duration and spatial scale <strong>of</strong> trawling effort in NCestuaries.2. Map and quantify the habitat structure and sediment types in North Carolina estuaries.3. Determine the effects <strong>of</strong> trawling on sediment size distribution and organic carboncontent.4. Determine the effect <strong>of</strong> trawling on water quality and primary productivity.5. Determine the physical effects <strong>of</strong> currents, storms, animal activities, etc. on sedimentdisturbances and compare to mobile fishing gear effects.6. Determine the effects trawling and recovery time <strong>of</strong> benthic community structure indifferent habitat types7. Determine the effects <strong>of</strong> trawling on secondary productivity and how it affects localpathways <strong>of</strong> food energy transfer.10.2.6 Social and Economic Research Needs (ranked in order <strong>of</strong> priority)1. Determine the extent <strong>of</strong> non-RCGL recreational shrimp harvest that is occurring. Thisgroup primarily is those who use cast nets to take shrimp either for bait or personalconsumption.10.2.7 Data Needs1. Effort data needs to be collected to provide estimates based on actual time fished (ornumber <strong>of</strong> tows), rather than number <strong>of</strong> trips.2. Develop standard protocol for bycatch estimations.10.2.8 Education1. Encourage research and education to improve the understanding and management <strong>of</strong>the shrimp resource.10.2.9 Rule Changes other agenciesVarious sections <strong>of</strong> State government will need to implement rule changes to accomplishthe process outlined in Section 10.2.3.116
11. LITERATURE CITEDAdkins, B. E., R.M. Harbo, and N. Bourne. 1983. An evaluation and managementconsiderations <strong>of</strong> the use <strong>of</strong> a hydraulic clam harvester on intertidal clam populations inBritish Columbia. Canadian Manuscript Reports <strong>Fisheries</strong> Aquatic Science 1716: 38.ASMFC (Atlantic States <strong>Marine</strong> <strong>Fisheries</strong> Commission). 2000. Evaluating fishing gear impactsto submerged aquatic vegetation and determining mitigation strategies. ASFMC HabitatManagement Series 5, 38p.Bales, J. D. and D.J. Newcomb. 1996. North Carolina wetland resources. p. 297-302 in R.M.Hirsch (dir). National Water Summary on Wetland Resources. U.S. Geological Survey,Atlanta, GA, USGS Water-Supply Paper 2425.Brinson, M. M. 1977. Decomposition and nutrient exchange in litter in an alluvial swamp forest.Ecology 58: 601-609.Brown, S. S., G.R. Gaston, C.F. Rakocinski, and R.W. Heard. 2000. Effects <strong>of</strong> sedimentcontaminants and environmental gradients on macrobenthic community trophic structurein Gulf <strong>of</strong> Mexico estuaries. Estuaries 23(3): 411-424.Burkholder, J. M., K.M. Mason, and H.B. Glasgow Jr. 1992b. Water-column nitrate enrichmentpromotes decline <strong>of</strong> eelgrass Zostera marina : Evidence from seasonal mesocosmexperiments. <strong>Marine</strong> Ecology Progress Series 81(2): 163-178.Buzzelli, C. P., R.A. Luettich Jr., S.P. Powers, C.H. Peterson, J.E. McNinch, J.L. Pinckney, andH.W. Paerl. 2002. Estimating the spatial extent <strong>of</strong> bottom water hypoxia and habitatdegradation in a shallow estuary. <strong>Marine</strong> ecology progress series 230: 103-112.Byrne, D. M. 1995. The effect <strong>of</strong> bulkheads on estuarine fauna: a comparison <strong>of</strong> littoral fishand macroinvertebrate assemblages at bulkheaded and non-bulkheaded shorelines in aBarnegat Bay Lagoon. Second Annual <strong>Marine</strong> Estuarine Shallow Water Science andManagement Conference: 53-56.Cheuvront, B. (2002). A Social and Economic Analysis <strong>of</strong> Commercial <strong>Fisheries</strong> <strong>of</strong> Core Sound,North Carolina. North Carolina Department <strong>of</strong> Environment and Natural Resources,<strong>Division</strong> <strong>of</strong> <strong>Marine</strong> <strong>Fisheries</strong>, Morehead City, NC. (NOAA Award No. NA16FG1220-1).Cheuvront, B. (2003). A Social and Economic Analysis <strong>of</strong> Commercial <strong>Fisheries</strong> in NorthCarolina: Beaufort Inlet to the South Carolina State Line. North Carolina Department <strong>of</strong>Environment and Natural Resources, <strong>Division</strong> <strong>of</strong> <strong>Marine</strong> <strong>Fisheries</strong>, Morehead City, NC.(NC Technical Assistance to the South Atlantic <strong>Fisheries</strong> Management Council, Task 5:NEPA Related Activities, Contract No. SA-03-03-NC).Chmura, G. L. and N.W. Ross. 1978. Environmental impacts <strong>of</strong> marinas and their boats. RhodeIsland Sea Grant, Narragansett, RI, P675; RIU-T-78-005.Coen, L. D. and M.W. Luckenbach. 1998. Developing success criteria and goals for evaluatingshellfish habitat restoration: ecological function or resource exploitation? Goal Settingand Success Criteria for Habitat Restoration Conference, January 13-15. Abstract only.117
Coen, L. E., M.W. Luckenbach, and D.L. Breitburg. 1999. The role <strong>of</strong> oyster reefs as essentialfish habitat: a review <strong>of</strong> current knowledge and some new perspectives. p. 438-454 inL.R. Benaka (ed.). Fish habitat: Essential fish habitat and rehabilitation. American<strong>Fisheries</strong> Society, Bethesda, MD, Symposium 22, 459 p.Collie, J. S., S.J. Hall, M.J. Kaiser, and I.R. Poiners. 2000. A quantitative analysis <strong>of</strong> fishingimpacts on shelf-sea benthos. Journal <strong>of</strong> Animal Ecology 69: 785-798.Connell, B. and T. Murphey. 2004. A preliminary evaluation on the effects <strong>of</strong> dock shading ondensity and coverage <strong>of</strong> shoal grass (Halodule wrightii). DMF, Unpub. rep.Cooper, S. R. and G.S. Brush. 1991. A 2500 year history <strong>of</strong> anoxia and eutrophication in theChesapeake Bay. Science 254: 992-1001.Currin, C. A., S.Y. Newell, and H.W. Paerl. 1995. The role <strong>of</strong> standing dead Spartina alternifloraand benthic microalgae in salt marsh food webs: considerations based on multiplestable isotope analysis. <strong>Marine</strong> Ecology Progress Series 121: 99-116.Dahl, T. E. 1990. Wetlands - losses in the United States, 1780's to 1980's. U.S. Fish andWildlife Service, Washington, D.C., Report to Congress, 13p.Dauer, D. M., J.A. Ranasinghe, and S.B. Weisberg. 2000. Relationships between benthiccommunity condition, water quality, sediment quality, nutrient loads, and land usepatterns in Chesapeake Bay. Estuaries 23(1): 80-96.DeAlteris, J., L. Skrobe, and C. Lipsky. 1999. The significance <strong>of</strong> seabed disturbance by mobilefishing gear relative to natural processes: A case study in Narragansett Bay, RhodeIsland. American <strong>Fisheries</strong> Symposium 22: 14.DEHNR (NC Dept. <strong>of</strong> Environment Health and Natural Resources). 1990. North Carolinacoastal marinas: water quality assessment. DEHNR, Raleigh, NC, 90-01, 69p.Dennison, W. C., R.J. Orth, K.A. Moore, J.C. Stevenson, V. Carter, S. Kollar, P.W. Bergstrom,and R. Batiuk. 1993. Assessing water quality with submerged aquatic vegetation.Bioscience 43: 86-94.DMF (North Carolina <strong>Division</strong> <strong>of</strong> <strong>Marine</strong> <strong>Fisheries</strong>). 1999. <strong>Shrimp</strong> and crab trawling in NorthCarolina's estuarine waters. DENR, Morehead City, NC, Report to NC <strong>Marine</strong> <strong>Fisheries</strong>Commission , 121p.DMF (North Carolina <strong>Division</strong> <strong>of</strong> <strong>Marine</strong> <strong>Fisheries</strong>). 2001a. North Carolina oyster fisherymanagement plan. N.C. Department <strong>of</strong> Environment and Natural Resources, <strong>Division</strong> <strong>of</strong><strong>Marine</strong> <strong>Fisheries</strong>, 225 p.Durako, M. J. 1994. Seagrass die-<strong>of</strong>f in Florida Bay (USA): changes in shoot demographiccharacteristics and population dynamics in Thalassia testudinum. <strong>Marine</strong> EcologyProgress Series 110: 59-66.DWQ (North Carolina <strong>Division</strong> <strong>of</strong> Water Quality). 2000. A citizen's guide to water qualitymanagement in North Carolina. DENR, Div. Water Quality, Planning Branch, Raleigh,NC, 156p.118
DWQ (North Carolina <strong>Division</strong> <strong>of</strong> Water Quality). 2001. Annual report <strong>of</strong> fish kill events. DENR,Raleigh, NC, 10p.Dyer, K. R. and R.J. Orth. 1994. Changes in fluxes in estuaries: implications from science tomanagement. Olsen and Olsen, Fredenburg, Denmark.Eby and Crowder. 2002. Hypoxia-based habitat compression in the Neuse River Estuary:context-dependent shifts in behavioral avoidance thresholds. Canadian Journal <strong>of</strong><strong>Fisheries</strong> and Aquatic Sciences 59(6): 952-965.Ellifrit, N. J., M.S. Uoshinaka, and D.W. Coon. 1972. Some observations <strong>of</strong> clam distribution atfour sites on the Hook Canal, Washington. Proceedings <strong>of</strong> the National ShellfishAssociation 63: 7.Ellis, W. 1995. The intertidal distribution <strong>of</strong> the daggerblade grass shrimp: effects <strong>of</strong> vegetationassessed using bottomless liftnet samples. Twenty-third Benthic Ecology Meeting.EPA (U.S. Environmental Protection Agency). 2001. Hydromodification chapter factsheet.http://www.epa.gov/OWOW/NPS/MMGI/hydro.html, 12/2001.Epperly, S. P. and S. W. Ross. 1986. Characterization <strong>of</strong> the North Carolina Pamlico-Albemarleestuarine complex. National <strong>Marine</strong> <strong>Fisheries</strong> Service - Southeast <strong>Fisheries</strong> Center,Beaufort, NC, NMFS-SEFC-175, 55p.Evans, D. W., R.D. Kathman, and W.W. Walker. 2000. Trophic accumulation and depuration <strong>of</strong>mercury by blue crabs (Callinectus sapidus) and pink shrimp (Penaeus duorarum).<strong>Marine</strong> Environmental Research 49(5): 419-434.Feierabend, S. J. and J.M. Zelazny. 1987. Status report on our nation's wetlands. NationalWildlife Federation, Washington, D.C., 50p.Ferguson, R. L. and L.L. Wood. 1994. Rooted vascular aquatic beds in the Albemarle-Pamlicoestuarine system. NMFS, NOAA, Beaufort, NC, Project No. 94-02, 103 p.Fonseca, M. S. 1996. The role <strong>of</strong> seagrasses in nearshore sedimentary processes: a review. p.261-286 in C. Roman and K. Nordstrom (eds). Estuarine Shores: Hydrological,Geomorphological and Ecological Interactions. Blackwell, Boston, MA.Fonseca, M. S., W. J. Kenworthy, and G. W. Thayer. 1998. Guidelines for the conservation andrestoration <strong>of</strong> seagrasses in the United States and adjacent waters. NOAA CoastalOcean Office, Silver Springs, Md., NOAA Coastal Ocean Program Decision AnalysisSeries No. 12, 222p.Funderburk, S. L., J.A. Mihursky, S.J. Jordan, and D. Riley. 1991. Habitat requirements forChesapeake Bay living resources. Habitat Objectives Workgroup, Living ResourcesSubcommittee and Chesapeake Research Consortium with assistance from MarylandDepartment <strong>of</strong> Natural Resources, Solomons, MD.Garbisch, E. W., P.B. Woller, W.J. Bostian, and R.J. McCallum. 1973. Biotic techniques forshore stabilization. p. 405-407 in L.E. Cronin (ed.). Estuarine Research. AcademicPress Inc., New York, NY, II.119
Gilmore, G. and Trent X. 1974. Abundance <strong>of</strong> benthic macroinvertebrates in natural and alteredestuarine areas. NMFS, NOAA Technical Report NMFS SSRF - 677.Godcharles, M. F. 1971. A study <strong>of</strong> the effects <strong>of</strong> a commercial hydraulic clam dredge onbenthic communities in estuarine areas. Florida Department <strong>of</strong> Natural Resources, St.Petersburg, FL, 51p.Goldsborough, W. J. and W.M. Kemp. 1988. Light responses <strong>of</strong> submersed macrophytes:implication for survival in turbid waters. Ecology 69: 1775-1786.Grabowski, J. H., D. Pettipas, M.A. Dolan, A.R. Hughes, and D.L. Kimbro. 2000. The economicand biological value <strong>of</strong> restored oyster reef habitat to the nursery function <strong>of</strong> the estuary.NC Sea Grant, Morehead City, NC, FRG # 97-EP-6, 29p.Graff, L. and J. Middleton. 2003. Wetlands and fish: catch the link. NOAA, National <strong>Marine</strong><strong>Fisheries</strong> Service, Silver Springs, MD, 48p.Gray, J. S., R. S. Wu, and Y.Y. Or. 2002. Effects <strong>of</strong> hypoxia and organic enrichment on thecoastal marine environment. <strong>Marine</strong> Ecology Progress Series 238: 249-279.Guthrie, J. F. and C. W. Lewis. 1982. The clam-kicking fishery <strong>of</strong> North Carolina. <strong>Marine</strong><strong>Fisheries</strong> Review 44(1): 16-21.Hackney, C. T., J. Grimley, M. Posey, T. Alphin, and J. Hyland. 1998. Sediment contaminationin North Carolina's estuaries. Center for <strong>Marine</strong> Science Research, UNC-W, Wilmington,NC, Publication #198, 59p.Hackney, C. T., M.H. Posey, S.W. Ross, and A.R. Norris. 1996. A review and synthesis <strong>of</strong> dataon surf zone fishes and invertebrates in the South Atlantic Bight and the potentialimpacts from beach renourishment. Prepared for Wilmington District, US Army Corps <strong>of</strong>Engineers. UNC-Wilmington, Wilmington, NC, 111 p.Hawkins, J. H. 1980. Investigations <strong>of</strong> anadromous fishes <strong>of</strong> the Neuse River, North Carolina.DMF, Morehead City, NC, Special Science Report No. 34, 111p.Hettler, W. F. J. and D.L. Barker. 1993. Distribution and abundance <strong>of</strong> larval fish at two NorthCarolina inlets. Estuarine, Coastal, and Shelf Sciences 37: 161-179.Ianuzzi, T. J., M.P. Weinstein, K.G. Sellner, and J.C. Barrett. 1996. Habitat disturbance andmarina development: An assessment <strong>of</strong> ecological effects. I. Changes in primaryproduction due to dredging and marina construction. Estuaries 19(2A): 257-271.IMPLAN PRO version 2.0 (2000). Stillwater, MN: Minnesota IMPLAN Group.Jackson, J. B. C., M. Kirby, W.H. Berger, K.A. Bjorndal, L.W. Botsford, B.J. Bourque, R.H.Bradbury, R. Cooke, J. Erlandson, J.A. Estes, T.P. Hughes, S. Kidwell, C.B. Lange, H.S.Lenihan, J.M. Pandolfi, C.H. Peterson, R.S. Steneck, M.J. Tegner, and R.R. Warner.2001. Historical overfishing and the recent collapse <strong>of</strong> coastal ecosystems. Science293: 629-638.120
Jones, R. A. and T.M. Sholar. 1981. The effects <strong>of</strong> freshwater discharge on estuarine nurseryareas <strong>of</strong> Pamlico Sound. NC <strong>Division</strong> <strong>of</strong> <strong>Marine</strong> <strong>Fisheries</strong>, Morehead City, NC, ProjectCEIP 79-11, 60p.Kenworthy, W. J. and D.E. Haunert. 1991. The light requirements <strong>of</strong> seagrasses: proceedings<strong>of</strong> a workshop to examine the capability <strong>of</strong> water quality criteria, standards andmonitoring progress to protect seagrasses. National Oceanic and AtmosphericAdministration, Beaufort, NC, Tech. Memo. NMFS-SEFC-287, 181p.Kirby, J., W. Maher, and F. Krikowa. 2001. Selenium, cadmium, copper, and zincconcentrations in sediments and mullet (Mugil cephalus) from the southern basin <strong>of</strong> LakeMacquarie, NSW Australia. Archives <strong>of</strong> environmental contamination and toxicology40(2): 246-256.Knutson, P. L. 1977. Planting guidelines for marsh development and bank stabilization. USArmy Corps <strong>of</strong> Engineering Research Center, Fort Belvoir, Va.Kwon, Y. and C. Lee. 2001. Ecological risk assessment <strong>of</strong> sediment in wastewater dischargingarea by means <strong>of</strong> metal speciation. Microchemical Journal 70: 255-264.Lenihan, H. S. and C.H. Peterson. 1998. How habitat degradation through fishery disturbanceenhances impacts <strong>of</strong> hypoxia on oyster reefs. Ecological Applications 8(1): 128-140.Lenihan, H. S., C.H. Peterson, J.E. Byers, J.H. Grabowski, and G.W. Thayer. 2001. Cascading<strong>of</strong> habitat degradation: oyster reefs invaded by refugee fishes escaping stress.Ecological Applications 11(3): 764-782.Lenihan, H. S. and F. Micheli. 2000. Biological effects <strong>of</strong> shellfish harvesting on oyster reefs:resolving a fishery conflict by ecological experimentation. Fishery Bulletin 98: 86-95.Lenihan, H. S., F. Micheli, S.W. Shelton, and C.H. Peterson. 1999. The influence <strong>of</strong> multipleenvironmental stressors on susceptibility to parasites: an experimental determinationwith oysters. Limnology and Oceanography 44: 910-924.Livingstone, D. R. 2001. Contaminant-stimulated reactive oxygen species production andoxidative damage in aquatic organisms. <strong>Marine</strong> Pollution Bulletin 42(8): 656-666.L<strong>of</strong>lin, R. K. 1995. The effects <strong>of</strong> docks on seagrass beds in the Charlotte Harbor estuary.Florida Scientist 58(2): 198-205.Lowery, J. and K.T. Paynter. 2002. The importance <strong>of</strong> molluscan shell substrate. National<strong>Marine</strong> <strong>Fisheries</strong> Service, Unpub. rep. 17p.Luettich, R. A., J.E. McNinch, J.L. Pinckney, M.J. Alperin, C.S. Martens, H.W. Paerl, C.H.Peterson, and J.T. Wells. 1999. Neuse River estuary modeling and monitoring project,final report: Monitoring phase. Water Resources Research Institute, Raleigh, NC, 190p.Maiolo, J.R. 1981. “Historical Development <strong>of</strong> the <strong>Shrimp</strong> Fishery. In The Sociocultural Contextand Occupational and Marketing Structures <strong>of</strong> the North Carolina <strong>Shrimp</strong> Fishery.Second Year Report to the NUC Sea Grant, Vol. 1.121
Maiolo, J.R. 2004. Hard Times and a Nickel a Bucket: Struggle and survival in North Carolina’sshrimp industry. Chapel Hill, NC: Chapel Hill Press.Manisseri, M. K. and N.R. Menon. 1995. Copper-induced damage to the hepatopancreas <strong>of</strong> thepenaeid shrimp Metapenaeus dobsoni - an ultrastructural study. Diseases <strong>of</strong> AquaticOrganisms 22(1): 51-57.Manisseri, M. K. and N.R. Menon. 2001. Effect <strong>of</strong> sublethal copper on growth efficiency <strong>of</strong> theshrimp, Metapenaeus dobsoni. Journal <strong>of</strong> the <strong>Marine</strong> Biological Association <strong>of</strong> India43(1-2): 81-90.Marburger, J. E., W.E. Johnson, T.S. Gross, D.R. Douglas, and J. Di. 2002. Residualorganochlorine pesticides in soils and fish from wetland restoration areas in centralFlorida. Wetlands 22(4): 705-711.Marcus, J. M. and T.P. Stokes. 1985. Polynuclear aromatic hydrocarbons in oyster tissuearound three coastal marinas. Bulletin <strong>of</strong> Environmental Contamination and Toxicology35: 835-844.Matheson, R. E. Jr., D.K. Camp, S.M. Sogard, and K.A. Bjorgo. 1999. Changes in seagrassassociatedfish and crustacean communities on Florida Bay mud banks: the effects <strong>of</strong>recent ecosystem changes? Estuaries 22(2B): 534-551.Matoura, R. F. C. and E.M.C. Woodward. 1983. Conservative behavior <strong>of</strong> riverine dissolvedorganic carbon in the Severn estuary: chemical and geochemical implications.Geochimica Cosmochimica Acta 47: 1293-1309.McCoy, E.G., 1968. Movement, growth and mortality <strong>of</strong> brown shrimp (Penaeus aztecus)marked and released in Swanquarter Bay, Pamlico Sound North Carolina. NorthCarolina Dept. Conserv. and Develop., Div. Commercial and Sports Fish., Speci Sci.Rep. No. 15, 26p.McCoy, E.G. 1972. Dynamics <strong>of</strong> North Carolina Commercial <strong>Shrimp</strong> Populations. NorthCarolina Dept. Nat. and Econ. Resour., Div. Commercial and Sports Fish., Spec. Sci.Rep. No. 21, 53 p.McCoy, E.G. and J.T. Brown. 1967. Migration and Growth <strong>of</strong> Commercial Penaeid <strong>Shrimp</strong>s inNorth Carolina. Ann. Rep., Spec. Sci. Rep. 11, North Carolina Dept. Conserv. andDevelop., JDiv. Commercial and Sports Fish., 29 p.Meyer, D. L., E.C. Townsend, and P.L. Murphey. 1996. Final report for the project evaluation <strong>of</strong>restored wetlands and enhancement methods for existing restorations. National Oceanicand Atmospheric Administration, Office <strong>of</strong> Habitat Conservation Restoration Center,Silver Springs, MD.Micheli, F. M. and C. H. Peterson. 1999. Estuarine vegetated habitats as corridors for predatormovement. Conservation Biology 13(4): 869-881.Minello, T. J. 1999. Nekton densities in shallow estuarine habitats <strong>of</strong> Texas and Louisiana andthe identification <strong>of</strong> Essential Fish Habitat. p. 43-75 in Benaka, L. R. ed. Fish Habitat:Essential Fish Habitat and Rehabilitation. American <strong>Fisheries</strong> Society, Bethesda,Maryland, 459.122
Mitsch, W. J. and J.G. Gosselink. 1993. Wetlands, Second Edition. Van Nostrand Reinhold,New York, NY, Second Edition , 772p.Mock, C. R. 1966. Natural and altered estuarine habitats <strong>of</strong> penaeid shrimp. Proceedings GulfCaribbean Fish Institute 19th Annual Session: 86-98.MSC (Moratorium Steering Committee). 1996. Final report <strong>of</strong> the Moratorium SteeringCommittee to the Joint Legislative Commission on Seafood and Aquaculture <strong>of</strong> the NorthCarolina General Assembly. N.C. Sea Grant College Program, Raleigh, NC, NC-SG-96-11, 155p.Murphey, P. L. and M. S. Fonseca. 1995. Role <strong>of</strong> high and low energy seagrass beds asnursery areas for Penaeus duorarum in North Carolina. <strong>Marine</strong> Ecology Progress Series121: 91-98.NCFA (2004). North Carolina <strong>Fisheries</strong> Association. Press Release. Commerce finds four morecountries dumped shrimp in U.S. Market. July 29, 2004. Internet website:http://www.ncfish.org/article.asp?id=123Newell, R. I. E. 1988. Ecological changes in the Chesapeake Bay: are they the result <strong>of</strong>overharvesting the Amercian oyster? p. 536-546 in M.P. Lynch and E.C. Krome (eds.).Understanding the estuary: advances in Chesapeake Bay research. Chesapeake BayResearch Consortium, Baltimore, MD, Publication 129.Noble, E. B. and R.J. Monroe. 1991. Classification <strong>of</strong> Pamlico Sound Nursery Areas:Recommendations for Critical Habitat Criteria. North Carolina Department <strong>of</strong>Environment, Health, and Natural Resources, Morehead City, NC, A/P Project No. 89-09, 70p.North Carolina Sea Grant. 1997. Coastal water quality. NC State University, Raleigh, NC,UNC-SG-97-04, 72 p.North Carolina State Demographics (2004). Internet website: http://demog.state.nc.us.Orbach, M. K. and J. C. Johnson 1988. Transformation <strong>of</strong> Fishing Communities: A public policyperspective. In <strong>Marine</strong> Resource Utilization: A conference on social science issues.Proceedings <strong>of</strong> the Mississippi-Alabama Sea Grant Consortium, Mobile, Alabama.O'Rear, C. W. 1983. A study <strong>of</strong> river herring spawning and water quality in Chowan River. NCDepartment <strong>of</strong> Natural Resources and Community Development, DMF, Raleigh, NC,Complete Report, Project AFC-17, 31p.Orth, R. J., J. Simons, J. Capelli, V. Carter, L. Hindman, S. Hodges, K. Moore, and N. Rybicki.1986. Distribution <strong>of</strong> submerged aquatic vegetation in the Chesapeake Bay andtributaries - 1985. US EPA, Washington, DC, Final report.Orth, R. J., K.A. Moore, and J.F. Nowak. 1990. Monitoring seagrass distribution and abundancepatterns: A case study from the Chesapeake Bay. in US Fish and Wildlife Service.Federal coastal wetland mapping. US Fish and Wildlife Service, Biological Report90(18): 111-123 .123
Paerl, H. W., J. Pinckney, J. Fear, and B. Peierls. 1998. Ecosystem response to internalwatershed organic matter loading: Consequences for hypoxia in the eutrophying NeuseRiver Estuary, North Carolina. <strong>Marine</strong> Ecological Progress Series 166: 17-25.Paerl, H. W., M.M. Mallin, C.A. Donahue, M. Go, and B.L. Peierls. 1995. Nitrogen loadingsources and eutrophication <strong>of</strong> the Neuse River, North Carolina: direct and indirect roles<strong>of</strong> atmospheric deposition. UNC - Chapel Hill, Water Resources Research Institute,Chapel Hill, NC, Publication 291.Pate, P. P. Jr. and R. Jones. 1981. Effects <strong>of</strong> upland drainage on estuarine nursery areas <strong>of</strong>Pamlico Sound, North Carolina. UNC Sea Grant , Raleigh, NC, Pub. No. UNC-SG-WP-10, 24p.Pattilo, M. E., D. M. N. T.E. Czapla, and M.E. Monaco. 1997. Distribution and abundance <strong>of</strong>fishes and invertebrates in Gulf <strong>of</strong> Mexico estuaries. Volume II: Species life historysummaries. NOAA/NOS Strategic Environmental Assessment <strong>Division</strong>, Silver Springs,MD, ELMR Rep. No. 11. 377p.Peterson, B. J. and R.W. Howarth. 1987. Sulfur, carbon, and nitrogen isotopes used to traceorganic matter flow in the salt-marsh estuaries <strong>of</strong> Sapelo Island, Georgia. Limnology andOceanography 32(6): 1195-1213.Peterson, C. H., H.C. Summerson, and S.R. Fegley. 1987. Ecological consequences <strong>of</strong>mechanical harvesting <strong>of</strong> clams. <strong>Fisheries</strong> Bulletin 85(2): 281-298.Peterson, C. H., J.H. Grabowski, and S.P. Powers. 2003a. Quantitative enhancement <strong>of</strong> fishproduction by oyster reef habitat: restoration valuation. <strong>Marine</strong> Ecology Progress Series264: 249-264.Peterson, C. H. and N.M. Peterson. 1979. The ecology <strong>of</strong> intertidal flats <strong>of</strong> North Carolina: Acommunity pr<strong>of</strong>ile. U.S. Fish and Wildlife Service, OBS-79/39 , 73 p.Peterson, M. S., B.H. Comyns, J.R. Hendon, P.J. Bond, and G.A. Duff. 2000. Habitat use byearly life-stages <strong>of</strong> fishes and crustaceans along a changing estuarine landscape:difference between natural and altered shoreline sites. Wetland, Ecology, andManagement 8(2-3): 209-219.Purvis, C.E., and E.G. McCoy, 1972. Overwintering Pink <strong>Shrimp</strong> (Penaeus duorarum) in Coreand Pamlico Sounds, N.C. North Carolina Dept. Nat. and Econ. Resour., Div.Commercial and Sports Fish., Spec Sci. Rep. No. 21, 53 pRiggs, S. R., E.R. Powers, J. T. Bray, P.M. Stout, C. Hamilton, D. Ames, R. Moore, J. Watson,S. Lucas, and M. Williamson. 1989. Heavy metal pollutants in organic rich muds <strong>of</strong> thePamlico River estuarine system: their concentration, distribution, and effects uponbenthic environments and water quality: Albemarle-Pamlico Estuarine Study. ProjectNo. 89-06. US EPA and NC DNRCD, Raleigh, NC, 108p.Riggs, S. R., J.T. Bray, E.R. Powers, C. Hamilton, D. Ames, D. Yeates, K. Owens, S. Lucas, J.Watson, and M. Williamson. 1991. Heavy metal pollutants in organic-rich muds <strong>of</strong> theNeuse River Estuary: their concentration and distribution. Albemarle-Pamlico EstuarineStudy Report. Project no. 90-07. DENR, Raleigh, 168p.124
Roblee, M. B. and W.J. DiDomenico. 1992. Seagrass die-<strong>of</strong>f in Florida Bay, EvergladesNational Park. Park Science 11: 21-23.Ross, S. W. and S.P. Epperly. 1985. Chapter 10: Utilization <strong>of</strong> shallow estuarine nursery areasby fishes in Pamlico Sound and adjacent tributaries, North Carolina. p. 207-232 in A.Yanez-Aranciba (ed.). Fish Community Ecology in Estuaries and Coastal Lagoons:Towards and Ecosystem Integration. DR (R) UNAM Press, Mexico, 654 p.Rozas, L. P. and R.J. Zimmerman. 2000. Small-scale patterns <strong>of</strong> nekton use among marsh andadjacent shallow nonvegetated areas <strong>of</strong> the Galveston bay estuary, Texas (USA).<strong>Marine</strong> Ecology Progress Series. 193: 217-239.Rozas, L. P. and W.E. Odum. 1987. The role <strong>of</strong> submerged aquatic vegetation in influencingthe abundance <strong>of</strong> nekton on contiguous tidal freshwater marshes. Journal <strong>of</strong>Experimental <strong>Marine</strong> biology and Ecology 114(2-3): 289-300.SAFMC (South Atlantic Fishery Management Council). 1993. Fishery management plan for theshrimp fishery <strong>of</strong> the South Atlantic region including a final environmental impactstatement and regulatory impact review. SAFMC, Charleston, SC, 184 pp. +appendices.SAFMC (South Atlantic Fishery Management Council). 1998. Final Amendment 9 to the fisherymanagement plan for the snapper grouper fishery <strong>of</strong> the South Atlantic region. SAFMC,Charleston, SC, 246 p.Sanger, D. M. and A.F. Holland. 2002. Evaluation <strong>of</strong> the impacts <strong>of</strong> dock structures on SouthCarolina estuarine environments. SC Department <strong>of</strong> Natural Resources, <strong>Marine</strong>Resources Research Institute, Charleston, SC, Tech. Rep. No. 99, 82p.Scho<strong>of</strong>, R. 1980. Environmental impact <strong>of</strong> channel modification. Water Resources Bulletin16(4): 697-701.Schueler, T. R. 1997. Impact <strong>of</strong> suspended and deposited sediment. Watershed ProtectionTechniques 2(3): 443-444.Seldberg, C. D., L.A. Eby, and L.B. Crowder. 2001. Hypoxia in the Neuse River Estuary:Responses <strong>of</strong> blue crabs and crabbers. North American Journal <strong>of</strong> <strong>Fisheries</strong>Management 21(2): 358-366.Shafer, D. J. 1999. The effects <strong>of</strong> dock shading on the seagrass Halodule wrightii in PerdidoBay, Alabama. Estuaries 22(4): 936-943.Steele, P. 2002. Stock assessment pr<strong>of</strong>ile for the penaeid shrimp fisheries <strong>of</strong> the southeasternUnited States and Gulf <strong>of</strong> Mexico. Report to the Florida <strong>Marine</strong> <strong>Fisheries</strong> Commission.227p.Stevenson, J. C., L.W. Staver, and K.W. Staver. 1993. Water quality associated with survival <strong>of</strong>submerged aquatic vegetation along an estuarine gradient. Estuaries 16(346-361).Tarplee, W. H. Jr., D.E. Louder, and A.J. Weber . 1971. Evaluation <strong>of</strong> the effects <strong>of</strong>channelization on fish populations in North Carolina's coastal plain streams. NorthCarolina Wildlife Resources Commission, Raleigh, NC.125
Teal, J. 1962. Energy flow in salt marsh macrophyte production: a review. Ecology 43: 614-624.Tenore, K. R. 1972. Macrobenthos <strong>of</strong> the Pamlico River estuary, North Carolina. EcologicalMonographs 42: 51-69.Thayer, G. W., W.J. Kenworthy, and M.S. Fonseca. 1984. The ecology <strong>of</strong> eelgrass meadows <strong>of</strong>the Atlantic coast: a community pr<strong>of</strong>ile. U.S. Fish and Wildlife Service, FWS/OBS-84/02,147p.Turner, R. E. 1977. Intertidal vegetation and commercial yields <strong>of</strong> Penaeid shrimp.Transactions <strong>of</strong> the American <strong>Fisheries</strong> Society 106(5): 411-416.Twilley, R. R., W.M. Kemp, K.W. Staver, J.C. Stevenson, and W.R. Boynton. 1985. Nutrientenrichment <strong>of</strong> estuarine submersed vascular plant communities. 1. Algal growth andeffects on production <strong>of</strong> plants and associated communities. <strong>Marine</strong> Ecology ProgressSeries 23: 179-191.Uncles, R. J., J.A. Stephens, and T.Y. Woodrow. 1988. Seasonal cycling <strong>of</strong> estuarine sedimentand contaminant transport. Estuaries 11: 108-116.US Department <strong>of</strong> Commerce (2003). <strong>Fisheries</strong> <strong>of</strong> the United States, 2002. Current FisheryStatistics No. 2002. National Oceanic and Atmospheric Administration, National <strong>Marine</strong><strong>Fisheries</strong> Service.Voudrias, E. A. and C.L. Smith. 1986. Hydrocarbon pollution from marinas in estuarinesediments. Estuarine Coastal Shelf Sciences 22: 271-284.Wannamaker, C. M. and J.A. Rice. 2000. Effects <strong>of</strong> hypoxia on movements and behavior <strong>of</strong>selected estuarine organisms from the southeastern United States. Journal <strong>of</strong>Experimental <strong>Marine</strong> Biology and Ecology 249: 145-163.Waters, C. T. and C.D. Thomas. 2001. Shoreline hardening effects on associated fishassemblages in five North Carolina coastal rivers. North Carolina Wildlife ResourcesCommission, Raleigh, NC, 20p.Weis, J. S. and P. Weis. 1989. Effects <strong>of</strong> environmental pollutants on early fish development.Aquatic Sciences 1(1): 45-55.Weis, J. S., P. Weis, and T. Proctor . 1998. The extent <strong>of</strong> benthic impacts <strong>of</strong> CCA-treated woodstructures in Atlantic coast estuaries. Archives <strong>of</strong> Environmental Contamination andToxicology 34(4): 313-322.Wendt, P. H., R.F. Van Dolah, M.Y. Bobo, and J.J. Manzi. 1990. Effects <strong>of</strong> marina proximity oncertain aspects <strong>of</strong> the biology <strong>of</strong> oysters and other benthic macr<strong>of</strong>auna in a SouthCarolina estuary. South Carolina Wildlife and <strong>Marine</strong> Resources Department,Charleston, SC, South Carolina <strong>Marine</strong> Resources Center Tech. Rep. No. 74, 49p.White, K. 1996. Restoration <strong>of</strong> channelized streams to enhance fish habitat.http://www.ies.wisc.edu/research/ies900/kimchannelization.htm, Dec. 2003.126
Wilbur, A. R. and M.W. Pentony. 1999. Human-induced nonfishing threats to essential fishhabitat in the New England region. p. 299-321 in L.R. Benaka (ed.). Fish Habitat:Essential Fish Habitat and Rehabilitation. American Fishery Society , Silver Springs, MD,Symposium 22 , 459 p.Zimmerman, R. T., T. Minello, and M. Gastiglione. 1989. Oyster reef as habitat for estuarinemacr<strong>of</strong>auna. National Oceanic and Atmospheric Administration, Springfield, VA, NOAATechnical Memorandum NMFS-SEFC-249.127
12. APPENDICES12.1 Appendix 1 SUMMARY OF SHRIMP REGULATIONS FROM OTHER STATES128
ADMINISTRATIVEORGANIZATIONLICENSESRESTRICTIONSSOUTH CAROLINA GEORGIA FLORIDADepartment <strong>of</strong> Natural Resources <strong>Marine</strong> Department <strong>of</strong> Natural resources, Florida Fish and Wildlife Conservation<strong>Division</strong>Coastal Resources <strong>Division</strong>CommissionPO BOX 12559(912) 264-7218(850) 487-0554Charleston SC 29422(843) 953-9300Resident:Commercial license $25<strong>Shrimp</strong>, fish, and crab trawling $125Cast netting over bait $25Channel net $250/netNon-resident:Commercial license $300<strong>Shrimp</strong>, fish, and crab trawling $300Cast netting over bait $500~Unlawful to trawl for crabs with a net orbag with a mesh <strong>of</strong> less than 4", andchafing gear <strong>of</strong> any sort must be confinedto not more than one-half thecircumference <strong>of</strong> the tailbag.~The department may open or closeareas <strong>of</strong> the states waters lying seaward<strong>of</strong> the trawling boundaries to crab trawlingfrom December to March.~A crab trawling permit is required.~Finfish caught incidental to shrimp andcrab trawling must meet minimum sizelimits.~<strong>Shrimp</strong> trawlers may retain blue crabscaught incidental to shrimp trawling fromJune 1 to November 13.~<strong>Shrimp</strong> trawling is allowed from 0500 to2100 hrs from Opening Day throughAugust 31.~<strong>Shrimp</strong> trawling is allowed from 0600 to2000 hrs from September 1 throughOctober 31.~<strong>Shrimp</strong> trawling is allowed 0600 to 1900from November 1 until the end <strong>of</strong> theseason.~Certain Sounds and Bays closed totrawling at all times.Channel Nets~Sixty channel net licenses are issuedeach year.~Season is from September 1 toDecember 15 for no more than 90 days.~Channel nets may not be set within 200’<strong>of</strong> each other or within 400’ <strong>of</strong> thecenterline <strong>of</strong> any marked navigationchannel.Recreational <strong>Shrimp</strong>ing~Cast nets, seines (40’ max), and dropnets are allowed.~Catch limit is 48 quarts heads on or 29quarts heads <strong>of</strong>f/ Person or boat.Cast Netting Over Bait~Sixty day season between Septembeer1and November 15.~Catch limit is 48 quarts heads on, 29quarts heads <strong>of</strong>f.~license is required.Resident:Commercial fishing boat $50 for the first18',and $3 for each foot or fraction over 18'.Commercial fishing license $12 requiredforevery person engaged in commercialfishing.Sport bait shrimping $5Commercial bait shrimping $25Non-resident:Commercial fishing boat $25 over the costto a resident.Commercial fishing license $118.00Sport bait shrimping $75Commercial bait shrimping $150~Finfish caught incidental to legal shrimpandcrab trawling must meet minimum sizelimits.~Sounds permanently closed to shrimpingfrom January 1 through August 31. TheSounds (Cumberland, St. Andrews, St.Simons, Sapelo, Wassaw and Ossabaw)may be opened to shrimping at theCommissioner's discretion. These Soundscan be opened to crab trawling fromJanuary through March.~It is illegal to trawl for shrimp or crabsbetween the hours <strong>of</strong> 2000 and 0500. Notrawling permitted in Sounds between8:00 p.m. Saturday and 5:00 a.m.Monday.~Crab trawl mesh size must be <strong>of</strong> at least4" stretch mesh.~Blue crabs caught while shrimp trawlingmay be kept and sold.Bait-shrimping:~Sport bait shrimpers may not possess atany time more than 2 quarts <strong>of</strong> shrimp, nomore than1/2 pint <strong>of</strong> which may be dead,and may not take more than 4 quarts in a24 hour period. When two or more peopleare on the boat these numbers aredoubled.~Bait shrimping is only permitted in thetidal rivers and creeks, these areas areclosed to food shrimp trawling.~The legal hours for bait-shrimping areone half hour before <strong>of</strong>ficial sunrise to onehalf hour after <strong>of</strong>ficial sunset.~Sport bait shrimp nets maximum size 10'headrope and footrope.~Commercial bait shrimp nets are limitedto a max. <strong>of</strong> 20' for headrope and 25' forfootrope.~Unlawful for a commercial bait-shrimperto have on board any boat more than 50quarts <strong>of</strong> shrimp at any one time with nomore than 10% <strong>of</strong> these shrimp may bedead.Cast Netting-Commercial cast netting limited to 200licenses-Cast netting over bait is prohibited-48 quart limit heads-on for recreationalcast nettingResident:Saltwater products licensesIndividual $50Boat $100Live bait shrimping and noncommercialfood shrimping: Permit required, no feeexcept for certain counties, see fees listedunder restrictions.Non-resident:Saltwater products licensesIndividual $200Boat $400AlienSaltwater products licensesIndividual $300Boat $600~Legal size 47 (or less) shrimp per pound(heads-on), or 70 count tails. * Except incertain areas, there is no size restrictions.~Recreational shrimping is allowed byseines, cast nets, dip nets and shrimptrapsand is limited to 5 gallons/person orboat.~Unlawful to trawl for shrimp at night inany county whose coastal boundaryborders solely on the Atlantic Ocean,except during the months<strong>of</strong> June, July andAugust.~Finfish caught incidental to trawling maybe kept in both the commercial andrecreational fisheries. Flounder is limitedto 200 pounds.~Size and creel limits and seasons mustbe observed.~No more than 200 pounds <strong>of</strong> blue crabscaught while shrimp trawling may be keptand sold.~Live bait shrimp boats must be equippedwith live bait shrimp tanks.~Live bait shrimpers may not have morethan 5 gallons <strong>of</strong> dead shrimp per day.<strong>Shrimp</strong> regulations for Clay, Duval,Nassau,Putnam, Flagler, and St. JohnsCounties:~Trawling for live or dead shrimp is limitedto daylight hours.~The taking <strong>of</strong> dead shrimp is not allowedonSaturday, Sunday, or legal stateholidays.~No trawling permitted within 100 yards <strong>of</strong>the shoreline.~See attached regulations for gearrestrictions(Northeast region)~$250 fee for live bait production in theseCounties.~$250 fee for dead shrimp production inthese Counties.~Trawling for dead shrimp in these fivecounties and the other five counties thatmake up the East Coast <strong>Shrimp</strong> bed isprohibited from April 1 and June 1.Noncommercial trawling in the St. JohnsRiver $50Tampa Bay:~$250 resident; $1,000 non-resident129
ADMINISTRATIVEORGANIZATIONLICENSESRESTRICTIONSALABAMA MISSISSIPPI LOUISIANADepartment <strong>of</strong> Conservationand Natural Resources, <strong>Marine</strong>Resources <strong>Division</strong>. (205) 861-2882Resident:<strong>Shrimp</strong> boat less than 30' $5030-40' $75Over 45' $100Commercial crab $50 (needed to sellcrabs caught in shrimp trawls).Live bait shrimp dealer 1 boat or truck $51Live bait shrimp dealer 2 boats or trucks$101Recreational shrimping (food and bait)$15Non-resident:A non-resident will be charged the samefee for a license as a Alabama residentwould be charged for a license in thatstate.~The taking, catching or attempting totake or catch shrimp by trawl, seine, castnet, or any means whatsoever for anypurpose is prohibited in the designated<strong>Shrimp</strong> Nursery Areas.~It is unlawful for any person to drag anynet, seine or trawl over any public oysterreef or private oyster grounds in the State.Commercial shrimping:~Legal size 68 (or less) shrimp per pound(heads-on).~Season set by regulation~Total combined headrope length(maximum <strong>of</strong> 2 nets) is 50 feet fortrawls in inside waters.~Some areas closed to commercial andrecreational shrimping permanently.~Finfish caught incidental to trawling maybe kept in both the commercial andrecreational fisheries.~Size and creel limits and seasons mustbe observed.~Blue crabs caught while shrimp trawlingmay be kept and sold as long as thevessels has a valid commercial crablicense.Recreational shrimping (food and bait):~Exclusive bait shrimping areas permanentlyclosed to commercial shrimping.~Licensed recreational shrimp boats maytake bait shrimp during the closedcommercial season only from areasdesignated by law as exclusive baitshrimping areas.~Other areas season set by regulation~Legal size 68 (or less) shrimp per pound(heads-on).~Catch limit <strong>of</strong> 5 gallons (heads-on) perperson per day in waters open tocommercial shrimping, except for theareas open year round - limits are onegallon <strong>of</strong> shrimp (heads-on), per boat perday.~Trawl headrope not to exceed 16'Live bait <strong>Shrimp</strong> dealers:~Limited to one trawl per boat not toexceed 16' headrope and 22' leadline.~No closed season~Cannot trawl in permanently closedareas.~Can not have more than 15 lb <strong>of</strong> deadshrimp on the boat at any time.~Tow time limit 20 minutes.Department <strong>of</strong> <strong>Marine</strong> Resources1141 Bay View Ave.Biloxi Ms. 39530 (228) 374-5000Resident:<strong>Shrimp</strong> boat license.Recreational $15Under 30' $6030' to 45' $85Over 45 $110Commercial crab $75 (needed to sellcrabscaught in shrimp trawls).Non-resident:A non-resident will be charged the samefee for a license as a Mississippi residentwould be charged for a license in thatstate.~It is unlawful to use any single trawl netwhich measures more than 50 feet alongthe headrope [max. <strong>of</strong> 2 nets, 50 feet totalwidth;(i.e. 2 @ 25')]~<strong>Shrimp</strong> smaller in size than 68-count arenot to be taken.~No restrictions on headropes south <strong>of</strong>barrier islands in Mississippi Sound.~Trawl nets in the Mississippi Soundare limited to 2 nets, with max. headropelength <strong>of</strong> 25' each.~Except by special order <strong>of</strong> theCommission, trawling is not permitted inany area within 1/2 mile <strong>of</strong> the mainlandnor within any Bay, except by live-baitdealers.~With the exception <strong>of</strong> pipeline canal,there is no trawling permitted in bayous.~The area south <strong>of</strong> the intercoastalwaterway will be closed to trawling afterApril 30.~Areas north <strong>of</strong> the intercoastal waterwaywill be closed to trawling after sunset onDecember 31.~Closed areas will open to trawling whenthe <strong>Division</strong> has determined that shrimphave reached legal size.~Recreational limit, one trawl 16' or less.~Finfish caught incidental to trawling maybe kept in both the commercial andrecreational fisheries with appropriatelicense.~Size and creel limits and seasons mustbe observed.~Blue crabs caught while shrimp trawlingmay be kept and sold as long as thevessels has a valid commercial crablicense.~Live -bait shrimping limited to 25 minutetows.~Live-bait shrimpers must use trawlssmaller than 16' except in areas west <strong>of</strong>Bayou Caddy trawls less than 25' may beused.~Fish caught while live-bait trawling maybe kept and sold for chum.~Only 30 pounds <strong>of</strong> dead shrimp arepermitted on board a live-bait boat.Department <strong>of</strong> Wildlifeand <strong>Fisheries</strong>(225) 765-2800Resident:Commercial fisherman’s license $55 (perperson)Vessel license $15; shrimp trawl, skimmerand butterfly nets $25 per trawlRecreational:Basic fishing $5.50; saltwater $5.50;shrimp trawl (up to 16') $25 100pounds?day. <strong>Shrimp</strong> trawl 16’ – 25’ $80250 pounds/day.Non-resident:Commercial fishing license $460 (perperson)Vessel license $60; shrimp trawl, skimmerand butterfly nets $100 per gear in use.Recreational:Basic fishing $31, Saltwater fishing $36shrimp trawl $100.~Inshore shrimp seasons are set yearlybased on biological and technical data.The spring season usually runs from midMay to July. The fall season usuallybegins in mid August and lasts untilDecember.~No size limit during the spring seasonnor is there any size limit on brown shrimpor seabobs taken during any openseason. White shrimp are limited to 100heads-on count.~Trawls cannot have a mesh size lessthan 1-1/4" stretched during the springshrimp season.~Trawls cannot have a mesh size lessthan 1-1/2" stretched during the fallshrimp season.~Restrictions on night time trawling insome areas.~Portions <strong>of</strong> some waters closed totrawling.~Trawls less than 16' may be used forrecreational purposes.~Recreational shrimpers are limited to100 lbs. (heads-on) <strong>of</strong> shrimp per boat.~Finfish caught incidental to trawling maybe kept in both the commercial andrecreational fisheries.~Size and creel limits and seasons mustbe observed.~Five percent <strong>of</strong> each species <strong>of</strong>commercial fish by number may besmaller than the legal limit.~Blue crabs caught while shrimp trawlingmay be kept and sold.~Inshore trawling - Restrictions:one net - 50' max. headrope length.two nets - 25' max. haedrope length pernet, with doors no larger than 6'x34'' pernet; or, for two nets which are connectedin the center, no more than two inner sleddoors, and no more than two outer doorswith a max. size <strong>of</strong> 8'x40'', plus one testnet - 16' max. headrope length.~In State outside waters (from beach to 3miles <strong>of</strong>fshore), 130' max. headrope and165’ max lead line length.~Offshore territorial waters, up to fourtrawl nets may be used <strong>of</strong> any size, plusone test net.TEXASTEXAS (cont.)130
ADMINISTRATIVEORGANIZATIONLICENSESRESTRICTIONSParks and Wildlife Department, Coastal<strong>Fisheries</strong> Branch(512) 389-48001-800-792-1112Resident commercial:General Commercial $24 (per person)only need if landing finfish and crabscaught while shrimping.Commercial finfish $360 (needed to sellfish caught while shrimping)Bay shrimp boat $348Bait shrimp boat $348Non-resident commercial:General Commercial $180 (per person)only need if landing finfish and crabscaught while shrimping.Commercial finfish $1440 (needed to sellfish caught while shrimping)Bay shrimp boat $750Bait shrimp boat $750Resident recreational:Sport fishing $23Saltwater stamp $10Bait shrimp tag $35Non-resident recreational:Sport fishing $50Saltwater stamp $10Bait shrimp tag $35~Unlawful to head shrimp aboard a boat ~Commercial bait-shrimping is permittedin inside waters.year round in bait Bays and nursery areas~Unlawful to retain a catch <strong>of</strong> finfish (when permitted under a nursery areaexceeding 50% <strong>of</strong> the total trawl catch by shrimping authorization). Daily catch isweight <strong>of</strong> aquatic products including 200 pound whole shrimp <strong>of</strong> which 50%shrimp.must be alive (except from Aug. 16~Size and creel limits and seasons must through November 14).be observed.~Mesh size must not be smaller than~Blue crabs caught while shrimp trawling 6-1/2" over 5 stretched meshes.may be kept and sold.Recreational shrimping:~Spring open season May 15 through July ~Only 1 trawl per boat is allowed. Must15.have a bait-shrimp tag in possession.~Legal hours for shrimp during the spring Trawl net must not be greater than 20 feetseason are 30 minutes before sunrise to in width between doors. Mesh size must1400 hrs.not be smaller than 8-3/4" over 5~No more than 600 lb <strong>of</strong> any size whole stretched meshes. Trawl doors can be noshrimp may be taken per day during the larger than 15 by 30 inches or 450 squarespring season.inches each. When shrimping for food~Mesh size must not be smaller than may only shrimp during the spring and fall6-1/2" over 5 stretched meshes.seasons. Only 15 pounds <strong>of</strong> shrimp per~Fall open season August 15 through person per day permitted.November30.~From August 15 through March 31 bait~Legal shrimp hours are 30 minutes shrimping is permitted from 30 minutesbefore sunrise to 30 minutes after sunset. before sunrise to 30 minutes after sunset.~Bag and possession limits are not From April 1 through August 14, baitrestricted.shrimping is permitted from 30 minutes~August 15 through October 31, the legal before sunrise to 1400 hours. Catch limitshrimp count is 50 heads on per pound. <strong>of</strong> 2 quarts per person or 4 quarts per~Mesh size must not be smaller than boat.8-3/4" over 5 stretched meshes.~Unlawful to retain a catch <strong>of</strong> finfish~Winter open season February 1 through exceeding 50% <strong>of</strong> the total trawl catch byApril 15 in Major Bays south <strong>of</strong> the weight <strong>of</strong> aquatic products includingColorado River.shrimp.~No bag limit. Legal shrimping hours 30minutes before sunset until 30 minutesafter sunrise.~Mesh size must not be smaller than6-1/2" over 5 stretched meshes.131
12.2 Appendix 2 MANAGEMENT OF TRAWLING FOR HABITAT PROTECTIONI. ISSUEHow does North Carolina manage estuarine trawling to minimize effects onhabitat?II.BACKGROUNDOtter trawls are used to harvest shrimp from both North Carolina’s estuarine waters andterritorial ocean waters. These trawls are conical nets towed behind vessels that are kept openby water pressure on otter boards or doors that are attached at the forward edges <strong>of</strong> the nets.Developed in Europe over 100 years ago, otter trawls were brought to North Carolina in 1912.<strong>Shrimp</strong> trawling began in the Southport area and spread northward. Vessels and nets grew insize and sophistication over the years. Today, approximately 79 percent <strong>of</strong> shrimp trawl tripsoccur in estuarine waters. Pamlico and Core/Bogue Sounds account for the 62 percent <strong>of</strong> thesetrips. Ocean shrimp trawling occurs mainly <strong>of</strong>fshore <strong>of</strong> Onslow through Brunswick counties, withthe southern most area producing the greatest share <strong>of</strong> ocean harvest (Street et al. 2005).Numerous studies have been conducted on the effects <strong>of</strong> mobile fishing gear on thebenthos. These studies include effects <strong>of</strong> gear such as scallop dredges, oyster dredges,hydraulic clam dredges and clam trawls, beam trawls and otter trawls. The impacts <strong>of</strong> thesedifferent gears have been studied on habitat types ranging from flat sand and mud bottoms tostructured habitats such as piled boulders, live bottom, seagrass, kelp beds and coral reefs(Dorsey and Pederson 1998; Auster 1998). These studies have shown that mobile fishing gearreduces habitat complexity by smoothing the bottom and removing structures provided bydifferent benthic fauna. Benthic populations that provide food are also removed (Dorsey andPederson 1998).Rate <strong>of</strong> recovery for areas that are disturbed by bottom fishing gears are dependent onthe habitat type. Those areas <strong>of</strong> stable habitats such as hard bottom, inhabited by low mobility,long-lived and slow growing species have the slowest recovery rates while those habitats thatare constantly disturbed, inhabited by fast growing, short-lived species are much quicker torecover. These latter areas tend to be populated by opportunistic species that can recolonizequickly. Examples <strong>of</strong> these types <strong>of</strong> habitats are shallow sandy environments that areconstantly disturbed by storm events, and high tidal flow (NRC 2002).<strong>Shrimp</strong> trawling is a bottom disturbing fishing gear and affects hard bottom, shell bottom,submerged aquatic vegetation and s<strong>of</strong>t bottom habitats where it occurs. These critical habitatsprovide commercially and recreationally valuable fish species with food resources, living space,and protection from predators during part <strong>of</strong> or all <strong>of</strong> their life cycle. Trawling alters thesehabitats by reducing structure, changing sediment size and distribution, and increasing turbidity.This in turn affects ecosystem processes such as growth <strong>of</strong> primary producers (algae andplants), nutrient regeneration, growth <strong>of</strong> secondary producers (organisms that consume otherorganisms), and the character <strong>of</strong> the feeding relationships <strong>of</strong> organisms within the ecosystem(the food web).Studies <strong>of</strong> the ecological impacts <strong>of</strong> trawling indicate that the magnitude <strong>of</strong> trawlingdisturbance to bottom communities is highly variable, ranging from no apparent effect, to thecomplete elimination <strong>of</strong> some species and coincident long-term changes in the benthiccommunity. The ecological effect <strong>of</strong> trawling depends upon site-specific characteristics <strong>of</strong> the132
ecosystem such as bottom type (sand, mud, shell, grass bed, reef, etc.), water depth, type <strong>of</strong>animal community (small vs. large sized species, short-lived vs. long-lived species; mobile vs.immobile species), type <strong>of</strong> fishing trawl employed, and the intensity and duration <strong>of</strong> trawling andnatural disturbances.Trawl Effects on Hard BottomHard bottom refers to coral communities that occur in temperate, subtropical and tropicaloceans as well as exposed areas <strong>of</strong> rock or consolidated sediments. Manmade structures suchas artificial reefs, wrecks and jetties are included in the hard bottom classification. Natural hardbottom varies from flat, smooth surfaces to scarped ledges with vertical, sloped, or steppedrelief (Street et al. 2005). Bottom topography and bottom temperatures are the most importantfactors in the types <strong>of</strong> habitat and are strongly influenced by the Gulf Stream (SAMFC 1998).Exposed rock outcrops are colonized by algae, sponges, s<strong>of</strong>t coral, hard coral, bryozoans,polychaete worms, and tunicates and support a large diversity <strong>of</strong> fish and invertebrate species,including economically important snappers and groupers (Street et al. 2005; SAFMC 1998).Hard bottom habitats are the most structurally complex habitats because <strong>of</strong> high verticalrelief, varying sizes <strong>of</strong> interstitial spaces and crevices, as well as attached fauna, such assponges, bryozoans and other sessile organisms providing additional complexity. VanDolah etal. (1987) studied the effects <strong>of</strong> a research trawl over hard bottom areas and the damage toseveral sponge and coral species. This study was done <strong>of</strong>f the coast <strong>of</strong> Georgia where theycompared the density <strong>of</strong> sponges in an area trawled one time to an untrawled area. There wasimmediate damage to all <strong>of</strong> the sponges they were targeting, however significant reduction <strong>of</strong>only the barrel sponges were observed. One year after trawling, sponge abundance hadincreased to pre-trawl densities with damage no longer detected. However, it should be notedthat this was after one pass made with a trawl with a roller-rig design (VanDolah et al. 1987;SAFMC 1998). Roller rig trawls are generally considered to be less damaging thanconventional bottom trawls. In a review <strong>of</strong> different studies on the impacts <strong>of</strong> bottom disturbinggears, by Watling and Norse (1998) there were numerous results demonstrating the impacts tobryozoan beds, overturned boulders, reduced sponge cover, as well as changes in diversity <strong>of</strong>different benthic communities.Trawling Effects on Shell BottomThe NC Coastal Habitat Protection Plan defines shell bottom as an estuarine intertidal orsubtidal bottom composed <strong>of</strong> surface shell concentrations <strong>of</strong> living or dead oysters, hard clams,and other shellfish (Street et al. 2005). These oyster rocks form by the accumulation <strong>of</strong> shellsand oysters over the course <strong>of</strong> many years. This habitat is critical for the settlement <strong>of</strong> larvaloysters, and therefore, the condition <strong>of</strong> these shell habitats affects oyster stock abundance. TheSouth Atlantic Fishery Management Council (SAFMC) considers shell bottom essential fishhabitat (EFH) for red and black drum, striped bass, sheepshead, weakfish, spotted seatrout,summer and southern flounder. Shell bottom has a stabilizing effect on erosional processesand may modify current and tidal flow. It provides a hard substrate required as habitat forsessile filter feeding organisms and serves as cover for small fish and invertebrates.The more complex the habitat structure, the more susceptible the habitat is todisturbance by mobile bottom fishing gear (Auster 1998). Shell bottom is a fairly complexhabitat that is affected by both oyster dredges and otter trawls. Lenihan (1998) found thatoyster dredges reduced the vertical relief <strong>of</strong> subtidal oyster reefs causing several negativehabitat impacts. These impacts were the scatterings <strong>of</strong> shell and oysters into less suitable133
substrates, and destabilizing the reef structure causing an increase in vulnerability to damageby storms. Dredging reduces the small interstitial spaces that function as refuge and foragingareas for juvenile fish. Trawling over oyster reefs has a similar affect by disturbing the structure<strong>of</strong> the reefs, reducing and scattering the upper layers <strong>of</strong> shell with the movement <strong>of</strong> trawl doorsor chain as the gear is fished over the structure (DMF 2001; Street 2004). The Blue RibbonAdvisory Council on Oysters (BRACO) (1995) concluded that trawling had a significant negativeimpact on live shell bottom habitat. With the understanding <strong>of</strong> the economic value <strong>of</strong> the shrimpfishery by the BRACO, they proposed the establishment <strong>of</strong> an experiment to test whethershrimping could be made more compatible with oyster habitat preservation in theAlbemarle/Pamlico system. It was also proposed by the BRACO to establish trawlingrestrictions in conjunction with shell cultch planting <strong>of</strong> some oyster reefs in a sufficiently largearea so as to test whether income from shrimping can still be maintained despite the spatialdisplacement <strong>of</strong> the shrimping fleet and whether that protection from trawl damage enhancesand sustains oyster production <strong>of</strong> those protected reefs.Trawl Effects on Submerged Aquatic Vegetation (SAV)Submerged Aquatic Vegetation (SAV) is a fish habitat dominated by one or morespecies <strong>of</strong> underwater vascular plants and is defined by the North Carolina <strong>Marine</strong> <strong>Fisheries</strong>Commission (MFC) as those habitats in public trust and estuarine waters vegetated with one ormore species <strong>of</strong> submerged vegetation such as eel grass (Zostera marina), shoalgrass(Halodule wrightii) and widgeon grass (Ruppia maritima). SAVs occur in both subtidal andintertidal zones and may be patchy or continuous meadows. In patchy areas, bottom betweenthe patches is also considered habitat. SAV habitat is important to the life cycle <strong>of</strong> manyorganisms including red drum, spotted seatrout, snapper/grouper, bay scallops, and peneaidshrimp by providing refuge, forage and spawning location as well as a nursery area. SAVsprovide important ecosystem functions such as structural complexity, sediment and shorelinestabilization, primary productivity, and nutrient cycling.There are two types <strong>of</strong> SAV communities. There is the high salinity estuarine type thatinclude the three species listed above and lower salinity freshwater SAVs such as wild celery(Vallisneria americana), bushy pondweed (Najas guadalupensis) redhead grass (Potamogetonperfoliatus) and sago pondweed (P. pectinatus). These species are found in the coastal riverinesystems and are more diverse than the high salinity SAVs.There are several bottom disturbing fishing gears that have the potential to destroy ordamage SAV. Shearing <strong>of</strong> blades, seeds and/or flowers, uprooting, as well as burial are injuriesto SAV caused by fishing gears such as the otter trawl. Turbidity, which may cause a reductionin light for photosynthesis is also a concern. Below ground impacts are also a great concern,however, these impacts result more from digging gears such as clam rakes and dredges andare probably minimal from trawls (Street et al. 2005; (ASMFC 2000).Impacts from trawling over SAV may occur from the sweep <strong>of</strong> the net and the digging <strong>of</strong>the trawl doors into the sediment (ASMFC 2000). It is estimated that the maximum cuttingdepth for otter trawl doors ranges between about an inch and a foot (2.54-30.48 cm) when usedin depths over about 100 ft (30.48) (ASMFC 2000), although such deep water does not occur inNorth Carolina’s estuaries. Cutting depth variation is due to differences in gear weight, bottomhardness and towing warp to depth ratios (a measure <strong>of</strong> the force <strong>of</strong> the gear). Trawl doorswere found to penetrate the bottom more than the rest <strong>of</strong> the gear (ASMFC 2000). In the Gulfregion, it has been noted that trawling by larger vessels in deep water (2-3 m) through SAVresulted in edges <strong>of</strong> SAV ripped up and observed masses <strong>of</strong> SAV floating on the surface134
following the opening <strong>of</strong> shrimp season. It was also noted that shallow SAV beds were notaffected by trawling except during high tides when beds were more accessible (Eleuterius1987).Overall, there are few specific studies addressing effects <strong>of</strong> trawling over SAVs,however, the knowledge from studies in other bottoms and habitat types may be intuitivelyapplied to what the effects <strong>of</strong> trawling over SAVs may be. These effects include leaf shearingand uprooting in areas that are heavily trawled, resulting in the loss <strong>of</strong> blades and shoots whichin turn reduces the complexity and coverage <strong>of</strong> SAV beds. Turbidity effects, especially in areas<strong>of</strong> low energy where sediment types tend to be mud/silt can reduce light levels needed forphotosynthesis.Trawl Effects on S<strong>of</strong>t BottomThe Coastal Habitat Protection Plan defines s<strong>of</strong>t bottom as unconsolidated, unvegetatedsediment that occurs in freshwater, estuarine and marine systems. It is found in both subtidaland intertidal zones and can be characterized by geomorphology (the shape and size <strong>of</strong> thesystem), sediment type, water depth, hydrography and salinity (Street et al. 2005).As with other habitats, damage from bottom-disturbing fishing gear varies with gear type,and habitat complexity. S<strong>of</strong>t bottom habitats have been considered the most appropriatebottom to use bottom-disturbing gear because <strong>of</strong> its lack <strong>of</strong> structure and complexity. However,the degree to which bottom trawls disturb the sediment surface depends on the sediment typeand the gear itself. As mentioned earlier, different parts <strong>of</strong> the gear have different effects onhabitat as well as tow speed and net configuration. However the depth <strong>of</strong> penetration by anypart <strong>of</strong> the gear is always greater in muddy substrate as compared to sandy substrate (DMF1999).Trawling in sandy and muddy areas causes resuspension <strong>of</strong> bottom sediments. Besidesthe resulting turbidity, grain size <strong>of</strong> the sediment as it settles back to the bottom can be altered.This is because the coarser sand grains settle out faster than the finer mud/silt/clay sedimentgrains along with organics important for deposit feeding infauna. Tidal transport <strong>of</strong> fine-grainedsediments can alter the sediment composition by increasing average grain size <strong>of</strong> the trawledbottom (DMF 1999). Areas <strong>of</strong> shallow sandy substrate located in places <strong>of</strong> high energy or tidalflow are regularly disturbed be natural physical processes. These areas recover quickly.Therefore, disturbances by trawling in the same type <strong>of</strong> area would also recover quickly, whilethose areas that are deep and muddy with little natural disturbances are slow to recover fromphysical processes as well as by trawling disturbances (DeAlteris et al. 1999). Schwinghamer etal. (1998) found that trawling in a sandy bottom area on the Grand Banks caused measurablechanges to top sediments and habitat structure (mound, tubes, and burrows) but recovered in ayear. They also noted less organic material in the trawled area versus the untrawled areawhere sediments had a “hummocky, mottled” appearance.Palanques et al. (2001) studied the impacts <strong>of</strong> trawling in a muddy low-energyenvironment 30-40 m deep. Side scan sonar showed trawl door tracks were present after oneyear. Sediment thickness was reduced by 2-3 cm by the net. Turbidity increased graduallybeginning with turbidity close to the seabed followed by progressively resuspended particlesbecoming mixed several meters above the bottom leading to an increase in turbidity after 24hours. Within 4-5 days, turbidity had increased even more with suspended sedimentsrepresenting 10% <strong>of</strong> the total amount <strong>of</strong> sediment disturbed by trawling.135
In North Carolina, Corbett et al. (2004) conducted a study on the impact <strong>of</strong> trawling onthe water column in South Creek, a tributary <strong>of</strong> the Pamlico River. This shallow water s<strong>of</strong>tbottom creek was trawled in an upstream area and a downstream area for 45 minutes back andforth on six sampling occasions over a two-year period. These areas along with two untrawledareas were monitored for a minimum <strong>of</strong> two days before and after trawling. It was found thatsediment resuspension from wind over a large fetch was similar to trawling while trawling wasthe dominant force when wind direction was over a small fetch.Churchill (1998) discusses modeling sediment resuspension in an area called the “MudPatch” located on the New England shelf. The model included information such asresuspension rates by trawls, estimates <strong>of</strong> rates <strong>of</strong> settlement <strong>of</strong> sediment and NMFS trawlingactivity records in the region. He then modeled resuspension <strong>of</strong> sediments by currents withdata <strong>of</strong> near-bottom currents, surface wave motions and near-bottom sediment concentrations.Results from these models in this area showed that the overall impact <strong>of</strong> trawling on sedimentresuspension was a function <strong>of</strong> depth. As depth increased, resuspension was less influenced bycurrent and more influenced by trawling, at least in the wintertime in the “Mud Patch”.Ecological Impacts <strong>of</strong> TrawlingSignificant changes in habitat can cause changes in community structure by alteringspecies composition and productivity. These include changes in abundances and diversity <strong>of</strong>the benthic and epibenthic community, changes in the geochemical structure <strong>of</strong> the watercolumn resulting from turbidity, and release <strong>of</strong> nitrogen and phosphorus, among others,effecting primary productivity. All <strong>of</strong> these changes can result in the alteration <strong>of</strong> food webs andbringing the system full circle back to effects on species abundance and diversity.It has been found that in areas <strong>of</strong> repeated trawling, there are community shifts fromspecies that are large and slow growing toward dominance by fast growing species that aresmall-bodied (Kaiser et al. 2002; NRC 2002). Trawling removes huge amounts <strong>of</strong> biomass byremoving species that are being targeted. Some <strong>of</strong> those species being removed may also actas predators. The removal <strong>of</strong> targeted species results in changes <strong>of</strong> species composition aswell as changes in biomass and production. This results in an overall lower productivitybecause <strong>of</strong> the removal <strong>of</strong> the high biomass species. Other non-targeted species suffer variousdegrees <strong>of</strong> mortality and displacement by trawling. These species act as prey items as well asadd to the characteristics <strong>of</strong> the habitat by reworking the sediments, burrowing, creatingdepressions, mounds etc (McConnaughey et al. 2000; Kaiser et al. 2002). This new communitystructure will become permanent as fauna readapt to the trawling disturbance (Kaiser et al.2002).Cahoon et al. (1998) looked at the impacts from trawling on s<strong>of</strong>t-bottom organisms inprimary nursery areas located in Rose Bay, Pungo Creek and South Creek in North Carolina.These primary nursery areas are closed to trawling. They found no significant effect on thebiomass <strong>of</strong> benthic microalgae, no consistent effect on the abundance <strong>of</strong> demersal zooplankton(nematodes), and a slight but non-significant effect on the abundances <strong>of</strong> benthic macr<strong>of</strong>auna(polychaetes and Macoma clams). When they compared trawled to untrawled areas located inthe Pamlico River, an area that is opened to trawling, they found significantly higher benthicmicroalgal biomass in the untrawled areas. There were no significant differences in abundance<strong>of</strong> demersal zooplankton (nematodes) but higher abundances <strong>of</strong> benthic macr<strong>of</strong>auna(polychaetes and Macoma clams) in trawled locations than at untrawled locations. Theyconcluded that these shallow s<strong>of</strong>t-bottom habitats experience frequent wind, wave, and storm136
disturbances that are probably similar to disturbance caused by trawling. However, they cautionthat the frequency and intensity <strong>of</strong> trawling can overcome the resilience <strong>of</strong> these organisms.Besides changes in community structure, there are also concerns about effects <strong>of</strong> thegeochemistry <strong>of</strong> the water column from trawling. Increased turbidity, nutrients and heavy metalcontamination can result from trawling disturbing the bottom. Increased turbidity can reducethe maximum depth <strong>of</strong> light penetration effecting photosynthesis by SAVs and algae. Increasedturbidity can affect foraging success <strong>of</strong> visual predators as well as impede the function <strong>of</strong>feeding and respiratory structures. Filter feeding species such as the Atlantic menhaden, bayanchovy and Atlantic silverside are much more sensitive to turbidity than the more demersalfeeding species such as spot. Extreme concentrations <strong>of</strong> nitrogen and phosphorus in the watercolumn may stimulate algal blooms, ultimately leading to eutrophication or nutrient enrichment(Pilskaln et al. 1998). Although such blooms may benefit herbivorous zooplankton andorganisms <strong>of</strong> higher trophic level, the resultant decomposition <strong>of</strong> the algae, the increasednighttime respiration by algae still alive, and the additional nitrogenous waste excreted by theirconsumers may deplete the dissolved oxygen levels. The probability <strong>of</strong> fish kills is alsoincreased under such conditions. However, the volume and spatial extent <strong>of</strong> nutrientsresuspended in the water column by bottom-disturbing gear such as trawls are relatively minorcompared to the nutrient inputs associated with non-point pollutant sources such as agriculture(DMF 1999; Street et al. 2005). Nonetheless, bottom sediments have the ability to store avariety <strong>of</strong> heavy metals and toxic compounds that may be released into the water following thephysical disturbance <strong>of</strong> benthic sediments (DMF 1999).III.CURRENT AUTHORITYNorth Carolina <strong>Fisheries</strong> Rules for Coastal Waters15A NCAC 3J .0104 TRAWL NETSProhibits trawl nets in specific areas15A NCAC 3K .0103 SHELLFISH OR SEED MANAGEMENT AREASProhibits trawl nets in shellfish or seed management areas15A NCAC 3L .0101 SEASONGives Director Proclamation authority to open shrimp season in various waters15A NCAC 3N .0104 PROHIBITED GEAR, PRIMARY NURSERY AREASProhibits trawl nets in primary nursery areas15A NCAC 3N .0105 PROHIBITED GEAR, SECONDARY NURSERY AREASProhibits trawl nets in secondary nursery areas15A NCAC 3O .0211 PROTECTION OF PRIVATE SHELLFISH INTERESTProhibits trawl nets on shellfish lease or franchise15A NCAC 3R .0103 PRIMARY NURSERY AREASDelineates primary nursery areas15A NCAC 3R .0104 PERMANENT SECONDARY NURSERY AREASDelineates secondary nursery areas15A NCAC 3R .0105 SPECIAL SECONDARY NURSERY AREASDelineates special secondary nursery areas15A NCAC 3R .0106 TRAWL NETS PROHIBITEDDelineates other areas where trawl nets are prohibitedIV.DISCUSSIONNorth Carolina’s estuarine system is over two million acres and is the largest <strong>of</strong> any stateon the Atlantic coast. Features such as the amount <strong>of</strong> open water area, amount <strong>of</strong> coastline,137
depth, tides, bottom types, sea grass, and shoreline orientation makes it unique. NorthCarolina’s estuaries consist <strong>of</strong> 92 percent open water while only 8 percent are wetlands. It hasover 3,000 miles <strong>of</strong> estuarine coastline compared to only 300 miles <strong>of</strong> ocean coastline. It is ashallow system averaging 12 feet in depth. Tidal amplitude ranges from zero in the northernarea to five feet in the southern area. Oyster reefs are found more subtidally in the northernarea and more intertidally in the south. There are marine SAVs located along the Outer Banks,in Core Sound and Bogue Sound. Several species <strong>of</strong> brackish and freshwater SAVs are foundon the mainland side <strong>of</strong> Albemarle Sound, Pamlico Sound and Currituck Sound. Unvegetatedsand and mud make up the majority <strong>of</strong> the estuarine bottom, dependent on tide and windcurrent influence (DMF 1999; DMF 2004).The DMF’s management <strong>of</strong> trawling has focused mainly on the protection <strong>of</strong> juvenilefinfish and shellfish but has also achieved habitat protection at the same time. In 1969, theNorth Carolina General assembly enacted Chapter 1101, 1969 Session Laws, directing theDMF to conduct a study <strong>of</strong> the fisheries resources <strong>of</strong> the coastal areas. The DMF conductedseveral studies from 1970 through 1976 resulting in the identification <strong>of</strong> estuarine areas thatconsistently supported populations <strong>of</strong> juvenile shrimp, crab, flounder, croaker, spot andmenhaden. From these studies the <strong>Marine</strong> <strong>Fisheries</strong> Commission adopted regulations in 1977to protect these nursery areas and defined them by rule. There are presently three types <strong>of</strong>nursery areas. These are Primary Nursery Areas (PNAs), Secondary Nursery Areas (SNAs)and Special Secondary Nursery Areas (SSNAs).Primary nursery areas are defined as those areas in the estuarine system where initialpost larval development takes place. They are normally located in the uppermost sections <strong>of</strong> asystem where populations are very early juveniles. There are a little more than 80,000 acres <strong>of</strong>PNAs. Secondary nursery areas are those areas where later juvenile development takes place.Populations are usually composed <strong>of</strong> developing sub-adults <strong>of</strong> similar size that have migratedfrom a primary nursery area to the lower portions <strong>of</strong> creeks and bays. Approximately 35,000areas <strong>of</strong> estuarine waters are SNAs. Special secondary nursery areas are located downstreamfrom primaries in areas near open waters and sounds <strong>of</strong> high salinities. Most are located inCore Sound. These areas may be opened to trawling in the fall when shrimp have reached acertain size and are ready to move out. There are around 31,000 acres <strong>of</strong> SSNAs. Theseareas total 147,000 acres closed to trawling. Other areas closed to trawling by rule are theAlbemarle Sound, designated SAVs, posted oyster rocks, shellfish management areas, andshellfish leases. Thirty-two thousand acres are closed because <strong>of</strong> military activity and anadditional 32,000 acres are closed by proclamation. All <strong>of</strong> these closures add up to over onemillion acres or 48% <strong>of</strong> estuarine waters are closed to trawling (Figure 1) (DMF 1999).138
1200000Acreage6000000Nursery AreasRulesMilitaryProclamationsTotal closedFigure 1. Acreage <strong>of</strong> closed areas in estuarine waters <strong>of</strong> North Carolina (DMF 1999)There are additional ways to manage habitat that is critical to the life histories <strong>of</strong> our fishand shellfish. Total closure <strong>of</strong> the estuarine waters to trawling would conserve those inshorehabitats but at the loss <strong>of</strong> approximately 70% <strong>of</strong> the state’s shrimp landings, as well as a portion<strong>of</strong> blue crab landings. Rotation <strong>of</strong> fishing areas similar to rotation management <strong>of</strong> mechanicalclam harvest areas is one possibility. This would allow recovery time <strong>of</strong> one area while anotherarea is being fished. However, this can concentrate effort spatially and may do more damage tothe area that is open because <strong>of</strong> increased frequency and intensity. Modifying trawling gearsuch as running a tickler chain through a PVC pipe or adding rollers to the sweep <strong>of</strong> the net mayminimize effects to the bottom in some areas. Partitioning areas between trawlers andstationary gear may decrease the amount <strong>of</strong> area affected by trawling but may result in moreuser conflict, concentrate effort and possibly a decrease in CPUE. Allowing only stationarygear such as the shrimp pound or shrimp trap is another option, however, time is needed todesign and test the feasibility <strong>of</strong> such use. Shortening the time an area is open would decreaseimpacts and allow a longer time for recovery. Closing more area to shrimping, especially wherethere may be significant impacts in places such as White Oak River, Newport River and otherplaces where oyster rocks are abundant and oyster restoration efforts exist, may be anadditional consideration in the management <strong>of</strong> trawling and its effects on habitat.Current knowledge <strong>of</strong> fishing gear impacts indicates that shrimp-trawling gear can havehabitat impacts, dependent on the structure and complexity <strong>of</strong> the habitat, energy regime, depthand sediment type. These impacts can be severe in highly structured, deep, low-energyenvironments and minimal in unconsolidated sandy shallow high-energy environments. Ourcurrent management <strong>of</strong> the shrimp trawl/crab trawl fishery by prohibiting the use <strong>of</strong> trawl nets inshellfish and seed management areas, shellfish leases and franchises, primary nursery areas,secondary nursery areas, SAVs as well as other areas described in rule and in proclamationminimizes bottom disturbing effects <strong>of</strong> trawling in those habitats more vulnerable to the effects<strong>of</strong> trawling.139
V. MANAGEMENT OPTIONS/IMPACTS1. Status Quo+ No additional regulation- Unknown impacts on habitat function along with possible impacts onspecies diversity <strong>of</strong> benthic fauna2. Partition trawling activities from fixed gear activities+ Decrease in the amount <strong>of</strong> habitat affected by trawling+ Possible decrease in bycatch- Larger number <strong>of</strong> trawlers in a reduced area could increase impacts tobenthos- Larger number <strong>of</strong> fixed gear in a reduced area could increase navigationhazards and decrease CPUE3. Decrease the amount <strong>of</strong> area open to shrimp trawling harvest+ Decrease in amount <strong>of</strong> habitat affected by shrimp trawling+ Possible decrease in bycatch- Larger number <strong>of</strong> boats in a reduced area could increase impacts onbenthos4. Modify trawl gear+ Minimize effects on habitat by trawl gear+ Encourage gear research- Increase in cost to fishermen to change gear over5. Establish a reduced trawling season+ Shorter amount <strong>of</strong> time habitat is impacted+ Longer amount <strong>of</strong> time habitat can recover- Reduced income for fishermen6. Rotate trawling in existing sites+ Decrease amount <strong>of</strong> habitat affected by trawling at one time+ Ability for closed portions <strong>of</strong> area to recover from harvest impacts- Larger number <strong>of</strong> boats in a reduced area could increase impacts onbenthos140
7. Use only stationary fishing gear+ Decrease impacts to habitat+ May decrease bycatch- Time needed to design, test, and evaluate different stationary gear- Increase cost for fishermen to make gear changes- Decrease in landings and income as fishermen learn how to use gear- Possible increase in conflict- Increase in navigational hazards8. Close all trawling+ No further impacts by harvest gear on benthos+ Decrease in bycatch- Loss <strong>of</strong> income to trawlers9. Re-examine habitats needing protection and modify rules+ Manage according to current studies and mapping datat+ Decrease impacts to critical habitats- May decrease traditional trawling areasVI.RESEARCH NEEDS• Define and quantify the intensity, duration and spatial scale <strong>of</strong> trawling effort in NCestuaries.• Map and quantify the habitat structure and sediment types in North Carolina estuaries.• Determine the effects <strong>of</strong> trawling on sediment size distribution and organic carboncontent.• Determine the effect <strong>of</strong> trawling on water quality and primary productivity.• Determine the physical effects <strong>of</strong> currents, storms, animal activities, etc. on sedimentdisturbances and compare to mobile fishing gear effects.• Determine the effects trawling and recovery time <strong>of</strong> benthic community structure indifferent habitat types• Determine the effects <strong>of</strong> trawling on secondary productivity and how it affects localpathways <strong>of</strong> food energy transfer.RECOMMENDATION:AC, DMF and MFC recommendations: Investigate the use <strong>of</strong> shrimp traps as RCGL gearincluding size restrictions and location.141
VIII.LITERATURE CITEDASMFC (Atlantic States <strong>Marine</strong> <strong>Fisheries</strong> Commission). 2000. Evaluating fishing gear impacts tosubmerged aquatic vegetation and determining mitigation strategies. ASMFC HabitatManagement Series 5 38p.Auster, P.J. 1998. A conceptual model <strong>of</strong> the impacts <strong>of</strong> fishing gear on the integrity <strong>of</strong> fish habitats.Conserv. Biol. 12(6)1198-1203.Churchill J.H.1998. Sediment resuspension by bottom fishing gear. p 134-138 in EM Dorseyand J Pederson (editors) Effects <strong>of</strong> Fishing Gear on the Sea Floor <strong>of</strong> New England.Conservation Law Foundation, Boston.Cahoon, L.B., M.H. Posey and W.H. Daniels. 1998. <strong>Shrimp</strong> and crab trawling impacts onestuarine s<strong>of</strong>t-bottom organisms. NC Seagrant Project No. 98-EP-21. 17pCorbett, D.R., T. West, L. Clough, and H Daniels. Draft 2004. Potential impacts <strong>of</strong> bottomtrawling on water column productivity and sediment transport processes. NC SeagrantProject No. 01-EP-04. 72p.DeAlteris, J., L. Skrobe, and C. Lipsky. 1999. The significance <strong>of</strong> seabed disturbance by mobilefishing gear relative to natural processes: A case study in Narragansett Bay, RhodeIsland. American <strong>Fisheries</strong> Symposium 22:1-14.Dorsey, E.M. and J. Pederson (eds.).1998. Effects <strong>of</strong> fishing gear on the sea floor <strong>of</strong> New England.Conservation Law Foundation, Boston. 160 p.Euterius, L. 1987. Seagrass ecology along the coasts <strong>of</strong> Alabama, Louisiana, and Mississippi.p. 11-24 in M.J. Durako, R.C. Phillips, and R.R. Lewis, III (editors) Proceedings <strong>of</strong> thesymposium on subtropical–tropical seagrasses in the Southeastern United States. FLMar. Res. Pub 42, St Petersburg Fl. 209pFrankenberg, D. 1995. Report <strong>of</strong> the North Carolina Blue Ribbon Advisory Council on Oysters.North Carolina Department <strong>of</strong> Environment, Health and Natural Resources. Raleigh, NC.Kaiser, M.J., J.S. Collie, S.J. Hall, S. Jennings, and I.R. Poiner. 2002. Modification <strong>of</strong> marinehabitats by trawling activities: prognosis and solutions. Fish and <strong>Fisheries</strong> 3:114-136.Lenihan, H.S. 1998. Physical-biological coupling on oyster reefs: how habitat structuresindividual performance. Ecological Monographs 79: 251-275DMF (North Carolina <strong>Division</strong> <strong>of</strong> <strong>Marine</strong> <strong>Fisheries</strong>). 1999. <strong>Shrimp</strong> and crab trawling in North Carolina’sestuarine waters, a report to the North Carolina <strong>Marine</strong> <strong>Fisheries</strong> Commission, North Carolina<strong>Division</strong> <strong>of</strong> <strong>Marine</strong> <strong>Fisheries</strong>, 118pDMF (North Carolina <strong>Division</strong> <strong>of</strong> <strong>Marine</strong> <strong>Fisheries</strong>). 2001. North Carolina Fishery Management Plan:Oyster. North Carolina <strong>Marine</strong> <strong>Fisheries</strong> Commission, North Carolina <strong>Division</strong> <strong>of</strong> <strong>Marine</strong><strong>Fisheries</strong>, 218p142
DMF (North Carolina <strong>Division</strong> <strong>of</strong> <strong>Marine</strong> <strong>Fisheries</strong>). Draft 2004. North Carolina Fishery ManagementPlan: Blue Crab. North Carolina <strong>Marine</strong> <strong>Fisheries</strong> Commission, North Carolina <strong>Division</strong> <strong>of</strong><strong>Marine</strong> <strong>Fisheries</strong>, 345pNRC (National Research Council). 2002. Effects <strong>of</strong> trawling and dredging on seafloor habitat. TheNational Academic Press, Washington, D.C., 126p.McConnaghey, R.A., K.L. Mier, and C.B. Dew. 2000. An examination <strong>of</strong> chronic trawling effects on s<strong>of</strong>tbottombenthos <strong>of</strong> the eastern Bering Sea. ICES Jr. Mar. Sci. 57:1377-1388Palanques, A., J. Guillen, and P. Puig. 2001. Impact <strong>of</strong> bottom trawling on water turbidity and muddysediment <strong>of</strong> an unfished continental shelf. Limnol. Oceanogr., 46(5):1100-1110.Pilskaln, C.H., J.H. Churchill, and L.M. Mayer. 1998. Resuspension <strong>of</strong> sediment by bottom trawling inthe Gulf <strong>of</strong> Maine and potential geochemical consequences. Conserv. Biol. (12)6:1223-1229.SAFMC (South Atlantic <strong>Fisheries</strong> Management Council). 1998. Final habitat plan for the South Atlanticregion: Essential Fish Habitat requirements for fishery management plans <strong>of</strong> the South AtlanticFishery Management Council. SAFMC, Charleston, S.C., 457pSchwinghamer, P., D.C. Gordon, Jr, T.W. Rowell, J.Prena, D.L. Mckeown, G. Sonnichsen, and J.Y.Guigne. 1998. Effects <strong>of</strong> experimental Otter Trawling on surficial sediment properties <strong>of</strong> asandy-bottom ecosystem on the Grand Banks <strong>of</strong> Newfoundland. Conserv. Biol. 12(6)1215-1222.Street, M.W., A.S. Deaton, W.S. Chappell, and P.D. Mooreside. Draft Sept. 2004. NorthCarolina coastal habitat protection plan. North Carolina <strong>Division</strong> <strong>of</strong> <strong>Marine</strong> <strong>Fisheries</strong>.607pVan Dolah, R.F., P.H. Wendt, and N. Nicholson. 1987. Effects <strong>of</strong> a research trawl on a hardbottom assemblage <strong>of</strong> sponges and corals. <strong>Fisheries</strong> Research 5:39-54Watling, L. and E. Norse. 1998. Disturbance <strong>of</strong> the seabed by mobile fishing gear: acomparison to forest clearcutting. Conserv. Biol. 12(6):540-551143
12.3 Appendix 3 SHRIMP TRAWL BYCATCHI. Issue:Bycatch in the shrimp trawl fishery.II.Background:Over the last few years, bycatch has become one <strong>of</strong> the more controversial topics infisheries management both in the United States and around the world (Alverson et al. 1994;Crowder and Murawski 1998). In spite <strong>of</strong> increased public awareness, greater managementscrutiny, and significant research efforts, many basic issues remain unresolved. Only recentlyhas the term bycatch been defined in any standard manner, and important information on themagnitude <strong>of</strong> bycatch is severely lacking for many fisheries. Given this situation, it is notsurprising that little is known <strong>of</strong> the impacts <strong>of</strong> bycatch on specific fisheries, fish populations,and marine communities. However, this lack <strong>of</strong> basic information has not dulled the public’sinterest and may, in fact, catalyze such concerns. As a result, recent public policy dictates thatbycatch be either eliminated or reduced to insignificant levels (Crowder and Murawski 1998).As perhaps the prime example <strong>of</strong> the new policy positions, the re-authorized Magnuson-StevensFishery Conservation and Management Act (MSFCMA) contains a National Standard (#9)requiring bycatch minimization (USDOC 1996). National Standard 9 states: “Conservation andmanagement measures shall, to the extent practicable, (A) minimize bycatch and (B) to theextent bycatch cannot be avoided, minimize the mortality <strong>of</strong> such bycatch." Additionally, in1991the North Carolina <strong>Marine</strong> <strong>Fisheries</strong> Commission (MFC) adopted a policy directing the <strong>Division</strong><strong>of</strong> <strong>Marine</strong> <strong>Fisheries</strong> (DMF) to establish the goal <strong>of</strong> reducing bycatch losses to the absoluteminimum and to consciously incorporate that goal into all it’s, management considerations(Murrary et al. 1991).Bycatch is defined by the Atlantic States <strong>Marine</strong> <strong>Fisheries</strong> Commission (ASMFC) as “theportion <strong>of</strong> a catch taken incidentally to the targeted catch because <strong>of</strong> non-selectivity <strong>of</strong> thefishing gear to either species or size differences” (ASMFC 1994). In the MSFCMA, bycatch isdefined as “fish which are harvested in a fishery, but which are not sold or kept for personaluse” (USDOC 1996). Bycatch can be divided into two components: incidental catch anddiscarded catch. Incidental catch refers to retained catch <strong>of</strong> non-targeted species. Discardedcatch is that portion <strong>of</strong> the catch returned to the sea as a result <strong>of</strong> economic, legal, or personalconsiderations. The biological significance <strong>of</strong> bycatch can be judged from a number <strong>of</strong> differentperspectives, including those <strong>of</strong> the populations (e.g. <strong>of</strong> a particular species), <strong>of</strong> the fishery orfisheries that target or otherwise encounter the species, and <strong>of</strong> the general biological community(Murawksi 1995).During the late 80’s the DMF initiated gear testing to reduce bycatch in the shrimp trawlfishery (Pearce et al. 1988, and Holland 1988). Due to growing concern over bycatch in shrimptrawl fisheries the MSFCMA was amended in 1990 to include bycatch research. Congressmandated that the U.S. Secretary <strong>of</strong> Commerce conduct a three year research program toassess the impact <strong>of</strong> the incidental harvest by the shrimp trawl fishery on fishery resources inthe South Atlantic and the Gulf <strong>of</strong> Mexico areas. The National <strong>Marine</strong> <strong>Fisheries</strong> Service(NMFS), along with the Gulf and South Atlantic <strong>Fisheries</strong> Development Foundation (GSAFDF),began a cooperative bycatch research program to: (1) update and expand bycatch estimatestemporally and spatially; (2) identify, develop and evaluate gear options for reducing bycatch;(3) develop an information transfer and education program on bycatch; and (4) develop andoperate a standardized data management system for centralized dissemination and access144
(NMFS 1995). Starting in 1992, observers were placed aboard cooperating vessels tocharacterize bycatch and to test BRDs during normal commercial shrimp trawling.While it is becoming increasingly apparent to scientists, natural resource managers, andmuch <strong>of</strong> the general public that bycatch is an important issue that must be addressed,characterizing the nature and extent <strong>of</strong> bycatch has proven extremely difficult. These difficultiesare generally attributed to inadequate monitoring <strong>of</strong> many pertinent characteristics, includingactual bycatch levels, effort <strong>of</strong> the directed fishery, distribution <strong>of</strong> the bycatch species, and themortality rate <strong>of</strong> the discarded species. The problem is exacerbated by the patchy distribution <strong>of</strong>effort and juvenile finfish in both time and space. The amount <strong>of</strong> bycatch in a particular trip isusually very skewed, with many tows having some bycatch and very few tows with high bycatch.Additionally, available effort data are <strong>of</strong>ten inadequate. Although research indicates that towduration is <strong>of</strong>ten a significant factor when estimating bycatch losses, the DMF and most otheragencies typically record effort data by trip without any accompanying information on towduration or the number <strong>of</strong> tows made during a trip. Mortality <strong>of</strong> bycatch captured in trawls variesconsiderably, not only by species, but also in response to factors such as water temperature,tow time, fishing location, and gear configuration.The lack <strong>of</strong> reliable discard estimates has not stopped researchers from investigatingassessment impacts, but it has prevented increases in precision. Most assessments addressthe range <strong>of</strong> bycatch estimates through sensitivity analyses by comparing basic assessmentresults over the range <strong>of</strong> bycatch estimates and assumptions. If none <strong>of</strong> the results seemplausible, the assessment may proceed without the bycatch estimates included but with thecaveat that results may be biased or contain additional uncertainties due to unknown levels <strong>of</strong>missing catch.III.DISCUSSION:Bycatch CharacterizationIncidental Catch:Total annual landings in the North Carolina shrimp trawl fishery has averaged 7.3 millionpounds, ranging from 4.9 to 9.9 million pounds (DMF Trip Ticket data 1994-2003; Table 1).<strong>Shrimp</strong> (brown, pink, and white) account for 92% <strong>of</strong> the total landings followed by finfish (4%),crabs [4% (blue, stone, and horseshoe crabs)] and Mollusks [0.45% (conchs/welks, squid,octopus, and clams)]. Ninety-two percent <strong>of</strong> the total shrimp trawl landings come from threeareas; Pamlico Sound (53%), Atlantic Ocean (28%), and Core Sound [11% (Table 2)]. In theAtlantic Ocean 87% <strong>of</strong> the landings are reported within three miles <strong>of</strong> the shoreline and 74% arecaught south <strong>of</strong> Cape Hatteras (Table 3). The period <strong>of</strong> June through November accounts for92% <strong>of</strong> the total landings (Table 4).On average 323,902 pounds <strong>of</strong> finfish are landed annually by shrimp trawls (Table 1).Five groups; sea mullet [whiting, and kingfish 38%, 124,547 pounds), flounder [summer andsouthern (18%, 58,933 pounds), spot (17%, 56,606 pounds), Atlantic croaker (8%, 25,373pounds) and weakfish (5%, 15,560 pounds), account for 87% <strong>of</strong> the finfish landings (Table 5).Ninety-six percent <strong>of</strong> these landings are reported from two areas, the ocean and Pamlico Sound(Table 2). The ocean accounts for 85% <strong>of</strong> the croaker, 66% <strong>of</strong> the sea mullet, and 54% <strong>of</strong> thespot landed from shrimp trawls (Table 6). Pamlico Sound accounts for 61% <strong>of</strong> the flounder and89% <strong>of</strong> the weakfish landings for this gear. The peak months for finfish landings from shrimptrawls are in October (23%) and November (20%), with the period <strong>of</strong> August through December145
accounting for 80% <strong>of</strong> all finfish landings (Table 4). The peak month for sea mullet landingsfrom shrimp trawls is November (32%), while the period from July through December accountsfor 82% <strong>of</strong> the landings (Table 7). Seventy-four percent <strong>of</strong> the flounder are landed from Julythrough November, with September accounting for 23% <strong>of</strong> the landings. The period <strong>of</strong> Augustthrough November accounts for 95% <strong>of</strong> the spot landings, with October accounting for 44% <strong>of</strong>the landings. Seventy percent <strong>of</strong> the Atlantic croaker are landed in December, and 94% arelanded from September through January. Weakfish landings peak in August, while 92% <strong>of</strong> thelandings occur from July through November. Total annual value <strong>of</strong> finfish landings from shrimptrawls by species, waterbody, and month are given in Tables 8, 9, and 10.Since 1994, annual crab (blue, horseshoe, and stone) landings by shrimp trawls haveaveraged 262,460 pounds (Table 1). Blue crabs account for over 99% <strong>of</strong> the shrimp trawl crablandings followed by horseshoe (0.11%), and stone crabs [
een conducted for North Carolina waters, preliminary investigations were conducted in 1995(Diamond-Tissue 1999) and 1999 (Johnson 2003). Diamond-Tissue’s (1999) 1995characterization study examined 52 tows conducted over 15 trips. Sampled boats had one ortwo nets, and all nets contained the required Turtle Excluder Device (TED) and bycatchreduction device (BRD). A total <strong>of</strong> 92 different species, including 66 species <strong>of</strong> finfish, 10species <strong>of</strong> crabs, and 13 other invertebrates were identified. For all areas combined, marketsizepenaeid shrimp made up 44.3% <strong>of</strong> the organisms by number and 30.8% by weight (Tables26 and 27). The top finfish species by number were star drum, Atlantic croaker, weakfish, andspot, while Atlantic croaker, weakfish, spot, and star drum were the top finfish species byweight. Samples from Pamlico Sound (n=16 tows) and the Cape Fear River (n=24 tows) werecollected monthly from July through October 1995. Additionally, four tows were sampled inCore Sound in August 1995, and eight tows were examined <strong>of</strong>f Carolina Beach during July andAugust. In Pamlico Sound, 38 species were identified in the catches, 37 were identified in CoreSound, and 50 species were identified in Cape Fear River. Market-size penaeid shrimp werethe top species in terms <strong>of</strong> both numbers (Table 26) and weight for all areas combined, as wellas for all individual areas by number, and all areas by weight except Core Sound (Table 27).The composition <strong>of</strong> finfish in the bycatch varied by area, with Atlantic croaker, spot, andweakfish accounting for 53% <strong>of</strong> the total catch by number and 56% by weight in Pamlico Sound.In Core Sound, pigfish, spot, and Atlantic croaker were the most abundant finfish species interms <strong>of</strong> number and weight. Star drum, weakfish, and Atlantic croaker were the most abundantspecies in the Cape Fear River.Johnson (2003) quantified the catch <strong>of</strong> shrimp trawlers working in Core Sound (n=46tows) and the Neuse River (n=8 tows) during the summers <strong>of</strong> 1999 and 2000. Overall, bluecrabs accounted for 26% by weight <strong>of</strong> the total combined catch (Table 28). Spot accounted for17% <strong>of</strong> the total catch and 40% <strong>of</strong> the total finfish bycatch (Table 29). Core Sound catcheswere dominated by invertebrates, crabs, and shrimp, which accounted for 71% <strong>of</strong> the total catch(Table 28). Three species <strong>of</strong> finfish; spot (48%), Atlantic croaker (13%), and pinfish (12%)accounted for 73% <strong>of</strong> the finfish bycatch from this area (Table 29). In the Neuse River,invertebrates made up 24% <strong>of</strong> the sampled catches (Table 28). Atlantic croaker (44%), andspot (33%) accounted for 77% <strong>of</strong> the finfish bycatch (Table 29).In 1950 sampling was conducted aboard commercial shrimp trawlers working in Coreand Pamlico sounds (Roel<strong>of</strong>s 1950). Although only total weights were reported for shrimp andfinfish, Roel<strong>of</strong>s (1950) indicated that for Core Sound “85 to 90% <strong>of</strong> the fish taken were croakersand spot, with croaker predominating; while in late August, hogfish, pinfish and other trashspecies increased until they made up over 50 per cent <strong>of</strong> the catch”. Seven tows were sampledin Pamlico Sound during September <strong>of</strong> 1950. Atlantic croaker comprised 73% <strong>of</strong> the finfishtaken, with spot and trout each accounting for 10% (Roel<strong>of</strong>s 1950).Numerous gear evaluation studies have been conducted in North Carolina waters(McKenna and Monaghan 1993; Coale et al. 1994; Murray et al. 1995; and McKenna et al.1996). However, this data should not be used for characterization analysis since these studiesare <strong>of</strong>ten relegated to times <strong>of</strong> low shrimp catch rates, and as such, the bycatch data are notrepresentative <strong>of</strong> times when shrimp catch rates are higher. For example the fish to shrimp rati<strong>of</strong>or gear studies conducted in 1994 (McKenna et al. 1996) was 5.5 to 1, while characterizationstudies conducted in 1995 by Diamond-Tissue (1999) found the fish to shrimp ratio to be 1.6 to1. While these data should not be used for characterization analysis, catches can provideinformation on species and sizes <strong>of</strong> species vulnerable to shrimp trawls. In a 1949 shrimp trawltailbag mesh study conducted in Pamlico Sound 24 species <strong>of</strong> fish were observed in thecatches (Roel<strong>of</strong>s 1950). Three species, Atlantic croaker (69%), spot (21%), and sea trout (4%)147
made up 94% <strong>of</strong> the finfish bycatch by number (Roel<strong>of</strong>s 1950). Diamond-Tissue (1999) datashows that these three species still make up the bulk <strong>of</strong> the finfish bycatch in this area (Table26).One way <strong>of</strong> presenting and expanding bycatch data is by using the ratio <strong>of</strong> finfish toshrimp (F:S). For the Gulf <strong>of</strong> Mexico the finfish to shrimp ratio was 5.3:1, and for the SouthAtlantic it was 4.5:1 (Nance 1998). Reported F:S ratios for North Carolina are 1.5:1 (Roel<strong>of</strong>s1950), 1.6:1 (Diamond-Tissue 1999) and 1.2 to 1 (Johnson 2003). However, Diamond-Tissue(1999) demonstrated the need for a standard protocol for bycatch estimations. Expansiontechniques based on either the F:S ratio or the average species weight per tow (CPUE) resultedin bycatch estimates that differed greatly and were not consistent among areas or species.Estimated bycatch and coefficients <strong>of</strong> variation were generally greater with the F:S method thanwith the CPUE method, but both techniques produced estimates with large confidence intervalswhen sample sizes were small. Using known trip ticket shrimp landings as a check <strong>of</strong> potentialbias, the CPUE method produced an overestimate <strong>of</strong> about 25%. Peuser (1996) indicates that,in spite <strong>of</strong> greatly increased observer sampling and analytical effort, problems such as varyingtrip definitions and small sample sizes continue to hamper efforts to precisely estimate themagnitude <strong>of</strong> bycatch. Before bycatch estimates can be used in stock assessments, it isnecessary to convert total numbers to numbers at age and to expand estimates from knownstrata to unknown strata so that the entire fishing area is encompassed.The Diamond-Tissue (1999) characterization study is the most extensive evaluation <strong>of</strong>bycatch in a North Carolina fishery. For the sole purpose <strong>of</strong> comparing methodology, bycatchquantities were estimated for each area and the total state for selected species. However,limited sample sizes and incomplete strata coverage resulted in excessive confidence intervalsthat prevent meaningful interpretation <strong>of</strong> the overall bycatch estimates. Diamond-Tissueconcluded that the best way to obtain unbiased estimates <strong>of</strong> bycatch is through an observerprogram based on randomly observed trips. A stratified random sampling design based on fivegeographic regions and four shrimp seasons would be optimal. Based on initial estimates <strong>of</strong>variance, a minimum <strong>of</strong> 60 trips per strata is needed to narrow the confidence intervals to onehalf<strong>of</strong> their current range.Biological Implications <strong>of</strong> BycatchEvaluating the biological impacts <strong>of</strong> bycatch is a two stage process. First, the bycatchmust be characterized in both magnitude and nature. Second, information obtained fromcharacterization efforts must be applied to population and ecosystem models to evaluatepotential impacts at those levels. Although, by definition, bycatch can include both incidentaland discarded catch, much <strong>of</strong> the current concern is directed toward discarded animals. Thisconcern is largely due to a general perception that discarded bycatch is a waste <strong>of</strong> naturalresources and leads to overfishing (Crowder and Murawski 1998). Beyond the obvious impactson discarded individuals, there are also potential population and ecosystem level effects(Alverson et al. 1994, Crowder and Murawski 1998). Kept bycatch has biological impacts also,but since it is accounted for as catch such impacts are encompassed in harvest strategies.The first phase <strong>of</strong> characterization starts at the level <strong>of</strong> an individual animal. Discardedindividuals suffer one <strong>of</strong> two immediate alternative fates: survival or death. Further, initialsurvival may still lead to chronic effects, such as delayed mortality, reduced growth, andinterrupted maturation. Discarded animals are also vulnerable to increased predation, asshown by numerous observations <strong>of</strong> live discarded animals being preyed upon by birds, marinemammals, and finfishes. If this initial predation is avoided, the animals must still seek shelter148
and return to their normal environments, all the while exposed to the risk <strong>of</strong> predation (Murawski1995).While discarding is generally thought <strong>of</strong> in an active sense, most fishing gears aredesigned to provide some degree <strong>of</strong> passive discarding. In trawling, mesh sizes are selected bychoice or mandated by regulation to prevent the harvest <strong>of</strong> small sized animals and it isgenerally assumed that animals escaping through the mesh survive. But the possibility remainsthat not all survive, resulting in some level <strong>of</strong> unobserved mortality. This unobserved mortality isa difficult issue for both managers and scientists because, if it occurs, the actual reduction inbycatch and thus mortality is lessened (Chopin and Arimoto 1995). Furthermore, since gearescapees can not be counted by conventional fishery observer programs, they cannot bemonitored or included in stock assessment calculations. Chopin and Arimoto (1995) suggestthat escapee mortality should be considered if gear-based measures are used as a primarymanagement tool.When viewed at the population level, the first instinct <strong>of</strong> many observers is to assumethat discarding adversely impacts populations or stocks. Such ideas lead to the widely heldbelief that discarding, especially when the magnitude in pounds or numbers is large, contributesto overfishing and the decline <strong>of</strong> many stocks. Unfortunately, few hypothesis about populationlevelimpacts have been tested (Crowder and Murawski 1998). Regardless, just as large levels<strong>of</strong> discarding do not necessarily lead to significant biological impacts, it can not be assumed thatminimal discarding has only minor effects (Alverson et al. 1994). Discard impacts can only bedetermined through proper data collection and analytical investigations. Studies conducted todatesuggest that discarding has harmed some stocks, while others seem unaffected. Forexample, discarding has been implicated in the decline <strong>of</strong> Gulf <strong>of</strong> Maine groundfish, Atlanticcroaker in the Gulf <strong>of</strong> Mexico, and scup and black seabass in the Mid-Atlantic (Alverson et al.1994, ASMFC 1996a, ASMFC 1996b). Conversely, sizable discarding <strong>of</strong> redfish in theNorthwest Atlantic and pollock, cod, and sablefish in the Northeast Pacific represents only afraction <strong>of</strong> the total mortality <strong>of</strong> these species and is not believed to have a significant adverseimpact on population abundance (Alverson et al. 1994).The magnitude <strong>of</strong> discarding should not be the only concern when examining populationlevelimpacts such effects are also related to the size or life-stage <strong>of</strong> the discarded animal. Ifdiscards are immature or below the size for optimum yield, both yield-per-recruit and spawningpotential may be adversely impacted (Crowder and Murawski 1998). In other words, it iscommonly known that harvesting fish before they mature and spawn can lead to recruitmentoverfishing and can impair a stock’s ability to sustain itself. Also, harvesting a fish before itreaches some optimal size can lead to growth overfishing and reduced overall yield from thefishery. These principles are unavoidable consequences <strong>of</strong> exploitation that can occur whetherthe fish are harvested or discarded. According to Amendment 3 to the weakfish <strong>FMP</strong>, discardlosses in the South Atlantic shrimp trawl fishery significantly increased mortality <strong>of</strong> age 0 and 1weakfish, and both yield and spawning potential could be increased if these age classes wereprotected (ASMFC 1996c).In addition to impacts on individuals and populations, it is suspected that discarding canalso alter entire communities. Community effects are still largely unknown, but in theory theycould be significant. For instance, if an abundant species that dominates a community isremoved by harvest while another species is discarded and survives, the community couldeventually change to the extent that the discarded species becomes the dominant species inthe ecosystem (Murawski 1995). If the newly dominant species is <strong>of</strong> less value, eitherecologically or economically, both the ecosystem and the fishing economy could suffer. It is149
thought that such species-specific exploitation could be more damaging to the productivity <strong>of</strong> anecosystem than exploitation <strong>of</strong> the entire community. However, such effects remain largelyspeculative as there has been little research on community-level effects.Bycatch Impacts on Stock Assessment and PredictionAny population is a dynamic entity that will fluctuate in abundance as members enterand members leave. In a simplified example <strong>of</strong> a fish population, the entering members (orrecruits) are the fish born each year and the leaving members are those removed by naturalmortality and harvest (or catch). However, as indicated previously, bycatch can result in largelyunknown levels <strong>of</strong> additional removals from the population. Most quantitative stock assessmenttechniques involve statistical analysis <strong>of</strong> catch data and, thus, require an accurate record <strong>of</strong> theentire catch to reliably estimate stock parameters such as recruitment, abundance, andselectivity. Since these parameters are crucial to forecasts <strong>of</strong> future stock conditions, any erroror bias in them will lead to additional uncertainty in the predictions.Very little discard information was available in the past, so it was <strong>of</strong>ten assumed thatdiscarding was a constant that could be largely ignored without causing any serious bias inassessment results (Murawski 1995). This trend is changing with the availability <strong>of</strong> additionalresearch suggesting that while discarding may be constant in some fisheries, it is quite variablein many others. The challenge now lies in determining whether the additional precision gainedby including discard losses justifies the expense and effort <strong>of</strong> collecting the data (Alverson et al.1994). Since the impacts <strong>of</strong> overlooked bycatch on assessment results will vary from fishery t<strong>of</strong>ishery, each case must be evaluated separately, and at least some characteristics <strong>of</strong> thebycatch must be determined.In the most basic sense, discarded bycatch causes an underestimate <strong>of</strong> the total catchand evaluating how an assessment model responds to such an underestimate is fairly simple. Itis known that responses vary among analytical techniques and depend on such factors as theage distribution <strong>of</strong> the discarded fish, the magnitude <strong>of</strong> harvest to discards, the variability andpredictability <strong>of</strong> discard rates, relative year class strength, and the exploitation patterns <strong>of</strong> theinvolved fisheries (Alverson et al. 1994; Murawski 1995). Much <strong>of</strong> this knowledge is intuitive,and stems from understanding the interactions between input data (catch) and model outputssuch as stock size and fishing mortality. Still lacking at this time are adequate bycatchestimates that could support the transition from generalized to quantitative responses. Forexample, if the discarded bycatch is composed <strong>of</strong> young fish, and the actual removal <strong>of</strong> youngfish from the population is more than that indicated by the available data then this portion <strong>of</strong> thetotal catch is underestimated. How does this affect perceptions <strong>of</strong> stock status? In generalizedterms, omitting the discard data from the analysis will underestimate recruitment and, to a lesserextent, mortality rates at age. If the discarded bycatch is older fish, both numbers at age andrecruitment will be underestimated and thus overall stock biomass will be underestimated aswell. Quantitative responses are desirable and certainly feasible, but they require someestimate <strong>of</strong> the magnitude <strong>of</strong> the discarded bycatch.Just as with stock status estimates, how discards will affect stock predictions dependson several factors, including the type <strong>of</strong> predictions being considered, variability andpredictability <strong>of</strong> discard characteristics, and fishery selectivity (Alverson et al. 1994). In allsituations, if discard rates can not be predicted, then the fishery predictions will containadditional error. Short-term yield forecasts are robust if discarding and fishery selectivity areconstant and predictable, but if discarding represents varying proportions <strong>of</strong> the total catch,these predictions may be impacted significantly. The impact will likely be expressed as150
additional uncertainty rather than as a bias (Alverson et al. 1994, Murawski 1995). According toAlverson (1994) and Murawski (1995), long-term forecasts such as equilibrium yield andspawning biomass per recruit analyses require inclusion <strong>of</strong> all sources <strong>of</strong> mortality and thus arevery sensitive to discard effects. Even constant discard rates influence long-term predictionswhen the exploitation pattern <strong>of</strong> a fishery changes, a point that can have importantconsequences when contemplating changes in size or mesh restrictions.The lack <strong>of</strong> reliable discard estimates has not stopped researchers from investigatingassessment impacts, but it has prevented increases in precision. Exploration <strong>of</strong> such sourcesas the SEAMAP database and the NMFS vessel logbook entries has provided a wide range <strong>of</strong>discard estimates for a number <strong>of</strong> fish stocks. Most assessments address the range <strong>of</strong> bycatchestimates through sensitivity analyses by comparing basic assessment results over the range <strong>of</strong>bycatch estimates and assumptions. Those preparing or reviewing the estimates must decidewhich scenario seems most likely. If none <strong>of</strong> the results seem plausible, the assessment mayproceed without the bycatch estimates included but with the caveat that results may be biasedor contain additional uncertainty due to unknown levels <strong>of</strong> missing catch.Unlike in the past, it is no longer acceptable to assume discards represent anunimportant removal from a stock. Under certain circumstances, discarding can and doesimpose uncertainty and potential bias on both estimates <strong>of</strong> current stock status and predictions<strong>of</strong> future stock conditions. This bias and error can make proper management even moredifficult. While qualitative analyses <strong>of</strong> discard impacts are readily available at this time,providing the quantitative estimates that are necessary to improving stock assessments willrequire significant additional research and monitoring. Further, due to the extreme variation <strong>of</strong>discard characteristics, such efforts must be directed to specific fisheries and areas and mustrepresent a long-term commitment.Assessments <strong>of</strong> Target and Non-target SpeciesTarget Species:<strong>Shrimp</strong> StatusAll three species <strong>of</strong> shrimp are essentially annual crops. Population size is regulated byenvironmental conditions. While fishing reduces the population size over the season, fishing isnot believed to have any impact on subsequent year class strength unless the spawning stockhas been reduced below some unknown minimum threshold level by unfavorable environmentalconditions. Estimates <strong>of</strong> population size are not available, but since the fishery is considered tooperate at or near maximum levels, annual landings are probably a good indication <strong>of</strong> relativeabundance. Annual variations in catch are presumed to be due to a combination <strong>of</strong> prevailingenvironmental conditions and fishing effort.Because <strong>of</strong> high fecundity and migratory behavior, the three shrimp species are allcapable <strong>of</strong> rebounding from a very low population size in one year to a large population size inthe next, provided environmental conditions are favorable. Landings over the last thirty or fortyyears have remained fairly stable while fishing pressure has increased dramatically.Fluctuations in abundance resulting from changes in environmental conditions will continue tooccur. Perhaps the most serious threat to the stocks is loss <strong>of</strong> habitat due to pollution orphysical alteration. Especially vulnerable and critical to shrimp production is the salt marsh (forwhite and brown shrimp) and estuarine seagrass habitat (especially for pink shrimp) whichcomprise the nursery areas for juvenile shrimp. In general, shrimp stocks <strong>of</strong> all three species in151
North Carolina are considered healthy.Non-Target Species:Although many species are caught as bycatch in the estuarine shrimp trawl fishery, fourspecies, blue crab, Atlantic croaker, spot, and weakfish have, since the first studies wereconducted in the 1950s and continuing to the present, accounted for the bulk <strong>of</strong> the bycatch.The bycatch <strong>of</strong> southern flounder (Paralichthys lethostigma) is <strong>of</strong> concern due to it’s overfishedstatus. Because these five species and many other species <strong>of</strong> commercially and recreationallyimportant finfish spend a portion <strong>of</strong> their lives in estuarine waters, bycatch in North Carolina’sestuarine shrimp trawl fisheries, mainly ages 0 and 1, may have the potential to impact thestocks <strong>of</strong> these species. Natural mortality at these stages is high; however, it is believed thatbycatch may adversely increase overall mortality potential. Possible impacts from thisincreased mortality include reducing spawning stock potential and reduced yields to thefisheries (West et al.1994). Due to the magnitude <strong>of</strong> the bycatch <strong>of</strong> these species and theirimportance to other commercial and recreational fisheries, a brief summary <strong>of</strong> their stock statusis presented below.Blue Crab StatusSignificantly reduced landings <strong>of</strong> hard blue crabs during 2000 - 2002, following thehistorically record high landings observed during 1996 - 1999, has caused increased industryconcern for the health <strong>of</strong> the resource and fishery. NC State University (NCSU) researchershave estimated maximum sustainable yield (MSY) for blue crabs to be between 38 and 46million pounds per year (Eggleston et al. 2004). However, it is felt that these MSY estimates arenot valid based on data and modeling limitations and the significant influence <strong>of</strong> environmentalvariables on the population. Because <strong>of</strong> data and modeling limitations, the MSY estimatesshould be used as a guideline to the long-term potential <strong>of</strong> the fishery rather than as stricttargets. The model results do indicate that the blue crab stock is currently at a low biomasslevel and current fishing pressure exceeds that required to produce MSY, leading to reducedyield (Eggleston et al. 2004). None <strong>of</strong> the assessment results suggest that the high landingsfrom the late 1990s would be sustainable. Stock size may be influenced by a number <strong>of</strong> factors,including habitat availability, natural events and cycles, harvest pressure, changes in streamflows, and water quality. Preliminary examination <strong>of</strong> fishery-independent catch-per-unit-effortdata (1978-2003) for juveniles (crabs less than 121 mm carapace width) suggests that, despitevariability in abundance, there is no general downward or upward trend in recruitment. Thesedata indicate that a cautionary approach must be taken in the management <strong>of</strong> this species.The bycatch <strong>of</strong> blue crabs in the shrimp trawl fishery is <strong>of</strong> concern due to the mortality(immediate and delayed) and physical injury <strong>of</strong> culled individuals. In a study <strong>of</strong> post-harvestmortality and physical injury to trawl and pot-caught crabs, McKenna and Camp (1992) foundthe incidence <strong>of</strong> physical injury to those crabs was similar; that is, the appendages were themost frequently damaged area. The chelipeds (pincher appendages) were the most frequentlydamaged appendage for both gear types; crab pot-crabs showed a greater loss than did trawlcaughtcrabs, 52% and 33%, respectfully. There were no differences between the survival rates<strong>of</strong> damaged crabs and undamaged crabs. These findings are in agreement with those <strong>of</strong> Smithand Howell (1987), who found the appendages were the most frequently damaged structure inpot and trawl-caught American lobsters in Long Island Sound, N.Y. Additionally, Wassenbergand Hill (1989) found that 99% <strong>of</strong> the trawl-induced damage to sand crabs was restricted to theappendages.152
The only observed cases <strong>of</strong> immediate mortality in crab-trawl-caught crabs occurred inJune (McKenna and Camp 1992). During this trip, a large number <strong>of</strong> paper shell and s<strong>of</strong>t crabswere killed in the trawling process. These findings agree with those <strong>of</strong> other investigators wh<strong>of</strong>ound that immediate mortality in trawl-caught crustaceans was almost entirely limited to s<strong>of</strong>t orpaper stage individuals (Smith and Howell 1987; Wassenberg and Hill 1989).Factors affecting the level <strong>of</strong> delayed mortality in crustaceans are temperature, exposuretime, amount and level <strong>of</strong> physical injury, and total catch biomass (Smith and Howell 1987;Wassenberg and Hill 1989). Overall survival rates for trawl-caught crabs was 64%, while 93%<strong>of</strong> the crab-pot crabs survived (McKenna and Camp 1992). The effects <strong>of</strong> temperature werereadily apparent; survival rates for trawl-caught crabs during the winter months were 74%, whilethe individuals caught in June had a 20% survival rate.Weakfish StatusThe <strong>FMP</strong> for weakfish was adopted in 1985 by the ASMFC. The <strong>FMP</strong> was amended in1991, 1994, 1996, and most recently by Amendment #4 in 2002. The Weakfish ManagementBoard <strong>of</strong> the ASMFC oversees development <strong>of</strong> the plan. Weakfish are a major component <strong>of</strong>the haul seine, flynet, pound net, gill net, and hook and line fisheries from New York throughNorth Carolina. A quantitative stock assessment through 1998 was conducted by the WeakfishTechnical Committee and was favorably reviewed by the Stock Assessment ReviewCommittees in Wood's Hole, Massachusetts. This assessment suggests that the targetreduction in fishing mortality rate has been achieved and that the age structure <strong>of</strong> the populationis improving. Amendment #4 to the <strong>FMP</strong> is designed to manage the recovered fishery andsimilar to Amendment #3 has specific restrictions including: Bycatch Reduction Devices forshrimp trawls and escape panels in long haul seines, 12 inch commercial minimum size limit forall but estuarine pound net and long haul seine fisheries (seasonal 10 inch size limit), minimummesh sizes for gill nets and trawls, and a recreational bag and size limit (currently 7 fish at 12inches). In addition, North Carolina is still required to maintain a closure <strong>of</strong> the area south <strong>of</strong>Cape Hatteras to flynets. One major change in Amendment #4 was an increase in the bycatchallowance for commercial fisheries from 150 pounds to 300 pounds provided that there is atleast equal poundage <strong>of</strong> other species on board the vessel. In North Carolina this bycatchprovision applies to gears used that do not meet the minimum mesh size requirements <strong>of</strong>Amendment #4 designed to prevent weakfish bycatch.The 1996 stock assessment for weakfish represents one <strong>of</strong> the few examples <strong>of</strong> use <strong>of</strong>specific bycatch information in the stock assessment process. Vaughan et al. (1991) rananalyses based on different multipliers (0.0, 0.25, 0.50, 1.0) <strong>of</strong> weakfish to shrimp landings.They made the assumption that bycatch was proportional to shrimp landings and that this ratiowas constant over time. However, these proportions are variable depending on location andtime <strong>of</strong> year. Generally, weakfish to shrimp ratios in weight appear to range from 0.1:1 to 0.5:1.Based on Vaughan et al. (1991), VPAs for 1982-1987 with natural mortality M=0.3 andwithout bycatch estimates, fishing mortality estimates (F) for age 0 were very small (around.015), while those for age 1 were much larger and increasing. However, estimates <strong>of</strong> fishingmortality at age-0 and age-1 increased values with increasing bycatch multipliers. For example,at the lowest bycatch multiplier (.25) the estimate <strong>of</strong> F age ranged from 0.3 to 0.7, a much highervalue than the F=.015 in the initial analysis. Initial yield-per-recruit estimates without bycatchshowed almost no gain from raising the age at entry from age 0.25 to 1, but moderate gainsfrom age 1 to age 2 and from age 2 to age 3. However, when the bycatch multipliers enteredthe analysis, a significant reduction in estimated yield-per-recruit was found, and a significant153
gain was demonstrated from raising the age at entry from age 0 to age 1 and from age 1 to age2. There were moderate gains from raising the age at entry from age 2 to age 3. Maximumspawning stock potential (without bycatch) showed small declines, but when the bycatchmultipliers were introduced, significant reductions were estimated. The 0.25 multiplier showed asmall but significant gain in spawning stock potential when the age at entry was raised from age0 to age 1 and even higher gains from increasing the age at entry to age 2.The assumptions made in Vaughn et al. (1991) created the effect that trends in weakfishdiscards reflected shrimp harvest, in other words, the more shrimp caught, the more weakfishdiscarded. Another assumption that may be applied to weakfish stock estimates is to considerbycatch <strong>of</strong> weakfish as a function <strong>of</strong> weakfish abundance and shrimp fishing effort, but notshrimp catch. Gibson (1994) used shrimp trawl effort rather than shrimp catch and producednew estimates <strong>of</strong> weakfish bycatch in the shrimp trawl fishery. Gibson (1994) found nearly 90%<strong>of</strong> weakfish discards were age-0 fish; however, these estimates were imprecise. Discardnumbers were 50% higher on average compared to a later assessment by Vaughan (1994 inGibson 1994) showing opposite trends. Fishing mortality rates were slightly higher thanVaughan’s method and agreed with the trends in spawning stock biomass and the decline inrecruitment strength. Though these estimates are still uncertain, they may be sounder than pastassessments.Weakfish are managed under this plan as a single stock throughout their coastal range.All states from Massachusetts to Florida and the Potomac River <strong>Fisheries</strong> Commission have adeclared interest in the Weakfish <strong>FMP</strong>. Responsibility for the <strong>FMP</strong> is assigned to the ASMFCWeakfish Management Board, Plan Review Team, Technical Committee, Stock AssessmentSub-Committee and Advisory Panel.Based on data through 2000, weakfish are currently not overfished with fishing mortalitybelow the target and SSB above the target. A new assessment is currently under developmentand will include data through 2003.A weakfish stock assessment <strong>of</strong> data through 1998 was conducted in 1999 andreviewed by the Stock Assessment Review Committee for peer review at the 30 th NortheastRegional Stock Assessment Workshop (NMFS 2000). This report indicated that weakfish were“at a high level <strong>of</strong> abundance and subject to low fishing mortality rates.” This assessment wasupdated in 2002 with data through 2000. Much <strong>of</strong> the language below was taken from thisupdated assessment (Kahn 2002).Virtual population analysis was used to estimate fishing mortality and stock size (ADAPTVPA in FACT, Northeast Fishery Science Center; Gavaris 1988; Conser and Powers 1990).This is a type <strong>of</strong> analysis that uses data on the number <strong>of</strong> fish caught at various ages or lengthsto estimate fishing mortality as well as numbers <strong>of</strong> spawning individuals in a population. Themost recent stock assessment update conducted with data through 2000 indicates that themanagement measures put in place in Amendment 3 resulted in positive trends for the weakfishpopulation. The absolute magnitude <strong>of</strong> impact should be viewed with caution given theuncertainty <strong>of</strong> the fishing mortality and spawning stock biomass estimates for the most recentyear <strong>of</strong> the assessment, which is <strong>of</strong>ten the case with these final year estimates. Once moredata is added to the assessment the fishing mortality is expected to rise and the spawning stockbiomass is expected to decrease.This assessment indicates that weakfish are at a high level <strong>of</strong> abundance and fishingmortality appears to be low. Recent history <strong>of</strong> the coast-wide stock shows that spawning stock154
iomass (total weight <strong>of</strong> fish in a stock that are old enough to spawn) estimates were low from1982 through 1985. High recruitment <strong>of</strong> age one weakfish in 1985-1987 produced a briefincrease in biomass. By 1989, biomass had again declined and remained low through 1993.Since then, biomass has been building to higher levels. While the exact level <strong>of</strong> bias in themost recent estimates is unknown, the current level <strong>of</strong> SSB is well above the threshold level inAmendment 4 <strong>of</strong> 14,400 MT.Estimates <strong>of</strong> fishing mortality (the rate fish are being removed by human activity) rangefrom a high in 1994 <strong>of</strong> 2.52 to a low <strong>of</strong> in 2000 <strong>of</strong> 0.12. Since 1995, estimates <strong>of</strong> F have beenbelow the Amendment 3 target <strong>of</strong> 0.50. The 2000 estimate <strong>of</strong> 0.12 could be underestimated.Despite this bias, the corrected value would still be below the fishing mortality target <strong>of</strong> 0.31 inAmendment 4 and far below the proposed fishing mortality threshold <strong>of</strong> 0.50. In 1982, theestimate <strong>of</strong> the proportion <strong>of</strong> age 6+ fish was 1.0% <strong>of</strong> the total. By 1990, this had shrunk to only0.3% <strong>of</strong> the total number <strong>of</strong> weakfish. This proportion has been increasing in recent years tothe level <strong>of</strong> 6.8% <strong>of</strong> the total in 2001.Atlantic Croaker StatusThe Atlantic croaker stock status was upgraded to viable in 2004 (Stock Status 2004).The CPUEs for Atlantic croaker increased greatly in the ocean trawl and sink gill net fisheries,and the size and age distributions shifted to older, larger fish. Some <strong>of</strong> the increase isattributable to increased fishing effort on Atlantic croaker in the ocean because <strong>of</strong> harvestrestrictions placed on weakfish during this period. Comparable increases did not take place inthe estuarine long haul seine and sciaenid pound net fisheries, which continue to show adecline in the harvest <strong>of</strong> Atlantic croaker. Reduced landings <strong>of</strong> Atlantic croaker in estuarinewaters may be due, in part, to changes in the traditional estuarine fisheries in response toweakfish size limits imposed during 1992. However, the decreases could also signal someenvironmental or other problems affecting the estuarine system. The magnitude <strong>of</strong> the catchesin the ocean has caused the overall commercial CPUE to rise incrementally since 1992. Asignificant upward trend was not seen in the recreational harvest, which is primarily an estuarinefishery.The peer-reviewed stock assessment was completed by ASMFC Technical Committeeand accepted by the South Atlantic State/Federal <strong>Fisheries</strong> Management Board in August 2004(ASMFC 2003 and ASMFC 2004). The development <strong>of</strong> Amendment 1 will begin in October2004 to incorporate the information from the latest stock assessment and peer review, andrevise the plan to comply with the mandate <strong>of</strong> the Atlantic Coastal <strong>Fisheries</strong> CooperativeManagement Act. It was determined the stock is not overfished and overfishing is not occurringin the Mid-Atlantic region (North Carolina and north). The stock assessment shows both fishingmortality and spawning stock biomass for the Mid-Atlantic region exhibiting a cyclical trend overthe time series. The Atlantic croaker stock status for the South Atlantic region (South Carolinaand south) is unknown at this time. The South Atlantic region makes up a relatively smallcomponent <strong>of</strong> the total stock biomass. Recent fishing pressure (2002) is below the target MSYand the spawning stock biomass is well above the target level. <strong>Shrimp</strong> trawl bycatch was notincluded in the final model due to the uncertainty <strong>of</strong> the bycatch data. Model runs werecompleted including shrimp trawl bycatch to show the effects this fishery has on the stock evenwith the limited data. Sensitivity analysis evaluating the inclusion and non-inclusion <strong>of</strong> shrimpbycatch estimates, indicate that SSB msy estimates are sensitive to the inclusion <strong>of</strong> Atlanticcroaker caught as shrimp bycatch. However, increased SSB msy estimates are alsoaccompanied by higher total SSB estimates. The ratio <strong>of</strong> SSB 2002 :SSB msy when preliminaryestimates <strong>of</strong> shrimp bycatch is included indicates that the stock is unlikely to be below the155
threshold estimates. Also, biomass reference points from the simulation runs including shrimptrawl bycatch indicated higher SSB msy values and the lower estimates <strong>of</strong> SSB 2002 :SSB msy thanthose obtained for the base model. The range <strong>of</strong> estimates for F msy (~0.4) was similar to thebase model (~ 0.39). SSB msy estimates from the simulation ranged from 48,000-67,000 MT witha median <strong>of</strong> 56,467 MT and were much higher than those for the base run (28,932 MT).Diamond-Tissue (1999b) showed that by separating Atlantic croaker into different lifehistory stages, she could examine the effects on the population <strong>of</strong> mortality at different lifestages. This approach provides some insight into population changes that may be caused bybycatch. She used a stage-within age based matrix model. In this type <strong>of</strong> model, a stagebasedmodel <strong>of</strong> the first year <strong>of</strong> life was combined with an age-based model <strong>of</strong> adults. The firstyear (age 0) was divided into six stages separated by biologically significant events based onmajor changes <strong>of</strong> morphology or habitat. Within each life stage model, she examined thepopulation growth rate, the stable age distribution, and the elasticity (sensitivity) <strong>of</strong> thepopulation to increases and decreases <strong>of</strong> mortality in each life stage. In order to determineelasticity <strong>of</strong> the population, baseline matrices were constructed from published and unpublisheddata on the life history <strong>of</strong> Atlantic croaker. Of all the data examined, only late-stage juvenile andadult mortality rates were shown to be affected anthropomorphically (fishing mortality). Shethen examined the trade-<strong>of</strong>fs between regulating directed fisheries for adults and regulatingfisheries that cause mortality on late juveniles. These simulations varied mortality from thebaseline values established from data in the literature.In the Atlantic and the Gulf <strong>of</strong> Mexico areas, the baseline model showed 99% <strong>of</strong> thepopulation to be in the first year <strong>of</strong> life. The elasticity analyses showed that croaker were moresensitive to survival during age 0 than other age classes. In both regions, croaker were moresensitive to changes in fertility <strong>of</strong> age-1 fish (the age <strong>of</strong> first full reproduction) than fertility in anyother year. In the analyses <strong>of</strong> other life stages, the south Atlantic population was more sensitiveto fecundity than the Gulf population, but both populations were most sensitive to mortality in theoceanic larval stage than in any other stage.By altering the late stage juvenile mortality from 10% to 200% <strong>of</strong> the baseline rate whilekeeping adult mortality constant, Gulf population growth rates decreased. Changing the adultmortality rates yielded similar effects. If juvenile or adult mortality was decreased, populationgrowth rates increased. In the south Atlantic, the model was much more reactive to change. Asin the Gulf, changing the mortality rate from 10% to 200% <strong>of</strong> the baseline caused populationgrowth rates to decrease. Changing the adult mortality rate had a much larger effect onpopulation growth rates.Diamond-Tissue’s (1999b) model results indicate that bycatch mortality at the estimatedlevels is not the most important factor affecting Atlantic croaker populations in the Gulf <strong>of</strong>Mexico or in the south Atlantic areas, although it can have a large negative impact onpopulation growth rates. Both populations were most sensitive to mortality during the ocean’slarval stage, followed by mortality <strong>of</strong> estuarine larvae and adults in the Gulf, and by earlyjuvenile and adult mortality in the Atlantic. Bycatch mortality would have to be 2.5 times higherin the Gulf <strong>of</strong> Mexico and about 3.5 times higher in the south Atlantic for bycatch mortality to bethe most important factor affecting population growth rate. Simulations showed that reducinglate juvenile mortality by 1% and adult mortality by 3% <strong>of</strong> the baseline would stabilize theAtlantic population.156
Spot StatusA formal coastwise spot stock assessment has not been conducted. The DMF hasclassified the status <strong>of</strong> spot stocks as viable in North Carolina (DMF 2004). The ASMFCFishery Management Plan (<strong>FMP</strong>) for spot, adopted in 1987 included the states from Delawarethrough Florida. Spot is a short-lived species and fluctuations in landings aren’t uncommon(Mercer 1987). Concerns addressed in the 1987 <strong>FMP</strong> included growth overfishing, as indicatedby the dominance <strong>of</strong> unmarketable fish being landed, especially in the shrimp trawl and flynetfisheries, but also in the sciaenid pound net and long haul seine fisheries. North Carolina hasaddressed these concerns. North Carolina has tested bycatch reduction devices in the shrimptrawl fishery and achieved finfish reductions <strong>of</strong> 50-70% with little loss <strong>of</strong> shrimp. Finfishreduction devices have been required in all shrimp trawls since the fall <strong>of</strong> 1992 (15A NCAC3J.0104) and escape panels have been required (since April 1999) in the bunt nets <strong>of</strong> long haulseines in an area south and west <strong>of</strong> Bluff Shoals in the Pamlico Sound (15A NCAC 03J.0109).The North Carolina <strong>Marine</strong> <strong>Fisheries</strong> Commission modified this rule in August 2003 to includemore specific wording on installation and placement <strong>of</strong> the culling panels. Additionally, in theNorth Carolina flynet fishery, where a large portion <strong>of</strong> the spot catch occurs, there is arequirement for a minimum tailbag mesh <strong>of</strong> 3 1/2 inch diamond or 3 inch square. Furthermore,the state <strong>of</strong> North Carolina has banned flynet fishing in waters south <strong>of</strong> Cape Hatteras. The2004 review <strong>of</strong> the spot <strong>FMP</strong> includes prioritized research and monitoring recommendations forthe Atlantic states to consider.Southern Flounder StatusBased on the 2004 stock assessment, the southern flounder stock is overfished and hasbeen for at least the past decade. North Carolina lands 96% <strong>of</strong> the southern flounder caught insoutheastern United States commercial fisheries. North Carolina landings increaseddramatically during the 1990s as they replaced summer flounder as the leading flounder landedin North Carolina. According to a draft stock assessment report, southern flounder appear to befully-to-over-exploited in North Carolina and the rest <strong>of</strong> the southeastern United States.Preliminary results indicate that the fishing mortality rate for females was close to F max , and thespawning potential ratio for females was between 15% and 20% for the years 1988 to 1997.Since the stock is comprised <strong>of</strong> primarily 1 and 2 year-old fish, stock status is dependent onannual recruitment.The southern flounder fishery is largely dependent on incoming recruitment. The 2004stock status catch-at-age indicated extremely high exploitation <strong>of</strong> age-1 and age-2 southernflounder (57% and 38% respectively), that is a concern since only 59% <strong>of</strong> age-1 and 79% <strong>of</strong>age-2 female southern flounder are sexually mature. With the addition <strong>of</strong> 1.0 million age 0-2fish from the shrimp trawl bycatch, exploitation <strong>of</strong> juvenile southern flounder is more pronounced(19%, 52%, and 26% respectively). The current fishing mortality rate for southern flounder is1.91 (representing an 85% removal rate), which retains approximately 5.4% <strong>of</strong> the maximumspawning stock biomass, well below the percentage <strong>of</strong> spawning stock necessary to sustainmost stocks. In such a suppressed stock scenario, it is unclear what specific impacts shrimptrawl bycatch has on the overall stock status <strong>of</strong> southern flounder. However, the cumulativeimpacts <strong>of</strong> low spawning stock biomass and low recruitment abundance are <strong>of</strong> concern withinthe southern flounder fishery and efforts to increase both are needed.SummaryWhile the bycatch <strong>of</strong> these species has been a concern to managers since the 1950's157
only recently has the affect <strong>of</strong> bycatch mortality been examined, and only for three species,weakfish, southern flounder, and Atlantic croaker. This is due in large part to the lack <strong>of</strong>adequate assessment data for these and most other species. The bycatch <strong>of</strong> weakfish in theshrimp trawl fishery has been identified as a major source <strong>of</strong> mortality for this species. Throughthe use <strong>of</strong> BRD’s and other management measures this mortality has been reduced and thestock is showing signs <strong>of</strong> improvement. The bycatch mortality <strong>of</strong> Atlantic croaker may need tobe 3.5 times higher to be the most important factor affecting population growth rate for thisspecies. It is unclear what specific impacts shrimp trawl bycatch has on the overall stock status<strong>of</strong> southern flounder given this species suppressed stock scenario. These analyses show theimportance <strong>of</strong> combining adequate assessment data with the appropriate managementmeasures to insure healthy stocks.Obtaining unbiased and precise estimates <strong>of</strong> bycatch clearly represents a significanttechnical and financial challenge. However, for many target and non-target trawl species, thesedata may be critical to determining exploitation status and the effectiveness <strong>of</strong> managementmeasures. The importance <strong>of</strong> discard estimates to a given species will depend on themagnitude <strong>of</strong> the discards, the fraction <strong>of</strong> the total catch represented by discards, and thevariability in discard losses over time (Murawski 1995). Because <strong>of</strong> the unique nature <strong>of</strong> NorthCarolina’s estuarine habitats and the fact that bycatch rates vary by fishery, season, and area,North Carolina can not depend on research efforts <strong>of</strong> the NMFS or other states in addressingbycatch losses.While the effect that shrimp trawl bycatch has on finfish stocks is unknown, the reductionor elimination <strong>of</strong> the bycatch has a number <strong>of</strong> important implications. The reduction <strong>of</strong> fishingmortality on juvenile finfish stocks might result in more individuals recruiting into the commercialand recreational fisheries. From the commercial fisherman's perspective, less time will be spentculling the catch, fuel savings might be realized due to lower biomass in the nets, and thequality <strong>of</strong> shrimp catch should be improved. Methods and management options to reducebycatch are discussed below.Gear ModificationsTailbag Mesh SizeTrawl minimum mesh size regulations are the principal method used to regulate fishingmortality on fish stocks (Smolowitz 1983). The control <strong>of</strong> net selectivity is the preferredmanagement tool in lieu <strong>of</strong> other more stringent regulations such as temporal and spatialclosures, quotas, or limited entry. The underlying principle <strong>of</strong> mesh size regulations is thatundersized fish will escape from the tailbag, survive, and become part <strong>of</strong> the future spawningbiomass. Recent studies on the survival <strong>of</strong> fish escaping from tailbags (Main and Sangster1988, J.T. DeAlteris, Univ. Rhode Island, Pers. Comm., Simpson 1990) support the use <strong>of</strong>minimum mesh sizes as a means <strong>of</strong> reducing fishing mortality on juvenile fish.In 1949 Roel<strong>of</strong>s (1950) tested three tailbag sizes (2”, 2 ¼”, and 2 ½”) in Pamlico Sound.Reduction rates were reported for spot, Atlantic croaker, and shrimp. Reduction rates for spotwere 12.2% (2”), 42.8% (2 ¼”), and 50.5% (2 ½”). Atlantic croaker reductions were 24.8% (2”),59% (2 ¼”), and 38% (2 ½”). Overall shrimp reduction rates were 5.6% (2”), 14.9% (2 ¼”), and9.2% (2 ½”). In all cases, reduction rates were influenced by the size <strong>of</strong> the fish and shrimp.The DMF conducted some preliminary tests on diamond tailbag mesh size in 1991, andsquare mesh tailbags in 2000. The two tailbags tested in 1991 were 1 5/8” stretched mesh158
(13/16” bar), and 2” stretched mesh (1” bar) tested against a 1 ½” standard stretched meshtailbag. In 2000 a 1 ½” stretched square mesh tailbag was tested against a 1 ½” stretchedmesh diamond tailbag. Results <strong>of</strong> the 1991 tests indicated that there was no apparentdifference between the catches in the control net and the 1 5/8” tailbag (Table 30). Tests withthe 2” stretched mesh tailbag did show a difference between catch rates <strong>of</strong> spot (-46%), Atlanticcroaker (-22%), total fish (-37%) and total catch [-18% (Table 31)]. However as was the casewith the 1 5/8” tailbag not enough tows were made to test for significance differences. Testsconducted in 2000 with the 1 ½” square mesh tailbag showed a significant reduction in thecatch <strong>of</strong> young <strong>of</strong> the year (YOY) weakfish (-51%), and bay wiff [-32% (Table 32)].Bycatch Reduction DevicesDuring the 1980's the DMF and NMFS conducted studies on shrimp retention rates forvarious Turtle Excluder Devices [TED's (1985 - 1986 DMF unpublished data, and 1988 - 1989NMFS unpublished data)], and started work on identifying means to reduce finfish bycatch in theshrimp trawl fishery (Pearce et al. 1988, and Holland 1988). In 1991 Amendment 1 to theWeakfish Fishery Management Plan (<strong>FMP</strong>) was adopted. This amendment recommended thatSouth Atlantic states implement programs to reduce bycatch mortality <strong>of</strong> weakfish in theirshrimp trawl fisheries by 40% by January 1, 1994. Based on results obtained duringdevelopment work in 1990 and 1991 on DMF research vessels and operational testingconducted aboard a commercial trawler in 1992, the DMF required all shrimp trawlers working instate waters to equip their nets with functional fish excluders in October 1992. However NorthCarolina was the only state that required finfish excluders. On October 20, 1994 Amendment 2<strong>of</strong> the weakfish <strong>FMP</strong> was passed. This amendment required all South Atlantic states (NC-FL) toimplement management measures to achieve the 40% reduction in bycatch <strong>of</strong> weakfish in theshrimp trawl fisheries by the start <strong>of</strong> the 1996 shrimping season.Starting in 1992 DMF staff has worked with fishermen and used its own research vesselto test many different BRD’s in a variety <strong>of</strong> waterbodies, seasons, and under various tidal andenvironmental conditions. The goal <strong>of</strong> the testing was to find devices, which maximized finfishreduction, minimized shrimp loss and meet the requirements <strong>of</strong> Amendments 1 and 2 <strong>of</strong> theweakfish <strong>FMP</strong>. Florida Fish Excluders [FFE's (Figure 1)] are currently being utilized by over80% <strong>of</strong> the shrimp trawlers in the state (close to 100% for recreational shrimpers). Theeffectiveness <strong>of</strong> this gear in reducing weakfish and other fish species is a function <strong>of</strong> the size <strong>of</strong>the FFE opening and the placement <strong>of</strong> the gear in the tailbag <strong>of</strong> the trawl. A minimum opening<strong>of</strong> 5 1/2" X 6 1/2" is required for the reduction <strong>of</strong> weakfish at the mandated level (Table 33).Placement in the tailbag is a function <strong>of</strong> the distance the gear is placed from the tailbag tie-<strong>of</strong>fand general location in the net (top, side, or bottom). The distance from the tailbag tie-<strong>of</strong>f isexpressed as a ratio, BRD length/tailbag length. Where BRD length is equal to the distancefrom the tailbag tie-<strong>of</strong>f to the opening <strong>of</strong> the FFE, and tailbag length is the length <strong>of</strong> the tailbagfrom the tie-<strong>of</strong>f rings to the beginning <strong>of</strong> the tailbag (excluding any extension). To obtain a 40%value in weakfish reduction this ratio cannot exceed 0.68 (Tables 34-36). Data collected duringthe development <strong>of</strong> FFE's indicated that maximum reduction <strong>of</strong> weakfish was obtained when theFFE was placed 15 meshes to the side <strong>of</strong> the tailbag (Tables 37 and 38).The large mesh extended funnel [LMEF (Figure 2)] is constructed from three sections <strong>of</strong>webbing. The forward piece is 62 meshes long, 120 meshes in circumference, 1 5/8" stretchmesh, #30 nylon twine. The center is made <strong>of</strong> 8" stretched mesh, 4 mm polyethylene, hung onthe square. This section is 5 meshes long and 23 meshes in circumference. The rear section issimilar to the first section except that it’s 232 meshes long. A single hoop, constructed <strong>of</strong> 1/2”diameter plastic coated towing cable is sewn into the rear section <strong>of</strong> webbing, 4 meshes aft <strong>of</strong>159
the 8" webbing. This hoop is 30" in diameter. An accelerator funnel, constructed <strong>of</strong> 1 ½”, #24depth stretched and heat set polyethylene webbing is attached to the forward section <strong>of</strong> smallwebbing. The funnel extends back past the 8" webbing and is reattached 4 meshes behind thehoop. Only 7 meshes on top and 7 meshes on the bottom are attached in the rear section. Thisdevice showed good potential in its ability to retain shrimp and exclude weakfish and other fishspecies (Table 39). Overall this gear showed a -2% reduction in shrimp weight. Significantreduction in the weight <strong>of</strong> spot (-71%), whiting (-45%), Atlantic croaker (-63%), bluefish (-32%),weakfish (-50%), and total finfish (-55%) was observed with this gear.During the summer <strong>of</strong> 1995, a series <strong>of</strong> tests with a modified large mesh funnel excluder[MLMFE (Figure 3)] was conducted using the R/V Carolina Coast. This device consists <strong>of</strong> anextension <strong>of</strong> 4" stretched mesh, #60 nylon, hung on the square (50 meshes in circumferenceand 12 meshes long. Hoops <strong>of</strong> ½” combination cable are attached to both ends <strong>of</strong> the 4"extension. An accelerator funnel made <strong>of</strong> 1 7/8" stretched mesh, #15 nylon, runs through the 4"escapement webbing into the tailbag (15 meshes beyond the escapement webbing). The aftend <strong>of</strong> the funnel is pulled tight by bungie cord attached at the top and bottom <strong>of</strong> the funnelsend. The accelerator funnel is constructed from two pieces <strong>of</strong> webbing, 49 meshes (points) atthe large end, 30 meshes long and cut on a 2 to 1 taper. The device was installed immediatelybehind the TED (mini-super shooter). <strong>Shrimp</strong> catches were reduced by 12% in the MLMEFequipped net. Significant reductions in total finfish (-24%), and total catch (-23%) weight wasalso observed. Since there was no reduction in weakfish weight, the accelerator funnel wasmodified in an attempt to increase reduction rates. The original funnel was replaced with anaccelerator funnel, constructed <strong>of</strong> ½”, #24 depth stretched and heat set polyethylene webbingcut on a 1 to 1 taper. This device was tested in Brunswick County in late August 1995.Significant reductions in the weight <strong>of</strong> weakfish (-58%), spot (-71%), and Atlantic croaker (-36%)were observed in the test net (Table 40).From 1995 through 1996 gear development work continued using state funds. Newdesigns developed by a local fisherman were examined for their ability to reduce weakfish.Designs tested were a 6" and 8" PVC excluder [“Sea Eagle” (Figure 4)]. The 6” “Sea Eagle”was tested 40 meshes above the tailbag tie-<strong>of</strong>f at the top <strong>of</strong> the tailbag. Total catch weights andreduction rates for all species collected in the control and test nets are given in Table 41. Sincethe 6” “Sea Eagle” did not meet the minimum weakfish reduction requirement, tests wereconducted with an 8” version <strong>of</strong> the device. Work with the 8” “Sea Eagle” showed that theweight <strong>of</strong> shrimp -4.77%, weakfish -57.80%, spot -53.39%, Atlantic croaker -56.70%, and totalfinfish -54.33% were significantly reduced with this gear.In 1996, the MFC approved four BRD’s for use in shrimp trawls. Proclamation SH-9-97,effective September 1, 1997, required shrimp trawlers to be equipped with one <strong>of</strong> the followingapproved designs: 1) a Florida fish excluder (FFE) measuring at least 5 1/2" x 6 1/2" (insidemeasurement) positioned no more than 19 meshes from the top centerline <strong>of</strong> the tailbag andlocated no more than 65% up from the tailbag tie-<strong>of</strong>f; 2) a large mesh funnel [8 or 10 inchesstretched mesh; 3) a modified large mesh funnel excluder; or 4) a circular excluder constructed<strong>of</strong> PVC material measuring at least eight inches in diameter, positioned no more than 15meshes from the top centerline and located no more than 38% up from the tailbag tie-<strong>of</strong>f.Although BRD testing has continued in North Carolina, by the DMF and projects fundedby NC Sea Grant <strong>Fisheries</strong> Resource Grants, and other South Atlantic states no new deviceshave been identified that meet the weakfish reduction requirements. The preferred alternativefor the certification <strong>of</strong> new BRD’s in draft Amendment #6 (2004) to the <strong>FMP</strong> for the <strong>Shrimp</strong>Fishery <strong>of</strong> the South Atlantic Region recommends that for a new BRD to be certified, it must be160
statistically shown that the device can reduce the total weight <strong>of</strong> finfish by at least 30%. Thiswill allow more flexible testing <strong>of</strong> BRD’s, and allow the South Atlantic Council to achieve anecosystem approach in fisheries management. If this new requirement is adopted there is astrong potential for new BRD’s to be developed that have greater bycatch reduction rates thenthose currently in use.When the BRD requirements were adopted by the MFC, recreational and commercialshrimpers were considered as a single group. With the passage <strong>of</strong> the RecreationalCommercial Gear License (RCGL) in 1997, recreational shrimpers are limited to a single shrimptrawl with a maximum headrope length <strong>of</strong> 26 feet and are prohibited from using mechanicalretrieval methods. When testing FFE’s, work was conducted aboard commercial trawlers withtow times <strong>of</strong> 60 minutes or longer. Since most RCGL holders have shorter tow times (20minutes or less) FFE’s placed 65% up from the tailbag tie-<strong>of</strong>f most likely do not maximize finfishreduction. Additionally, gear testing conducted by the DMF in 1986 on the effects <strong>of</strong> light vs.heavy footrope chains on 20 foot trawls showed that bycatch <strong>of</strong> flounder, and crabs was higherin a heavily chained net while there was no difference in shrimp catches. To better reducebycatch in RCGL shrimp trawls FFE’s should be tested closer to the tailbag tie-<strong>of</strong>f, and specificrequirements for footrope chains should be examined.Alternate GearsThe development <strong>of</strong> species specific gears such as shrimp pots and cast nets couldreduce finfish bycatch, minimize environmental concerns and conflicts with other fisheries, andcould be more cost-effective than trawling. Even if these gears are ineffective in catchingcommercial quantities <strong>of</strong> shrimp, their use by recreational fishermen could result in a significantdecrease in finfish bycatch.<strong>Shrimp</strong> pots are currently being used in Pacific Northwest to harvest the BritishColumbia prawn (Pandalus platyceros) and in Maine to harvest northern shrimp [(P. borealis)Boutillier and Sloan 1987, and Philip Averill, Maine DMR, Pers. Comm.]. Various attempts havebeen made to develop a pot to capture Penaeid shrimp in North Carolina, however, all haveproven to be ineffective (Jim Bahen, UNC Sea Grant, pers. comm.; DMF unpublished data1990; McKenna and Clark 1993). In 2003, the DMF became aware <strong>of</strong> the emergence <strong>of</strong> a newform <strong>of</strong> shrimp pot/trap with wings. These traps are constructed <strong>of</strong> 5/8” rigid hardware cloth andhave two V-shaped wings to direct the shrimp into the traps. These wings can be up to 50 feetin length and the distance between the ends <strong>of</strong> the wings is approximately 80 feet. The trapsare most successful when set during a flood tide with one <strong>of</strong> the wings against a bulkhead ormarsh shoreline. The devices are staked or anchored in place. The ends <strong>of</strong> the wings faceaway from the direction <strong>of</strong> the tide flow when deployed.The use <strong>of</strong> cast nets to harvest shrimp is a popular technique used by recreationalfishermen in South Carolina and Georgia (Theiling 1988; Williams 1990). This method is usedprimarily on white shrimp, but may also be effective in capturing brown shrimp. In shrimpbaiting, a series <strong>of</strong> poles are pushed into the bottom <strong>of</strong> shallow tidal waters. Bait balls, madefrom fish meal and mud, are placed at a known distance around the poles. Casting with multiormono-filament nets begins within minutes after baiting. Catches generally range from 30 to41 quarts (headson) <strong>of</strong> shrimp per night (Theiling 1988). The harvest <strong>of</strong> white shrimp by castnetters in South Carolina accounted for 40% <strong>of</strong> the total white shrimp landings in 1990 (DavidWhitaker, S.C. Wild. Mar. Res. Per. Com.). This recreational fishery occurs largely at night inthe shallow, peripheral waters <strong>of</strong> the estuaries. On a limited basis, cast netting for white shrimpoccurs in the southern portion <strong>of</strong> North Carolina and in the Core and Bogue sound areas. As is161
the case in South Carolina, most <strong>of</strong> the activity in North Carolina is restricted to shallow tidalcreeks. No known cast netting activity occurs in the Pamlico Sound complex. Tests conductedin this area indicated that cast nets were a ineffective means <strong>of</strong> harvest (McKenna and Clark1993). This system has a low tidal range with circulation that is dominated by wind-drivencurrents. This lack <strong>of</strong> tidal influence could affect shrimp behavior in terms <strong>of</strong> movement andfeeding activity, thus making them less susceptible to baiting.Catch RestrictionsCatch restrictions have been used by fisheries managers to maintain fish stocks, extendfishing seasons, allocate resources, and reduce bycatch. In North Carolina this method is beingused to reduce the targeting <strong>of</strong> marketable finfish with shrimp trawls. From December 1 throughFebruary 28 It is unlawful to use trawl nets in internal waters to take more than 500 pounds <strong>of</strong>finfish and from March 1 through November 30 no more than 1,000 pounds <strong>of</strong> finfish may betaken (15A NCAC 3J .0104 (a) (1)). Additionally, in the Atlantic Ocean it is unlawful to possessfinfish caught incidental to shrimp trawling from December 1 through March 31 unless theweight <strong>of</strong> the combined catch <strong>of</strong> shrimp and crabs exceeds the weight <strong>of</strong> finfish, except that 300pounds <strong>of</strong> kingfish may be taken south <strong>of</strong> Bouge Inlet (15A NCAC 3J .0202 (5 (a) (b)).Harvest SeasonsHarvest Seasons have been used to reduce bycatch by relegating fishing activity totimes <strong>of</strong> maximum target species abundance, or by limiting activity during times <strong>of</strong> high bycatch.Currently shrimp trawling is permitted all year in North Carolina. If a specific species stockassessment indicated that measures need to be taken to reduce either the incidental ordiscarded catch in the shrimp trawl fishery <strong>of</strong> that species the following questions should beaddressed:1) How will seasons be determined?a) Overall?b) Area?2) What criteria will be used to set seasons?a) Base on historic average landings?b) Maximum value?3) Will allowances be made for variable conditions?a) Water temperature?b) Salinity?The type <strong>of</strong> information presented in Tables 1 through 22 would provide information toanswer the first two questions, while environmental data collected by the various resourceagencies could be used to address the third question.Time RestrictionsTrawl time restrictions can reduce bycatch <strong>of</strong> non-target species. In North Carolina it isunlawful to trawl for shrimp in the Atlantic Ocean <strong>of</strong>f Brunswick County, from one hour aftersunset to one hour before sunrise. This management measure was implemented in large part162
to reduce the bycatch <strong>of</strong> finfish in this gear. Ingraham (2003) examined this question byconducting a study <strong>of</strong> shrimp and finfish catch rates (day vs. night) in state waters from TopsailInlet to Little River Inlet. Data from the study showed that finfish bycatch was higher at nightthan during the day. Of the nine commercially important finfish species caught, southernflounder, spot, Atlantic croaker, and southern kingfish catch rates were significantly higher atnight. The catch <strong>of</strong> shrimp did not vary significantly between nighttime and daytime trawling,although catches were slightly higher during the day.Area RestrictionsArea restrictions for trawling have been used to deal with allocation, resource, habitat,and safety issues in North Carolina. During the late 80’s trawling was prohibited in AlbemarleSound and its tributaries (15A NCAC 3J .0104 (b) (3)). This action was implemented to protectthe flounder gill net fishery in this area (allocation issue). Since 1978 over 147,000 acres <strong>of</strong>estuarine nursery areas have been closed to trawling to protect juvenile fish and crustaceans.MFC rule 3N .0102 (a) defines Nursery Areas “as those areas in which for reasons such asfood, cover, bottom type, salinity, temperature and other factors, young fish and crustaceansspend the major portion <strong>of</strong> the initial growing season.” There are approximately 80,000 acres <strong>of</strong>Primary Nurseries, 35,500 acres <strong>of</strong> Secondary Nursery areas, and 31,000 <strong>of</strong> special SecondaryNursery areas. Primary and Secondary Nursery areas are permanently closed to trawling, whileSpecial Secondary Nursery areas can only be opened to trawling by proclamation from August16 through May 15. In the mid 90’ s the sea grass beds along the Outer Banks were closed totrawling to protect this critical habitat. Over 39,000 acres <strong>of</strong> military target areas are also closedto trawling for safety reasons. North Carolina has 2,147,000 acres <strong>of</strong> estuarine surface waterswith just over 1,000,000 acres (46%) closed to trawling.Limited EntryLimited entry methods <strong>of</strong> management restrict access to a fishery. Capping and/ orreducing fishing effort can protect the biological viability <strong>of</strong> a species and the economic integrity<strong>of</strong> the fishery. The species is protected by preventing overfishing and depletion <strong>of</strong> the stocks.While the fishery is enhanced by reducing costs and increasing earnings, effectively increasingefficiency. Other benefits <strong>of</strong> limited entry programs include an incentive to conserve, moreefficient management, bycatch minimization, and habitat protection. However, piecemealimplementation <strong>of</strong> limited entry programs can easily displace fishing effort from one fishery tocreate new problems in other areas and fisheries (Buck 1995). For bycatch reduction, limitedentry systems are <strong>of</strong>ten used in conjunction with other management measures, such as quotasor trip limits to achieve management objectives.IV.Current Authority:‚ It is unlawful to use trawl nets for the taking <strong>of</strong> finfish in internal waters, except that itshall be permissible to take or possess finfish incidental to crab or shrimp trawling inaccordance with the following limitations: it is unlawful to possess more than 500 pounds<strong>of</strong> finfish from December 1 through February 28 and 1,000 pounds <strong>of</strong> finfish from March1 through November 30. 15A NCAC 3J .0104 (a) (1)‚ It is unlawful to use trawl nets from December 1 through February 28 from one hour aftersunset to one before sunrise in portions <strong>of</strong> the Pungo, Pamlico, Bay, Neuse, and Newrivers. 15A NCAC 3J .0104 (b) (5) (A) (B) 8 (D) (E)‚ It is unlawful to use trawls within one-half mile <strong>of</strong> the ocean beach between the Virginialine and Oregon Inlet. 15A NCAC 3J .0202 (2)163
‚ From December 1 through March 31 it is unlawful to possess finfish caught incidental tocrab or shrimp trawling in the Atlantic Ocean unless the weight <strong>of</strong> the combined catch <strong>of</strong>shrimp and crabs exceeds the weight <strong>of</strong> finfish; except that trawlers working south <strong>of</strong>Bogue Inlet may keep up to 300 pounds <strong>of</strong> kingfish, regardless <strong>of</strong> their finfish or crabcatch weight. 15A NCAC 3J .0202 (5) (a) (b)‚ It is unlawful to use trawl nets in Albemarle Sound and its tributaries. 15A NCAC 3J.0104 (b) (3)‚ It is unlawful to use any trawl net in any primary or secondary nursery area.15A NCAC 3N .0104 and 3N .0105 (a)‚ Special secondary nursery areas may be opened to shrimp and crab trawling fromAugust 16 through May 14. 15A NCAC 3N .0105 (b)‚ The Director may by proclamation, require bycatch reduction devices or codendmodifications in trawl nets to reduce the catch <strong>of</strong> finfish that do not meet size limits orare unmarketable as individual foodfish by reason <strong>of</strong> size. 15A NCAC 3J .0104 (d)‚ It is unlawful to use shrimp trawls in all waters west <strong>of</strong> a line beginning at thesoutheastern tip <strong>of</strong> Baldhead Island 33° 50' 29" N - 77° 57' 28" W running 173° (M) to apoint in the Atlantic Ocean 33° 46' 16" N - 77° 56' 24" W from one hour after sunset toone hour before sunrise. 15A NCAC 3J .0202 (8)V. Management Options/Impacts(+ Potential positive impact <strong>of</strong> action)( - Potential negative impact <strong>of</strong> action)1. No rule change.+ No new regulations.- Continued biological concerns with finfish and sublegal crab bycatch.- Continued spacial conflicts.2. Gear modifications.+ Reduce bycatch.+ Possibly increase numbers <strong>of</strong> bycatch species by delaying age at entry into thefishery.- Potential economic burden on fishermen (loss <strong>of</strong> shrimp and incidental catch).3. Catch Restrictions+ Reduce bycatch <strong>of</strong> incidental catch.+ Possibly increase numbers <strong>of</strong> bycatch species by delaying age at entry into thefishery.- Potential economic burden on fishermen (loss <strong>of</strong> shrimp and incidental catch).4. Harvest seasons.+ Reduce bycatch mortality.+ Potential decrease in effort.+ Reduce/eliminate conflicts with other commercial fisheries (crab trawl and crabpotters).+ More efficient law enforcement.- Potential economic burden on fishermen.164
5. Time restrictions.+ Reduce bycatch mortality.+ Potential decrease in effort.+ Reduce/eliminate conflicts (crab trawl and crab potters).- Potential economic burden on fishermen.6. Area restrictions.+ Reduce bycatch mortality.+ Protect critical habitats.+ Reduce effort.+ Reduce/eliminate user conflicts.- Potential economic burden on fishermen (reduction in catch).- Increased law enforcement duties.7. Limited entry.+ Reduce bycatch mortality.+ Potential decrease in effort.+ Reduce/eliminate conflicts.+ More efficient law enforcement.+ Potential economic windfall to fishermen in fishery.- Potential economic burden to fishermen left out <strong>of</strong> the fishery.8. Ban shrimp trawling.+ Eliminate trawl bycatch mortality.+ Reduce user conflicts.- Economic hardship for trawlers.Options two through four and six would require rule changes by the MFC.AC and DMF recommendations: See area specific recommendations and research needs.VI.Research Needs:(1). Effort data need’s to be collected to provide estimates based on actual time fished (ornumber <strong>of</strong> tows), rather than number <strong>of</strong> trips.(2). Characterization work (shrimp) needs to be conducted across all strata (for example;season, areas, vessel type, and dominant species).(3). Obtain mortality (immediate and post harvest) estimates <strong>of</strong> culled, active and passive,bycatch.(4). Develop standard protocol for bycatch estimations.(5). Continue to develop and test methods to reduce bycatch in the commercial andrecreational shrimp trawl fisheries.(6). Continue to develop and test alternate gears for shrimp harvest.165
VII.Literature Cited:Alverson, D.L., M.H. Freeberg, S.A. Murawski and J.G. Pope. 1994. A global assessment <strong>of</strong>fisheries bycatch and discards. FAO <strong>Fisheries</strong> Technical Paper. No. 339, Rome, FAO.233pp.ASMFC (Atlantic States <strong>Marine</strong> <strong>Fisheries</strong> Commission) 1994. Acronyms, abbreviations, andtechnical terms used in ASMFC fishery management programs. Special Report No. 33<strong>of</strong> the Atlantic States <strong>Marine</strong> <strong>Fisheries</strong> Commission, Washington DC. 22p.ASMFC (Atlantic States <strong>Marine</strong> <strong>Fisheries</strong> Commission) 1996a. Fishery management plan andaddendum 1 for scup. ASMFC FMR No. 26. ASMFC,Wash. DC.ASMFC (Atlantic States <strong>Marine</strong> <strong>Fisheries</strong> Commission) 1996b. Fishery management plan forblack sea bass. ASMFC FMR No.28. ASMFC, Wash. DC.ASMFC (Atlantic States <strong>Marine</strong> <strong>Fisheries</strong> Commission) 1996c. Amendment 3 to the interstatefishery management plan for weakfish. ASMFC FMR No. 27. ASMFC, Wash. DC.ASMFC. 2003. Atlantic Croaker 2003 Stock Assessment Report. Atlantic States <strong>Marine</strong><strong>Fisheries</strong> Commission. Washington, D.C. 151 p.ASMFC. 2004. Atlantic Croaker 2004 Stock Assessment Supplement. Atlantic States <strong>Marine</strong><strong>Fisheries</strong> Commission. Washington, D.C. 188 p.Chopin, F.S. and T. Arimoto. 1995. The condition <strong>of</strong> fish escaping from fishing gears-a review.Fish. Res. 21:315-327.Coale, J. S., R. A. Rulifson, J. D. Murray, and R. Hines. 1994. Comparisons <strong>of</strong> shrimp catchand bycatch between a skimmer trawl and an otter trawl in the North Carolina inshoreshrimp fishery. North American Journal <strong>of</strong> <strong>Fisheries</strong> Management 14:751-768.Crowder, L. B. and S. A. Murawski. 1998. <strong>Fisheries</strong> bycatch: Implication for management.<strong>Fisheries</strong> 24(6):8-17.Diamond-Tissue, S. L. 1999. Characterization and estimation <strong>of</strong> shrimp trawl bycatch in NorthCarolina waters. Doctorate dissertation, North Carolina State University, Department <strong>of</strong>Zoology, Raleigh, NC 27695. 54 pp.Diamond-Tissue, S.L. 1999b. The population effects <strong>of</strong> shrimp trawl bycatch on Atlanticcroaker. Phd. Dissertation(draft). North Carolina State University, Depart.<strong>of</strong> Zoology,Raleigh, NC 27695. 58pp.Gibson, M.R. 1994. Alternative estimates <strong>of</strong> weakfish bycatch in shrimp trawl fisheries in thesouth Atlantic using shrimp effort and relative weakfish abundance data. Report to theAtlantic States <strong>Marine</strong> <strong>Fisheries</strong> Commission.Holland, B. F., Jr. 1988. Evaluation <strong>of</strong> Certified Trawl Efficiency Devices (TEDS) in NorthCarolina's Nearshore Ocean. N. C. Dept. <strong>of</strong> Nat. Res. and Comm. Dev., Div. Mar Fish.,Comp. Rpt, Project 2-439-R, 38 pp.166
Ingraham, B. 2003. Night Vs. Day Bycatch Comparison for <strong>Shrimp</strong> Trawling in the SouthernDistrict <strong>of</strong> North Carolina. North Carolina <strong>Fisheries</strong> Resource Grant. FRG-98-FEG-46.Johnson, G. A. 2003. The role <strong>of</strong> trawl discards in sustaining blue crab populations. NorthCarolina <strong>Fisheries</strong> Resource Grant. FRG-99-EP-07.Lathman, F. F. 1951. Evidence <strong>of</strong> fish loss due to shrimping in Pamlico Sound. CommitteeReport to Atlantic States <strong>Marine</strong> <strong>Fisheries</strong> Commission, November 1, 1951. Appendix B,4 p.McKenna, S. and J.T. Camp. 1992. An examination <strong>of</strong> the blue crab fishery in the PamlicoRiver estuary. Final Report to the Albemarle/Pamlico Estuarine Study, Project No. 92-08.101 pp.McKenna, S. and A.H. Clark. 1993. An examination <strong>of</strong> alternative fishing devices for theestuarine shrimp and crab trawl fisheries. Final Report to the Albemarle/PamlicoEstuarine Study, Project No. 93-11. 34 pp.McKenna, S. A. and J. P. Monaghan, Jr. 1993. Gear development to reduce bycatch in theNorth Carolina trawl fisheries. Completion Report for Cooperative Agreement No.NA90AA-SK052 to Gulf and South Atlantic <strong>Fisheries</strong> Development Foundation, ContractNo. 43-01, North Carolina Department <strong>of</strong> Environment, Health, and Natural Resources,<strong>Division</strong> <strong>of</strong> <strong>Marine</strong> <strong>Fisheries</strong>.McKenna, S. A., G. Judy, C. P. Lewis, and J. Schoolfield. 1996. Evaluation <strong>of</strong> trawl efficiencydevice/bycatch reduction device in estuarine and nearshore waters <strong>of</strong> North Carolina.Completion Report NOAA, No. NA 47FF0016, North Carolina Department <strong>of</strong>Environment, Health, and Natural Resources, <strong>Division</strong> <strong>of</strong> <strong>Marine</strong> <strong>Fisheries</strong>. 37 pp.Murray, J. D., J. J. Bahen, and R. A. Rulifson. 1991. Management Considerations for By-Catchin the North Carolina and Southeast <strong>Shrimp</strong> Fishery. <strong>Fisheries</strong> 17(1):21-26.Murray, J. D., J. L. Gearhart, R. A. Rulifson, and C. W. Wescott. 1995. Introduction <strong>of</strong> largemesh webbing in the belly and wings <strong>of</strong> traditional shrimp trawls to reduce bycatch ininshore waters. Saltonstall-Kennedy Final Report, Project NA37FD008801, February1995. 75 pp.Murawski, S.A. 1995. Biological implications <strong>of</strong> bycatch. In Proceedings <strong>of</strong> the East CoastBycatch Conference, April 7-8, 1995, p. 31-39.NMFS (National <strong>Marine</strong> <strong>Fisheries</strong> Service). 1995. Cooperative research program addressingfinfish bycatch in the Gulf <strong>of</strong> Mexico and South Atlantic shrimp fisheries. NMFSSoutheast Regional Office, St. Petersburg, Florida, 67pp.DMF (North Carolina <strong>Division</strong> <strong>of</strong> <strong>Marine</strong> <strong>Fisheries</strong>). 19911. <strong>Shrimp</strong> and crab trawling in NorthCarolina’s estuarine waters. North Carolina Department <strong>of</strong> Environment and NaturalResources, <strong>Division</strong> <strong>of</strong> <strong>Marine</strong> <strong>Fisheries</strong>. 154 pp.Nance, J. M. (Editor). 1998. Report to Congress. Southeastern United States <strong>Shrimp</strong> TrawlBycatch Program, 154 p.167
Pearce, K.B., D.W. Moye, and S.K. Strasser. 1988. Evaluation <strong>of</strong> trawl excluder devices inthe Pamlico Sound shrimp fishery. Albemarle-Pamlico Estuarine Study Rep. No.88-07.46p.Peuser, R. 1996. Estimates <strong>of</strong> finfish bycatch in the south Atlantic shrimp fishery. Final rep. SEArea Monitor. and Assess. Prog. SEAMAP-south Atl. Comm., <strong>Shrimp</strong> Bycatch WorkGroup, 62p.Roel<strong>of</strong>s, E. W. 1950. Observations <strong>of</strong> the capture <strong>of</strong> small fish by the shrimp trawls. AnnualReport, Institute <strong>of</strong> <strong>Fisheries</strong> Research UNC, Morehead City, NC:111-115.Theiling, D. 1988. Assessment <strong>of</strong> participation and resource impact <strong>of</strong> shrimp baiting in coastalSouth Carolina during 1987. S.C. Mar. Res. Cen. Tech. Rep. No. 69. 41p.Simpson, D.G. 1990. A study <strong>of</strong> <strong>Marine</strong> Recreational <strong>Fisheries</strong> in Connecticut. Federal Aid inSport Fish Restoration Project F-54-R, Job 8 Final Report. Conn. Dept. Environ. Prot.Bureau <strong>of</strong> Fish. and Wild., Div. Mar. Fish. 3p.Smith, E.M. and P.T. Howell. 1987. The effects <strong>of</strong> bottom trawling on American lobster,Homarus americanus, in Long Island Sound. Fish. Bull. 85(4):737-744.Vaughan, D.S., R.J. Seagraves and K. West. 1991. An assessment <strong>of</strong> the status <strong>of</strong> theAtlantic weakfish stock, 1982-1988. Special Report No. 21. Atlantic States <strong>Marine</strong><strong>Fisheries</strong> Commission.Vaughan, D.S. 1994. Incorporation <strong>of</strong> shrimp trawl bycatch in the assessment <strong>of</strong> Atlanticweakfish stock, 1982-1992. Rep. to ASMFC weakfish Tech. Comm., National <strong>Marine</strong><strong>Fisheries</strong> Service, Beaufort, NC Lab.Wassenberg, T.J. and B.J. Hill. 1989. The effect <strong>of</strong> trawling and subsequent handling on thesurvival rates <strong>of</strong> the by-catch <strong>of</strong> Prawn trawlers in Moreton Bay, Australia. Fish. Resh.7:99-110.Williams, B. 1990. A survey <strong>of</strong> shrimp cast netters in Georgia during 1989. Ga. Dept. Nat.Res. Coastal Res. Div. Proj. NA90AA-H-SK042.Wolff, M. 1972. A study <strong>of</strong> the North Carolina scrap fishery. North Carolina Department <strong>of</strong>Natural and Environmental Resources, <strong>Division</strong> <strong>of</strong> Commercial and Sport <strong>Fisheries</strong>,Special Science Report No. 20, 27 pp.168
Table 1. Percent <strong>Shrimp</strong> trawl landings (lbs)* <strong>of</strong> major market groups for North Carolina, 1994-2003.<strong>Shrimp</strong> Fish Crabs Mollusk TotalYear Pounds % <strong>of</strong> total Pounds % <strong>of</strong> total Pounds % <strong>of</strong> total Pounds % <strong>of</strong> total Pounds1994 6,890,373 89.46 391,671 5.09 394,817 5.13 25,096 0.33 7,701,9571995 7,903,366 90.83 555,834 6.39 203,379 2.34 38,252 0.44 8,700,8321996 4,874,276 85.83 530,604 9.34 265,166 4.67 9,225 0.16 5,679,2711997 6,451,239 91.51 317,716 4.51 264,609 3.75 16,008 0.23 7,049,5721998 4,270,740 85.62 197,277 3.95 508,457 10.19 11,574 0.23 4,988,0481999 8,108,209 92.34 411,973 4.69 247,198 2.82 13,063 0.15 8,780,4432000 9,442,710 94.90 320,997 3.23 169,906 1.71 16,449 0.17 9,950,0632001 4,749,564 93.86 141,304 2.79 161,169 3.18 8,256 0.16 5,060,2932002 8,879,703 95.90 229,236 2.48 143,367 1.55 7,481 0.08 9,259,7872003 5,432,418 92.85 142,410 2.43 266,528 4.56 9,687 0.17 5,851,042Average 6,700,260 91.31 323,902 4.49 262,460 3.99 15,509 0.21 7,302,131*Single gear Trip Tickets169
Table 2.Percent <strong>Shrimp</strong> trawl landings (lbs)* <strong>of</strong> major market groups in North Carolina,1994-2003.Area <strong>Shrimp</strong> Fish Crabs Mollusk TotalPamlico Sound 54.24 40.74 28.41 15.33 52.63Ocean** 27.99 54.80 0.36 79.20 28.30Core Sound 9.38 1.88 57.26 0.85 10.75Neuse River 1.93 0.51 9.12 0.23 2.13Inland Waterway*** 1.57 0.43 0.55 2.90 1.48Cape Fear River 1.36 0.44 0.12 0.23 1.27New River 1.23 0.76 1.23 0.72 1.20Newport River 0.61 0.02 0.17 0.09 0.56Pamlico River 0.56 0.19 0.33 0.05 0.54North River 0.39 0.05 0.23 0.25 0.37Bay River 0.20 0.04 0.50 0.01 0.20White Oak River 0.22 0.03 0.00 0.04 0.20Croatan Sound 0.14 0.08 1.13 0.00 0.18Roanoke Sound 0.11 0.04 0.52 0.00 0.12Pungo River 0.05 0.00 0.06 0.00 0.04Shallotte River 0.02 0.00 0.00 0.09 0.02Lockwood Folly 0.00 0.00 0.00 0.00 0.00Unknown 0.00 0.00 0.00 0.00 0.00Total 100 100 100 100 100*Single gear Trip Tickets**Ocean includes six sub-areas see Table 3.***Inland Waterway includes; all portions <strong>of</strong> the Inland waterway south <strong>of</strong> Morehead City, andTopsail, Stump, Masonboro and Bouge sounds.170
Table 3.Percent landings (lbs) for the major market groups landed* by shrimp trawls in theAtlantic Ocean: 1994-2003.Ocean subareas <strong>Shrimp</strong> Fish Crabs Mollusk Total3 mi, N <strong>of</strong> Cape Hatteras 0.76 0.51 0.94 0.12 0.743 mi, S <strong>of</strong> Cape Hatteras 8.29 10.12 6.50 5.50 8.43Less than 3 miles 20.41 19.37 34.14 31.99 20.39More than 3 miles 3.65 6.16 12.07 8.38 3.90Total 100 100 100 100 100*Single gear Trip TicketsTable 4.Percent landings (lbs) by month for the major market groups landed* by shrimptrawls: all waters combined in North Carolina: 1994-2003.Month <strong>Shrimp</strong> Fish Crabs Mollusk TotalJanuary 0.48 1.55 0.42 1.42 0.53February 0.20 1.64 0.24 2.37 0.27March 0.29 2.38 1.86 0.72 0.44April 0.74 1.32 9.41 3.00 1.08May 2.68 2.56 17.72 7.89 3.22June 8.44 3.54 20.36 10.16 8.66July 26.73 7.45 21.75 8.79 25.66August 20.52 11.30 10.83 9.42 19.74September 15.27 13.80 4.84 6.02 14.81October 15.08 22.58 5.02 16.46 15.06November 7.51 20.30 5.70 24.47 8.05December 2.05 11.58 1.85 9.27 2.48Total 100 100 100 100 100*Single gear Trip Tickets171
Table 5. Yearly finfish landings (lbs)* from shrimp trawls all North Carolina Waters combined.YearPercentSpecies 1994 1995 1996 1997 1998 1999 2000 2001 2002 2003 Total Average <strong>of</strong> totalSea mullet 93,292 220,610 132,953 105,149 78,843 231,075 154,700 47,414 113,574 67,859 1,245,471 124,547 38.45Flounders 131,262 74,068 70,687 63,457 39,143 68,648 38,810 30,419 48,581 24,257 589,332 58,933 18.19Spot 57,835 78,795 72,924 76,050 43,493 45,351 80,608 43,176 33,947 33,884 566,064 56,606 17.48Croaker 14,305 18,642 190,251 15,695 1,857 6,956 1,129 2,254 1,661 994 253,743 25,374 7.83Weakfish 47,406 40,269 18,492 13,786 5,014 17,304 7,190 1,793 2,983 1,360 155,596 15,560 4.80Fish, Mixed 23,940 33,449 7,419 11,564 10,936 8,254 10,184 7,070 6,496 6,445 125,755 12,576 3.88Butterfish 8,712 50,625 18,905 7,142 6,657 10,167 7,347 2,316 6,925 1,638 120,432 12,043 3.72Harvestfish 1,722 6,658 4,077 4,813 3,199 8,627 5,327 2,040 2,534 1,234 40,230 4,023 1.24Sheepshead 4,206 4,326 3,155 3,265 2,749 4,366 4,911 1,811 4,315 2,622 35,723 3,572 1.10Spanish mackerel 850 3,287 2,273 5,043 1,911 2,271 1,439 497 1,175 164 18,909 1,891 0.58Puffer 702 2,397 1,739 2,214 53 3,782 2,844 177 352 3 14,262 1,426 0.44Hogfish 2,123 1,781 2,208 2,512 1,538 832 1,097 717 632 815 14,254 1,425 0.44Black drum 35 8,499 440 32 43 638 331 132 2,374 154 12,677 1,268 0.39Spadefish 241 1,792 820 1,567 76 1,643 443 400 1,665 7 8,654 865 0.27Bluefish 879 1,284 1,411 1,907 223 440 676 227 299 59 7,405 740 0.23Cutlassfish 573 1,552 92 359 359 226 1,369 27 4 289 4,850 485 0.15Spiny dogfish N/R 3,600 N/R N/R N/R N/R 1,000 N/R N/R N/R 4,600 460 0.14Sharks 184 906 346 858 733 N/R 546 102 6 N/R 3,681 368 0.11Pompano 124 588 264 170 175 64 106 715 1,126 288 3,619 362 0.11Triggerfish 1,927 1 37 121 8 N/R N/R N/R 9 N/R 2,103 210 0.06Black sea bass 79 13 1,741 68 13 35 2 1 N/R N/R 1,951 195 0.06Cobia 183 246 103 268 93 N/R 19 N/R N/R 35 945 95 0.03Menhaden bait 104 25 N/R 300 N/R 227 N/R N/R 230 40 926 93 0.03False albacore 73 7 N/R 793 N/R N/R N/R N/R N/R N/R 873 87 0.03Bait 96 97 32 2 N/R 8 130 N/R 165 236 766 77 0.02Mullets 44 258 61 68 N/R 12 43 9 66 1 562 56 0.02Speckled trout 150 279 1 5 5 33 35 6 12 N/R 525 53 0.02King mackerel 123 71 18 56 100 7 61 N/R 58 25 520 52 0.02Conger eel N/R N/R N/R N/R 11 485 N/R N/R 7 N/R 503 50 0.02Snowy grouper N/R 442 N/R N/R N/R N/R N/R N/R N/R N/R 442 44 0.01Angelfish 17 178 40 69 10 124 N/R N/R N/R N/R 438 44 0.01Hakes N/R 326 32 N/R N/R 50 N/R N/R N/R N/R 408 41 0.01Monkfish 66 20 40 272 N/R N/R 4 N/R N/R N/R 402 40 0.01Snapper N/R 400 N/R N/R N/R N/R N/R N/R N/R N/R 400 40 0.01Blacktip shark N/R N/R N/R N/R N/R N/R 392 N/R N/R N/R 392 39 0.01Red drum 100 49 4 N/R 5 191 10 N/R 29 N/R 387 39 0.01Porgies 157 69 15 N/R N/R N/R N/R N/R N/R N/R 241 24 0.01Eels N/R N/R N/R 37 N/R 5 147 N/R N/R N/R 189 19 0.01Oyster toad N/R N/R N/R N/R N/R 138 5 N/R N/R N/R 143 14 0.00Angel shark N/R 58 N/R 7 N/R N/R 72 N/R N/R N/R 137 14 0.00Strawberry bass 46 28 2 11 5 3 16 N/R N/R N/R 111 11 0.00Skates N/R 62 N/R N/R 27 N/R N/R N/R N/R N/R 89 9 0.00Smooth dogfish N/R N/R N/R 60 N/R N/R N/R N/R N/R N/R 60 6 0.00Yellow perch 57 N/R N/R N/R N/R N/R N/R N/R N/R N/R 57 6 0.00Pinfish 26 20 N/R N/R N/R N/R N/R N/R N/R N/R 46 5 0.00Whitebone porgy 18 N/R N/R N/R N/R N/R N/R N/R N/R N/R 18 2 0.00Tautog 11 5 N/R N/R N/R N/R N/R N/R N/R N/R 16 2 0.00Minnows N/R N/R N/R N/R N/R N/R N/R N/R 13 N/R 13 1 0.00172
Table 5. ContinuedYearPercentSpecies 1994 1995 1996 1997 1998 1999 2000 2001 2002 2003 Total Average <strong>of</strong> totalAfrican pompano N/R N/R 11 N/R N/R N/R N/R N/R N/R N/R 11 1 0.00Cod N/R 11 N/R N/R N/R N/R N/R N/R N/R N/R 11 1 0.00Crevalle jack N/R 10 N/R N/R N/R N/R N/R N/R N/R N/R 10 1 0.00Hog snapper N/R 10 N/R N/R N/R N/R N/R N/R N/R N/R 10 1 0.00Boston mackerel N/R N/R N/R N/R N/R 10 N/R N/R N/R N/R 10 1 0.00Spottail pinfish N/R 3 6 N/R N/R N/R N/R N/R N/R N/R 9 1 0.00Catfish 2 6 N/R N/R N/R N/R N/R N/R N/R N/R 8 1 0.00Shad N/R 5 N/R N/R N/R N/R 3 N/R N/R N/R 8 1 0.00Grouper, mixed N/R N/R 8 N/R N/R N/R N/R N/R N/R N/R 8 1 0.00White perch N/R 4 N/R N/R N/R N/R N/R N/R N/R N/R 4 0 0.00Jolthead porgy N/R N/R N/R N/R N/R 2 2 N/R N/R N/R 4 0 0.00Grunts N/R N/R N/R N/R N/R N/R N/R 3 N/R N/R 3 0 0.00Margate/Porgies N/R 3 N/R N/R N/R N/R N/R N/R N/R N/R 3 0 0.00Scups N/R 2 N/R N/R N/R N/R N/R N/R N/R N/R 2 0 0.00Perch, sand N/R N/R N/R N/R N/R N/R N/R N/R N/R 1 1 0 0.00Permit 1 N/R N/R N/R N/R N/R N/R N/R N/R N/R 1 0 0.00Rock sea bass N/R 1 N/R N/R N/R N/R N/R N/R N/R N/R 1 0 0.00Total 391,671 555,834 530,604 317,716 197,277 411,973 320,997 141,304 229,236 142,410 3,239,022 323,902 100*Single gear Trip Tickets173
Table 6.Total shrimp trawl landings (lbs)* <strong>of</strong> top five finfish groups by waterbody, 1994 – 2003 landings combined.SpeciesSea Mullet Flounders Spot Croaker Weakfish TotalArea Pounds Percent Pounds Percent Pounds Percent Pounds Percent Pounds Percent Pounds PercentOcean** 829,825 66.63 189,769 32.20 305,342 53.94 216,793 85.44 12,175 7.82 1,553,904 55.30Pamlico Sound 390,572 31.36 360,464 61.16 229,863 40.61 33,982 13.39 137,707 88.50 1,152,587 41.01Core Sound 13,904 1.12 15,207 2.58 5,570 0.98 357 0.14 2,114 1.36 37,151 1.32New River 2,019 0.16 7,438 1.26 10,654 1.88 1,133 0.45 45 0.03 21,289 0.76Neuse River 4,330 0.35 4,446 0.75 2,882 0.51 379 0.15 1,626 1.04 13,661 0.49Inland Waterway*** 1,251 0.10 3,187 0.54 7,040 1.24 381 0.15 78 0.05 11,936 0.42Cape Fear River 1,696 0.14 4,241 0.72 1,809 0.32 266 0.10 130 0.08 8,142 0.29Pamlico River 1,411 0.11 2,484 0.42 505 0.09 92 0.04 405 0.26 4,897 0.17Croatan Sound 47 0.00 441 0.07 1,027 0.18 108 0.04 440 0.28 2,063 0.07North River 61 0.00 125 0.02 624 0.11 154 0.06 304 0.20 1,269 0.05Bay River 192 0.02 365 0.06 92 0.02 53 0.02 453 0.29 1,155 0.04Roanoke Sound 15 0.00 448 0.08 387 0.07 28 0.01 97 0.06 975 0.03White Oak River 123 0.01 603 0.10 107 0.02 0.00 0.00 833 0.03Newport River 25 0.00 89 0.02 38 0.01 16 0.01 23 0.01 191 0.01Shallotte River 0.00 17 0.00 126 0.02 0.00 0.00 143 0.01Pungo River 0.00 10 0.00 0.00 2 0.00 0.00 12 0.00Total 1,245,471 100 589,332 100 566,064 100 253,743 100 155,596 100 2,810,206 100*Single gear Trip Tickets**Ocean includes six sub-areas see Table 3.***Inland Waterway includes; all portions <strong>of</strong> the Inland waterway south <strong>of</strong> Morehead City, and Topsail, Stump, Masonboro and Bougesounds.174
Table 7.Monthly landings (lbs)* <strong>of</strong> top five finfish groups, 1994 – 2003 landings combined.SpeciesMonth Sea Mullet Flounders Spot Croaker Weakfish TotalJanuary 2.40 0.83 0.00 3.82 0.18 1.59February 3.95 0.42 0.00 0.00 0.26 1.86March 4.30 1.17 0.10 0.39 0.38 2.23April 1.83 2.48 0.08 0.15 0.22 1.37May 1.88 5.28 0.24 0.12 1.45 2.08June 3.33 6.89 0.45 0.23 2.64 3.18July 7.78 9.65 3.52 1.52 16.51 7.23August 10.48 12.25 10.44 3.47 25.80 11.06September 5.54 23.01 23.89 6.26 16.57 13.58October 17.45 22.51 44.34 7.00 18.64 23.05November 32.23 11.38 16.35 6.98 14.33 21.39December 8.83 4.15 0.58 70.06 3.01 11.39Total 100 100 100 100 100 100*Single gear Trip TicketsTable 8. Yearly finfish value from shrimp trawls* all North Carolina Waters combined; 1994-2003.Year %Species 1994 1995 1996 1997 1998 1999 2000 2001 2002 2003 Total Average <strong>of</strong> totalSea Mullet $71,573$154,022$119,910$106,922 $82,656$237,126$146,535 $48,457 $110,545 $67,181$1,144,927$114,493 42.83Flounders $204,262$124,377$120,117$117,541 $67,324$114,303 $65,978 $48,329 $68,231 $38,522 $968,984 $96,898 36.25Spot $19,549 $24,426 $27,591 $33,424 $18,263 $20,524 $32,997 $18,096 $14,474 $14,320 $223,663 $22,366 8.37Croaker $3,992 $5,036 $61,516 $7,121 $887 $2,190 $352 $631 $334 $228 $82,288 $8,229 3.08Weakfish $20,938 $17,199 $8,964 $6,088 $2,288 $8,445 $3,701 $876 $1,577 $809 $70,884 $7,088 2.65Butterfish $2,815 $21,769 $8,507 $3,214 $2,859 $4,913 $3,380 $1,181 $3,132 $1,016 $52,785 $5,278 1.97Fish, Mixed $5,985 $6,355 $5,564 $3,122 $3,171 $2,470 $5,194 $2,898 $1,840 $1,611 $38,212 $3,821 1.43Harvestfish $1,033 $6,259 $2,976 $3,706 $2,468 $5,970 $4,102 $1,672 $1,712 $1,111 $31,008 $3,101 1.16Sheepshead $1,135 $1,514 $1,009 $1,306 $907 $1,424 $1,768 $652 $1,570 $918 $12,204 $1,220 0.46Spanish Mackerel $342 $1,676 $1,571 $2,703 $1,083 $1,261 $1,068 $318 $934 $131 $11,087 $1,109 0.41Puffer $246 $784 $463 $718 $20 $1,724 $936 $81 $156 $1 $5,129 $513 0.19Black Sea Bass $102 $8 $3,961 $114 $12 $41 $2 $1 $4,242 $424 0.16Cutlassfish $287 $546 $136 $193 $557 $144 $1,248 $276 $54 $656 $4,096 $410 0.15Pompano $126 $442 $150 $75 $209 $79 $129 $493 $1,581 $429 $3,714 $371 0.14Black Drum $6 $2,210 $101 $9 $12 $160 $86 $38 $528 $38 $3,188 $319 0.12Hogfish $423 $298 $437 $552 $333 $192 $242 $172 $150 $220 $3,021 $302 0.11Spadefish $41 $358 $197 $360 $26 $457 $124 $112 $336 $1 $2,013 $201 0.08Bluefish $194 $318 $295 $504 $51 $94 $193 $51 $63 $14 $1,777 $178 0.07Triggerfish $1,330 $1 $28 $91 $6 $8 $1,463 $146 0.05Sharks $464 $213 $83 $202 $169 $115 $27 $1 $1,272 $127 0.05Cobia $201 $301 $112 $323 $109 $26 $46 $1,118 $112 0.04Snowy Grouper $796 $796 $80 0.03Spiny Dogfish $576 $170 $746 $75 0.03King Mackerel $149 $105 $30 $77 $144 $11 $71 $68 $41 $695 $69 0.03Snapper $620 $620 $62 0.02Speckled Trout $173 $304 $1 $6 $6 $38 $42 $8 $15 $593 $59 0.02175
Table 8. ContinuedYear %Species 1994 1995 1996 1997 1998 1999 2000 2001 2002 2003 Total Average <strong>of</strong> totalRed Drum $72 $44 $4 $5 $203 $11 $32 $371 $37 0.01Eels $94 $7 $204 $305 $31 0.01Mullets $25 $140 $29 $31 $6 $17 $5 $27 $0 $279 $28 0.01Angelfish $7 $77 $10 $30 $10 $124 $258 $26 0.01Monkfish $23 $25 $24 $131 $6 $210 $21 0.01False Albacore $11 $1 $174 $187 $19 0.01Conger Eel $4 $161 $3 $167 $17 0.01Minnows $104 $104 $10 0.00Menhaden Bait $8 $2 $27 $23 $34 $4 $98 $10 0.00Blacktip Shark $92 $92 $9 0.00Hakes $65 $9 $14 $88 $9 0.00Porgies $50 $26 $8 $84 $8 0.00Bait $5 $8 $3 $0 $1 $20 $12 $9 $58 $6 0.00Yellow Perch $46 $46 $5 0.00Strawberry Bass $13 $8 $1 $3 $1 $2 $8 $35 $4 0.00Angel Shark $15 $1 $7 $22 $2 0.00Oyster Toad $21 $1 $21 $2 0.00Skates $15 $5 $20 $2 0.00African Pompano $16 $16 $2 0.00Grouper, Mixed $15 $15 $2 0.00Whitebone Porgy $10 $10 $1 0.00Pinfish $5 $4 $9 $1 0.00Smooth Dogfish $8 $8 $1 0.00Shad $4 $2 $6 $1 0.00Cod $5 $5 $1 0.00Tautog $3 $1 $5 $0 0.00Spottail Pinfish $1 $3 $5 $0 0.00Jolthead Porgy $1 $1 $3 $0 0.00Catfish $0 $2 $3 $0 0.00Hog Snapper $3 $3 $0 0.00Crevalle Jack $2 $2 $0 0.00Grunts $2 $2 $0 0.00White Perch $2 $2 $0 0.00Margate/Porgies $2 $2 $0 0.00Boston Mackerel $1 $1 $0 0.00Scups $1 $1 $0 0.00Sand Perch $1 $1 $0 0.00Rock Sea Bass $0 $0 $0 0.00Permit $0 $0 $0 0.00Total 335,646 370,966 363,840 288,869 183,586 402,128 268,825 124,377 207,522 127,306 2,673,067 267,307 100*Single gear Trip Tickets176
Table 9.Total value <strong>of</strong> finfish landings from shrimp trawls by waterbody, 1994 – 2003 landings combined.Year %Area 1994 1995 1996 1997 1998 1999 2000 2001 2002 2003 Total Average <strong>of</strong> totalOcean** $102,447 $175,070 $211,953 $129,625 $110,947 $257,482 $157,304 $51,432 $91,115 $79,299$1,366,674 $136,667 51.13Pamlico Sound $217,912 $175,600 $137,326 $144,577 $63,999 $132,593 $98,193 $68,181 $109,084 $41,308$1,188,772 $118,877 44.47Core Sound $6,108 $11,520 $3,646 $6,938 $3,618 $3,252 $4,297 $3,136 $2,114 $2,815 $47,444 $4,744 1.77New River $1,496 $3,792 $1,113 $1,677 $1,631 $2,190 $4,552 $728 $1,910 $1,240 $20,329 $2,033 0.76Neuse River $1,192 $1,138 $4,854 $2,782 $897 $2,559 $684 $1,092 $255 $15,453 $1,545 0.58Cape Fear River $3,150 $1,624 $1,563 $267 $1,225 $695 $1,114 $196 $1,015 $636 $11,485 $1,148 0.43Inland Waterway*** $1,041 $672 $690 $1,107 $757 $2,688 $1,531 $403 $257 $1,053 $10,198 $1,020 0.38Pamlico River $603 $1,141 $1,689 $1,379 $266 $420 $134 $210 $340 $137 $6,320 $632 0.24Croatan Sound $36 $52 $284 $247 $140 $157 $652 $66 $101 $18 $1,754 $175 0.07White Oak River $133 $356 $24 $92 $3 $97 $433 $1,137 $114 0.04Roanoke Sound $383 $13 $158 $80 $9 $13 $9 $387 $2 $1,052 $105 0.04Bay River $648 $16 $90 $156 $4 $45 $50 $1 $33 $1,045 $104 0.04North River $397 $247 $87 $10 $60 $4 $3 $808 $81 0.03Newport River $99 $61 $32 $3 $34 $209 $13 $4 $46 $502 $50 0.02Shallotte River $19 $17 $9 $4 $30 $79 $8 0.00Pungo River $5 $4 $7 $15 $2 0.00Total $335,646 $370,966 $363,840 $288,869 $183,586 $402,128 $268,825 $124,377 $207,522 $127,306$2,673,067 $267,307 100*Single gear Trip Tickets**Ocean includes six sub-areas see Table 3.***Inland Waterway includes; all portions <strong>of</strong> the Inland waterway south <strong>of</strong> Morehead City, and Topsail, Stump, Masonboro and Bougesounds.177
Table 10.Total monthly value <strong>of</strong> finfish landings from shrimp trawls*, 1994 – 2003 landings combinedYear %Month 1994 1995 1996 1997 1998 1999 2000 2001 2002 2003 Total Average <strong>of</strong> totalJanuary $850 $2,638 $3,821 $10,474 $408 $2,031 $21,469 $106 $288 $103 $42,189 $4,219 1.58February $1,933 $31,966 $17 $2,336 $2,056 $1,645 $461 $40,415 $4,041 1.51March $2,614 $13,955 $23,244 $12,185 $367 $5,634 $1,311 $65 $842 $1,382 $61,599 $6,160 2.30April $11,443 $8,297 $1,613 $9,434 $935 $4,585 $2,966 $1,477 $3,196 $2,034 $45,979 $4,598 1.72May $17,578 $7,753 $6,251 $13,557 $5,673 $6,713 $4,617 $3,260 $12,465 $3,986 $81,853 $8,185 3.06June $18,583 $12,360 $12,356 $14,977 $10,136 $12,080 $7,577 $4,250 $19,891 $4,100 $116,312 $11,631 4.35July $36,604 $25,264 $28,413 $20,689 $13,800 $22,777 $15,529 $20,043 $17,060 $18,392 $218,571 $21,857 8.18August $56,801 $26,227 $63,860 $45,063 $12,570 $23,601 $14,233 $26,306 $15,503 $24,337 $308,501 $30,850 11.54September $82,499 $53,935 $43,850 $49,276 $24,550 $48,742 $36,562 $18,448 $14,695 $14,249 $386,805 $38,681 14.47October $66,095 $52,447 $60,757 $67,715 $55,839 $71,962 $95,384 $33,099 $53,416 $30,247 $586,963 $58,696 21.96November $34,893 $72,114 $56,985 $37,480 $50,008 $145,425 $66,759 $14,036 $67,379 $26,420 $571,499 $57,150 21.38December $5,753 $64,009 $62,673 $5,683 $9,299 $56,524 $773 $3,287 $2,325 $2,055 $212,381 $21,238 7.95Total $335,646 $370,966 $363,840 $288,869 $183,586 $402,128 $268,825 $124,377 $207,522 $127,306$2,673,067 $267,307 100*Single gear Trip TicketsTable 11.Yearly crab landings (lbs)* from shrimp trawls all North Carolina Waters combined.Blue crabs Horseshoe crabs Stone crabs TotalYear Pounds Percent Pounds Percent Pounds Percent Pounds Percent1994 394,815 100.00 2 0.00 394,817 1001995 203,339 99.98 40 0.02 203,379 1001996 265,156 100.00 10 0.00 265,166 1001997 264,495 99.96 105 0.04 9 0.00 264,609 1001998 506,822 99.68 1,635 0.32 508,457 1001999 246,501 99.72 696 0.28 1 0.00 247,198 1002000 169,906 100.00 169,906 1002001 161,167 100.00 2 0.00 161,169 1002002 142,913 99.68 447 0.31 7 0.00 143,367 1002003 266,520 100.00 8 0.00 266,528 100Total 2,621,635 99.89 2,923 0.11 39 0.00 2,624,597 100Average 262,164 292 4 262,460*Single gear Trip Tickets178
Table 12.<strong>Shrimp</strong> trawl crab landings (lbs)* by waterbody, 1994 – 2003 data combined.SpeciesBlue crabs Horseshoe crabs Stone crabs TotalArea Pounds Percent Average Pounds Percent Average Pounds Percent Average Pounds Percent AverageCore Sound 1,502,750 57.32 150,275 40 1.37 4 1,502,790 57.26 150,279Pamlico Sound 742,855 28.34 74,286 2,883 98.63 288 745,738 28.41 74,574Neuse River 239,432 9.13 23,943 239,432 9.12 23,943New River 32,198 1.23 3,220 7 18.18 1 32,205 1.23 3,220Croatan Sound 29,739 1.13 2,974 29,739 1.13 2,974Inland Waterway*** 14,502 0.55 1,450 29 75.32 3 14,531 0.55 1,453Roanoke Sound 13,640 0.52 1,364 13,640 0.52 1,364Bay River 13,234 0.50 1,323 13,234 0.50 1,323Ocean** 9,535 0.36 954 9,535 0.36 954Pamlico River 8,542 0.33 854 8,542 0.33 854North River 6,125 0.23 612 6,125 0.23 612Newport River 4,341 0.17 434 4,341 0.17 434Cape Fear River 3,087 0.12 309 3,087 0.12 309Pungo River 1,504 0.06 150 1,504 0.06 150White Oak River 82 0.00 8 3 6.49 0 84 0.00 8Unknown 54 0.00 5 54 0.00 5Shallotte River 17 0.00 2 17 0.00 2Total 2,621,635 100 262,164 2,923 100 292 39 100 4 2,624,597 100 262,460*Single gear Trip Tickets**Ocean includes six sub-areas see Table 3.***Inland Waterway includes; all portions <strong>of</strong> the Inland waterway south <strong>of</strong> Morehead City, and Topsail, Stump, Masonboro and Bougesounds.179
Table 13.Monthly shrimp trawl crab landings (lbs)*, 1994 – 2003 data combined.SpeciesBlue crabs Horseshoe crabs Stone crabs TotalMonth Pounds Percent Average Pounds Percent Average Pounds Percent Average Pounds Percent AverageJanuary 10,890 0.42 1,089 222 7.59 22 11,112 0.42 1,111February 6,281 0.24 628 6,281 0.24 628March 48,807 1.86 4,881 48,807 1.86 4,881April 247,050 9.42 24,705 247,050 9.41 24,705May 465,108 17.74 46,511 8 19.48 1 465,115 17.72 46,512June 534,459 20.39 53,446 7 18.52 1 534,466 20.36 53,447July 570,767 21.77 57,077 12 30.88 1 570,779 21.75 57,078August 284,270 10.84 28,427 40 1.37 4 8 19.77 1 284,317 10.83 28,432September 126,912 4.84 12,691 126,912 4.84 12,691October 131,688 5.02 13,169 4 11.35 0 131,692 5.02 13,169November 147,746 5.64 14,775 1,794 61.38 179 149,540 5.70 14,954December 47,657 1.82 4,766 867 29.66 87 48,524 1.85 4,852Total 2,621,635 100 262,164 2,923 100 292 39 100 4 2,624,597 100 262,460*Single gear Trip Tickets180
Table 14. Yearly crab value from shrimp trawls* all North Carolina Waters combined; 1994-2003.SpeciesYear Blue crabs Horseshoe crabs Stone crabs Total1994 $182,093 $4 $182,0961995 $122,993 $5 $122,9981996 $138,869 $24 $138,8931997 $157,541 $12 $19 $157,5731998 $284,724 $245 $284,9701999 $137,970 $104 $2 $138,0772000 $122,776 $122,7762001 $105,612 $5 $105,6182002 $83,011 $89 $16 $83,1162003 $168,566 $20 $168,586Total $1,504,156 $457 $90 $1,504,703Average $150,416 $46 $9 $150,470Percent <strong>of</strong> total 99.96 0.03 0.01 100.00*Single gear Trip TicketsTable 15.Total value <strong>of</strong> crab landings* from shrimp trawls by waterbody, 1994 – 2003 landingscombined.SpeciesArea Blue crabs Horseshoe crabs Stone crabs TotalCore Sound $821,772 $5 $821,777Pamlico Sound $406,616 $451 $407,067Neuse River $170,380 $170,380Croatan Sound $29,550 $29,550New River $21,768 $18 $21,786Roanoke Sound $13,171 $13,171Inland Waterway $11,720 $67 $11,787Bay River $9,171 $9,171Ocean $5,508 $5,508Pamlico River $5,458 $5,458North River $3,438 $3,438Newport River $2,634 $2,634Cape Fear River $1,906 $1,906Pungo River $941 $941White Oak River $57 $6 $63Unknown $40 $40Shallotte River $27 $27Total $1,504,156 $457 $90 $1,504,703Average $150,415.63 $45.65 $9.04 $150,470.31Percent <strong>of</strong> total 99.96 0.03 0.01 100.00*Single gear Trip Tickets**Ocean includes six sub-areas see Table 3.***Inland Waterway includes; all portions <strong>of</strong> the Inland waterway south <strong>of</strong> Morehead City, andTopsail, Stump, Masonboro and Bouge sounds.181
Table 16.Total monthly value <strong>of</strong> crab landings from shrimp trawls*, 1994 – 2003 landingscombined.SpeciesMonth Blue crabs Horseshoe crabs Stone crabs TotalJanuary $6,364 $33 $6,397February $3,693 $3,693March $27,446 $27,446April $135,108 $135,108May $259,005 $18 $259,023June $300,354 $16 $300,369July $340,668 $29 $340,697August $186,014 $5 $17 $186,037September $72,572 $72,572October $71,196 $11 $71,206November $78,117 $266 $78,383December $23,619 $152 $23,772Total $1,504,156 $457 $90 $1,504,703Average $150,415.63 $45.65 $9.04 $150,470.31Percent <strong>of</strong> total 99.96 0.03 0.01 100.00*Single gear Trip TicketsTable 17.Yearly Mollusk* landings (lbs)** from shrimp trawls all North Carolina Waterscombined.Squid Octopus Conchs TotalYear Pounds Percent Pounds Percent Pounds Percent Pounds Percent1994 24,804 98.84 183 0.73 79 0.31 25,096 16.181995 37,813 98.85 105 0.27 202 0.53 38,252 24.661996 9,047 98.07 138 1.49 40 0.43 9,225 5.951997 15,825 98.86 11 0.07 172 1.08 16,008 10.321998 11,246 97.17 180 1.55 148 1.28 11,574 7.461999 12,836 98.26 181 1.39 46 0.35 13,063 8.422000 16,349 99.40 27 0.16 73 0.44 16,449 10.612001 8,247 99.90 9 0.10 0.00 8,256 5.322002 7,376 98.59 106 1.41 0.00 7,481 4.822003 9,660 99.72 20 0.21 7 0.07 9,687 6.25Total 153,203 98.78 957 0.62 767 0.49 155,090 100Average 15,320 96 77 15,509*15.75 lbs <strong>of</strong> blood clams, and 146 lbs <strong>of</strong> hard clam meats also landed, specific data confidential.**Single gear Trip Tickets182
Table 18.<strong>Shrimp</strong> trawl Mollusk* landings (lbs)** by waterbody, 1994 – 2003 data combined.SpeciesSquid Octopus Conchs TotalArea Pounds Percent Average Pounds Percent Average Pounds Percent Average Pounds Percent AverageOcean*** 121,900 79.57 12,190 917 95.82 92 19 2.45 2 122,836 79.29 12,284Pamlico Sound 23,713 15.48 2,371 37 3.87 4 29 3.83 3 23,780 15.35 2,378Inland Waterway**** 4,491 2.93 449 1 0.07 0 4,491 2.90 449Core Sound 578 0.38 58 613 79.88 61 1,191 0.77 119New River 1,077 0.70 108 3 0.31 0 1,080 0.70 108North River 279 0.18 28 106 13.77 11 385 0.25 39Cape Fear River 359 0.23 36 359 0.23 36Neuse River 354 0.23 35 354 0.23 35Shallotte River 145 0.09 15 145 0.09 15Newport River 133 0.09 13 133 0.09 13Pamlico River 85 0.06 9 85 0.05 9White Oak River 70 0.05 7 70 0.04 7Bay River 18 0.01 2 18 0.01 2Total 153,203 100 15,320 957 100 96 767 100 77 154,927 100 15,493*15.75 lbs <strong>of</strong> blood clams, and 146 lbs <strong>of</strong> hard clam meats also landed, specific data confidential.**Single gear Trip Tickets***Ocean includes six sub-areas see Table 3.****Inland Waterway includes; all portions <strong>of</strong> the Inland waterway south <strong>of</strong> Morehead City, and Topsail, Stump, Masonboro and Bougesounds.183
Table 19.Monthly shrimp trawl Mollusk* landings (lbs)**, 1994 – 2003 data combined.SpeciesSquid Octopus Conchs TotalMonth Pounds Percent Average Pounds Percent Average Pounds Percent Average Pounds Percent AverageJanuary 2,191 1.43 219 13 1.36 1 0.00 0 2,204 1.42 220February 3,668 2.39 367 0.00 0 5 0.65 0 3,673 2.37 367March 837 0.55 84 20 2.09 2 257 33.51 26 1,114 0.72 111April 4,400 2.87 440 13 1.36 1 244 31.76 24 4,657 3.01 466May 12,068 7.88 1,207 8 0.84 1 165 21.47 16 12,241 7.90 1,224June 15,573 10.16 1,557 1 0.10 0 73 9.50 7 15,647 10.10 1,565July 13,614 8.89 1,361 0.00 0 0 0.04 0 13,614 8.79 1,361August 14,531 9.48 1,453 37 3.87 4 4 0.52 0 14,572 9.41 1,457September 9,307 6.07 931 23 2.35 2 7 0.95 1 9,337 6.03 934October 25,444 16.61 2,544 87 9.09 9 0 0.06 0 25,532 16.48 2,553November 37,390 24.41 3,739 566 59.10 57 0 0.06 0 37,956 24.50 3,796December 14,180 9.26 1,418 190 19.85 19 11 1.48 1 14,382 9.28 1,438Total 153,203 100 15,320 957 100 96 767 100 77 154,927 100 15,493*15.75 lbs <strong>of</strong> blood clams, and 146 lbs <strong>of</strong> hard clam meats also landed, specific data confidential.**Single gear Trip Tickets184
Table 20.Yearly Mollusk value from shrimp trawls*, all North Carolina waterscombined; 1994 – 2003.SpeciesYear Squid Octopus Conchs Total1994 $7,937 $170 $57 $8,1651995 $15,401 $118 $127 $15,6461996 $4,378 $157 $40 $4,5751997 $8,117 $13 $174 $8,3041998 $6,489 $228 $121 $6,8391999 $7,147 $248 $33 $7,4272000 $9,284 $33 $51 $9,3682001 $4,865 $11 $4,8752002 $4,972 $125 $5,0972003 $5,313 $25 $6 $5,344Total $73,903 $1,127 $610 $75,640Average $7,390 $113 $61 $7,564Percent <strong>of</strong> total 97.70 1.49 0.81 100*Single gear Trip TicketsTable 21. Total value <strong>of</strong> Mollusk landings* from shrimp trawls by waterbody. 1994 –2003 landings combined.SpeciesArea Squid Octopus Conchs TotalOcean** $60,170 $1,081 $15 $61,267Pamlico Sound $10,020 $42 $19 $10,081Inland Waterway*** $2,280 $0 $2,280Core Sound $220 $506 $726New River $521 $3 $525North River $145 $70 $215Cape Fear River $172 $172Neuse River $162 $162Shallotte River $86 $86Newport River $56 $56White Oak River $35 $35Pamlico River $27 $27Bay River $9 $9Total $73,903 $1,127 $610 $75,640Average $7,390 $113 $61 $7,564Percent <strong>of</strong> total 97.70 1.49 0.81 100*Single gear Trip Tickets**Ocean includes six sub-areas see Table 3.***Inland Waterway includes; all portions <strong>of</strong> the Inland waterway south <strong>of</strong> Morehead City,andTopsail, Stump, Masonboro and Bouge sounds.185
Table 22. Total monthly value <strong>of</strong> Mollusk landings from shrimp trawls*, 1994 – 2003landings combined.SpeciesMonth Squid Octopus Conchs TotalJanuary $1,169 $18 $1,187February $1,815 $4 $1,819March $383 $19 $187 $588April $1,933 $12 $180 $2,125May $5,595 $8 $161 $5,764June $7,704 $1 $59 $7,765July $7,157 $0 $7,157August $7,581 $42 $3 $7,626September $4,721 $26 $5 $4,752October $12,390 $90 $0 $12,481November $17,740 $671 $1 $18,412December $5,715 $240 $10 $5,964Total $73,903 $1,127 $610 $75,640Average $7,390 $113 $61 $7,564Percent <strong>of</strong> total 97.70 1.49 0.81 100*Single gear Trip TicketsTable 23.Overall composition* <strong>of</strong> bycatch in the south Atlantic and Gulf <strong>of</strong> Mexicoshrimp trawl fishery.GroupSouth AtlanticPercentbyweightPercentbynumberGulf <strong>of</strong> MexicoPercentbyweightPercentbynumber<strong>Shrimp</strong> 18 23 16 29Fish 51 54 67 50Crustacean 13 12 13 17Invertebrates 18 11 4 4*Data from 1998 National <strong>Marine</strong> <strong>Fisheries</strong> Service report to Congress.Table 24.Seasonal catch composition <strong>of</strong> bycatch in the south Atlantic shrimp trawlfishery*.WeightNumberGroup Spring Summer Fall Spring Summer Fall<strong>Shrimp</strong> 37 15 18 11 26 17Fish 44 58 44 65 58 44Crustacean 9 14 14 21 14 9Invertebrates 9 13 25 3 3 30*Data from 1998 National <strong>Marine</strong> <strong>Fisheries</strong> Service report to Congress.186
Table 25.Seasonal catch composition <strong>of</strong> bycatch in the Gulf <strong>of</strong> Mexico shrimp trawlfishery*.WeightNumberGroup Spring Summer Fall Spring Summer Fall<strong>Shrimp</strong> 16 18 15 28 29 30Fish 66 62 72 46 51 51Crustacean 15 15 10 21 16 16Invertebrates 3 5 30 5 4 3*Data from 1998 National <strong>Marine</strong> <strong>Fisheries</strong> Service report to Congress.Table 26.Catch composition (top ten species) by number for shrimp trawls, allareas combined, and by area (from Diamond-Tissue 1999).Area Rank SpeciesTotalnumberPercent <strong>of</strong>totalnumberFrequency<strong>of</strong>occurrenceAll areas combined1 Market penaeidshrimp112,974 44.3 52n=52 tows 2 Star drum 28,316 11.1 26(15 trips) 3 Atlantic croaker 27,199 10.7 504 Weakfish 22,538 8.8 485 Spot 13,204 5.2 416 Squid 6,807 2.7 307 Lesser blue crab 6,432 2.5 198 Pink shrimp 5,176 2.0 409 Blue crab 4,332 1.7 2210 Pigfish 2,670 1.0 1390.0Pamlico Sound1 Market penaeidshrimp13,671 28.9 16n=16 tows 2 Atlantic croaker 12,046 25.5 16(5 trips) 3 Spot 8,043 17.0 164 Weakfish 5,047 10.7 155 Blue crab 2,023 4.3 146 Jellyfish 1,586 3.4 6187
Table 26. ContinuedArea Rank SpeciesTotalnumberPercent <strong>of</strong>totalnumberFrequency<strong>of</strong>occurrence7 Silver perch 884 1.9 88 Summer flounder 656 1.4 119 Hogchoker 489 1.0 1210 Brown shrimp 392 0.8 694.9Core Sound1 Market penaeidshrimp4,694 20.4 4n=4 tows 2 Lesser blue crab 4,578 19.9 4(2 trips) 3 Pink shrimp 3,753 16.3 54 Pigfish 2,342 10.2 45 Spot 1,757 7.6 46 Atlantic croaker 1,541 6.7 37 Mojarra 599 2.6 48 Pinfish 564 2.4 49 Mantis shrimp 456 2.0 410 Blue crab 344 1.5 489.7Cape Fear River1 Market penaeidshrimp83,937 54.8 24n=24 tows 2 Star drum 28,170 18.4 23(5 trips) 3 Weakfish 15,992 10.4 244 Atlantic croaker 11,438 7.5 235 Squid 2,243 1.5 166 Spot 1,286 0.8 147 Blue crab 1,274 0.8 168 Pink shrimp 1,226 0.8 139 Bay anchovy 1,202 0.8 18188
Table 26. ContinuedArea Rank SpeciesTotalnumberPercent <strong>of</strong>totalnumberFrequency<strong>of</strong>occurrence10 Hog choker 1,080 0.7 15Listing for pink or brown shrimp indicates less than market size.96.6Table 27. Catch composition (top ten species) by weight for shrimp trawls, all areascombined, and by area (from Diamond-Tissue 1999).Area Rank SpeciesTotal weight(lbs.)Percent <strong>of</strong>total weightFrequency<strong>of</strong>occurrenceAll areas combined 1 Market penaeid shrimp 2,983.0 34.2 52n=52 tows 2 Atlantic croaker 1,1620. 13.3 50(15 trips) 3 Weakfish 978.0 11.2 484 Spot 707.0 8.1 415 Blue crab 569.0 6.5 406 Lesser blue crab 260.8 3.0 197 Star drum 229.1 2.6 268 Atlantic cutlassfish 216.1 2.5 179 Squid 153.0 1.8 3010 Yellowfin menhaden 108.2 1.2 884.4Pamlico Sound 1 Market penaeid shrimp 634.5 22.4 16n=16 tows 2 Weakfish 582.7 20.5 15(5 trips) 3 Atlantic croaker 545.6 19.2 164 Spot 457.9 16.2 165 Blue crab 253.7 9.0 146 Silver perch 84.0 3.0 87 Summer flounder 70.8 2.5 118 Atlantic menhaden 45.2 1.6 59 Jellyfish 44.8 1.6 6189
Table 27. ContinuedArea Rank SpeciesTotal weight(lbs.)Percent <strong>of</strong>total weightFrequency<strong>of</strong>occurrence10 Hogchoker 26.9 0.9 1296.9Core Sound 1 Lesser blue crab 227.7 25 4n=4 tows 2 Penaeid shrimp 190.0 20.8 4(2 trips) 3 Atlantic croaker 131.0 14.3 34 Spot 73.0 8.0 45 Pigfish 67.0 7.4 46 Pink shrimp 36.4 4.0 47 Blue crab 35.7 3.9 48 Inshore lizardfish 24.9 2.7 39 Pinfish 24.5 2.7 410 Mantis shrimp 21.4 2.3 491.1Cape Fear River 1 Market penaeid shrimp 1,910.9 51.2 24n=24 tows 2 Weakfish 350.0 9.4 24(5 trips) 3 Atlantic croaker 264.0 7.1 234 Star drum 228.0 6.1 235 Blue crab 190.0 5.1 166 Atlantic cutlassfish 160.1 4.3 97 Yellowfin menhaden 100.1 2.7 58 Pinfish 26.5 1.6 89 Atlantic menhaden 50.3 1.3 610 Atlantic stingray 48.7 1.3 7Note Listing for pink or brown shrimp indicates less than market size.90.2190
Table 28.Catch composition (top ten) by weight for shrimp trawls, all areascombined, and by area (Johnson 2003).TotalPercent <strong>of</strong>total FrequencyArea Rank Species weight (lbs) catch <strong>of</strong> occurrenceAll areascombined 1 Blue Crabs 2,757 26.29 542 <strong>Shrimp</strong> 2,092 19.95 54n=54 tows 3 Spot 1,796 17.13 544 Croaker 1,286 12.26 515 Invertebrates (Other) 1,155 11.01 536 Other Fish (Undivided, etc.) 366 3.49 327 Pinfish 358 3.41 438 Pigfish 117 1.12 239 Menhaden 106 1.01 1210 Flounder, Other or Unspecified 73 0.70 2196.37Core Sound 1 Blue Crabs 2,416 32.76 462 <strong>Shrimp</strong> 1,738 23.56 46n=46 3 Invertebrates (Other) 1,088 14.76 454 Spot 1,013 13.74 465 Croaker 265 3.59 436 Pinfish 255 3.46 397 Other Fish (Undivided, etc.) 216 2.93 268 Pigfish 116 1.57 229 Summer flounder 39 0.52 2010 Silversides 31 0.42 2697.32Neuse River 1 Croaker 1,021 32.82 82 Spot 783 25.15 8n=8 3 <strong>Shrimp</strong> 354 11.37 84 Blue Crabs 341 10.94 85 Other Fish (Undivided, etc.) 150 4.82 66 Pinfish 103 3.30 47 Menhaden 95 3.05 48 Invertebrates (Other) 67 2.14 89 Flounder, Other or Unspecified 53 1.70 510 Unknown drum species 50 1.60 396.91191
Table 29.Finfish catch composition (top ten) by weight for shrimp trawls, all areascombined, and by area (Johnson 2003).Total % <strong>of</strong> total FrequencyArea Rank Species weight (lbs) catch <strong>of</strong> occurrenceAll areascombined 1 Spot 1,796 40.23 542 Croaker 1,286 28.81 51n=52 tows 3 Other Fish (Undivided, etc.) 366 8.20 324 Pinfish 358 8.01 435 Pigfish 117 2.62 236 Menhaden 106 2.37 127 Flounder, Other or Unspecified 73 1.65 218 Unknown drum species 51 1.15 59 Summer flounder 39 0.86 2010 Silversides 36 0.81 2994.72Core Sound 1 Spot 1,013 47.95 462 Croaker 265 12.53 43n=46 3 Pinfish 255 12.07 394 Other Fish (Undivided, etc.) 216 10.21 265 Pigfish 116 5.49 226 Summer flounder 39 1.83 207 Silversides 31 1.48 268 Cusk-eel 27 1.27 69 Flounder, Other or Unspecified 21 0.98 1610 Bluefish 14 0.65 1394.46Neuse River 1 Croaker 1,021 43.45 82 Spot 783 33.30 8n=8 3 Other Fish (Undivided, etc.) 150 6.38 64 Pinfish 103 4.37 45 Menhaden 95 4.04 46 Flounder, Other or Unspecified 53 2.25 57 Unknown drum species 50 2.12 38 Mackeral 30 1.26 49 Cutlassfish 22 0.92 210 SilverPerch 11 0.45 298.53192
Table 30.Results <strong>of</strong> 1 ½” vs. 1 5/8” stretched mesh diamond tailbagstested in Pamlico Sound, July 1991.Total weight (lbs)n=5 Control ExperimentalPercentdifferenceSpot 148.46 166.63 12.24Atlantic croaker 81.65 79.51 -2.62Summer flounder 6.24 6.48 3.89Southern flounder 2.56 1.28 -50Weakfish 5.51 8.45 53.2Market fish 18.19 20.73 13.94Miscellaneousfish 23.75 32.88 38.44Total fish 286.36 315.93 10.33Crabs 143.33 164.27 14.62Brown shrimp 11.36 11.03 -2.91Pink shrimp 5.16 6.02 16.67Total shrimp 16.52 17.04 3.2Total 446.20 497.25 11.44Table 31.Results <strong>of</strong> 1 ½” vs. 2” stretched mesh diamond tailbags tested inPamlico Sound, July 1991.Total weight (lbs)n=5 Control ExperimentalPercentdifferenceSpot 156.78 84.85 -45.88Atlantic croaker 46.55 36.23 -22.17Summer flounder 8.80 6.64 -24.56Southern flounder 0.24 0.77 218.18Weakfish 0.68 0.20 -70.97Market fish 7.19 7.74 7.67Miscellaneousfish 33.76 22.60 -33.05Total fish 254.02 159.00 -37.4Crabs 147.74 168.68 14.18Brown shrimp 2.56 3.13 22.41Pink shrimp 1.21 0.90 -25.45Total shrimp 3.77 4.04 7.02Total 405.52 331.72 -18.2193
Table 32.Results <strong>of</strong> 1 ½” diamond vs. 1 ½” square, stretched meshtailbags tested in Pamlico Sound, 2000.Total weight (lbs)Control ExperimentalPercentdifference P(T
Table 33.Results <strong>of</strong> experimental tows with FFE designs (escapmentopening GE 6½" x 5½"), tested aboard commercial trawlers inNorth Carolina, 1992 and 1994.Total weight (kg)n=165 Control ExperimentalPercentdifference P(T
Table 34.Results <strong>of</strong> experimental tows with FFE designs (escapmentopening Ge 6½" X 5½", and ratio 0.4-0.5), tested aboardcommercial trawlers in North Carolina, 1992 and 1994.Total weight (kg)n=64PercentControl ExperimentaldifferenceP(T
Table 35.Results <strong>of</strong> experimental tows with FFE designs (escapmentopening Ge 6½" X 5½", and ratio 0.5-0.6), tested aboardcommercial trawlers in North Carolina, 1992 and 1994.Total weight (kg)n=31PercentControl ExperimentaldifferenceP(T
Table 36.Results <strong>of</strong> experimental tows with FFE designs (escapmentopening Ge 6½" X 5½", and ratio 0.6-0.65), tested aboardcommercial trawlers in North Carolina, 1992 and 1994.Total weight (kg)n=34PercentControl Experimental difference P(T
Table 37. Results <strong>of</strong> experimental tows with FFE designs (escapement opening >=5½" X 6½", placed 15 meshes to the side), tested aboard commercialtrawlers in North Carolina, 1992 and 1994.Total weight (kg)n=118*Control ExperimentalPercentdifference P(T
Table 38. Results <strong>of</strong> experimental tows with FFE designs (escapement opening >=5½" X 6½", placed 30 meshes to the side), tested aboard commercialtrawlers in North Carolina, 1992 and 1994.Total weight (kg)n=17*Control ExperimentalPercentdifference P(T
Table 39.Results <strong>of</strong> experimental tows with the large mesh extendedfunnel tested in Pamlico Sound North Carolina, 1994.Total weight (kg)n=36PercentControl Experimental difference P(T
Table 40.Results <strong>of</strong> experimental tows with the modified large mesh funnel excluderconducted in Brunswick County North Carolina, August 1995.Total weight (kg)n=10 ControlPercentExperimental difference P(T
Table 41.Results <strong>of</strong> experimental tows with a 6" "Sea Eagle" tested in Bay RiverNorth Carolina 1997.Total (kg) Percentn=33 Control "Sea Eagle" difference<strong>Shrimp</strong> 187.80 175.45 -6.58Southern flounder 29.55 24.15 -18.27Spot 316.20 203.60 -35.61Atlantic croaker 169.50 107.00 -36.87Weakfish wgt. 67.30 41.65 -38.11Weakfish #'s 1,158.00 820.00 -29.19Southern kingfish 8.05 2.45 -69.57Bluefish 5.80 1.40 -75.86Sea Robin 0.60 0.00 -100.00Hogchoker 0.30 0.00 -100.00Atlantic menhaden 3.95 0.35 -91.14Oyster toadfish 0.30 0.00 -100.00Pinfish 5.85 4.25 -27.35Pigfish 0.50 0.50 0.00Harvestfish 1.00 0.60 -40.00Inshore Lizzardfish 37.90 1.75 -95.38Gizzard shad 0.50 0.00 -100.00Atlantic thread herring 2.05 0.70 -65.85Spanish mackerel wgt. 0.05 0.00 -100.00Spanish mackerel #'s 2.00 0.00 -100.00Sand perch 12.85 9.15 -28.79Crabs & inverts. 336.70 331.40 -1.57Jellyfish 104.40 100.30 -3.93Miscellaneous 22.40 18.60 -16.96Total finfish 662.25 397.55 -39.97Total catch 1,313.55 1,023.30 -22.10203
Top viewTop view<strong>of</strong> trawlcenterline12"Side viewApexLeg6.5"5.5"Escapmentopeningminimumdimensions9"5"25 meshesfunctional tailbag105 meshesFFE placedat 68 meshesfrom tailbag tie-<strong>of</strong>f(max allowed)tailbag150 meshesOval20 meshesdiamond(or 6 X 6)Tie-<strong>of</strong>fringsFigure 1.Diagram <strong>of</strong> Florida Fish Excluder (FFE) tested in North Carolina waters.204
Figure 2.Diagram <strong>of</strong> large mesh extended funnel BRD (LMEF) tested in NorthCarolina.205
Figure 3.Diagram <strong>of</strong> modified large mesh funnel excluder (LMFE) tested in NorthCarolina.206
floatTop View<strong>of</strong> TrawlSideviewflappartiallyopenedcenterlineTopfloatviewEscapment opening8 inches25 meshesSea Eagle placedat 40 meshesfrom tailbag tie-<strong>of</strong>fFrontfunctional tailbag105 meshestailbag150 meshes(max allowed)viewflapclosedFlap20 meshestie-<strong>of</strong>f ringsFigure 4.Diagram <strong>of</strong> “Sea Eagle” fish excluder tested in North Carolina.207
12.4 Appendix 4. SOUTHERN FLOUNDER BYCATCH IN THE INSHORE SHRIMPTRAWL FISHERYI. Issue:Southern flounder bycatch in the inshore shrimp trawl fishery.II.Background:Bycatch <strong>of</strong> southern flounder was a topic <strong>of</strong> concern for the Southern FlounderAdvisory Committee. Bycatch characterization studies indicate that bycatch reductiondevices currently in place are not effective for reducing southern flounder bycatch (Table1). The Southern flounder Advisory Committee recommended that <strong>Shrimp</strong> AdvisoryCommittee address the issue <strong>of</strong> discard <strong>of</strong> sublegal southern flounder in the shrimp trawlfishery within the <strong>Shrimp</strong> Fishery Management Plan (<strong>FMP</strong>).Table 1.The size range and mean size in millimeters <strong>of</strong> southern and summerflounder taken in shrimp trawls during BRD testing in 1995 (n = the number<strong>of</strong> fish sampled) (McKenna et al. 1996).Croatan Sound Pamlico Sound Core Sound New RiverCape FearControl BRD Control BRD Control BRD Control BRD Control BRDSouthern flounder (n) 3 1 441 441 55 71 170 127 37 96Range (mm) 196-354 155 94-447 89-378 102-322 90-358 88-414 103-337 114-396 74-419Mean (mm) 300 155 163 161 214 220 220 227 231 190Summer flounder (n) 138 111 195 283 594 476 84 72 188 231Range (mm) 101-278 83-325 110-313 110-310 45-332 65-331 137-346 92-341 77-351 90-420Mean (mm) 145 140 196 196 130 132 235 235 158 163III.DiscussionBased on the 2004 stock assessment, the southern flounder stock is overfishedand has been for at least the past decade. North Carolina lands 96% <strong>of</strong> the southernflounder caught in southeastern United States commercial fisheries. North Carolinalandings increased dramatically during the 1990s as they replaced summer flounder asthe leading flounder landed in North Carolina. According to a stock assessment report,southern flounder appear to be fully-to-over-exploited in North Carolina and the rest <strong>of</strong>the southeastern United States.The southern flounder fishery is largely dependent on incoming recruitment. The 2004stock status catch-at-age indicated extremely high exploitation <strong>of</strong> age-1 and age-2 southernflounder (57% and 38% respectively), that is a concern since only 59% <strong>of</strong> age-1 and 79% <strong>of</strong>age-2 female southern flounder are sexually mature. The current fishing mortality rate forsouthern flounder is 1.91 (representing an 85% removal rate), which retains approximately 5.4%<strong>of</strong> the maximum spawning stock biomass, well below the percentage <strong>of</strong> spawning stocknecessary to sustain most stocks.208
<strong>Shrimp</strong> Trawl BycatchIn the absence <strong>of</strong> quantifiable observer data, DMF utilized the Pamlico Soundtrawl survey (Program 195) as a proxy for estimating shrimp trawl bycatch <strong>of</strong> southernflounder. The trawl survey utilizes comparable gears and operates during the sameperiods <strong>of</strong> time as the shrimp trawl fishery.Mean catch-at-length by year, from 1991-2002, were provided and converted intocatch-at-age for comparable analysis within the defined parameters <strong>of</strong> the southernflounder stock assessment (SA) (Table 2) (Grist 2003). The bycatch catch-at-age wereadded to the original southern flounder catch-at-age utilized in the SFSA and compared(Figure 1). A catch curve analysis and a Virtual Population Analysis (VPA) wereconducted to compare the original southern flounder SA results with results that includedthe shrimp trawl bycatch catch-at-age.Table 2.Southern flounder bycatch catch-at-age.AgeYear 0 1 2 3 4 5 6 71991 705,675 670,504 284 0 0 0 0 01992 505,106 577,673 10,254 0 0 0 0 01993 668,281 352,862 8,710 6,485 0 0 0 01994 838,333 520,245 11,934 121 121 0 0 01995 901,136 677,671 13,417 0 0 0 0 01996 570,626 168,662 3,556 0 0 0 0 01997 710,106 577,395 1,901 0 0 543 0 01998 177,849 374,264 14,390 0 0 0 0 01999 913,981 240,672 5,314 0 0 0 0 02000 803,845 315,111 0 0 0 0 0 02001 284,981 158,799 6,526 0 0 0 0 02002 448,562 292,798 6,651 0 0 0 0 0209
CAA NUMBERS2,000,0001,800,0001,600,000Numbers <strong>of</strong> Fish1,400,0001,200,0001,000,000800,000600,000400,000200,000-0 1 2 3 4 5 6 7AgeCAA w/bycatchCAAFigure 1.Original southern flounder catch-at-age versus catch-at-age includingshrimp trawl bycatch catch-at-age.Catch Curve AnalysisInitial estimates <strong>of</strong> total mortality (Z, or fishing + natural mortality) were obtainedthrough catch curve analysis. A catch curve is a basic approach to analyzing catch-atagewherein a linear regression is fit to the declining limb <strong>of</strong> log transformed catch-atagedata. (Ricker 1958, Ricker 1975, Hilborn and Waters 1992).Catch curve analysis was conducted for ages 1-6. The original southern flounder catchcurve analysis suggested that total mortality averaged 2.30 from 1991-2002, with the estimatedfishing mortality rate equal to 1.89 and a fishing exploitation rate <strong>of</strong> 85%. When the shrimp trawlbycatch estimates were added to the original catch-at-age, the average total mortality from1991-2002 for southern flounder increased to 2.75, with the estimate fishing mortality rate equalto 2.35 and a fishing exploitation rate <strong>of</strong> 90% (Figure 2).210
Logarithmic # <strong>of</strong> Fish16141210864CAA LN/SLOPE COMPAREAges 1-61CAA F = 1.89 (85% removal)CAA w/DMF bycatch F=2.35 (90% removal)2-0 1 2 3 4 5 6 7AgeCAA w/bycatchCAAFigure 2.Comparison <strong>of</strong> catch curve analysis for southern flounder with and withoutshrimp trawl bycatch catch-at-age.Virtual Population AnalysisVPA/ADAPT uses Virtual Population Analysis (VPA) combined with non-linearleast squares minimization <strong>of</strong> residuals using the Levenburg-Marquardt algorithm. TheVPA is a technique for reconstructing historical population size based on observedcatch, an estimated natural mortality rate and estimated terminal year abundance(Gavaris 1988, Conser and Powers 1990). No error is assumed to occur in the CAAestimates. The VPA is calibrated with survey indices <strong>of</strong> abundance to improvepopulation estimates in the final years. Confidence intervals and bias estimates areprovided by 1000 bootstrap iterations.The original VPA analysis for southern flounder estimated the fishing mortality at1.91 ages 2-5, with a range <strong>of</strong> 1.69-2.89, and a fishing exploitation rate <strong>of</strong> 85%. Whenthe shrimp trawl bycatch catch-at-age was added to the original dataset, the fishingmortality rate did not change. With shrimp trawl bycatch data, the VPA fishing mortalityrate <strong>of</strong> 1.90, with a range <strong>of</strong> 1.68-2.95, and a fishing exploitation rate <strong>of</strong> 85%.Age-Structure AnalysisCatch curve analysis and VPA are exacting quantitative analysis <strong>of</strong> stock status,and both have indicated minimal to no differences in the affects upon the highexploitation rate <strong>of</strong> southern flounder through the fishery. An additional analysis <strong>of</strong>population-at-age distributions under current and proposed management strategies also211
confirms this analysis. A theoretical stock distribution, based on known and proposedfishing mortality rates by age, and examining both the original and bycatch inclusivecatch-at-ages, also depicts how under the current suppressed stock scenario, shrimptrawl bycatch impacts are unclear. In the absence <strong>of</strong> fishing (Figure 3), only naturalmortality (M=0.4) has any cumulative affect upon the southern flounder population, andthe age structure is distributed naturally from young to old. Under the current fishingscenario, with or without bycatch, the age structure is severely truncated, with very fewage 3+ fish, and high exploitation <strong>of</strong> age-1 and age-2 fish. Under the target fishingmortality goals set forth by the southern flounder <strong>FMP</strong>, the age distribution allows formore older fish in the population. With age-3 representing 100% maturity-at-age forfemales, this target distribution if vital for the rehabilitation <strong>of</strong> the fishery. However, itshould be noted that under both the current and target fishing scenarios, current modelsshow very little difference when shrimp trawl bycatch is included in the calculations.With the addition <strong>of</strong> approximately 1.0 million age 0-2 fish from the shrimp trawlbycatch, exploitation <strong>of</strong> juvenile southern flounder is more pronounced (19%, 52%, and26% respectively). However, in such a suppressed stock scenario, it is unclear whatspecific impacts shrimp trawl bycatch has on the overall stock status <strong>of</strong> southernflounder at this time.Theoretical Stock Distribution Examples5,000,0004,500,0004,000,0003,500,0003,000,0002,500,0002,000,0001,500,0001,000,000500,000-No FishingTarget FishingTarget F w/DMF bycatchCurrent FishingCurrent w/DMF bycatch0 1 2 3 4 5 6 7 8 9 10AgeFigure 3.Theoretical population-at-age distributions for southern flounder under n<strong>of</strong>ishing, target fishing (with and without bycatch), and current fishing (withand without bycatch).212
Literature CitedConser, R.J. and J.E. Power. 1990. Extensions <strong>of</strong> the ADAPT tuning method designed t<strong>of</strong>acilitate assessment work on tuna and swordfish stocks. International Commission forthe Conservation <strong>of</strong> Atlantic Tunas, Collected Volume Scientific Papers 32:443-460.Gavaris, S. 1988. An adaptive framework for the estimation <strong>of</strong> population size. CandadianAtlantic Fishery Scientific Advisory Commission Research Document 88/29.Grist, J.D. 2003. Stock status <strong>of</strong> southern flounder in North Carolina. North CarolinaDepartment <strong>of</strong> Environment and Natural Resources, <strong>Division</strong> <strong>of</strong> <strong>Marine</strong> <strong>Fisheries</strong>, 60p.Hilborn, R. and C.J. Walters. 1992. Quantitative <strong>Fisheries</strong> Stock Assessment: Choice,Dynamics, and Uncertainty. Routledge, Chapman and Hall. New York.McKenna, S.A., G. Judy, C. P. Lewis, and J. Schoolfield. 1996. Evaluation <strong>of</strong> trawl efficiencydevice/bycatch reduction device in estuarine and nearshore waters <strong>of</strong> North Carolina.Completion Report NOAA, No. NA 47FF0016, North Carolina Department <strong>of</strong>Environment, Health, and Natural Resources, <strong>Division</strong> <strong>of</strong> <strong>Marine</strong> <strong>Fisheries</strong>, 37p.Ricker, W.E. 1958. Handbook <strong>of</strong> computations for biological statistics <strong>of</strong> fish populations. Bull.Fish. Res. Board <strong>of</strong> Canada 119:300p.Ricker, W.E. 1975. Computation and interpretation <strong>of</strong> biological statistics <strong>of</strong> fish populations.Bull. Fish. Res. Bd. Can. 191:382p.213
12.5 Appendix 5. SHRIMP MANAGEMENT BY SIZE IN NORTH CAROLINA ESTUARIESI. Issue:At what shrimp size should waterbodies be opened to shrimp trawling?II.Background:<strong>Shrimp</strong> management in North Carolina has evolved from early biological work done inthe mid 1960s. At that time, studies were conducted on the behavior <strong>of</strong> our three species <strong>of</strong>shrimp (pink, brown and white), their growth rates, mortality and migration, habitat preferences,and salinity and temperature tolerances.A major step in the evolution <strong>of</strong> management came in 1978 with the designation <strong>of</strong>Primary and Secondary Nursery Areas. These are the shallow bays and tributaries with lowsalinities, muddy bottoms and detritus where the shrimp spend their post-larval and juveniledevelopment. In these shallow waters, food is abundant, salinities and temperatures areoptimal, and there are few predators. No trawling is allowed in primary and secondary nurseryareas to allow the shrimp to grow to harvestable size with as little man-made disturbance aspossible. A Special Secondary Nursery Area designation originated in the 1980s to protect theshrimp during the majority <strong>of</strong> the season and allow harvest toward the end, when shrimp are <strong>of</strong>harvestable size and juvenile fish have migrated out <strong>of</strong> the bays. Other management measuresthat have been implemented include the 1 ½ inch minimum mesh size in shrimp trawls, notrawling areas in the Outer Banks seagrass beds, military restricted areas, and weekendclosures from 9:00 p.m. on Friday nights to 5:00 p.m. on Sunday nights, among others.The Director has proclamation authority to open and close in the estuaries and theAtlantic Ocean based on size and environmental conditions. The Director may, byproclamation, open any or all <strong>of</strong> the special secondary nursery areas, or portion there<strong>of</strong>, toshrimp or crab trawling from August 16 through May 14, subject to the provisions <strong>of</strong> 15A NCAC03L .0100 and .0200 (general shrimp and crab trawl rules). This flexibility in opening andclosing shrimp areas is a valuable management tool, but it makes managers subject to thelobbying efforts <strong>of</strong> the various user groups.III.Discussion:<strong>Shrimp</strong> area openings and closures are based primarily on the size <strong>of</strong> most <strong>of</strong> the shrimppresent in an area determined by extensive DMF sampling. Other factors considered in adecision to open or close an area include biological, environmental, economic and social issuesin an “optimum utilization” scheme. The social aspects <strong>of</strong> management are addressed byevaluating the subjective knowledge <strong>of</strong> experienced DMF field personnel, shrimp fishermen,dealers, and others associated with the industry. When personal preferences or circumstancescloud this information, the size <strong>of</strong> the shrimp and the number <strong>of</strong> juvenile finfish in the samplesassume the greatest weight in the decision.Although highly variable, the density <strong>of</strong> shrimp in the nursery areas during the spring aswell as weather conditions in the critical spring nursery months determine the number and size<strong>of</strong> shrimp in the different waterbodies. Overcrowding, with its associated competition for foodand space cause the shrimp to migrate downstream earlier than they normally would and windand rainfall compound the problem. At times when this occurs, the event is over before aclosure can take effect or we already have the line at the point downstream at which a214
marketable and enforceable line can be established.<strong>Shrimp</strong> management varies from the northern portion <strong>of</strong> the state to the southern partbecause <strong>of</strong> species behavior and differences among geographic areas as well as preferences <strong>of</strong>the user groups. In the Roanoke Island area, which is the northernmost range for NC shrimp,the management <strong>of</strong> special secondary nursery areas is based more on the protection <strong>of</strong> juvenilefinfish than on the harvest <strong>of</strong> shrimp. Sampling is conducted to insure that the small fish haveleft the bays and, if shrimp are present, the area is opened. Abundant shrimp in the northernpart <strong>of</strong> the state is such a rare occurrence that nearly any size is considered harvestable, andby August 16, they are usually <strong>of</strong> sufficient size.The target size <strong>of</strong> shrimp in the majority <strong>of</strong> the Central District is 26-30 or 27-35 count(per pound heads on). In White Oak River, where shrimp do not reach that size beforemigrating, openings are considered when the majority <strong>of</strong> the sampled shrimp reach about 45-50count.<strong>Shrimp</strong> in the southern part <strong>of</strong> the state, with no extensive bays and sounds to developin, begin to migrate at a smaller size. The waters <strong>of</strong> Onslow, Pender, New Hanover, andBrunswick counties that are available for opening to trawling are typically located either in orlandward <strong>of</strong> the Intracoastal Waterway (ICW), which runs the entire length <strong>of</strong> all four counties’coastlines. Portions <strong>of</strong> these narrow waters may remain closed only at some times <strong>of</strong> the yearor not open at all, depending on the size <strong>of</strong> the shrimp observed in the DMF’s samples. Targetopening size in Brunswick and portions <strong>of</strong> New Hanover counties is 40-50 count (heads on). InOnslow and parts <strong>of</strong> Pender County, sampling has shown that a 20-30 count target size can beachieved before migration occurs. Channels that connect the ICW with the Atlantic Ocean havebeen left open to allow some harvest <strong>of</strong> shrimp as they migrate from closed areas to the ocean.Trawling in these migration routes has become the subject <strong>of</strong> discussion among shrimpers aswell as the public because <strong>of</strong> concerns about bycatch <strong>of</strong> other species as well as interferencewith navigation. One migration route that has been the subject <strong>of</strong> recent controversy is thechannel leading to Blue Water Point Marina in Brunswick County.Consideration must be given to the entire range <strong>of</strong> users, from the 15’ outboard in theshallow water sounds and river tributaries to the 85’ ocean trawler. In most cases, 100 pounds<strong>of</strong> 45 count (heads on) shrimp would be much more valuable if permitted to grow to 16-20s,even factoring in the mortality suffered in the meantime. Even this statement has its exceptionin the spring pink shrimp fishery in the North River area <strong>of</strong> Carteret County when those 45 countshrimp bring up to $2.50 per pound. Managing for 16-20 sized shrimp would eliminate themajority <strong>of</strong> the shrimp fleet and leave the catch to larger trawlers in Pamlico Sound and theocean and to some channel netters. Thus far the management strategy has been to allocatesome <strong>of</strong> the public resource to all groups. All <strong>of</strong> these groups call and visit during the seasonand complain when they feel that they are not getting their fair portion.Attempts have been made to limit the frequent movement <strong>of</strong> shrimp lines by meetingwith the fishermen, discussing the problems, and seeking answers acceptable to the majority <strong>of</strong>them, while <strong>of</strong>fering reasonable protection for the small shrimp. For example, a meeting washeld at Harkers Island in 1997 about a possible solution to North River shrimp line and byunanimous choice, a “permanent” line was agreed to and implemented. The line works well,unless there are tremendous numbers <strong>of</strong> shrimp, which causes smaller ones to spill over intothe open area. Still the shrimp are marketable and provide income to the fishermen, particularlythe early summer pink shrimp. Newport River has settled into a fairly predictable pattern <strong>of</strong>working the Penn Point-Hardesty Farm line until late fall when an opening to the Turtle Rock215
occurs.Closing an area in mid-season usually results in a “grand opening” later. Areas likeAdams Creek, Newport or North River may have up to 200 boats, regardless <strong>of</strong> the number <strong>of</strong>shrimp there may or may not be. This large number <strong>of</strong> vessels operating in confinedwaterbodies results in dangerous navigational situations. Fish kills following shrimp openings inNew River and Bay River in recent years have brought attention to trawling impacts. Thedetrimental effects <strong>of</strong> these openings to the bottom and juvenile fish in the area make it verydesirable to avoid them whenever possible.In conclusion, North Carolina shrimp management has evolved into a fairly routine series<strong>of</strong> openings and closures over the past few years. Designation <strong>of</strong> primary and secondarynursery areas and negotiated “permanent” lines in some waterbodies like North River haveeliminated the need to open and close anything. Unusual weather events or the occurrence <strong>of</strong>unusually high numbers <strong>of</strong> small shrimp will occasionally force closures <strong>of</strong> normally openedareas like a portion <strong>of</strong> Neuse River or the ocean south <strong>of</strong> Cape Fear. Target sizes for openinghave evolved: 26-30 count from Pamlico Sound to White Oak River; 45-50 count in the WhiteOak River; 20-30 count in New River and parts <strong>of</strong> Pender County; and 40-50 count in Brunswickand parts <strong>of</strong> New Hanover counties. At the present time modal groups are used and someshrimp are larger and some smaller than our target. Openings based on these target sizeshave addressed the variability within the state <strong>of</strong> boat sizes and size preferences <strong>of</strong> the usergroups, geographical differences in the shrimp size at migration, weather events, and socioeconomicconditions.IV.Current Rule:V. Management Option/Impacts:+ potential positive impact <strong>of</strong> action- potential negative impact <strong>of</strong> action1. Status quo, with specific target size for openings: Pamlico Sound to White Oak River-26-30 count; White Oak River-45-50 count; New River and parts <strong>of</strong> Pender County-20-30 count; Brunswick and parts <strong>of</strong> New Hanover counties-40-50 count.+ Flexibility in reacting to variable conditions (excessive rainfall, early migration)+ Access to resource by a variety <strong>of</strong> users+ Minimize harvest <strong>of</strong> small shrimp and bycatch- Open areas highly dynamic (size and number <strong>of</strong> shrimp change quickly)- Potential for larger shrimp to leave with smaller shrimp remaining.- Labor intensive and expensive to sample- Difficult to keep public abreast <strong>of</strong> opening and closing dates- Necessitates “grand openings”2. Keep all areas closed that are currently intensively managed areas+ Prevent harvest <strong>of</strong> smaller shrimp+ Reduce bycatch+ Public better informed- Increases effort in areas that remain open- Elimination <strong>of</strong> niche markets developed over the years (bait)216
3. Set dates for opening and closing areas each year+ Grand opening dates predetermined+ Satisfy fishermen who disagree with DMF openings+ Better utilization <strong>of</strong> staff time+ Public better informed- Lose flexibility <strong>of</strong> management by proclamation- Excessive harvest <strong>of</strong> small shrimp or shrimp gone when opened4. Management by strict minimum count rule+ Possible reduction in harvest <strong>of</strong> small shrimp+ May increase price for shrimp that are landed- Poses enforcement problem- Wastage due to high-grading- Counts may vary widely in the same geographic area- May eliminate most inside shrimping- Difficult to keep public abreast <strong>of</strong> openings/closings5. Restrict the size or number <strong>of</strong> shrimp trawls per vessel in inside waters+ May reduce bycatch+ May reduce user conflictsReduces possibility <strong>of</strong> large “ocean” trawlers working inside+ May reduce habitat disturbances caused by larger trawlers- Reduce inside shrimp catch6. Close inside shrimping+ Reduction <strong>of</strong> small shrimp harvest+ Eliminate inside bycatch from shrimp trawls+ Decrease navigational and fixed vs. mobile gear conflicts in inside waters- Loss <strong>of</strong> large portion <strong>of</strong> shrimp fishery- Loss <strong>of</strong> income to commercial fishermen and dealers- Impossible to assess benefit <strong>of</strong> bycatch reduction on fish stocks with current data- Loss <strong>of</strong> recreational use <strong>of</strong> shrimp resourceRecommendations:AC, DMF and MFC Recommendations: See area specific recommendations.217
12.6 Appendix 6. SHRIMP POUND NET SETS (<strong>Shrimp</strong> Traps)I. Issue:What is the appropriate definition and allowable use <strong>of</strong> the relatively new shrimp trapswhich are made <strong>of</strong> hardware cloth, have V-shaped wings, and are presently used in thesouthern part <strong>of</strong> the state?II.Background:There are two existing shrimp pound nets in East Thor<strong>of</strong>are Bay, a tributary <strong>of</strong> CoreSound in Carteret County. These have been permitted since approximately 1995. They haveleads approximately 100 yards in length and a pound <strong>of</strong> 1 ½” stretched mesh. Copper-treatednylon webbing is used for the wings and pounds. These “traditional” pound nets are usedcommercially to catch primarily brown shrimp in July and August.Last year, the DMF became aware <strong>of</strong> the emergence <strong>of</strong> a new form <strong>of</strong> shrimp pot/trapwith wings. These traps are constructed <strong>of</strong> 5/8” rigid hardware cloth and have two V-shapedwings to direct the shrimp into the traps. These wings can be up to 50 feet in length and thedistance between the ends <strong>of</strong> the wings is approximately 80 feet. The traps are mostsuccessful when set during a flood tide with one <strong>of</strong> the wings against a bulkhead or marshshoreline. The devices are staked or anchored in place. The ends <strong>of</strong> the wings face away fromthe direction <strong>of</strong> the tide flow when deployed.The proliferation <strong>of</strong> these shrimp traps in the relatively confined waters <strong>of</strong> the SouthernDistrict caused concern due to interference with traditional uses <strong>of</strong> the waters for shrimptrawling and navigation. The solution adopted to prevent this possible problem was todesignate these shrimp traps as shrimp pound net sets. This designation requires a permit thatis only available to applicants that have a Standard or Retired Commercial Fishing License(SCFL). After the proposed sets are marked and the application is completed, there is a 20 daypublic comment period, during which the public has an opportunity to see where the nets areproposed and comment on activities that the set would possibly interfere with. The pound netdesignation has had the desired effect <strong>of</strong> preventing the rapid and uncontrolled growth <strong>of</strong> thesedevices. Four applications in the Southern District have been denied by the Director and threeadditional pound net application packages have been sent out as <strong>of</strong> August 19, 2004.The <strong>Shrimp</strong> Fishery Management Plan Advisory Committee has been given apresentation on these devices at one <strong>of</strong> their meetings. The devices are very efficient if placedin a productive area with the proper tidal flow. There is very little bycatch involved, it can bereleased alive, and small shrimp are able to escape through the meshes. Several <strong>of</strong> the ACmembers and staff have expressed the need to examine the possibility <strong>of</strong> using this (or a scaleddown version <strong>of</strong> this gear) as a recreational shrimp harvest gear and a possible alternative toRecreational Commercial Gear shrimp trawls. There is evidence that a smaller version <strong>of</strong> theshrimp trap (perhaps as small as 10 to 20 feet long in total) is very effective.Under the present MFC Rules, the gear is a shrimp pound net and, by virtue <strong>of</strong> thatdefinition, several obstructions exist to the use <strong>of</strong> that gear as a “recreational” gear. Theapplicant must have a SCFL. The pound nets must not interfere with traditional uses like shrimptrawling and gill netting as well as navigation. In the confined waters <strong>of</strong> the south, where spaceis at a premium, these conditions are very limiting. Also, our present pound net set rules requirea 1000 yard distance between new pound nets. If several nets were to be applied for along a218
certain bulkhead or shoreline, only one or two could be approved. These devices are <strong>of</strong>tenused in front <strong>of</strong> waterfront houses by their owners in congested areas with houses lining theentire bank. In addition, gill nets cannot be set within 200 yards <strong>of</strong> a functional pound net, sothis will either prevent many sets from being permitted (existing uses), or prevent gill nets frombeing set in the vicinity <strong>of</strong> the sets.Therefore, the immediate problem <strong>of</strong> preventing the uncontrolled proliferation <strong>of</strong> thesedevices has been dealt with, but if this effective, non-bottom disturbing, no bycatch producinggear is to be allowed, how should it be modified, what should we call it and where should it beused?III.Discussion:The person who gave the presentation to the <strong>Shrimp</strong> AC on these devices said that,although he used a trap with a distance between the ends <strong>of</strong> the wings or 80 feet, a smallerversion <strong>of</strong> this device 10 feet long is effective in catching shrimp. There are two components <strong>of</strong>the use <strong>of</strong> this gear; recreational and commercial. The gear is now considered commercial andis not included in the list <strong>of</strong> noncommercial gear that appears in Rule 15A NCAC 03I .0101 (b)(1). An option for allowing recreational use is to begin an effort to define a scaled-down version<strong>of</strong> the existing traps that could be used with a Recreational Commercial Gear License (RCGL).This definition would include the maximum dimensions, mesh size, marking requirements, andattendance requirements. The MFC would be asked to add this gear to the list <strong>of</strong> allowableRCGL devices and one trap per license could be allowed for recreational uses.Any shrimp trap whose dimensions exceeded the parameters specified in the definitionwould be considered a shrimp pound net set and be subject to the requirements <strong>of</strong> the PoundNet Set Rule, including permitting, SCFL requirement for eligibility and the public notice period.To address the problems <strong>of</strong> a 1000 yard minimum distance between sets and the prohibition <strong>of</strong>gill nets within 200 yards <strong>of</strong> active pound nets, the shrimp traps could be exempted from thoserequirements in the Pound Net Set Rule. The locations <strong>of</strong> the sets would be determined by tidalflow.In order to come up with a comprehensive definition <strong>of</strong> shrimp traps, their dimensions,proper mesh sizes, etc., research should be conducted on how and where these devicesfunction and what requirements are appropriate for their recreational use. By adopting theconcept, the MFC could adopt rules when that research is completed without waiting for therevision <strong>of</strong> the <strong>Shrimp</strong> <strong>FMP</strong> in five years.IV.Current Authority:15A NCAC 3J .0107 Pound Net Sets15A NCAC 3J .0301(l) It is unlawful to use pots with leads or leaders to take shrimp. For thepurposes <strong>of</strong> this Rule, leads or leaders are defined as any fixed or stationary net or device todirect fish into any gear used to capture fish. Any device with leads or leaders used to capturefish is not a pot.15A NCAC 3I .0101 (b) (29) Pound Net Set. A fish trap consisting <strong>of</strong> a holding pen, one or moreenclosures, lead or leaders, and stakes or anchors used to support such trap. The lead(s),enclosures, and holding pen are not conical, nor are they supported by hoops or frames.15A NCAC 3I .0101 (b) (2) Fixed or stationary net. A net anchored or staked to the bottom, orsome structure attached to the bottom, at both ends <strong>of</strong> the net.15A NCAC 3J .0103 (d) (1) It is unlawful to use gill nets within 200 yards <strong>of</strong> any pound net with219
lead and pound or heart in use.V. Management Options:1. Status Quo+ controlled growth and placement+ reduced interference with traditional uses+ permitted devices uniformly marked- “recreational” use discouraged- no gill netting within 200 yards- 1,000 yard minimum distance between pound nets2. Define a scaled-down “recreational” version <strong>of</strong> this device in MFC Rule and add it to alist <strong>of</strong> “recreational” commercial gear in 15A NCAC 3O .0302.+ allows recreational use <strong>of</strong> device in manner in which it is presently used+ requires no Pound Net Set Permit (May require new Saltwater FishingLicense)- unrestricted use and interference with traditional uses- disputes over setting “upcurrent” <strong>of</strong> someoneRecommendations:AC, DMF and MFC Recommendations: Investigate the use <strong>of</strong> shrimp traps as RCGL gearincluding size restrictions and location.220
12.7 Appendix 7. MANAGEMENT OF FIXED GEAR IN THE INSHORE SHRIMP FISHERYI. Issue:Management <strong>of</strong> Channel netsII.Background:The use <strong>of</strong> fixed gear to harvest shrimp in areas that are closed to the use <strong>of</strong> mobilegears (trawls, skimmers, seines and butterfly nets) is a common practice in the areas betweenHarker’s Island and Topsail Inlet. The primary fixed gear used to catch shrimp in these areas isa channel net. While channel nets are allowed in areas closed to trawling, insufficient tidalcurrent throughout much <strong>of</strong> southeastern North Carolina limits their use to only a small portion<strong>of</strong> these closed areas.User conflicts between channel netters and mobile gear users have developed over theyears. Mobile gear fishermen have complained about channel nets being allowed in closedareas as well as being allowed to fish during the weekend trawl closure. Channel netterscounter that they are not able to work every day since they must have a period <strong>of</strong> ebbing tideduring the night. Spatial competition for the “best sets” among channel net fishermen is anotherconflict that the <strong>Division</strong> <strong>of</strong> <strong>Marine</strong> <strong>Fisheries</strong> (DMF) has dealt with over the years. This fishery isregulated by proclamation and some areas in the Cape Fear, New River and the IntracoastalWaterway (ICWW) have been closed to address user conflicts and navigational issues in thesewaters.Historically, channel nets have contributed almost all (>99%) <strong>of</strong> the fixed gear shrimplandings in North Carolina. During the period 1972-2003, landings fluctuated from a low <strong>of</strong>21,113 lbs in 1977 to a high <strong>of</strong> 596,511 lbs in 1980 (Figure 1). Landings have been moreconsistent in the past ten years, ranging from a low <strong>of</strong> 181,915 lbs in 1998 to 284, 257 lbs in1999 and comprising 4.4% <strong>of</strong> the total inshore shrimp landings. Other gears that harvested lessthan 10% <strong>of</strong> the inside shrimp landings (1994-2003) include skimmer trawls, gill nets and shrimppots (Figure 2). Otter trawls dominated inside shrimp landings during 1994-2003 accounting forapproximately 88% <strong>of</strong> the landings.The majority <strong>of</strong> the shrimp harvested with channel nets are captured and landed inCarteret, Onslow and Pender counties. Between 1994-2003, these three counties contributed91-99% <strong>of</strong> the total channel net landings with ten-year means <strong>of</strong> 35, 54 and 6% respectively.<strong>Shrimp</strong> is an annual crop and the relative abundance in any given year appears todictate the effort/trips in the fishery. Effort in the channel net fishery is categorized here by thenumber <strong>of</strong> trips and participants in the fishery since 1994 (Figure 3). There has been a declinein participants in this fishery since 1994 from188 participants in the fishery during 1995to only88 participants in 2003, a 53% reduction. Channel net landings were queried for participantswho landed more 2000 lbs. An average <strong>of</strong> 32 participants harvested 73% <strong>of</strong> the channel netlandings between 1994-2003 (Table 1).Blue crabs are a marketable bycatch component <strong>of</strong> the channel net fishery. Concernover channel netters targeting blue crabs prompted the <strong>Marine</strong> <strong>Fisheries</strong> Commission to enactregulations limiting the harvest <strong>of</strong> blue crabs to 50 percent <strong>of</strong> the total weight <strong>of</strong> the combinedshrimp and crab catch or 300 pounds, whichever is greater. This new rule will become effectivein 2005.221
700000600000500000400000Figure 1.Pounds (Millions)LBS30000020000010000000.90.80.70.60.50.40.30.20.101972197319741975197619771978197919801981198219831984198519861987YEAR1988198919901991199219931994199519961997199819992000200120022003Channel net landings 1972-2003 (courtesy <strong>of</strong> the DMF trip ticket program)1994 1995 1996 1997 1998 1999 2000 2001 2002 2003Channel Net Skimmer Trawl OtherFigure 2.Inside landings from gears other than shrimp trawls (courtesy <strong>of</strong> the DMF trip ticketprogram).222
250300020025002000# Participants1501001500# Trips100050ParticipantsTrips50001994 1995 1996 1997 1998 1999 2000 2001 2002YEAR0Figure 3.Table 1.Effort in the channel net fishery, 1994-2003 (courtesy <strong>of</strong> the DMF trip ticketprogram.Participants landing at least 2,000 lbs <strong>of</strong> shrimp in channel nets (courtesy <strong>of</strong> theDMF trip ticket program).Year Participants PoundsPercent <strong>of</strong>total Trips Value1994 29 125,832 66.8% 1,333 $273,8821995 35 214,820 77.6% 1,688 $453,7221996 30 154,570 75.9% 938 $350,7791997 29 135,384 68.5% 1,392 $327,5471998 21 136,859 74.0% 1,260 $306,8601999 40 238,709 79.1% 2,104 $489,9992000 36 224,314 74.4% 1,758 $552,4132001 28 148,957 56.0% 1,160 $320,2822002 34 218,164 69.7% 1,569 $386,2992003 36 220,482 85.0% 1,371 $360,728III.Discussion:Fishermen in Onslow and Pender counties who utilize channel nets to harvest shrimptypically return to the same set night after night. The majority <strong>of</strong> fishermen leave their anchorsand marking buoy in place throughout the season. Anchors for each set are strategicallylocated so the fishermen can fish as close to the ICWW channel as possible and still beconform to current regulations (3J .0106 (a) (3-4). DMF does not require these sets to bepermitted, nor is there a minimum distance requirement between sets. The problem with223
minimum distance requirements is that the distance between sets may or may not affect thecatching ability <strong>of</strong> one channel net relative to another one. Rather, it is more related to current,bottom topography, and the contour <strong>of</strong> the channel. Conflicts between users as well asnavigational issues that have arisen in the past have been dealt with on an as needed basiswith DMF staff taking on the role <strong>of</strong> mediator. During the 1990’s until 2004, DMF has exercisedproclamation authority in four instances to mitigate navigational and or user conflicts. The DMFalso attempted to control user conflict by permitting channel nets in New River. This effort wasunsuccessful because it was considered limited entry to restrict the number <strong>of</strong> permits. Theproblems have improved in the last few years and the DMF feels that the necessary tools are inplace to manage this segment <strong>of</strong> the fishery.Under current regulations, with the exception <strong>of</strong> the Cape Fear River, channel netfishermen have been allowed to work in areas that are closed to shrimp trawling. The DMF hasreceived negative comments about this practice even though the closed areas in which there isenough current to allow channel nets to fish effectively is limited. Channel nets generally catchlarger shrimp that are migrating to the ocean from the estuary and the capture <strong>of</strong> large amounts<strong>of</strong> unmarketable shrimp is rare. An exception to this would be the Cape Fear River, where theover exploitation <strong>of</strong> small shrimp with channel net gear necessitated a proclamation restrictingchannel nets in closed trawling areas The use <strong>of</strong> channel nets has been permitted during theweekend trawl closure to allow the harvest <strong>of</strong> shrimp that are migrating to the ocean, apercentage <strong>of</strong> which would not be harvested by trawlers.IV.Current Authority:North Carolina <strong>Fisheries</strong> Rules for Coastal Waters (15A NCAC)3J .0106 – CHANNEL NETS3L.0102 – WEEKEND SHRIMPING PROHIBITED3L.0103 – PROHIBITED NETS AND MESH SIZESV. Management Options/Impacts(+ potential positive impact <strong>of</strong> action)( - potential negative impact <strong>of</strong> action)1) Status quo+ Allows flexibility to deal with problems as they arise.+ Passive gear has less by-catch and bottom disturbance associated with itsuse.- Conflicts with other user groups.- Interference with navigation.2) Restrict use to areas and times available to mobile gears+ Would treat everyone the same.- Increased user conflicts- Decreased area for fixed gear users by rule- Decreased fishing time available for fixed gears224
Recommendations:AC and MFC Recommendation: The Advisory Committee concurred with the DMF’srecommendation on the closure <strong>of</strong> areas to fixed gear. They also recommended that no part <strong>of</strong>a channel net set be allowed in the marked navigation channel from New River Inlet to theIntracoastal Waterway.DMF Recommendation: The DMF recommends that the closed areas up-current <strong>of</strong> areas opento mobile gears be restricted to use <strong>of</strong> fixed gears south <strong>of</strong> Highway 58 bridge. This wouldinvolve channel nets sets upstream <strong>of</strong> the Highway 172 bridge over New River and those north<strong>of</strong> the Highway 50 swing bridge in Surf City. These areas would open when they are opened tomobile gears. The DMF proposes no rule change and would do this by proclamation.225
12.8 Appendix 8. THE RECREATIONAL SHRIMP TRAWL FISHERY IN NORTHCAROLINAI. Issue:The harvest <strong>of</strong> Penaid shrimp using the Recreational Commercial Gear LicenseII.Background:On August 14, 1997, the <strong>Fisheries</strong> Reform Act was signed into law. One aspect <strong>of</strong> thislaw was the creation <strong>of</strong> the Recreational Commercial Fishing License (RCGL). According to the<strong>Fisheries</strong> Moratorium Steering Committee (MSC), a group that provided the recommendationsfor the FRA, the purpose <strong>of</strong> creating this license was to: (1) allow individuals and families whohave traditionally accessed the State’s public trust fishery with commercial gear to supplythemselves with fresh seafood; (2) limit the effort that may be expended by this class <strong>of</strong>fishermen both individually and as a group; and (3) implement the principle that all persons whoharvest state public trust resources pay for that privilege by investing in coastal fisheriesconservation and management (Moratorium Steering Committee, 1996). DMF began sellingthis license July 1, 1999.The MSC also recommended that the North Carolina <strong>Marine</strong> <strong>Fisheries</strong> Commission(MFC) be authorized to establish specific gear limits with “standing advisory committees” andthose limits could vary by region. The MFC should be required to re-examine and revise thegear limitations on a recurring basis. The MSC further recommended that the RCGL berestricted to the use <strong>of</strong> the following gears and amounts during the period final gear limitationrules are being developed by the MFC: one – 100 yds <strong>of</strong> gill net; 2) five crab/fish pots and 3) asingle trawl with a headrope less than or equal to 25 ft. These limits were meant to serve as thestarting point for the MFC rule development on RCGL gear and were the result <strong>of</strong> extensivepublic input and deliberation by the MSC.The FRA provided that the MFC: 1) shall adopt rules authorizing the use <strong>of</strong> a limitedamount <strong>of</strong> commercial fishing equipment or gear for recreational fishing under a RCGL(G.S.113-173(c); 2) may authorize the limited use <strong>of</strong> waters commercial gear on a uniform basisin all coastal fishing waters or may vary the limited use <strong>of</strong> commercial gear within specifiedareas <strong>of</strong> the coastal fishing waters; and 3) shall periodically evaluate and revise the authorizeduse <strong>of</strong> commercial gear for recreational fishing. The MFC deliberated on those measures attheir December 10-11, 1999 meeting in Kill Devil Hills, NC. The DMF’s recommendation wasone trawl net, 26 ft headrope. However, several commissioners expressed reservations overDMF’s recommendation. Commissioners Phillips, Nifong, and M<strong>of</strong>fit expressed concerns withshrimp trawls being used recreationally. Commissioners Fickling and Clem recommended thatthe shrimp trawls used recreationally be phased out instead <strong>of</strong> cut <strong>of</strong>f completely. ChairmanJohnson recommended a 26-ft net with nonmechanical retrieval and a five-year phase-out(minutes MFC meeting, Dec 10-11). The rule (3O .0302 (2)) that was passed by the MFC readsas follows: One shrimp trawl with a headrope not exceeding 26 feet in length per vessel.Mechanical methods for retrieving the trawl are not authorized for recreational purposes,including but not limited to, hand winches and block and tackle.In 1998 the DMF completed a survey <strong>of</strong> persons that had commercial fishing licenses,but did not sell their harvest. The goal <strong>of</strong> the survey was to provide data on potential RCGLusers. Six thousand three hundred forty eight licensees were sent surveys. Survey results226
indicated 20% <strong>of</strong> the persons used shrimp trawls, the average size was a < 26 ft headrope, andthe nets ranged in size from 15 to 75 ft. <strong>Shrimp</strong> trawls were most commonly used in the NeuseRiver and the southern part <strong>of</strong> NC. <strong>Shrimp</strong> was the fourth ranked species taken recreationallywith commercial gear, ranking behind spot, flounder and blue crabs. Fishermen used shrimptrawls an average <strong>of</strong> 6 to 16 days, depending on the area.The MFC has received two petitions for rulemaking since 2002 to limit the RCGL take <strong>of</strong>shrimp to no more than a 32 quart cooler and to restrict trawling by RCGL trawlers to Friday andSaturday and for 12 hours immediately following the opening <strong>of</strong> an area. The petitions weresubmitted to address the illegal sale <strong>of</strong> shrimp. The MFC denied those because enforcementconcerns were addressed through present criminal and civil statutory authority. Additionally, thefour regional committees recommended denial and there was a scarcity <strong>of</strong> data (at the time) onshrimp harvest by RCGL holders.After the RGCL was passed in 1999 and until March 2002, fishery managers knew howmany RCGLs had been sold, but had no data on the amount <strong>of</strong> seafood harvested, what gearthey used and where they fished. This changed in March 2002 when two independent surveyswere initiated by DMF to collect data from the RCGL user group. The first survey was a census<strong>of</strong> the 2001 RCGL population with the objective <strong>of</strong> obtaining baseline data on the social andeconomic characteristics <strong>of</strong> the RCGL community. Data collected included information on targetspecies, waterbodies fished, gears fished, seasonality <strong>of</strong> species, and fishing effort. The secondsurvey was a monthly survey with an objective <strong>of</strong> collecting data that could be used to estimatemonthly catches and effort <strong>of</strong> major species <strong>of</strong> finfish and shellfish caught by RCGL holders.Monthly, in 2002 and 2003, 30% <strong>of</strong> the RCGL population was mailed surveys. Response ratesfrom these surveys ranged between 23 and 44 %. Data obtained from these responses werethen extrapolated to the entire population to generate estimates. All data and analysesreferenced in this issue paper from this point on were derived from these two surveys.III.DiscussionThe majority <strong>of</strong> RCGL license holders are located in the coastal and coastal plaincounties <strong>of</strong> North Carolina (Figure 1) although there is representation from almost every countyin the state.227
Individuals01 to 1011 to 100101 to 250251 to 1,000Figure 1.Density <strong>of</strong> RCGL license holders in North Carolina.The number and the months RCGL licenses were sold in 2001 and 2002 are similar.Since the license expires a year from the date sold, the number <strong>of</strong> licenses outstanding duringany one month <strong>of</strong> the year fluctuates. Licenses issued decreased significantly in 2003 (Figure2). The peak in license sales evident during the spring and summer <strong>of</strong> 2001 and 2002 nevermaterialized in 2003, resulting in a lower number <strong>of</strong> licenses outstanding. The reason for thisdecrease is not clearly understood but might reflect weakness in the general economy.228
Monthly Number <strong>of</strong> Licenses7,0002001 2002 2003Number <strong>of</strong> Licenses6,5006,0005,5005,0004,500JanAprJulOctJanAprFigure 2. Outstanding RCGL licenses by month and year 2001-03.JulOctJanAprJulOctRCGL trawlers landed 101,595 lbs <strong>of</strong> shrimp in 2002 and 47,511 lbs in 2003, a 53%reduction. A substantial reduction in harvest also occurred in the commercial fishery wherelandings decreased 38% year to year. RCGL landings represented only 1.0% <strong>of</strong> totalcommercial landings in 2002 and 0.7% in 2003. Commensurate with the year to year decline inRCGL shrimp landings and license sales, there was also a significant decline in the effort ornumber <strong>of</strong> trawling trips between 2002 and 2003. There were 5,373 trawling trips in 2002 asopposed to only 2,646 trips in 2003, a decrease <strong>of</strong> 51%. Other gears harvesting shrimpincluded seines and shrimp pots but the amounts harvested with these gears were negligible[
NorthernPamlicoCentralSouthernFigure 3.Regions used to describe distribution <strong>of</strong> RCGLs.The amount <strong>of</strong> trips and landings relative to the four coastal regions were similar in 2002and 2003 (Figure 4). The Pamlico region had the highest proportion <strong>of</strong> landings and effort/tripsfollowed by the Southern region. Landings and effort showed little change in either <strong>of</strong> theseareas between 2002 and 2003. In the Northern area, effort increased from 15 to 20% andlandings increased from 8 to 18%. Both effort and landings decreased between years in theCentral region, from 19 to 11% and 19 to 09% respectively.230
EffortLandings44%15%19%200248%8%19%22%20%200325%18%45%9%45%11%26%26%NorthernPamilcoCentralSouthernFigure 4. Distribution <strong>of</strong> Effort and Landings in North Carolina.Acreages <strong>of</strong> estuarine waters where RCGL harvesting activities occur are differentacross the Northern, Pamlico, Central, and Southern regions (Figure 5). The Southern area hasjust for 3% <strong>of</strong> the total waters but averaged 25.5% <strong>of</strong> the RCGL shrimp harvest in 2002-03. ThePamlico area, with 56% <strong>of</strong> the acreage, had the highest shrimp harvest with an average <strong>of</strong>46.5% during 2002-03. The Central Area has 8% <strong>of</strong> the total acreage and averaged 15% <strong>of</strong> thelandings in 2002-03. The Northern area has the second highest acreage (33%) and the lowestaverage landings (13%) over 2002-03.231
Central8%Southern3%Northern33%Pamlico56%Figure 5.Acreages <strong>of</strong> coastal waters by region.The 2001 survey provided statistics that characterize the gear and effort generated byRCGL shrimp trawlers (Table 1). These statistics are based on data collected during 2002 and2003. These numbers reveal that the typical RCGL shrimper makes 4 trips a year consisting <strong>of</strong>13 tows and most likely uses a trawl with a 22 foot headrope.Based on 2002 survey results, after shrimp, blue crab (15, 417 lbs) and flounder (1,565lbs) were the primary species caught in RCGL trawls that were kept. The dominant discardedspecies were blue crab, flounder, spot and croaker.Table 1.Yearly statistics on trips, tows, and trawl headrope size for RCGL users.Minimum Maximum Mean Median TypicalNumber <strong>of</strong> trips 1 20 4 3 1 to 8Number <strong>of</strong> tows 6 25 13 13 10 to 15Size <strong>of</strong> headrope (ft) 10 26 22 24 20 to 25These results presented for the years 2001-03 identify the number <strong>of</strong> RCGL holders andattempt to quantify the impacts these license holders may be having on shrimp stocks. Asmentioned earlier, when the MFC decided to include shrimp trawls as an allowable gear underthe RCGL license, it was with reservations by a few commissioners. Now that the license hasbeen in effect for almost 5 years and characterization data is available, it may be prudent toexamine this issue again.232
IV.Current AuthorityNorth Carolina <strong>Fisheries</strong> Rules for Coastal Waters (15A NCAC)3L .0100 – SEASON3L .0102 – WEEKEND SHRIMPING PROHIBITED3L .0103 – PROHIBITED NETS AND MESH SIZES3L .0104 – UNLAWFUL TO USE OR TAKE3O .0301 – ELIGIBILITY FOR RECREATIONAL COMMERCIAL GEAR LICENSE3O .0302 – AUTHORIZED GEARG.S. 113-173 – RECREATIONAL COMMERCIAL GEAR LICENSEV. Management Options/Impacts(+ potential positive impact <strong>of</strong> action)( - potential negative impact <strong>of</strong> action)1) Status quo (26’ headrope, no catch limits)+ No further restrictions on the use <strong>of</strong> shrimp trawls by RCGL license holders, Noregulatory action- Does not address exploitation concerns2) Impose limits on the amount <strong>of</strong> shrimp a RCGL license holder may possess+ Reduce potential <strong>of</strong> illegal sales+ May reduce user conflicts+ Potential reduction in bycatch/effort- May increase waste by encouraging high grading- Possible law enforcement issues3) Prohibit trawls as an allowable gear under RCGL license+ Reduce user conflicts+ Reduce bycatch/effort+ Decrease in amount <strong>of</strong> bottom disturbing gear+ Increase demand for commercially caught shrimp- No more shrimp for personal consumption, except cast nets & seines- Loss <strong>of</strong> revenue for gear suppliers- Potential for increase in illegal shrimping activities4) Area restrictions under RCGL license+ Regional conflicts may be addressed+ High grading not an issue+ Limit bottom disturbing devices in certain areas- May concentrate more RCGL shrimpers in less area5) Gear Restrictions (headrope size, mesh size)+ Reduction in bycatch/effort+ Reduce user conflict (less entanglement)+ Keeps traditional revenue stream for netmakers- Effort may increase to account for decrease in gear size233
6) Seasonal / Daily - Weekly Restrictions+ Reduce effort/bycatch+ Reduce user conflicts+ Still allow limited recreational shrimp fishery- May effect revenue stream <strong>of</strong> netmakers- Less choice about when one can shrimpRecommendations:AC Recommendation: Status quo and allow use <strong>of</strong> skimmer trawls as RCGL gear with a totalheadrope less than 26 feet.DMF and MFC Recommendation: Status quo with a 48 quart cooler heads on maximum limiton RCGL harvest (two limits if more than license holder is on vessel). Allow use <strong>of</strong> skimmertrawls as RCGL gear with a total headrope less than 26 feet.234
12.9 Appendix 9. SHRIMP MANAGEMENT BY AREA IN NORTH CAROLINAHistorically, the DMF <strong>of</strong> <strong>Marine</strong> <strong>Fisheries</strong> (DMF) has used a number <strong>of</strong> criteria todetermine if trawling should be allowed in estuarine waters. These criteria include habitatissues such as aquatic vegetation, water depth and bottom types; shrimp size and abundance;economic and social factors; user conflicts; and by-catch issues.DMF has utilized rules and proclamations to manage trawling in internal coastal waters.The intention <strong>of</strong> these rules and proclamations has been to allow the harvest <strong>of</strong> shrimp andcrabs in estuarine waters but prohibit directed finfish trawling. Openings and closings <strong>of</strong> specificareas are based primarily on the size <strong>of</strong> the shrimp.The closure <strong>of</strong> nursery areas and the protection <strong>of</strong> sea grass beds through rules, andproclamations are designed to minimize the bottom-disturbing effects <strong>of</strong> trawling (see habitatsection <strong>of</strong> <strong>FMP</strong>). Trawling is limited primarily to the large bodies <strong>of</strong> waters such as the riversand sounds. Shoals, wrecks, obstructions, oyster rocks, and algal and bryozoan growth makesome <strong>of</strong> this open water area inaccessible to trawls. There are also areas opened to shrimpingthat receive very little effort because shrimp abundance is low.Shellfish management areas (SMAs) are another critical habitat where trawling isprohibited (15A NCAC 03N.0104 and 0105.03J.0103). Although these regulations protectphysical damage by trawls to the substrate, bottom-disturbing gear used adjacent to the SMAsimpacts oyster reefs indirectly by re-suspending sediment. As sediment disperses away fromthe disturbance and settles to the bottom, it can bury oyster larvae, adults, or shell, deterringsuccessful recruitment <strong>of</strong> larvae due to lack <strong>of</strong> an exposed hard substrate (Coen, et al. 1999).Additionally, excessive sedimentation can also harm shellfish by clogging gills, increasingsurvival time <strong>of</strong> pathogenic bacteria, or increasing ingestion <strong>of</strong> non-food particles (SAMFC1998).DMF conducts a regular sampling program to monitor shrimp size and abundance andtakes appropriate action based on the samples. Waters eligible to be opened to trawling mayalso be closed if the size <strong>of</strong> the shrimp is too small. Closures <strong>of</strong> this nature are primarilyinfluenced by economics since small shrimp have little value and if there is no market, theresource is wasted. Affected areas include those where shrimp size changes predictably basedon annual cycles and environmental conditions as well as those areas where the habitat haschanged in response to physical changes such as inlet closures and shoaling. Waters have alsobeen closed in order to reduce or eliminate conflicts with other users and traditional uses suchas navigation. These would include closure <strong>of</strong> crab pot areas and navigation channels whereshrimping activity has been problematic.To reduce finfish bycatch the DMF utilizes Special Secondary Nursery Areas (SSNA).This rule (15A NCAC 03R .0105) makes it unlawful to use trawl nets in these waters, except thatthe <strong>Fisheries</strong> Director may, by proclamation, open any portion <strong>of</strong> this area to shrimp or crabtrawling from August 16 through May 14. Management rationale for this rule includedminimizing waste by delaying the trawl opening date to reduce the finfish bycatch and to ensurecatches <strong>of</strong> larger shrimp. Historical data (since 1972) collected by DMF indicates these waterssupport large aggregations <strong>of</strong> commercially important finfish as well as shellfish andcrustaceans.A criteria that has not been applied to decisions on trawling areas is the suitability <strong>of</strong> thearea for use <strong>of</strong> alternative gears. The <strong>Shrimp</strong> Advisory Committee (AC) has discussed this235
subject on several occasions as it relates to channel nets, skimmers and shrimp traps.In addition to restricting trawling to suitable habitats, DMF requires bycatch reductiondevices (BRDs) to be installed in specific tailbag locations in order to reduce the incidental catch<strong>of</strong> juvenile finfish. The strategy <strong>of</strong> DMF has been to protect the sensitive nursery areas andcritical habitats while working to reduce bycatch as much as possible (see issue paper onbycatch).DMF has applied these criteria to determine which areas to allow trawling activity in thepast. The following papers will apply these variables to assess the suitability <strong>of</strong> areas that arecurrently opened to trawling and whether to make any changes to them.<strong>Shrimp</strong> Management in the Southern Area (Inside waters)DMF has been managing the shrimp harvest since the early 1970’s. In 1977, based onsampling conducted over a number <strong>of</strong> years the DMF designated nursery areas (both primaryand secondary) throughout the State that were closed to all bottom disturbing gear, includingshrimp trawls. Many <strong>of</strong> these nursery areas are in the southern part <strong>of</strong> the State and includethose areas that are most biologically sensitive to trawling. Additional areas were closed in the1980s in reaction to an increase in fishing effort. Time and area closures were the only toolsavailable to deal with the increase in effort. The net result <strong>of</strong> all these closures is thatapproximately one-third <strong>of</strong> the waters in Onslow, Pender, New Hanover and Brunswick countiescan be opened to shrimp trawling. However, portions <strong>of</strong> these waters may remain closed or notbe open at all depending on the size <strong>of</strong> shrimp observed in DMF’s samples. While this strategyhelps protect these areas, it forces the fishery to operate in a smaller area thus increasing userconflicts.The areas that can be opened to shrimping are typically located either in or landward <strong>of</strong>the Intracoastal Waterway (IWW) which runs the entire length <strong>of</strong> the Onslow, Pender, NewHanover and Brunswick counties coastline. The heads-on counts used to determine whether toopen an area vary by area based on historical sampling which indicates at what size shrimptend to migrate from different water bodies. In Brunswick and portions <strong>of</strong> New Hanovercounties, where shrimp migrate at smaller sizes, DMF attempts to open on a 40-50 countshrimp. In Onslow and parts <strong>of</strong> Pender counties, sampling has shown that a 20-30 count canbe attained before migration occurs. Channels that connect the IWW with the Atlantic Oceanare normally left open at all times to allow some harvest <strong>of</strong> shrimp as they migrate from closedareas to the ocean. Trawling in these migration routes has become the subject <strong>of</strong> discussionamongst shrimpers as well as the public because <strong>of</strong> concerns about bycatch as well asinterference with navigation.236
<strong>Shrimp</strong> Management in the Central DistrictManagement <strong>of</strong> shrimping in the Central District takes place from the White Oak Riveron the Onslow/Carteret County line to Core Sound in Carteret County. The Central District alsomanages the south side <strong>of</strong> the Neuse River in Craven County. Areas that are open and closedto shrimping through proclamation include: the White Oak River, Newport River, West Bay/LongBay, several Core Sound tributaries as well as Adams Creek, South River and the mouth <strong>of</strong>Clubfoot Creek, located on the south side <strong>of</strong> the Neuse River.As with the Pamlico district area, the DMF issues a proclamation during the first week <strong>of</strong>June showing shrimp lines for the beginning <strong>of</strong> the season. This proclamation establishesclosures in White Oak River, Newport River, Jarrett Bay and the West Bay-Long Bay andThor<strong>of</strong>are Bay areas. This proclamation also designates closures <strong>of</strong> the Special SecondaryNursery Areas (SSNA) located in Core Sound. Once this proclamation is issued, the DMFbegins sampling areas for openings. The DMF conducts nighttime sampling in both the closedportion and the open portion <strong>of</strong> a waterbody with a small 20-foot otter trawl with ½ inch barmesh in the body and ¼ inch bar mesh in the tailbag. Tow times are between 5 minutes and 20minutes. <strong>Shrimp</strong> are counted and a subset <strong>of</strong> the sample is measured to determine sizes orcounts. Salinities and water temperatures are also recorded. Target counts vary dependent onthe waterbody. In most areas a “harvestable size” ranges from 26-30 count to 31-35 count(heads on). In an area like the White Oak River, where shrimp do not grow very large, the countis around 45-55. Based on this sampling, lines may be moved by proclamation to protect smallshrimp until they are large enough to harvest.White Oak RiverRecreational shrimpers as well as a few commercial shrimpers use the White Oak River.<strong>Shrimp</strong> from there supply a market for bait shrimp. Sampling for opening White Oak Rivergenerally begins around the end <strong>of</strong> June. Several stations are checked, usually in earlymorning hours before sunrise. Cahoon Slough and the Turnstake stations usually have a goodrepresentation <strong>of</strong> what is coming down the river. The DMF typically opens White Oak aroundthe middle portion <strong>of</strong> July, usually between July 10 and July 20. The river may or may not closedue to small white shrimp. Over the past few years, once the river has been open, a closure forsmall whites has not been needed as the two species seem to segregate within the river verywell with small whites staying up the creek above the closure line in the lower salinities while thelarger brown shrimp have moved down in the open area. However, when there is good sign <strong>of</strong>small white shrimp, the river has been closed in September. The line has also been adjusted toallow for shrimping in the lower portion <strong>of</strong> the river while protecting small whites that have spilledover the normal closure line. Issues that must be considered in the management <strong>of</strong> this riverbesides shrimp size are weather conditions and lunar stage. An early northeast wind with a lot<strong>of</strong> rain or a hurricane can force the small shrimp to run before the normal opening dates. A fullmoon on top <strong>of</strong> that may also cause the DMF to open on a smaller count. Occasionally, shrimpwill not reach a 45-55 count but will remain at a small size throughout the season. In this case,the DMF will open on a smaller count. Adjusting the line is also difficult due to the amount <strong>of</strong>oyster rocks in the creek. <strong>Shrimp</strong>ers like to tow on the line, therefore placement <strong>of</strong> the line overoyster rock can lead to habitat destruction <strong>of</strong> those rocks.Bogue SoundBogue Sound for the most part has permanent closure lines. The sound is closed totrawling on the north or mainland side <strong>of</strong> the Intercoastal Waterway (ICW) and in a portion <strong>of</strong> the237
western part <strong>of</strong> the sound. These areas remain closed because <strong>of</strong> the nature <strong>of</strong> the bottom.The area along the northern side <strong>of</strong> the ICW acts as a nursery area and also boarders severalprimary nursery areas. Seagrass beds with bay scallops are located in the closed portion <strong>of</strong> thewestern part <strong>of</strong> Bogue. There have been requests made to open the western side <strong>of</strong> the ICW,particularly around Broad Creek. These request usually come from skimmer trawl fishermenwho have problems fishing in the waterway. So far, the DMF has not opened this area becauseit functions as a nursery area for shrimp and other species.Newport RiverNewport River lines that have been used in the recent past are the Hardesty Farm line;the White Rock line and the Turtle Rock line. The Hardesty Farm line is the lowest line in theriver and is usually established in June. The White Rock line delineates the special secondarynursery area and the Turtle Rock line delineates the primary nursery area and is the highest linethe DMF may use to open the river to trawling. Over the past several years, the White Rock linehas not been used. This line is harder to trawl because <strong>of</strong> the shallowness <strong>of</strong> the northernportion <strong>of</strong> the line as well as the proximity <strong>of</strong> shellfish management areas and private leases.However this line exists for those times when fishermen with smaller boats want to get furtherup in the shallow water where the larger boats are unable to work. The Hardesty Farm lineseems to work very well because <strong>of</strong> its location in deeper water allowing the larger boats totrawl the whole line instead <strong>of</strong> just part <strong>of</strong> the line as with the White Rock line. This line also hasfewer impacts to shell bottom. Typically the river will open all the way up to the Turtle Rock linein October with all the other special secondary nursery areas that are located in Core Sound.North RiverNorth River also has a long and interesting shrimp line history. This river was managedwith two lines for years. These were the Long Point line and the Oyster House line. Both lineswere established to protect small browns in the early summer (Long Point line) and small whitesin the fall (Oyster House line). The point <strong>of</strong> contention with these lines was when to open up tothe Oyster House line. Concerns with opening the area too late include the shrimp running on anortheast wind as well as running on rain and/or full or new moon. In June <strong>of</strong> 1997 a publicmeeting was held to discuss permanent lines in North River. It was agreed to move the WardsCreek line downstream to the mouth <strong>of</strong> the creek and move the Long Point line upstream to thenext point north. These lines <strong>of</strong>fered deeper water, more shelter to work in a northeast windand would provide an adequate buffer for both brown and white shrimp. The location <strong>of</strong> theselines do allow for small brown shrimp to be caught at the beginning <strong>of</strong> the season, and we getcomplaints about this. The old line at Long Point has been used a couple <strong>of</strong> times since theimplementation <strong>of</strong> the permanent line concept because <strong>of</strong> pressure to close by fishermenbecause <strong>of</strong> the small browns in the area. However once the proclamation was issued, therewas pressure from fishermen to honor the new permanent line. Now the DMF continues tokeep this line as a closure line unless unusual conditions such as in 2003 where high amounts<strong>of</strong> rainfall displaced small shrimp into open areas causing the DMF to close all <strong>of</strong> North River aswell as the Straits.Jarrett BayThe DMF also manages Jarrett Bay under different strategies. Over the past severalyears (since 2001) Jarrett Bay is closed to the range markers in early June and is opened to thechimney line in July. This is to protect small shrimp in the bay until they are big enough forharvest. In the past, the DMF has opened Jarrett Bay to the chimney line in June because <strong>of</strong>238
pressure from fishermen out <strong>of</strong> the Marshallberg area. These fishermen say this line is easier totow and they can keep the shrimp from moving out <strong>of</strong> the bay. Only half <strong>of</strong> the range markerline can be towed and there is more algae outside <strong>of</strong> the bay creating a lot <strong>of</strong> fouling <strong>of</strong> nets.Jarrett Bay also has a special secondary nursery area that allows it to be opened to the bridge.Other Special Secondary Nursery AreasPrior to August 1, 2004, these SSNAs would be opened to trawling no earlier thanOctober 15 th because they were also trawl prohibited areas. A rule change removing theseareas from the Trawl Nets Prohibited Rule will allow these areas to be opened between August16 th and May 14 th allowing for harvest <strong>of</strong> pink shrimp in the spring and for the harvesting anyremaining shrimp in the late fall.In the West Bay Area:West Thor<strong>of</strong>are BayLong Bay - Ditch BayTurnagain BayCore Sound Area:Cedar Island BayThor<strong>of</strong>are Bay-Barry BayNelson BayBrett BaySouth Side <strong>of</strong> Neuse RiverSouth River, Adams Creek and the outer portion <strong>of</strong> Clubfoot Creek typically stay openunless all <strong>of</strong> Neuse River is closed. Adams Creek and Clubfoot are popular areas for therecreational shrimper to fish because they are small waterbodies with protection from badweather. South River typically has very few shrimp but is a popular crab trawl area. The DMFtries not to close these areas because <strong>of</strong> concerns <strong>of</strong> grand openings. These result in a largenumber <strong>of</strong> small and large boats in a small waterbody. This concentration <strong>of</strong> effort on openingday increases finfish bycatch and discards, vessel conflict and decreases the amount <strong>of</strong> shrimpavailable after the opening.<strong>Shrimp</strong> Management in the Pamlico/Hyde County AreaThe DMF has been managing the shrimp harvest since the early 1970s. DMF sampling<strong>of</strong> the tributaries <strong>of</strong> the major rivers resulted in the designation <strong>of</strong> nursery areas throughout thestate that were subsequently closed in 1977 to the use <strong>of</strong> all bottom-disturbing gear, includingshrimp trawls. These lines have constituted the shrimp closure lines in the Central portion <strong>of</strong>the state and, for the most part, do not change.The notable exceptions to this rule <strong>of</strong> thumb have been Bay River, the mouths <strong>of</strong> theHyde County bays, and Adams Creek and Neuse River. In years when shrimp occur in greatnumbers, they compete for space and food and spill out into the open trawl areas because theclosed nursery areas cannot contain them. Also, heavy rainfall and strong northerly windsduring the month <strong>of</strong> June will cause the shrimp to move out <strong>of</strong> the closed areas seeking highersalinity. The DMF’s response to finding the small shrimp in these open trawling areas has beento close them by proclamation (intensively managed areas) in to protect the shrimp until theyreach “harvestable size”. This harvestable size has been the source <strong>of</strong> controversy for overtwenty years.239
Typically, the annual shrimp management process begins when the DMF issues aproclamation during the first week <strong>of</strong> June that shows the location <strong>of</strong> shrimp closures lines thatthe season begins with. As sampling dictates, lines may be moved downstream by proclamationto protect small shrimp until they are large enough to harvest. The DMF uses a small 20 foototter trawl with 1/2 inch mesh in the body and 1/4 inch mesh in the tailbag. This small trawl isused to determine the size structure <strong>of</strong> all the shrimp and fish in the waterbody, so that theimpacts will be known. The target “harvestable size” is in the neighborhood <strong>of</strong> 26-30 count or31-35 count (heads on). When sampling indicates that the majority <strong>of</strong> the shrimp in a closedarea have reached this target size, the area is opened by proclamation.In the past, the DMF has been reluctant to close larger bodies <strong>of</strong> water like Neuse andBay rivers or migration routes like Adams Creek. Occasionally, shrimp will be driven out <strong>of</strong> thecreeks from Oriental to the mouth <strong>of</strong> the Neuse River, and from the tributaries <strong>of</strong> Bay River.When shrimp size dictates that these areas, particularly Neuse River, be closed, the closure lineitself has been at issue. Closing the entire river has been done as an extreme measure and aline following channel markers running from <strong>of</strong>fshore Oriental to Maw Point has been used withmixed success in the past. Usually, this enables the larger boats to run along that line andcatch small shrimp to the exclusion <strong>of</strong> the smaller boats. Smaller recreational boats are notable to work in more open and unsheltered waters and the harvestable shrimp size desired bysome “recreational” fishermen before opening is smaller than the size desired by commercialinterests. For example, a 41-45 count shrimp may be more suitable to some and they want tosee areas opened when that size is achieved.“Grand openings” are also a problem with area closures. They result in a massiveconcentration <strong>of</strong> all types <strong>of</strong> boats in a very confined area like Adams Creek or Bay River. Thisincreases finfish bycatch and discard because <strong>of</strong> the increased effort, increases conflictbetween vessels, and decreases the amount <strong>of</strong> shrimp available after the opening as opposedto a gradual migration out <strong>of</strong> a closed area over time when the shrimp themselves are ready torun. Opening times are sometimes at issue. A Sunday evening opening is convenient for<strong>Marine</strong> Patrol as far as marking the area. More odd times such as Monday at noon tend todiffuse the number <strong>of</strong> boats present at once for a “grand opening” as they gradually show up t<strong>of</strong>ish.An issue with the dynamic nature <strong>of</strong> the opening and closing <strong>of</strong> the intensively managedareas is keeping the public informed. Immediately after an area is closed, calls begin to askwhen it will open again. Proclamations require 48 hours notice and fishermen need more timethan that to plan their activities.Finally, the areas <strong>of</strong> the Central District are generally closed to “shrimping and crabtrawling”. This closes the waterbodies to all gear for catching shrimp, including seines. SouthRiver is open to trawling year round since it rarely contains shrimp but does support a crab trawlfishery.240
12.10 Appendix 10. SHRIMP MANAGEMENT IN NEW RIVER ABOVE THE HIGHWAY 172BRIDGEThe waters upstream <strong>of</strong> the Highway 172 Bridge (Map 1) were designated by rule as aSpecial Secondary Nursery Area (SSNA) in 1996. The areas <strong>of</strong> the SSNA that are impacted bythe trawling opening include the river above the bridge up to the marked closure line runningfrom Grey’s Point to the opposite side <strong>of</strong> the river. Trawling in any <strong>of</strong> the tributary creeks isprohibited. The river consists mostly <strong>of</strong> shallow bays with the exception <strong>of</strong> the markednavigation channel. Bottom types range from sand and sand/mud to live shell bottom. DMFactively manages eight Shellfish management areas (SMAs) in this portion <strong>of</strong> New River.Data from Table 1 were extracted from the DMF Trip Ticket Program and were used todescribe the commercial shrimp fishery in New River from 1994-2003. Landed bycatch by gearwas calculated and ratios (in pounds) <strong>of</strong> marketable bycatch relative to shrimp were calculatedfor the three main gears: channel nets, otter trawls, skimmers and for the various miscellaneousgears (cast nets, gill nets, etc). Marketable bycatch from the skimmers is consistently lowerthan with the other gears. Marketable bycatch landings in channel nets were also low, with theexception <strong>of</strong> 2000-2002 when significant amounts <strong>of</strong> blue crabs were landed in this fishery.During this three-year period, ratios <strong>of</strong> pounds <strong>of</strong> shrimp per pound <strong>of</strong> marketable bycatch in thechannel nets were 4, 2, and 3: 1 respectively. Of course, these bycatch ratios apply only to theportion <strong>of</strong> bycatch retained and sold.Discarded bycatch is much more difficult to quantify because <strong>of</strong> the lack <strong>of</strong> data in mostareas. However, during 2003 and 2004, DMF staff sampled the study area for shrimpmanagement purposes utilizing a 25-foot, 4-seam otter trawl. This gear was not equipped witha turtle excluder or a finfish excluder. Catches were separated into four categories: commercialfinfish, non-commercial finfish, invertebrates, and shrimp. Each component was weighed andbycatch percentages were derived for each year (Figure. 1). All tows were conducted prior tothe shrimp opening and tow times ranged from 2 to 10 minutes. The primary objective <strong>of</strong> thesampling was to determine if the shrimp were large enough to warrant an opening but theweights <strong>of</strong> all the biomass components were recorded. Finfish accounted for approximately50% <strong>of</strong> the total biomass in each year with shrimp representing 30% <strong>of</strong> the weight in 2003 and40% in 2004. Invertebrates constituted 18% <strong>of</strong> the weights in 2003 and 14% in 2004.The number <strong>of</strong> trips by the major gears indicates an increase in effort for channel netsand skimmers and a decrease in trawling effort (Figure. 2). Channel nets are primarily fished inthe waters below the Highway 172 Bridge while trawling and skimmer effort is focused more inthe SSNA located above the bridge. Channel nets show the most consistency in the meannumber <strong>of</strong> pounds harvested per trip while skimmers and trawls show similar year- to-yearfluctuations but skimmers generally harvest more shrimp per trip (Figure. 3). Landings fromskimmers have shown a marked increase since 1994 reflecting the increased popularity <strong>of</strong> thisgear, especially in the capture <strong>of</strong> white shrimp during the late summer and early fall (Figure. 4).However, the variability <strong>of</strong> catches between all the gears is expected and is a result <strong>of</strong> the yearclass strength.The numbers <strong>of</strong> participants in the otter trawl fishery and how many trips eachparticipant conducted were analyzed for the 5-year period, 1998-2003 (Figure. 5). Most <strong>of</strong> theeffort was by participants who made only 1 or 2 trips. The number <strong>of</strong> people making between 3and 10 trips ranged from 57 in the year 2000 to 16 during 2003. In the 11-20 trips category,1999 had the highest number <strong>of</strong> participants (14) while 2001 and 2003 both had only 3participants. The trip ticket data indicates that, except for 2002, over 50% <strong>of</strong> the participants in241
a given year made only one or two trips in the otter trawl fishery between 1994 and 2003.The increasing use <strong>of</strong> skimmers in the New River SSNA has positive implications for theresource in terms <strong>of</strong> minimizing waste/bycatch and disturbance to the bottom. Additionally, thetrip ticket harvest data indicate this gear is more effective catching the target species thanconventional otter trawls. A skimmer trawl study conducted by Sea Grant found skimmers muchmore effective on white shrimp than otter trawls in water less than 12 feet (most all <strong>of</strong> the waterabove the bridge in New River) and in some cases outfished otter trawls as much as 5-to-1.Unlike otter trawls, the tail bag in skimmers is emptied while fishing is still underway.Consequently, the bag is emptied much more frequently, leading to significant increases insurvivability <strong>of</strong> most all finfish species (Coale, et al. 1994). The majority <strong>of</strong> shrimp openings inthe New River SSNA are for white shrimp since by late summer most <strong>of</strong> the brown shrimp havealready emigrated.Map 1.New River.242
Table 1.Catch and effort data on shrimp and landed bycatch, by gear type, New River,1994-2003 (courtesy <strong>of</strong> DMF trip ticket program).Channel Net Sold Mean catch/trip Ratio <strong>of</strong> <strong>Shrimp</strong>Participants Trips <strong>Shrimp</strong>/lbs bycatch-lbs lbs to sold bycatch2003 36 819 100667 1685 123 602002 41 1244 163831 61907 132 32001 45 1084 137595 79793 127 22000 51 1366 163109 38998 119 41999 69 1410 124727 4444 88 281998 42 828 80714 428 97 1891997 58 1111 86610 3065 78 281996 68 574 62590 1894 109 331995 70 839 87536 1435 104 611994 74 529 47556 747 90 64Otter trawls Sold Mean catch/trip Ratio <strong>of</strong> <strong>Shrimp</strong>Participants Trips <strong>Shrimp</strong> bycatch-lbs lbs to sold bycatch2003 67 243 39264 5612 162 7.02002 77 436 91652 4710 210 19.52001 71 184 14926 4389 81 3.42000 160 600 163640 7479 273 21.91999 176 743 77956 4537 105 17.21998 128 546 109034 4875 200 22.41997 130 798 79788 3721 100 21.41996 146 497 42113 3941 85 10.71995 232 1161 152285 17559 131 8.71994 183 793 53787 7115 68 7.6Skimmer Sold Mean catch/trip Ratio <strong>of</strong> <strong>Shrimp</strong>Participants Trips <strong>Shrimp</strong> bycatch-lbs lbs to sold bycatch2003 57 550 89780 1356 163 662002 52 815 173091 1701 212 1022001 46 305 36043 1879 118 192000 78 601 155949 2508 259 621999 71 439 68813 222 157 3101998 51 285 69396 13 243 53381997 45 332 75029 188 226 4001996 38 210 42677 267 203 1601995 26 81 21554 0 266 01994 5 12 1468 7 122 226Other Sold Mean catch/trip Ratio <strong>of</strong> <strong>Shrimp</strong>Participants Trips <strong>Shrimp</strong> bycatch-lbs lbs to sold bycatch2003 5 16 670 27 42 252002 5 5 209 184 42 12001 7 9 519 819 58 12000 12 18 1041 827 58 11999 5 10 387 553 39 11998 3 6 130 442 22 01997 15 51 2934 4394 58 11996 14 20 884 1528 44 11995 30 160 12837 11043 80 11994 2 2 267 426 133 1243
New River - 2003New River - 2004Invertebrates18%Noncommercialfinfish16%CommercialFinfish36%<strong>Shrimp</strong>30%Invertebrates14%Noncommercialfinfish21%CommercialFinfish25%<strong>Shrimp</strong>40%Figure 1. Percent weight in pounds <strong>of</strong> trawl biomass in New River 2003-2004.Trips by Gear160014001200100080060040020001994199519961997199819992000200120022003Channel Net Trawls Skimmer OtherFigure 2. Trips by gear in New River, 1994-2003.244
Pounds per Trip300250200Pounds / trip1501005001994199519961997199819992000200120022003Channel Net Trawls Skimmer OtherFigure 3. Mean catch in pounds per trip by gear, 1994-2003.Pounds <strong>of</strong> <strong>Shrimp</strong> by Gear200180160Pounds (thousands)1401201008060402001994199519961997199819992000200120022003Channel Net Trawls Skimmer OtherFigure 4. Total catch in pounds by gear, New River, 1994-2003.245
Number <strong>of</strong> Trips by Participants in New River Otter Trawl Fishery120Number <strong>of</strong> Participants100806040Trips1999 7432000 6002001 1842002 4362003 243200Figure 5.1999 2000 2001 2002 2003Bins Size <strong>of</strong> Number <strong>of</strong> Trips1-2 3-10 11-20 21-30 31-40 >40Number <strong>of</strong> trips by participants, by year in New River otter trawl fishery.246
Management Options/Impacts(+ potential positive impact <strong>of</strong> action)(- potential negative impact <strong>of</strong> action)1. Status quo (potential opening dates set by rule and determined by sampling)+ No need for further rulemaking on the use <strong>of</strong> shrimp trawls in the SSNA- Does not address perceived excessive finfish mortalities- Does not encourage use <strong>of</strong> more environmentally friendly gear- No remedy for indirect shellfish impacts2. Prohibit otter trawls (not skimmers) as an allowable gear in New River SSNA+ Benefit to existing Shellfish management areas+ Encourage the use <strong>of</strong> a more efficient gear for harvesting white shrimp+ Reduction in waste/fish kills especially on opening day- Eliminates part <strong>of</strong> a traditional Sneads Ferry fishery in this SSNA- Difficult to catch shrimp in a few deep-water spots- Financial hardship on trawlers who would likely convert to skimmers3. Establish timeline when otter trawls would be prohibited+ More time for fishermen to adopt to change+ Possible decreased financial hardship- No immediate remedy for waste/fish kills on opening day- No immediate benefits to SMAs4. Prohibit all trawlers and skimmers in New River SSNA+ Bycatch issue completely eliminated+ Potential for healthier shellfish/finfish stocks- Eliminates potential lucrative opening days for fishermen- Some loss <strong>of</strong> traditional shrimp harvest in New River- Eliminates traditional Sneads Ferry fishery in this SSNA5. Net size restrictions in New River SSNA+ Still allows prosecution <strong>of</strong> traditional fishery in SSNA+ May cut down on waste/fish kills especially on opening day+ Fishermen more able to harvest brown shrimp and white shrimp thatmove to deeper water within the SSNA- Still have indirect impacts on shellfish- Increases in effort/tow times might <strong>of</strong>fset bycatch savings6. Status Quo but with reduction in days <strong>of</strong> week trawling allowed (Tues,Thur)+ Allows traditional fishing+ Reduction in waste/fish kills+ Longer season, more sustainable prices+ No time necessary to adopt to gear change- Indirect impact on SMAs- Still have waste/fish kill issues247
RecommendationsAC Recommendation: Status quoDMF Recommendation: Prohibit otter trawls after a two year phase in period to allow thosewho wish to convert to skimmers to do so. Also recommend that the MFC pursue changes toallow skimmers less than 26 feet as a RCGL gear.MFC Recommendation: Prohibit otter trawls after a four year phase in period to allow thosewho wish to convert to skimmers to do so.Literature CitedCoale, J.S., R. A. Rulifson, J. D. Murray, and R. Hines. Comparisons <strong>of</strong> shrimp catch andbycatch between a skimmer trawl and an otter trawl in the North Carolina inshore shrimpfishery. North American Journal <strong>of</strong> <strong>Fisheries</strong> Management 14: 751-768.248
12.11 Appendix 11. SHRIMP MANAGEMENT IN CHADWICK BAYChadwick Bay (see Map 1) is a small high salinity waterbody encompassing 841 acreslocated just south <strong>of</strong> the mouth <strong>of</strong> New River and adjacent to the IWW and the New River Inlet.The southern portion <strong>of</strong> the bay is classified as a Primary Nursery Area (PNA) characterized byshallow water depth (< 5 feet) and a sandy mud substrate with patches <strong>of</strong> submerged aquaticvegetation (SAV). Fullard Creek is the major tributary <strong>of</strong> Chadwick Bay and minor tributariesinclude Charles Creek and Bumps Creek. The upper portion <strong>of</strong> Fullard and all <strong>of</strong> Charles Creekand Bumps Creek are designated by DMF as PNAs. Although the lower portion <strong>of</strong> FullardCreek is not currently classified as a nursery area, it is not opened to shrimping because <strong>of</strong> theabundance <strong>of</strong> juvenile finfish. The remainder <strong>of</strong> Chadwick Bay is opened by proclamation toshrimping when the shrimp reach a harvestable size (30-40 heads-on count). The area thatmay open to shrimping is approximately 132 acres or 16% <strong>of</strong> the waterbody. The bottoms in theopen shrimping area lacks SAV and are sandier, a little deeper than the PNAs, but still supportslarge numbers <strong>of</strong> juvenile and sub-adult finfish.DMF has utilized two different strategies in managing Chadwick Bay. In some yearswhen brown shrimp are abundant and large, the bay is opened in July along with the White OakRiver, Queen’s Creek and Bear Creek. In other years when brown shrimp are less abundant, aChadwick Bay shrimp opening on white shrimp may occur in August or September inconjunction with the openings in New River and/or Stump Sound.The Chadwick Bay shrimp fishery is primarily conducted with trawls, although, in recentyears, the use <strong>of</strong> skimmers has increased in the commercial portion <strong>of</strong> the fishery. The bay isfrequently shrimped by Recreational Commercial Gear License holders, especially on openingdays.Other fisheries prosecuted in Chadwick bay include clamming, gill netting, crabbing andoystering. Oysters and clams are harvested from public and leased areas in the tributaries andthe bay adjacent to the shrimping area. There is also a small bay scallop fishery in years whenthey are plentiful. It is impossible to quantify the seafood landings that are harvested inChadwick Bay since it is not listed on DMF trip tickets.The amount <strong>of</strong> bycatch discarded from trawling operations in Chadwick Bay is difficult toquantify due to a lack <strong>of</strong> dependent data from this area. However, during the summers <strong>of</strong> 2003and 2004, DMF staff sampled Chadwick Bay on four different occasions for shrimpmanagement purposes utilizing a 25-foot, 4-seam otter trawl, or a 20-foot flat otter trawl. Thesegears were not equipped with turtle excluders or finfish excluders. All tows were conductedprior to the shrimp opening and tow times ranged from 2 to 5 minutes. These catches wereseparated into four categories: commercial finfish, non-commercial finfish, invertebrates, andshrimp. The weights (in pounds) <strong>of</strong> each component were summed and bycatch percentageswere calculated as a percent <strong>of</strong> the total catch from all four trips (Figure 1). Finfish accountedfor approximately 50% <strong>of</strong> the total biomass in each year with shrimp representing 30% <strong>of</strong> theweight in 2003 and 40% in 2004. Invertebrates constituted 18% <strong>of</strong> the weights in 2003 and14% in 2004.249
Biomass Percent (lbs) Chadwick Bay 2003-2004Invertebrates4%<strong>Shrimp</strong>21%Commercial40%Non-commercial35%Figure 1. Percent weight in pounds <strong>of</strong> trawl biomass in Chadwick Bay, 2003-2004.Samples were also collected by DMF staff in Chadwick Bay during May and June <strong>of</strong>1999-2001 using a 10 ft trawl with a ¼ inch body and a 1/8 inch tailbag. Tow times using thisgear were 1 minute in duration. Samples were taken in lower Fullard Creek (Map 1, hatchedarea) which is not classified PNA, nor included within the boundaries <strong>of</strong> the open shrimpingarea. On the same day, for comparison purposes, samples were also collected in the upperreaches <strong>of</strong> Fullard Creek, which is classified as a PNA. Catch per unit effort (CPUE) for thecommercial species (spot, southern flounder, Atlantic menhaden, Atlantic croaker, weakfish,silver perch, pigfish, brown, white and pink shrimp) captured at the PNA station are comparedwith CPUEs from the non-nursery area (Table 1). Catches <strong>of</strong> these species are similar andindicate that the non-nursery area should be classified as PNA. Furthermore, the commercialfinfish that were present in the sampling <strong>of</strong> the open shrimp area are probably the same fish,shrimp and invertebrates that were captured in the spring PNA sampling. Although, DMF hasclassified most <strong>of</strong> these species as healthy, there is the potential for substantial fish mortalitiesduring commercial shrimping operations in Chadwick Bay.250
Management Options/Impacts(+ potential positive impact <strong>of</strong> action)(- potential negative impact <strong>of</strong> action)1) Status quo (potential opening dates set by rule and determined by sampling)+ No need for further rulemaking on the use <strong>of</strong> shrimp trawls in the SSNA- Does not address perceived excessive finfish mortalities- Does not encourage use <strong>of</strong> more environmentally friendly gear- No remedy for indirect shellfish impacts2) Prohibit otter trawls (not skimmers) as an allowable gear in Chadwick Bay+ Benefit to Shellfish+ Encourage the use <strong>of</strong> a more efficient gear for harvesting shrimp+ Reduction in waste/fish kills especially on opening day- Eliminates a traditional Chadwick Bay fishery- Financial hardship on trawlers who would likely convert to skimmers3) Establish timeline when otter trawls would be prohibited+ More time for fishermen to adopt to change+ Possible decreased financial hardship- No immediate remedy for waste/fish kills on opening day- No immediate benefits to shellfish4) Prohibit all trawlers and skimmers in Chadwick Bay+ Bycatch issue completely eliminated+ Potential for healthier shellfish/finfish stocks- Eliminates potential lucrative opening days for fishermen- Some loss <strong>of</strong> traditional shrimp harvest in Chadwick Bay- Eliminates traditional Sneads Ferry fishery- Increase pressure on adjacent areas open to trawling5) Net size restrictions in Chadwick Bay+ Still allows prosecution <strong>of</strong> traditional fishery+ May cut down on waste/fish kills especially on opening day- Still have indirect impacts on shellfish- Increases in effort/tow times might <strong>of</strong>fset bycatch savings6) Status Quo but with reduction in days <strong>of</strong> week trawling allowed (Tues,Thur)+ Allows traditional fishing+ Reduction in waste/fish kills+ Longer season, more sustainable prices+ No time necessary to adopt to gear change- Still have indirect impact on SMAs- Still have waste/fish kill issuesAC, DMF, and MFC Recommendation: Status quo and initiate sampling to investigate ifChadwick Bay functions as a Special Secondary Nursery Area.251
252
Table 1. Catch per unit effort for Chadwick Bay, PNA and Non-PNA stations, May-June 1999-2001.Chadwick BayPNAChadwick BayNon-PNASpot 159.7 193.5Croaker 16.0 3.5Southern flounder 3.2 0.7Weakfish 0.2 0.0Summer flounder 0.2 0.0Silver Perch 0.0 0.5Pigfish 0.0 5.0Brown shrimp 76.3 40.3White shrimp 0.3 0.0Pink shrimp 0.0 1.2Blue crab 5.2 1.0Pinfish 141.8 188.8Bay anchovy 31.0 23.2Bay whiff 3.0 0.0Blackcheek tonguefish 0.0 0.7Inshore lizardfish 0.5 0.2False blue crab 0.2 0.2Spotfin mojarra 3.8 0.7Green goby 0.8 0.0Naked goby 0.0 0.3Squid 0.2 0.0253
12.12 Appendix 12. SHRIMP MANAGEMENT IN THE INTRACOASTAL WATERWAY ANDSOUNDS FROM NEW RIVER TO RICH’S INLETThe estuarine waters <strong>of</strong> the IWW channel and the adjacent sounds and bays betweenNew River Inlet and Rich’s Inlet are managed as a single waterbody by the DMF. A section <strong>of</strong>this waterbody bounded by Marker #17 to the North and the Surf City Swing Bridge to the southis designated as SSNA. SSNA status (15A NCAC 03R.0105) makes it unlawful to use trawlnets in these waters except that the <strong>Fisheries</strong> Director may, by proclamation, open any portion<strong>of</strong> this area to shrimp or crab trawling from August 16 through May 14. Management rationalefor this rule included minimizing bycatch by delaying the trawl opening date to reduce the finfishbycatch and to reduce user conflicts. Historical data (since 1972) collected by DMF indicatesthese waters support large aggregations <strong>of</strong> commercially important finfish as well as shellfishand crustaceans.Bottom types range from mud and muddy/sand in the IWW to mostly sand near theinlets. The shallow waters <strong>of</strong> Topsail Sound and some <strong>of</strong> the estuarine areas around New RiverInlet contain patches <strong>of</strong> SAV.There are active clam and oyster fisheries in the entire area. Hand harvest for oystersand clams take place in the shallow areas throughout these waters on both public bottom andleased areas, while mechanical harvest <strong>of</strong> clams is allowed in the IWW from New River to south<strong>of</strong> the Surf City Bridge (“BC” Marker). DMF maintains Shellfish Management Areas throughoutthe area, all <strong>of</strong> which are located in waters closed to shrimping with mobile gears. DMF and theCoastal Federation have collaborated to begin construction <strong>of</strong> oyster sanctuaries in StumpSound.The typical management cycle for these waters is; the IWW north <strong>of</strong> Marker #17, theIWW south <strong>of</strong> the Surf City Swing Bridge and Banks Channel in Topsail Sound remain openduring the entire year unless unusually high rainfall amounts or overcrowded nursery areasforce large numbers <strong>of</strong> small shrimp into them prematurely. Waters in the SSNA, with theexception <strong>of</strong> the middle portion <strong>of</strong> the SSNA are typically opened sometime after August 15.The middle portion <strong>of</strong> the SSNA from Marker #45 to the Highway 210-50 Highrise Bridge usuallyremains closed until late in the season because <strong>of</strong> the abundance <strong>of</strong> small shrimp.The fishing is dominated by small boats that trawl, float net, and skim in the mainchannel <strong>of</strong> the IWW and in a 100- foot strip on the side <strong>of</strong> the IWW that is open from Marker #49to Marker #105. Channel nets are set outside <strong>of</strong> the marked channel from Marker #15 at NewRiver to just south <strong>of</strong> the Surf City Bridge and in Topsail Sound. Banks Channel serves as amigration route for emigrating shrimp and gears used there includes trawls, skimmers and mostrecently shrimp traps. The use <strong>of</strong> shrimp traps in Topsail Sound has been discussed in aprevious issue paper.Data from the DMF Trip Ticket Program (Figure. 1) are used to compare the commercialshrimp fishery in Topsail/Stump Sound relative to other waterbodies in the state during the 10-year period, 1994-2003. The waterbodies were ranked according to their contribution in totalpounds <strong>of</strong> shrimp landed. The Topsail/Stump Sound area is ranked seventh, contributing1,015,148 lbs <strong>of</strong> shrimp during 1994-2003.254
Map 1. New River Inlet to Rich’s Inlet.255
Pamlico SoundCore SoundNew RiverNewport RiverNeuse RiverNorth RiverTopstumpIWWCape fear RiverWhite Oak RiverBogue SoundPamlico RiverIWW-BrunswickBay RiverCroatan SoundRoanoke SoundMasonboro SoundPungo RiverShallotte RiverLockwood Folly36,378,4500 2,000,000 4,000,000 6,000,000 8,000,000Pounds <strong>of</strong> <strong>Shrimp</strong>Figure 1.Total pounds <strong>of</strong> shrimp harvested by all gears in major North Carolina waterbodiesbetween 1994-2003 (courtesy NC Trip Ticket Program).In most years, otter trawls harvest the largest amount <strong>of</strong> shrimp in the Topsail/StumpSound waterbody (Figure 2). However, in 1999 and 2003, channel net landings exceeded trawllandings. Skimmer landings have increased since 1997 and were greater than trawl landings in2002.120100Pounds (thousands)8060402001994199519961997199819992000200120022003Channel Net Trawls Skimmer OtherFigure 2. Total catch in pounds, by gear, Topsail / Stump Sound, 1994 –2003.256
Trip ticket program data were examined for trends in the different fisheries on an annualbasis (Table 1). Landed bycatch by gear was calculated and ratios (in pounds) <strong>of</strong> shrimp tomarketable bycatch were calculated for: channel nets, otter trawls, skimmers and for the variousmiscellaneous gears (cast nets, gill nets, etc.). Ratios are stated in pounds <strong>of</strong> shrimp to onepound <strong>of</strong> marketable bycatch.Ratios in the otter trawls fluctuate the least on a year to year basis, ranging from 30.4 lbs<strong>of</strong> shrimp to each pound <strong>of</strong> sold bycatch in 1999 (30.4: 1) to 72.6: 1 in 2001. Landed bycatch inskimmers is small and ranges from zero pounds landed in 7 out <strong>of</strong> the 10 years to 77 lbs landedin 2001. Thus, in skimmers, the ratio <strong>of</strong> shrimp to a pound <strong>of</strong> landed bycatch is very high.Bycatch ratios in channel nets fluctuated, ranging from 6.0: 1 in 1999 to 1,453.3: 1 in 2003.The number <strong>of</strong> trips by the major gears (Table 1, Figure 3) indicates that otter trawls arethe dominant gear used in this waterbody followed by channel nets and skimmers. Effort in theskimmer fishery has been increasing, especially in 2002 and 2003, where for the first time, in2002, there were more skimmer trips than channel net trips.Trips by Gear12001000800No. <strong>of</strong> Trips60040020001994199519961997199819992000200120022003Channel Net Trawls Skimmer OtherFigure 3. Trips by gear, Topsail/Stump Sound, 1994-2003.257
Table 1.Catch and effort data on shrimp and landed bycatch, by gear type, Topsail/StumpSound, 1994-2003.Gear Year Participants Trips <strong>Shrimp</strong>/lbsSoldbycatch/lbsRatio <strong>of</strong>Mean shrimp to soldcatch/trip bycatchCannel Net 1994 30 220 14,676 80 66.7 183.51995 48 272 34,430 1,214 126.6 28.41996 40 155 30,543 93 197.1 328.41997 36 187 20,457 683 109.4 30.01998 28 219 26,487 1011 120.9 26.21999 57 496 63,459 10,608 127.9 6.02000 28 287 35,113 669 122.3 52.52001 37 207 18,793 324 90.8 58.02002 17 182 22,875 70 125.7 326.82003 22 257 52,754 36 205.3 1,465.4OtterTrawls 1994 372 707 52,520 1,303 74.3 40.31995 483 1,022 108,833 1,647 106.5 66.11996 263 747 60,601 888 81.1 68.21997 260 724 63,238 994 87.3 63.61998 230 586 48,100 922 82.1 52.21999 235 628 57,524 793 91.6 72.52000 287 567 49,113 1,357 86.6 36.22001 176 466 32,873 700 70.5 47.02002 174 497 35,070 1154 70.6 30.42003 240 535 48,366 1,229 90.4 39.4Skimmer 1994
Otter trawls fluctuated the least in the mean number <strong>of</strong> pounds harvested per trip (Table 1,Figure 4) and skimmers averaged more pounds per trip than trawls in every year since 1997.Catches per trip in channel nets fluctuated, ranging from 67 lbs in 1997 to 205 lbs in 2003.From 1995-1997 and again in 2003, channel nets had the highest landings per trip <strong>of</strong> the majorgears.Catches from other gear includes butterfly nets, cast nets and sink gill nets. Althoughthe mean shrimp catch for “other” gear was high in 2003, this number was based on just a fewtrips. The number <strong>of</strong> trips from “other” gear was less than or equal to 30 for every year but 1995when there were 53 trips.250.0200.0Pounds / trip150.0100.050.00.01994199519961997199819992000200120022003Channel Net Trawls Skimmer OtherFigure 4. Mean catch in pounds per trip by gear, Topsail/Stump Sound, 1994-2003.Discarded bycatch is much more difficult to quantify because <strong>of</strong> the lack <strong>of</strong> data fromspecific waterbodies. However, during 2003 and 2004, DMF staff sampled the study area forshrimp management purposes utilizing a 25-foot, 4-seam otter trawl or a 20-foot 2-seam flattrawl. Both trawls had a ¾ inch mesh body (bar) and a ¼ inch mesh tailbag. DMF trawls do notcontain turtle or fish excluding devices. Catches were separated into four categories:commercial finfish, non-commercial finfish, invertebrates, and shrimp. Each component wasweighed and bycatch percentages were derived for all the catches combined (N=16) for bothyears (Figure 5). All tows were conducted prior to the shrimp opening and tow times rangedfrom 2 to 10 minutes. By weight, commercial finfish accounted for 24% <strong>of</strong> the total biomass,non-commercial, 12%, shrimp 59% and invertebrates 5%.259
Biomass Percent (lbs), Stump/Topsail SoundNon-commercial12%Invertebrates5%Commercial24%<strong>Shrimp</strong>59%Figure 5. Percent weight in pounds <strong>of</strong> trawl biomass in Topsail/Stump Sound, 2003-2004.260
Management Options/Impacts(+ potential positive impact <strong>of</strong> action)(- potential negative impact <strong>of</strong> action)1) Status quo (potential opening dates set by rule and determined by sampling)+ No need for further rulemaking on the use <strong>of</strong> shrimp trawls in the SSNA- Does not address perceived excessive finfish mortalities- Does not encourage use <strong>of</strong> more environmentally friendly gear- No remedy for indirect shellfish impacts2) Prohibit otter trawls (not skimmers) as an allowable gear in Stump/Topsail Sound+ Benefit to Shellfish+ Encourage the use <strong>of</strong> a more efficient gear for harvesting white shrimp+ Reduction in waste/fish kills especially on opening day- Eliminates portion <strong>of</strong> traditional fishery- Financial hardship on trawlers who might convert to skimmers3) Establish timeline when otter trawls would be prohibited+ More time for fishermen to adopt to change+ Possible decreased financial hardship- No immediate remedy for waste/fish kills on opening day- No immediate benefits to shellfish4) Prohibit all trawlers and skimmers in Topsail/Stump Sound+ Bycatch issue completely eliminated+ Potential for healthier shellfish/finfish stocks- Loss <strong>of</strong> significant shrimp landings to that region- Eliminates traditional fishery- Increase pressure on adjacent areas open to trawling5) Net or vessel size restrictions+ Still allows prosecution <strong>of</strong> traditional fishery+ May cut down on waste/fish kills especially on opening day- May still have indirect impacts on shellfish- Increases in effort/tow times might <strong>of</strong>fset bycatch savings6) Status Quo but with reduction in days <strong>of</strong> week trawling allowed (Tues,Thur)+ Allows traditional fishing+ Reduction in waste/fish kills+ Longer season, more sustainable prices+ No time necessary to adopt to gear change- Still have indirect impact on shellfish- Still have waste/fish kill issuesAC, DMF, and MFC Recommendation: Status Quo261
12.13 Appendix 13. SHRIMP MANAGEMENT IN THE INTRACOASTAL WATERWAY ANDSOUNDS, RICH’S INLET TO CAROLINA BEACHThe estuarine waters <strong>of</strong> the IWW channel and adjacent sounds between Rich’s Inlet andCarolina Beach stretch over 21 miles and include 4 inlets separating four barrier islands, three<strong>of</strong> which (Figure 8, Wrightsville, Carolina Beach) are heavily developed (Map 1). These watersare bordered on the north by Rich’s Inlet and to the south by the Carolina Beach Yacht Basin.The largest inlet is Masonboro Inlet and it is located approximately in the center <strong>of</strong> theseestuaries where it separates Wrightsville Beach from Masonboro Island.Bottom types are primarily sand throughout the area with the exception <strong>of</strong> more s<strong>of</strong>tmuddy substrates in the sounds and portions <strong>of</strong> the IWW. Submerged Aquatic Vegetation(SAV) is limited to a few patches in the shallow sound areas. There are active oyster, clam, andcrab fisheries throughout the area. These fisheries are prosecuted in the sounds and along theedges <strong>of</strong> the ICW. The waters contain a few shellfish leases and DMF maintains six ShellfishManagement Areas from Hewletts Creek north to Rich’s Inlet. In addition, DMF and the CoastalFederation have collaborated on construction <strong>of</strong> an oyster sanctuary in the mouth <strong>of</strong> Hewlett’sCreek. Closed shellfish areas are abundant and include all or portions <strong>of</strong> creeks on themainland side <strong>of</strong> the IWW as well as most <strong>of</strong> the Wrightsville Beach area and buffers aroundnumerous marinas.Most all <strong>of</strong> these areas receive minimal shrimping effort with little or no impact onshellfish resources. Exceptions are a section <strong>of</strong> the IWW in Myrtle Grove Sound (Williamslanding) and the Carolina Beach Yacht Basin (CBYB). Additionally, some <strong>of</strong> the channelsaround Wrightsville Beach also receive shrimping effort at various times during a typical year.Both commercial and recreational shrimpers utilize these waters.The William’s Landing area has been difficult to manage because the shrimp <strong>of</strong>tenmigrate before reaching larger sizes (30-40 count, heads-on) except in the fall. In some years,large concentrations <strong>of</strong> algae (Grassilaria and Ulva, spp) prevent the use <strong>of</strong> trawls until theshrimp grow to an acceptable count while in other years there has been harvest <strong>of</strong> small shrimp.The CBYB is opened and closed based on the size <strong>of</strong> shrimp present. Channels aroundWrightsville Beach remain open to allow harvest <strong>of</strong> shrimp migrating to the ocean. The area <strong>of</strong>the IWW from the Wrightsville Beach Drawbridge to Marker # 105 at Green’s Channel alwaysremains open to shrimping but historically, has received little effort from commercial orrecreational fisherman.<strong>Shrimp</strong> landings were combined from the different waterbodies for the years 1994-2003and charted relative to their statewide contribution (Figure 1). In relation to the otherwaterbodies, the Masonboro Sound waterbody has not been a significant contributor tolandings. During 1994-2003 trawl landings ranged from 6,369 lbs. in 2003 to 1,515 lbs. in 2001(Table 1, Figure 2) with an average <strong>of</strong> 4,097 lbs. Greater than 97% <strong>of</strong> the harvest was capturedby otter trawls, with the last 4 years indicating a 100% harvest from otter trawls. The amount <strong>of</strong>sold bycatch relative to shrimp is quantified in the table and although higher than other areasexamined in southeastern N.C., is insignificant from a total poundage standpoint. Most <strong>of</strong> thevessels harvesting shrimp in this waterbody are small (less than 25 feet) and pull only one net.The number <strong>of</strong> participants has been decreasing and only 10 users were documented in eachyear during 2000-2003 (Table 1).262
Map 1.New Topsail Inlet to Carolina Beach Yacht Basin.263
Pamlico SoundCore SoundNew RiverNewport RiverNeuse RiverNorth RiverTopstumpIWWCape fear RiverWhite Oak RiverBogue SoundPamlico RiverIWW-BrunswickBay RiverCroatan SoundRoanoke SoundMasonboro SoundPungo RiverShallotte RiverLockwood Folly36,378,4500 2,000,000 4,000,000 6,000,000 8,000,000Pounds <strong>of</strong> <strong>Shrimp</strong>Figure 1. Contribution in total pounds <strong>of</strong> shrimp captured during 1994-2003.120100PoundsTrips7,0006,000Trips806040205,0004,0003,0002,0001,000Pounds01994 1995 1996 1997 1998 1999 2000 2001 2002 2003YEAR0Figure 2. Total pounds and trips in the Masonboro Sound trawl fishery, 1994-2003.264
Table 1.Trip ticket data from Masonboro Sound.Soldbycatch inpoundsMeancatch pertripRatio <strong>of</strong>shrimp tosoldbycatchPercentfrom ottertrawlsYear License Trips <strong>Shrimp</strong>/lbs1994 38 86 4,638 153 54 30.24 100.00%1995 12 22 1,952 9 89 216.83 100.00%1996 24 55 5,973 1,089 109 5.49 100.00%1997 13 104 5,715 255 55 22.39 100.00%1998 11 90 4,954 360 55 13.77 99.87%1999 14 66 2,266 440 34 5.15 100.00%2000 6 77 4,212 156 55 27.06 100.00%2001 10 38 1,514 28 40 54.08 100.00%2002 10 54 3,372 255 62 13.22 99.96%2003 10 68 6,369 334 94 19.08 97.07%The mean catch per trip (Table 1, Figure 3) has ranged between 34 lbs. in 1999 to 109lbs. in 1996. The average catch per trip during the ten years 1994-2003 was 65 pounds.120100Mean Catch per Trip8060402001994199519961997199819992000200120022003YearFigure 3. Mean catch per trip, in the trawl fishery, Masonboro Sound, 1994-2003.265
The size (counts) <strong>of</strong> shrimp landed is recorded on DMF trip ticket data. These data wereextracted from the DMF database for the Masonboro Sound waterbody during 1994-2003 andplotted relative to the number <strong>of</strong> trips where a particular size shrimp was landed (Figure 4). Thepeak modal size was 41/45 count shrimp, representing 122 trips.140120100Trips8060402000/1516/2021/2526/3031/3536/4041/45<strong>Shrimp</strong> Size Category46/5051/5556/6060/7070/8080+MixedDozenFigure 4. Frequency <strong>of</strong> trips by heads-on count size, Masonboro Sound, 1994-2003Preliminary bycatch results from a recently completed (2004) Fishery Resource Grant(Logothetis, pers. comm.) provide information on the bycatch associated with commercialtrawling in the Williams Landing portion <strong>of</strong> the IWW. Based on 12 trips and 22 tows conductedbetween May and October <strong>of</strong> 2003 the ratio <strong>of</strong> bycatch to shrimp was 0.7: 1. In other words, forevery 0.7 lb. <strong>of</strong> bycatch captured there was 1 lb <strong>of</strong> shrimp captured. This ratio <strong>of</strong> bycatch wasthe second lowest <strong>of</strong> all the study areas with the Cape Fear River being the lowest at 0.38: 1.The mean counts <strong>of</strong> shrimp captured by the investigators during August, September andOctober was 87, 67.5 and 72 respectively. These numbers were based on 2 trips in August, 4in September and 1 in October. Other areas sampled were located in Brunswick, Onslow andPender counties. All tows were made with a commercial 50 foot two seam otter trawl outfittedwith turtle and fish excluder devices.266
Management Options/Impacts(+ potential positive impact <strong>of</strong> action)(- potential negative impact <strong>of</strong> action)1) Status quo (potential opening dates set by proclamation and determined by sampling)+ Flexibility in dealing with variety <strong>of</strong> conditions+ No need for further rulemaking- Does not address harvest <strong>of</strong> small shrimp or waste/bycatch- Sometimes necessitates “grand openings’2) Modify existing management strategy as needed to address concerns+ Harvest <strong>of</strong> more marketable shrimp+ Potential reduction in waste/bycatch- More regulations- Modifications to strategy may not have intended effect- Possible reduction <strong>of</strong> harvest3) Prohibit all trawling+ Possible benefit to finfish stocks+ Eliminates navigational conflicts+ No harvest <strong>of</strong> small shrimp by trawlers- Eliminates traditional trawl fishery in some areas- Financial hardship on some shrimpersAC, DMF and MFC Recommendation: Close IWW to trawling from Marker # 105 toWrightsville Beach drawbridge. Manage trawling in the IWW from Marker #139 to Marker # 146as if it were a Special Secondary Nursery Area.267
12.14 Appendix 14. SHRIMP MANAGEMENT IN THE CAPE FEAR RIVER COMPLEXThe waters <strong>of</strong> the Cape Fear River, the Basin, Second Bay, Buzzard’s Bay (the Bays)and Bald Head, Cape and Bay Creeks (the Creeks) are part <strong>of</strong> the Cape Fear estuarine system(Map 1). Bottom types range from sand near the inlet and creek mouths to mud in some <strong>of</strong> thebays and channels near Snow’s Cut. There are active clam and oyster fisheries in the bays,creeks and the river upstream to the Fort Fisher Ferry Terminal. These fisheries occur primarilyby hand and in shallow water though there are tong and bull rake clam fisheries in the deeperareas. In some <strong>of</strong> the deeper areas <strong>of</strong> the Cape Fear, clam and shrimp fisheries co-exist.There are active crab pot and gillnet fisheries throughout the entire estuary. Map 1 illustratesthe locations <strong>of</strong> the Primary, Secondary and Special Secondary Nursery Areas in the Cape FearRiver.The area in the Cape Fear that is open to shrimping is dredged on a regular basis fornavigation purposes. The river is managed on the size <strong>of</strong> shrimp and various parts <strong>of</strong> the Riverare opened and closed based on the DMF’s samples. The upstream line was placed at Snow’sCut for many years because <strong>of</strong> the abundance <strong>of</strong> small shrimp above this line. The line wasmoved upstream 3 years ago based on larger shrimp being present at that location. The Riverhas not been closed for the last two years because when small shrimp were in the open areasthe participants have chosen not to harvest them.The bays south <strong>of</strong> Fort Fisher known as the Basin or First Bay, Second Bay andBuzzard’s Bay have been managed as a unit with openings and closings based on the DMF’ssamples. New Inlet drained these areas but closed after a series <strong>of</strong> hurricanes in the late1990’s and circulation is now through the Cape Fear. Since the inlet closing, DMF hasobserved a shift in the biological character <strong>of</strong> these waters towards more <strong>of</strong> a nursery area.Consequently, the size <strong>of</strong> the shrimp tends to remain small and the waters have not openedsince 2001.The Bald Head Creeks are usually opened in late June or early July based on the size <strong>of</strong>shrimp. Areas opened include the lower portions <strong>of</strong> the Creeks. The fishery is prosecuted bysmall skiffs. However, due to a lack <strong>of</strong> effort over the last few years, these creeks have notbeen opened since 2002.Trawling trips in the Cape Fear are usually day trips and fishery operations areperformed primarily from small boats although vessels up to 50 feet may work in the channels <strong>of</strong>the Cape Fear. There are no other mobile gears used but there has been some use <strong>of</strong> channelnets in the past. During 1999-2003, greater than 99% <strong>of</strong> the shrimp landings were capturedwith otter trawls (Table 1).<strong>Shrimp</strong> landings were combined from the different estuarine waterbodies for the years1994-2003 and charted relative to their statewide contribution (Figure 1). During the 10-yearperiod in the Cape Fear, a total <strong>of</strong> 990,446 lbs were harvested, an average <strong>of</strong> 99,044 poundsper year. Over 98% <strong>of</strong> these landings were from otter trawls. The trawling effort has droppedsignificantly in recent years and now the main channels <strong>of</strong> the Cape Fear River support all theeffort (Table 1, Figure 2). The number <strong>of</strong> trawling participants has declined from 81 in 1994 to23 in 2003. The number <strong>of</strong> participants working in the river averaged 25 during the five-yearperiod 1999-2003. Ratios <strong>of</strong> shrimp to the amount <strong>of</strong> bycatch sold are high indicating thatshrimp dominate the catches.268
Map 1.Cape Fear River.269
Table 1.Trip ticket data from the otter trawl fishery, Cape Fear River.Soldbycatch inpoundsMeancatch pertripRatio <strong>of</strong>shrimp tosoldbycatchPercentfrom ottertrawlsYear License Trips <strong>Shrimp</strong>/lbs1994 81 837 145,350 4,988 173.7 29.1 97.0%1995 43 434 111,384 2,252 256.6 49.5 97.5%1996 50 379 76,283 2,958 201.3 25.8 94.9%1997 46 529 134,857 442 254.9 305.1 97.4%1998 35 365 75,465 1,626 206.8 46.4 91.4%1999 42 439 118,407 996 269.7 118.9 99.7%2000 19 255 45,600 1,558 178.8 29.3 99.0%2001 18 206 17,839 269 86.6 66.3 99.9%2002 25 322 82,845 1,631 257.3 50.8 100.0%2003 23 301 101,416 1,048 336.9 96.7 100.0%Pamlico SoundCore SoundNew RiverNewport RiverNeuse RiverNorth RiverTopstumpIWWCape fear RiverWhite Oak RiverBogue SoundPamlico RiverIWW-BrunswickBay RiverCroatan SoundRoanoke SoundMasonboro SoundPungo RiverShallotte RiverLockwood Folly36,378,4500 2,000,000 4,000,000 6,000,000 8,000,000Pounds <strong>of</strong> <strong>Shrimp</strong>Figure 1.Total pounds <strong>of</strong> shrimp harvested by all gears in major North Carolina waterbodies,1994-2003.270
Trips9008007006005004003002001000PoundsTrips1994 1995 1996 1997 1998 1999 2000 2001 2002 2003Year160,000140,000120,000100,00080,00060,00040,00020,0000PoundsFigure 2. Total pounds and trips by year in the otter trawl fishery, Cape Fear River, 1994-2003.Except for 2001, when the total harvest from trawls (17,839 lbs.) was 73,106 lbs lessthan the 10- year average, mean catches per trip have not fluctuated much (Table 1, Figure 2).Mean catches averaged 222 lbs over the 10-year period (Figure 3).400350Mean Catch Per Trip .30025020015010050019941995199619971998 1999Year2000200120022003Figure 3. Mean catch in pounds, per trip, otter trawls, Cape Fear River, 1994-2003.271
Preliminary bycatch results from a recently completed FRG (Logothetis, pers. comm.)provide some data on the bycatch associated with commercial trawling in the Cape Fear River.Based on 25 trips and 50 tows conducted between April and November <strong>of</strong> 2003, the ratio <strong>of</strong>bycatch to shrimp was 0.38: 1. In other words, for every 0.38 lb. <strong>of</strong> bycatch captured there was1 lb <strong>of</strong> shrimp captured. This ratio <strong>of</strong> bycatch was the lowest <strong>of</strong> any <strong>of</strong> the study areas, whichalso included waters in Brunswick, New Hanover, Pender and Onslow counties. The meancounts <strong>of</strong> shrimp by month were calculated for the Cape Fear River based on1 tow in August, 5tows in September, 18 tows in October and 10 tows in November. Counts averaged 122 inAugust, 96 in September, 60 in October and 41 in November. All tows were conducted with acommercial 50-foot two-seam otter trawl outfitted with turtle and fish excluder devices.Management Options/Impacts(+ potential positive impact <strong>of</strong> action)(- potential negative impact <strong>of</strong> action)1) Status quo (potential opening dates set by proclamation and determined by sampling)+ Flexibility in dealing with variety <strong>of</strong> conditions+ No need for further rulemaking- Does not address harvest <strong>of</strong> small shrimp or waste/bycatch in some areas- Sometimes necessitates “grand openings”2) Status quo for the main river but establish no trawling areas in the bays south <strong>of</strong> FortFisher and the Baldhead creeks+ Harvest <strong>of</strong> more marketable shrimp+ Potential reduction in waste/bycatch- More regulations- Modifications to strategy may not have intended effect- Possible reduction <strong>of</strong> harvest3) Prohibit all trawling in Cape Fear+ Possible benefit to finfish+ Eliminates any navigational conflicts+ No harvest <strong>of</strong> small shrimp by trawlers- Eliminates traditional trawl fishery in some areas- Financial hardship on some shrimpersAC Recommendation: Status Quo.DMF, and MFC Recommendation: Status quo for the main river but establish no trawlingareas in the bays south <strong>of</strong> Fort Fisher and the Bald Head creeks.272
12.15 Appendix 15. SHRIMP MANAGEMENT IN BRUNSWICK COUNTYThe Brunswick County coastline stretches for approximately 33 miles and is bound bythe Cape Fear River Inlet on the east end and by the Little River Inlet on the west end. Fourbarrier islands, all <strong>of</strong> which are densely developed, are separated by five inlets along thecoastline. Bird Island, located near the South Carolina state line is the smallest <strong>of</strong> the barrierislands and the only one not commercially developed. It was previously separated from SunsetBeach by Mad Inlet but natural processes have closed the Inlet. Between the barrier islandsand the Intracoastal Waterway (IWW), there are many acres <strong>of</strong> estuarine waters with numerouscreeks and three small rivers (Lockwood Folly, Shallotte and Calabash) on the mainland side <strong>of</strong>the IWW. Areas classified as Primary, Secondary or Special Secondary nursery areas areshown on Map 1 and Map 2. Nursery area designations protect these sensitive ecosystemsfrom bottom disturbing gear.Except for the dredged channel <strong>of</strong> the IWW, the CP&L Discharge canal, Lockwood FollyRiver, Calabash River and the inlet channels, the system is shallow and mostly intertidal due tostrong lunar tides. The bottom types range from shell bottoms to s<strong>of</strong>t mud substrates in nurseryareas and the coastal wetlands are home to many intertidal oyster reefs. Dredged areascontain bottom types that are variable mixes <strong>of</strong> mud and sand. Submerged aquatic vegetationhas not been documented in Brunswick County. Habitat is probably more impacted by themaintenance dredging <strong>of</strong> the IWW and coastal development than by shrimp trawling activities.Other than shrimping, significant commercial fisheries that occur in these watersinclude clamming, oystering, crabbing, and gill netting. The DMF actively manages 8 ShellfishManagement Areas (SMAs) in Brunswick County. These SMAs are located in the Shallotte andLockwood Folly Rivers and on the ocean side <strong>of</strong> the IWW in Jinks Creek. There are extensiveareas closed to shellfishing throughout the county especially around Southport, the west end <strong>of</strong>Long Beach, in Lockwood Folly and Shallotte Rivers and behind Ocean Isle and SunsetBeaches.The IWW in Brunswick County is managed based on the size and abundance <strong>of</strong> theshrimp taken in the DMF’s samples. The area is usually open until the beginning <strong>of</strong> June whenit is closed because <strong>of</strong> small brown shrimp. In most years, portions may be opened in late Juneor early July to allow harvest <strong>of</strong> brown shrimp and then closed in late July or early August whensmall white shrimp recruit to the area. Occasionally, small white shrimp may appear before thebrown shrimp reach a harvestable size, thus delaying an opening until the whites areharvestable, usually in September but sometimes as late as November. Principle harvest areasare behind Oak Island, from the Holden Beach Bridge to Shallotte River and from the OceanIsle Beach Bridge to the Sunset Beach Bridge.The IWW channel from the Sunset Beach Bridge to the South Carolina StateLine and the Calabash River are rarely opened to trawling because <strong>of</strong> the abundance <strong>of</strong> smallshrimp. Data from the sampling conducted by DMF show a consistent pattern in the area fromthe Sunset Beach Bridge to Calabash River (Figure 1). Samples were taken with either a 20-foot flat trawl or a 25-foot 4-seam trawl with a 1.50 inch stretched mesh body and a 0.50-inchtailbag. Neither net is outfitted with turtle or fish excluder devices. Prior to the brown shrimpreaching harvestable size in late June or early July, small white shrimp begin recruiting to thewaters. This results in a situation where larger273
8Frequency642041-5051-6061-7071-8081-9091-100>100JUNEJULYFrequency8642041-5051-6061-7071-8081-9091-100>100AUGUST8Frequency642041-5051-6061-7071-8081-9091-100>100SEPTEMBERFrequency8642041-5051-6061-7071-8081-9091-100>100OCTOBERFigure 1.Frequency <strong>of</strong> trips grouped by head-on counts <strong>of</strong> shrimp caught in DMF samplingin the IWW west <strong>of</strong> Sunset Beach Bridge and Calabash River.274
own shrimp (40-50 count) are mixed with smaller white shrimp (>100 count) bringing theoverall count to >60 count. As the brown shrimp migrate from the area and more whites recruit,the counts rise to the 80-90 count range and remain there through most <strong>of</strong> the summer and fall.The population may occasionally reach a harvestable size but larger shrimp migrate quickly tothe ocean leaving smaller shrimp. The area from Sunset Beach Bridge to Calabash River isusually opened toward the end <strong>of</strong> the season so that the shrimp won’t be “lost” to SouthCarolina.The channels that connect the IWW with the Atlantic Ocean usually remain open duringthe entire year to allow harvest <strong>of</strong> shrimp that are migrating to the ocean. In rare instances <strong>of</strong>very heavy rainfall, these channels may be closed. The areas include Elizabeth River,Dutchman Creek, Montgomery Slough, Jink’s Creek and Bonaparte Creek. Trawling inMontgomery Slough and the Elizabeth River has become the subject <strong>of</strong> discussion amongstshrimpers as well as the public because <strong>of</strong> concerns about bycatch as well as interference withnavigation.Eastern Channel, located behind Ocean Isle Beach, is a shallow channel (less than 1meter at mean low tide) that connects the IWW at Marker 93 to Jink’s Creek. Data collected byDMF have indicated a change toward smaller shrimp over the last 10 years. Prior to the 1980s,this area was opened by managers to allow the harvest <strong>of</strong> brown shrimp in late June to earlyJuly. This opening would be followed by a closure in August, followed by an opening for whiteshrimp in September and October. However, due to environmental changes, the shrimp nowseldom reach harvestable size before they migrate. The changes in habitat are attributable tothe deposition <strong>of</strong> a large shoal at the junction <strong>of</strong> Eastern Channel and Jink’s Creek and thesubsequent shoaling <strong>of</strong> Eastern Channel with the cumulative effect <strong>of</strong> shallower water and asandier substrate. These changes have resulted in the waters not being opened to harvest inthe last 15 years. There has been no effort with other gears in this area.The Shallotte River was opened and closed to shrimp trawling based on size andabundance until 1998. However, DMF sampling has shown that shrimp rarely reach large sizesand the head-on counts remain greater than 60 during most <strong>of</strong> the season. Consequently, thelast time DMF opened Shallotte River was a span <strong>of</strong> time in 1998 between July 8 andSeptember 9. There is a small channel net fishery (
Pamlico SoundCore SoundNew RiverNewport RiverNeuse RiverNorth RiverTopstumpIWWCape fear RiverWhite Oak RiverBogue SoundPamlico RiverIWW-BrunswickBay RiverCroatan SoundRoanoke SoundMasonboro SoundPungo RiverShallotte RiverLockwood Folly36,378,4500 2,000,000 4,000,000 6,000,000 8,000,000Pounds <strong>of</strong> <strong>Shrimp</strong>Figure 2. Contribution in total pounds <strong>of</strong> shrimp captured during 1994-2003.Data from Table 1 were extracted from the DMF Trip Ticket Program and were used todescribe the trawl fishery in Brunswick County from 1994-2003. For this analysis, the landingsfrom otter trawls in the Brunswick County IWW were pooled with trawl landings from Shallotteand Lockwood Folly rivers. During 1994-2003, trawl landings ranged from 22,138 lbs. in 1999to 48,141 lbs. in 1995 (Table 1, Figure 3) with an average <strong>of</strong> 30,701.8 lbs. The percent <strong>of</strong> thecatch from otter trawls ranged from 91% in 2003 to 99.1% in 1994. On average, 95.5% <strong>of</strong>landings in Brunswick County were harvested with otter trawls. Other gears landing shrimpinclude a small number <strong>of</strong> channel netters in Shallotte River and a small cast net fishery.60,00050,000Pounds40,00030,00020,00010,00001994199519961997199819992000200120022003TrawlOtherFigure 3. Pounds <strong>of</strong> shrimp captured by gear, Brunswick County 1994-2003.The number <strong>of</strong> participants has been decreasing and only 38 users were documented in276
2003, a decrease <strong>of</strong> 68% from a high <strong>of</strong> 118 participants in 1996 (Table 1, Figure 4). Thenumber <strong>of</strong> trips has been decreasing, falling from over 500 trips in 1994-1996, to between 250-322 trips during 1999-2003 (Table 1, Figure 5). The mean catch has varied over time,fluctuating between 41 lbs. and 116 lbs. per trip.140120Participants1008060402001994199519961997199819992000200120022003TrawlOtherFigure 4. Participants in Brunswick County trawl fishery, 1994-2003.700600500Trips40030020010001994199519961997199819992000200120022003TrawlFigure 5. Trips by gear, Brunswick County 1994-2003.OtherLanded bycatch by gear was calculated and ratios (in pounds) <strong>of</strong> marketable bycatch toshrimp were determined. The ratios were low ranging from 1:32.9 in 2002 to 1:13.0 in 2003.Discarded bycatch is much more difficult to quantify because <strong>of</strong> the lack <strong>of</strong> data in most areas.However, during 2003 and 2004, DMF staff sampled the study area for shrimp managementpurposes utilizing either a 20-ft, 2-seam otter trawl or a 25-foot, 4-seam otter trawl. Neither netwas equipped with a bycatch reduction device or a turtle excluder. Catches were separated int<strong>of</strong>our categories: commercial finfish, non-commercial finfish, invertebrates, and shrimp. Weights<strong>of</strong> each component were summed from all samples and bycatch percentages were derived for277
each year (Figure 6). The majority <strong>of</strong> the tows were conducted prior to the shrimp opening andtow times ranged from 1 to 10 minutes. The primary objective <strong>of</strong> the sampling was to determineif the shrimp were large enough to warrant an opening but the weights <strong>of</strong> all the biomasscomponents were recorded. Finfish accounted for 17% <strong>of</strong> the catch in 2003 and 19% in 2004,while invertebrates (mostly crabs and squid) represented 5% in 2003 and 10% in 2004. <strong>Shrimp</strong>dominated the catches by weight representing over 70% in both years.Brunswick County - 2003Brunswick County - 2004<strong>Shrimp</strong>78%Commercial11%Non-Commercial6%Invertebrates5%<strong>Shrimp</strong>71%Commercial12%Non-Commercial7%Invertebrates10%Figure 6. Percent weight in pounds <strong>of</strong> trawl biomass in IWW Brunswick County 2003-2004. There were 69 and 67 sampling trips from 2003 and 2004, respectively.Preliminary bycatch results from a recently completed (2004) Fishery Resource Grant(Logothetis, pers. comm.) provide information on the bycatch associated with commercialtrawling in the Brunswick County IWW. Based on 20 trips and 46 tows conducted between Apriland October <strong>of</strong> 2003 the ratio <strong>of</strong> bycatch to shrimp was 1.55 : 1. What this means is that for1.55 lb. <strong>of</strong> bycatch captured there was 1 lb. <strong>of</strong> shrimp captured. This ratio <strong>of</strong> bycatch wasranked third lowest <strong>of</strong> all the study areas with the Cape Fear River being the lowest at 0.38 : 1,followed by New Hanover County at 0.70 : 1. All tows were made with a commercial 50-foot, 2-seam otter trawl outfitted with turtle and fish excluder devices.278
Management Options/Impacts(+ potential positive impact <strong>of</strong> action)( - potential negative impact <strong>of</strong> action)1. Status quo (potential opening dates set by proclamation and determined by sampling)+ Flexibility in dealing with variety <strong>of</strong> conditions+ No need for further rulemaking- Does not address harvest <strong>of</strong> small shrimp or waste/bycatch- Sometimes necessitates “grand openings’2. Modify existing management strategy as needed:Prohibit commercial and recreational shrimping, except for cast nets, as in MFC rule3L.0104, in the following areas.i. The Intracoastal Waterway from the Sunset Beach Bridge to SouthCarolina and lower Calabash Riverii. All areas <strong>of</strong> Eastern channel that could potentially open under currentrules.iii. All areas in Shallotte River that could potentially open under current rules+ Harvest <strong>of</strong> more marketable shrimp+ Potential reduction in waste/bycatch+ More and larger shrimp escape to the ocean in lower Brunswick County- More regulations- Possible reduction <strong>of</strong> harvest- Loss <strong>of</strong> shrimp to South Carolina fishermen- Loss <strong>of</strong> shrimp on bait market3. Prohibit all trawling+ Possible benefit to finfish stocks+ Eliminates navigational conflicts+ No harvest <strong>of</strong> small shrimp by inshore trawlers- Eliminates traditional trawl fishery in some areas- Financial hardship on some shrimpersAC and MFC Recommendation: Status quoDMF Recommendation: Prohibit commercial and recreational shrimping, except for cast nets,in the Intracoastal Waterway from the Sunset Beach Bridge to South Carolina, lower CalabashRiver, Eastern Channel and Shallotte River.279
Map 1.IWW from Cape Fear River to Holden Beach.280
Map 2.IWW Holden Beach Bridge to South Carolina.281
Table 1. Catch and Effort data on shrimp and bycatch harvest from Brunswick County(DMF Trip Ticket).Trawls Participants Trips <strong>Shrimp</strong> lbsSoldBycatchMeanCatch perTripRatio <strong>of</strong><strong>Shrimp</strong> toSoldBycatch% CatchfromOtterTrawls2003 38 322 32161.2 2469.2 99.9 13.0 91.02002 34 264 25034.2 759.2 94.8 33.0 91.72001 40 278 23202.9 1257.9 83.5 18.4 91.02000 48 325 37260.4 2801.4 114.6 13.3 96.91999 55 254 22138.5 850.0 87.2 26.0 83.81998 54 395 23572.5 1161.9 59.7 20.3 95.11997 70 455 32111.8 862.6 70.6 37.2 95.51996 118 593 41035.9 1564.7 69.2 26.2 98.01995 96 598 48141.3 1862.1 80.5 25.9 97.81994 104 522 22359.9 1191.0 42.8 18.8 99.1Other2003 5 55 74.0 95.4 1.3 0.82002 9 96 125.5 899.9 1.3 0.12001 5 98 106.5 413.5 1.1 0.32000 7 52 785.6 1247.4 15.1 0.61999 9 54 4288.6 881.4 79.4 4.91998 9 37 599.4 56.6 16.2 10.61997 8 34 59.7 728.0 1.8 0.11996 11 34 439.2 808.0 12.9 0.51995 9 22 982.7 2790.8 44.7 0.41994 4 5 210.2 68.5 42.0 3.1282
12.16 Appendix 16. SHRIMP MANAGEMENT IN CORE SOUNDThe banks side <strong>of</strong> Core Sound north <strong>of</strong> Drum Inlet is a shallow sand bottom area withpatches <strong>of</strong> submerged aquatic vegetation (SAVs). This shallow water/SAV habitat in CoreSound south <strong>of</strong> Drum Inlet and in southern Pamlico Sound from Wainwright Island north toOregon Inlet is protected from shrimp trawling and mechanical clam harvest by differentmethods. The Wainwright Island to Oregon Inlet zone along the banks is designated as a notrawl area. The area from Drum Inlet south to Cape Lookout is closed to shrimp trawling byproclamation.The tributaries <strong>of</strong> Core Sound on the mainland side are designated as SpecialSecondary Nursery Areas (SSNA). They include Jarrett Bay, Brett Bay, Nelson Bay, Thor<strong>of</strong>areBay-Barry Bay and Cedar Island Bay. These bays can be opened after August 16 th whenshrimp reach a harvestable size and fish abundance is at relatively lower levels. Theseopenings are coordinated whenever possible with the October opening <strong>of</strong> Newport River todiffuse effort, even though they can now be opened as early as mid-August.SAV is a fish habitat dominated by one or more species <strong>of</strong> underwater vascular plantsand is defined by the North Carolina <strong>Marine</strong> <strong>Fisheries</strong> Commission as those habitats in publictrust and estuarine waters vegetated with one or more species <strong>of</strong> submerged vegetation suchas eel grass (Zostera marina), shoalgrass (Halodule wrightii) and widgeon grass (Ruppiamaritima). SAVs occur in both subtidal and intertidal zones and may be patchy or continuousmeadows. In patchy areas, bottom between the patches is also considered habitat. SAVhabitat is important to the life cycle <strong>of</strong> many organisms including red drum, spotted seatrout,snapper/grouper, bay scallops, and peneaid shrimp by providing refuge, forage and spawninglocation as well as a nursery area. SAVs provide important ecosystem functions such asstructural complexity, sediment and shoreline stabilization, primary productivity, and nutrientcycling.The amount <strong>of</strong> SAV in North Carolina was estimated to be between 134,000 and200,000 acres around 1990 (Orth et al. 1990; Ferguson and Wood 1994). The majority <strong>of</strong> SAVoccurs in eastern Pamlico Sound and Core Sound in high salinity waters. Because light is theprimary limiting factor affecting its distribution, SAV is restricted to relatively shallow waters,usually less than 1 m in depth. However, the current spatial distribution and acreage <strong>of</strong> SAVmay be somewhat different and changes may have occurred since the original mapping sincegrass beds advance and recede over suitable habitat. Along the Atlantic coast, North Carolinasupports more SAV than any other state except Florida.Overall, there are few specific studies addressing effects <strong>of</strong> trawling over SAVs,however, the knowledge from studies in other bottoms and habitat types may be intuitivelyapplied to what the effects <strong>of</strong> trawling over SAVs may be. These effects include leaf shearingand uprooting in areas that are heavily trawled, resulting in the loss <strong>of</strong> blades and shoots whichin turn reduces the complexity and coverage <strong>of</strong> SAV beds. Turbidity effects, especially in areas<strong>of</strong> low energy where sediment types tend to be mud/silt can reduce light levels needed forphotosynthesis.Impacts from trawling over SAV may occur from the sweep <strong>of</strong> the net and the digging <strong>of</strong>the trawl doors into the sediment (ASMFC 2000). In the Gulf region, it has been noted thattrawling by larger vessels in deep water (2-3 m) through SAV resulted in edges <strong>of</strong> SAV rippedup and observed masses <strong>of</strong> SAV floating on the surface following the opening <strong>of</strong> shrimpseason. It was also noted that shallow SAV beds were not affected by trawling except during283
high tides when beds were more accessible (Eleuterius 1987).The DMF proposes to close the banks side <strong>of</strong> Core Sound north <strong>of</strong> Drum Inlet byproclamation or extending the No Trawl area south from Wainwright Island. The affected areais too shallow to be trawled and is <strong>of</strong>f limits to mechanical clam harvest, so its more formalizedprotection will not impact present use much.One <strong>of</strong> the DMF’s draft Coastal Habitat Protection Plan implementation tasks is to lookat the present management <strong>of</strong> bottom disturbing gear and map where these activities overlapwith sensitive habitat. Modification <strong>of</strong> these lines, where they exist, is to be examined. Anothertask is to modify shrimp trawling areas through the ongoing <strong>Shrimp</strong> Fishery Management Planprocess to restrict trawling over or immediately adjacent to shell bottom, SAV, or nursery areasand maintain an adequate buffer. These tasks are also being considered as we think aboutcriteria for management <strong>of</strong> shrimp trawling areas and where we have inconsistencies, likenorthern Core Sound, this is an opportunity to correct them.The catches <strong>of</strong> shrimp in Core Sound after the late October openings <strong>of</strong> the SSNAs havecomprised between 1.1% and 4.7% <strong>of</strong> the total Core Sound landings since the year 2000.Although the SSNA waterbodies are included in the Core Sound total and cannot be separated,it is apparent that in most years, October signals the end <strong>of</strong> shrimping. If the Core SoundSSNAs were to be closed, there is still and opportunity to catch the shrimp in Core Soundproper, but trawling would be largely be limited to the channel only.284
Management Options/Impacts(+ potential positive impact <strong>of</strong> action)(- potential negative impact <strong>of</strong> action)1) Status quo (potential to open up to PNA line when shrimp size sufficient)+ Flexibility in reacting to variable conditions (excessive rainfall, early migration)+ No need for further rulemaking- Does not minimize harvest <strong>of</strong> small shrimp and bycatch- Does not encourage the use <strong>of</strong> more environmentally friendly gear- Does not prevent damage to shellfish plantings, natural rocks and leases- Labor intensive and expensive to sample- Necessitates “grand openings”2) Prohibit all shrimp trawlers in SSNAs <strong>of</strong> Core Sound+ Bycatch issue completely eliminated+ Potential for healthier shellfish/finfish stocks+ Protection <strong>of</strong> SAVs present+ Decrease navigational and fixed vs. mobile gear conflicts in inside waters- Eliminates potentially lucrative opening day for fishermen- Much less “downstream” area to catch shrimp before they migrate to ocean- Loss <strong>of</strong> income to commercial fishermen and dealers- Loss <strong>of</strong> recreational use <strong>of</strong> shrimp resource3) Status quo (Core Sound banks side opened)+ Does not eliminate bottom that may be trawled by small trawlers- Does not protect SAV- Does not protect species using SAV4) Close grassbed areas on the bank side <strong>of</strong> northern Core Sound+ protects additional habitat areas+ protects species utilizing SAV- May eliminate bottom trawled by small trawlersAC, DMF, and MFC Recommendation: Make banks side north <strong>of</strong> Drum Inlet to WainwrightIsland a Trawl Net Prohibited Area (Option 4).285
12.17 Appendix 17. SHRIMP MANAGEMENT IN THE NEWPORT RIVERThe Newport River is relatively small estuary <strong>of</strong> about 63 square miles located north <strong>of</strong>Morehead City in Carteret County. Its average depth is three feet with maximum depth innatural channels <strong>of</strong> six feet and 40 feet in the dredged channels near the State Port. Thewestern portion <strong>of</strong> Newport River has bottoms composed <strong>of</strong> silts, clays and oyster rocks and theeastern part is composed <strong>of</strong> firm sand bottom. The river has a long history <strong>of</strong> disagreementsconcerning where the proper location <strong>of</strong> the shrimp line should be. During the long period <strong>of</strong>conflict that peaked in the mid-1980s, the line would be moved three or four times a season inresponse to political lobbying and shrimp size variation.<strong>Shrimp</strong> harvest generally begins in June when there are pink shrimp present and cancontinue into November when white shrimp are abundant. Although the conflict over thelocation <strong>of</strong> the line has greatly decreased in recent years, Newport River is still the source <strong>of</strong>controversy at times in the fall. The primary conflict is between the full-time commercialfishermen, who generally want a line downstream where the bigger shrimp will migrate to themwhen they reach a marketable size, and the part-time fishermen, who want a line fartherupstream to access the shrimp in shallower water, harvest the majority <strong>of</strong> them, and return tojobs or hunting season. Landings after the October opening dates for the years 2000 through2003 ranged from 3.4% <strong>of</strong> total Newport River landings to 25.5%. The line has moved back andforth among four lines since 1968, when the line was at the Cross Rock.The western half <strong>of</strong> the Newport River has been the target <strong>of</strong> significant shellfishmanagement efforts over the past 30 years. Natural oyster rocks extend from the Cross Rock inthe western part <strong>of</strong> the river through White Rock at the mouth <strong>of</strong> Harlowe Creek. They also existalong the shores <strong>of</strong> Newport River Marshes and the entrance to Core Creek. The DMF hasplanted approximately 133,000 bushels <strong>of</strong> cultch material in the western portion <strong>of</strong> NewportRiver since 1987 (and more prior to that). Several designated Shellfish Management Areas(SMAs) have been created for the purpose <strong>of</strong> expanding the natural rocks like Flat Rock, WhiteRock, Turtle Rock and the Bullseye Rock. Surf clam shells proved to be an effective cultchmaterial for the protection <strong>of</strong> clam spat along the White Rock line and elsewhere.There are two concentrations <strong>of</strong> shellfish bottom leases in the Newport River; one in thecentral part <strong>of</strong> the river from Oyster Creek west to Mill Creek, and the other along the easternshore <strong>of</strong> the river between Russell and Ware creeks. At the present time, there are about 55active leases consisting <strong>of</strong> about 325 acres <strong>of</strong> bottom. This acreage represents approximately10% <strong>of</strong> the state’s total leased bottom.In recent years, the line has been located from Penn Point to the boat ramp at HardestyFarms subdivision. This line has been a successful one in that it protects the smaller shrimpthat move out <strong>of</strong> Harlowe Creek in the early summer and provides a buffer when the abundance<strong>of</strong> juvenile shrimp, heavy rainfall or strong northerly winds move the shrimp downstream <strong>of</strong> theirnormal location. The Penn Point-White Rock line is favored by smaller trawlers who canoperate in the shallow waters at the mouth <strong>of</strong> Harlowe Creek. The Penn Point-Hardesty Farmline is longer and deeper providing more maneuvering room for the trawlers.The Primary Nursery Area (PNA) line presently runs from Lawton Point through theBullseye Rock to the north shore and from there to the line form Harlowe Creek south to PennPoint is designated a Special Secondary Nursery Area (SSNA). Nursery area sampling recordsindicate that spot, croaker, brown shrimp, blue crab and southern flounder are the top speciescaptured. The SSNA designation allows shrimp trawling to occur after August 16 each year and286
the river is generally opened to the PNA line in mid-October, in conjunction with the Core SoundSSNA tributaries. This causes problems between leaseholders and trawlers because theleases are <strong>of</strong>ten trawled over causing the cultch material and oyster resources on them to becovered in sediment, particularly on a rising tide. A rule making it unlawful to trawl over properlymarked leases was enacted in 1992 and the DMF’s Shellfish Management Areas are marked asadequately as possible in October, but violations still occur. Frequent complaints arise fromshellfishermen when the area is opened to trawling.There are no seagrass beds in Newport River except a small bed east <strong>of</strong> Phillips Island<strong>of</strong>f the Intracoastal Waterway. Mechanical clam harvest has been allowed in the eastern half <strong>of</strong>the Newport River and the mouth <strong>of</strong> Core Creek since 1979 or before.As is the trend elsewhere in Carteret and Onslow counties, there is a move toward theuse <strong>of</strong> skimmer trawls in Newport River. <strong>Shrimp</strong> landings from skimmer trawls over the period1994-2003 have averaged 76.83%, while otter trawls have averaged 20.28% <strong>of</strong> the total duringthat period. Although originally used for white shrimp, the Newport River fishermen havebecome adept at capturing brown shrimp successfully with skimmer trawls too. Total landings<strong>of</strong> all shrimp by all gears in the Newport River since 1994 have ranged from 71,793 lb to307,504 lb and averaged 201,206 lb. The number <strong>of</strong> trips averaged 1042 per year during thatperiod.Proponents <strong>of</strong> trawling above the Penn Point-Hardesty Farms line in October cite thelack <strong>of</strong> growth <strong>of</strong> remaining shrimp due to falling water temperatures and the need to stir upsedimentation by trawling to remove silt from the upper river. They claim that stirring the bottomremoves silt (at least at ebbing tides), keeps it oxygenated (or alive), and exposes old oysterrocks and plantings to new spat set the following spring.A Sea Grant funded Duke University <strong>Marine</strong> Lab Study by Kirby-Smith and Costlow (1996)states that the Newport River has filled in 16 inches over the past 81 years and rates averaged2/10 inch per year with a maximum <strong>of</strong> ½ inch per year during the 1990s. This rate exceeds thepresent rate <strong>of</strong> sea level rise. Therefore, it seems that trawling will ultimately have little effect onthe natural process <strong>of</strong> filling <strong>of</strong> the river.287
Management Option/Impacts+ potential positive impact <strong>of</strong> action- potential negative impact <strong>of</strong> action1) Status quo (potential to open to PNA line when shrimp size sufficient)+ Flexibility in reacting to variable conditions (excessive rainfall, early migration)+ Access to resource by a variety <strong>of</strong> users+ No need for further rulemaking on the use <strong>of</strong> trawls in the SSNA- Does not minimize harvest <strong>of</strong> small shrimp and bycatch- Does not prevent damage to shellfish plantings, natural rocks and leases- Labor intensive and expensive to sample- Necessitates “grand openings”2) Establish timeline when otter trawls would be prohibited+ More time for fishermen to adapt to change+ Possible decreased financial hardship+ Trend already to skimmer use- No immediate remedy for waste/fish kills on opening day- No immediate benefits to SMAs and leases- Trend already to skimmer use3) Implement permanent line at Penn Point-Hardesty Farm line+ Eliminates grand openings+ Protection <strong>of</strong> shellfish plantings, natural oyster rocks and leases+ Longer and deeper line for less congestion when trawling- Lose flexibility <strong>of</strong> management by proclamation4) Prohibit all shrimp trawlers in Newport River+ Bycatch issue completely eliminated+ Potential for healthier shellfish/finfish stocks+ Protection <strong>of</strong> leases and SMAs+ Decrease navigational and fixed vs. mobile gear conflicts in inside waters- Eliminates potentially lucrative opening day for fishermen- No “downstream” area to catch shrimp before they migrate to ocean- Loss <strong>of</strong> income to commercial fishermen and dealers- Loss <strong>of</strong> recreational use <strong>of</strong> shrimp resource- Inconsistent with allowance <strong>of</strong> mechanical clam harvestAC, DMF, and MFC Recommendation: Implement permanent Penn Point-Hardesty Farms line(Option 3)288
12.18 Appendix 18. SHRIMP MANAGEMENT IN BOGUE SOUND AND NORTH RIVERBogue Sound is located in Carteret County and lies between the State Port in MoreheadCity to the east and the town <strong>of</strong> Emerald Isle to the west. The sound is closed to trawling north<strong>of</strong> the Intracoastal Waterway (ICW) on the mainland side because <strong>of</strong> SAV and some shellfishbeds. The tributaries <strong>of</strong> Broad, Gales, Jumping Run, and Saunders creeks are designatedPrimary Nursery Areas. The closure <strong>of</strong> the mainland side <strong>of</strong> the ICW serves as a buffer zone tothe PNAs and shrimp are harvested from the ICW as they are migrating toward the inlets(Beaufort and Bogue). There have been requests to open the northern side <strong>of</strong> the ICW,particularly around Broad Creek when white shrimp are abundant. These requests usuallycome from skimmer trawl fishermen who have problems fishing in the waterway.There is also a triangular section <strong>of</strong> Bogue Sound in the western portion that is closed totrawling in order to protect seagrass beds with bay scallops which are located there. Most <strong>of</strong>Bogue Sound outside <strong>of</strong> the ICW is too shallow to trawl in, bit there is a channel on the banksside that runs along the village <strong>of</strong> Salter Path and one that runs along Pine Knoll Shores thatare trawled.<strong>Shrimp</strong> landings in Bogue Sound from 1994 to 2003 have ranged from 9,906 pounds to127,781 pounds and averaged 40,340 pounds. Value <strong>of</strong> shrimp catches during those yearsranged from $13,484 to $155,164 and averaged $66,896. The Bogue Sound shrimp trawlfishery is important to the local Broad Creek and Salter Path area shrimpers and a very popularrecreational (RCGL) shrimping location. Of the commercial landings from 1994 through 2003,41.47% were harvested by shrimp trawls, 36.73% by skimmer nets, and 21.54% by channelnets. During that period, trips made ranged from 24-217 and averaged 130 a year.Management Option/Impacts+ potential positive impact <strong>of</strong> action- potential negative impact <strong>of</strong> action1) Status quo (opening dates determined by shrimp size)+ Flexibility in reacting to variable conditions (excessive rainfall, early migration)+ Access to resource by a variety <strong>of</strong> users+ No need for further rulemaking- Does not minimize harvest <strong>of</strong> small shrimp and bycatch- Does not encourage the use <strong>of</strong> more environmentally friendly gear- Does not prevent damage to shellfish plantings, natural rocks and leases- Labor intensive and expensive to sample2) Establish a timeline when otter trawls would be prohibited in Bogue Sound+ More time for fishermen to adapt to change+ Possible decreased financial hardship- No immediate remedy for waste/fish kills on opening day- No immediate benefits to SMAs- Eliminates ICW trawling3) Prohibit all otter trawls and skimmer trawls in Bogue Sound+ Bycatch issue completely eliminated+ Potential for healthier shellfish/finfish stocks+ Decrease navigational and fixed vs. mobile gear conflicts in inside waters289
- Eliminates potentially lucrative opening day for fishermen- No “downstream” area to catch shrimp before they migrate to ocean- Loss <strong>of</strong> recreational shrimp fishery- Loss <strong>of</strong> income to commercial fishermen and dealersAC, DMF, and MFC Recommendation: Status quoNorth River:North River is located west <strong>of</strong> Beaufort and east <strong>of</strong> Harkers Island. It also has a history<strong>of</strong> line moving disputes between a downstream line at Long Point line and an upstream linecalled the Oyster House line. Both lines were established to protect small brown shrimp in theearly summer (Long Point line) and small white shrimp in the fall (Oyster House line). Thesource <strong>of</strong> conflict was the appropriate time to open trawling up to the Oyster House line.Concerns with opening the area too late include the shrimp running on a northeast wind as wellas running on rain and/or full or new moon because <strong>of</strong> its close proximity to Beaufort Inlet.In June <strong>of</strong> 1997, a public meeting was held in Harkers Island to discuss the best way tomanage the river for the benefit <strong>of</strong> the most users, while protecting small shrimp. At thatmeeting, there was unanimous agreement to move the Wards Creek line downstream to themouth <strong>of</strong> the creek and move the Long Point line upstream to the next point north. These lines<strong>of</strong>fered deeper water, more shelter to work in a northeast wind and provided an adequate bufferfor both brown and white shrimp. It was agreed that these lines would become “permanentlines” in North River and not moved. During years when shrimp are abundant there is anoccasional spillover <strong>of</strong> shrimp downstream <strong>of</strong> those lines and on one or two occasions since1997 when high winds and rainfall amounts have pushed small shrimp below the lines, the LongPoint line was temporarily used to protect them. However, once the proclamation was issued,there was pressure from fishermen to honor the permanent line. Now the DMF continues tokeep this line as a closure line unless unusual conditions such as in 2003 where high amounts<strong>of</strong> rainfall displaced small shrimp into open areas causing the DMF to close all <strong>of</strong> North River aswell as the Straits.The shrimp landings in North River/Back Sound from 1994 to 1999 have ranged from27,391 pounds to 216,045 pounds and averaged 125,214 pounds. Values during that periodranged from $53,066 to $309,372 and averaged $240,830. The North River landings arecombined with those <strong>of</strong> Back Sound, which confounds things due to the significant numbers <strong>of</strong>channel net landings in Back Sound.Of the commercial catch in North River/Back Sound between 1994 and 2003, 66.23% <strong>of</strong>it was caught using skimmer nets, 21.05% was captured by shrimp trawls, and 12.54% wascaught with channel nets. Number <strong>of</strong> trips ranged from 40 to 524 and average 186 per year.Management Option/Impacts+ potential positive impact <strong>of</strong> action- potential negative impact <strong>of</strong> action1) Status quo (negotiated “permanent line”)+ Known, unchanging line that <strong>of</strong>fers working area protected from northerly winds)+ Access to resource by a variety <strong>of</strong> users+ No need for further rulemaking290
+ Prevents damage to shellfish leases and natural oyster rocks- Does not minimize harvest <strong>of</strong> small shrimp and bycatch- Does not encourage the use <strong>of</strong> more environmentally friendly gear2) Prohibit all otter trawls and skimmer trawls in North River+ Bycatch issue completely eliminated+ Potential for healthier shellfish/finfish stocks+ Decrease navigational and fixed vs. mobile gear conflicts in inside waters- No “downstream” area to catch shrimp before they migrate to ocean- Loss <strong>of</strong> recreational shrimp fishery- Loss <strong>of</strong> income to commercial fishermen and dealersAC, DMF, and MFC Recommendation: Status quo291
12.19 Appendix 19. SHRIMP MANAGEMENT IN THE WHITE OAK RIVERWhite Oak River is located on the Onslow/Carteret County line and has the town <strong>of</strong>Swansboro at its mouth. The Highway 24 bridge and causeway system has effectively alteredthe normal tidal flow and shoals have been formed in its southern portions as the flood tidesediment settles out. Flow out <strong>of</strong> the river during ebb tide is largely confined to the western side<strong>of</strong> the river along the Swansboro side. The river has a deep channel up to and past JonesIsland and then narrows about halfway up to a small natural channel whose buoys aremaintained by the Wildlife Resources Commission. There are many oyster rocks in the lowerhalf <strong>of</strong> the river, but due to overcrowding, lack <strong>of</strong> sufficient flow and food, very few oysters reachthe three inch minimum size for harvest. More oyster rocks are found upstream which growlarger, but sources <strong>of</strong> pollution have caused the river to be closed to shellfish harvest north <strong>of</strong>Hancock Point. There are a few clumps <strong>of</strong> seagrass in Hills Bay and clams are found in theshell beds in the lower half <strong>of</strong> the river.The White Oak commercial shrimp landings have declined from 45,019 lbs. in 1994 to8,690 lbs. in 2003. A total <strong>of</strong> 802 trips was taken by 180 licensees during that same ten yearperiod. Recreational shrimp trawlers work the White Oak River, especially on opening days.<strong>Shrimp</strong> from the river have traditionally filled recreational fishermen’s freezers and also supplieda market for bait shrimp at the Bogue Banks ocean fishing piers.Due to the presence <strong>of</strong> oyster rocks and shoals, there are only a few places that are ableto be trawled in the White Oak. They are Hills Bay below Jones Island, the mouth <strong>of</strong> PettifordCreek, the Turnstake, Cahoon’s Slough above Jones Island, and the Gator Gap upstream nearBluff Point.The river is closed at the Highway 24 Bridge with the issuance <strong>of</strong> the first shrimpproclamation in early June. Sampling for opening White Oak River generally begins around theend <strong>of</strong> June because <strong>of</strong> the tendency for shrimp there to migrate out before they “normallyshould”. Historically, the DMF has opened White Oak between July 10 and July 20. For years,the river was opened to the Gator Gap where the river widens near Bluff Point. Small shrimpwere <strong>of</strong>ten forced across that line and the DMF has tried alternative line locations with varyingsuccess that allow for shrimping in the lower portion <strong>of</strong> the river while protecting small brownand white shrimp upstream. Adjusting the line is difficult due to the amount <strong>of</strong> oyster rocks inthe river. <strong>Shrimp</strong>ers like to tow on the line, therefore placement <strong>of</strong> the line over oyster rock canlead to habitat destruction <strong>of</strong> those rocks.Issues that must be considered in the management <strong>of</strong> this river besides shrimp size areweather conditions and lunar stage. Early northerly winds with a lot <strong>of</strong> rain or a hurricane canforce the small shrimp to run before the normal opening dates. A full or new moon on top <strong>of</strong> thatmay also cause the DMF to open on a smaller count so they can be caught.Occasionally, shrimp will not reach a 45-55 count but will remain at a small sizethroughout the season. In this case, the DMF may open on a smaller count. The river may ormay not close due to small white shrimp. Over the past few years, once the river has beenopen, a closure for small whites has not been needed as the two species seem to segregatewithin the river very well with small whites staying up the river above the closure line in the lowersalinities while the larger brown shrimp have moved down in the open area. However, whenthere is good sign <strong>of</strong> small white shrimp, the river has been closed in September.With the bridge being the closure line, there is no shrimp trawling allowed in White Oak292
River when it is closed. If the shrimp leave before the river is opened, then the only fishermenwho benefit are a few channel net fishermen and maybe ocean trawlers. Options have beenconsidered to leave the river closed at all times to protect the oyster rocks, but that isinconsistent with permitting mechanical clam harvest up to the Turnstake and does not allowtrawlers to catch the shrimp at all. The mechanical harvest <strong>of</strong> clams is permitted in the WhiteOak every other year and is rotated with the New River in a successful strategy to conserveeach river’s clam resource.Management Option/Impacts+ potential positive impact <strong>of</strong> action- potential negative impact <strong>of</strong> action1) Status quo (opening dates determined by shrimp size)+ Flexibility in reacting to variable conditions (excessive rainfall, early migration)+ Access to resource by a variety <strong>of</strong> users+ No need for further rulemaking- Does not minimize harvest <strong>of</strong> small shrimp and bycatch- Does not encourage the use <strong>of</strong> more environmentally friendly gear- Does not prevent damage to shellfish plantings, natural rocks and leases- Labor intensive and expensive to sample- Necessitates “grand openings”2) Establish a “permanent” line from the Turnstake downstream to allow harvest whenshrimp begin to migrate+ Eliminates the all or nothing aspect <strong>of</strong> White Oak harvest+ Establishes permanent line that would not change+ Protects upstream SMAs and natural rocks+ Eliminates grand openings- Potential for small shrimp harvest during unusual weather events3) Establish a timeline when otter trawls would be prohibited in White Oak River+ More time for fishermen to adapt to change+ Possible decreased financial hardship- No immediate remedy for waste/fish kills on opening day- No immediate benefits to SMAs4) Prohibit all otter trawls and skimmer trawls in White Oak River+ Bycatch issue completely eliminated+ Potential for healthier shellfish/finfish stocks+ Decrease navigational and fixed vs. mobile gear conflicts in inside waters- Eliminates potentially lucrative opening day for fishermen- No “downstream” area to catch shrimp before they migrate to ocean- Loss <strong>of</strong> recreational shrimp fishery- Loss <strong>of</strong> income to commercial fishermen and dealersAC Recommendation: Status quo with a recommendation to straighten the Hancock Pointarea line for ease <strong>of</strong> enforcementDMF, and MFC Recommendation: Status quo except that the line shall not be placedupstream <strong>of</strong> the Hancock Point area for protection <strong>of</strong> oyster rocks and small shrimp293
12.20 Appendix 20. SHRIMP MANAGEMENT IN THE NEUSE RIVERThe Neuse River is one <strong>of</strong> the state’s larger rivers and separates Pamlico County to thenorth from Craven and Carteret counties to the south. The river is one mile wide at New Bernand five miles wide near its mouth, with depths in that stretch ranging from 12 to 23 feet in thedeepest parts. Although shrimp and crab trawling are technically permitted from New Berndownstream to the Pamlico Sound (except when closed due to small shrimp size), shrimp areonly found as far upstream as Slocum Creek. The majority <strong>of</strong> the Neuse tributaries aredesignated primary (2,835 acres), secondary (2,358 acres), or special secondary (963 acres)nursery areas. <strong>Shrimp</strong> generally grow in these nursery areas during the early spring and beginmigrating out <strong>of</strong> them and into the river proper in July. Once in the river, they migrate aroundCedar Island into Core Sound, or down Adams and Clubfoot creeks toward Beaufort Inlet to theocean.There are few seagrass beds that have been mapped in Neuse River. Severalestablished oyster rocks have been located in the in the Neuse River, but are not formallymapped. During the 1980s and 1990s, there were fairly regular fish kills associated with lowdissolved oxygen levels in the July-August period in deeper waters when winds were calm andthere was little rainfall.Neuse River ranks third in the state behind Pamlico and Core sounds in shrimp trawllandings. From 1994 to 2003 landings have ranged from 19,942 pounds to 216,922 poundsand averaged 135,369 pounds. Value <strong>of</strong> shrimp catches during those years ranged from$43,989 to $471,504 and averaged $ 304,502. Of the commercial landings in Neuse River from1994 through 2003, 95.72% were harvested by shrimp trawls, 3.84% by skimmer nets, and0.25% by channel nets. During that period, 4,542 trawl trips were made by 824 licensees for anaverage <strong>of</strong> 452 trips per year by 82 participants.For the period from 1994 through 2003, the month <strong>of</strong> July has produced the mostlandings. On average, June accounted for 15,1% <strong>of</strong> the total, July accounted for 49.5%, andAugust 13.5%. September and October landings represented 10.9% and 7.1% <strong>of</strong> the grandtotal. The remaining months accounted for only 3.9% <strong>of</strong> the total landings (Table 1).The breakdown <strong>of</strong> the market grades (heads on per pound) for the months <strong>of</strong> June, Julyand August during the 1994 through 2003 period reveal the progression <strong>of</strong> shrimp growththrough the summer. These landings data are taken from trip tickets with landings reported asheads on. In June, 21.66% <strong>of</strong> the catch was 31-35 count, 20.57% <strong>of</strong> the catch was 36-40 countand 13.81% <strong>of</strong> the catch was 26-30 count. The shrimp continue to grow and in July, 34.46% <strong>of</strong>the catch was 26-30 count, 19.48% was 16-20 count and 16.56% was 31-35 count. In August,29.53% <strong>of</strong> the catch was 20-25 count, 19.48% <strong>of</strong> the catch was 16-20 count, and 12.25% <strong>of</strong> thecatch was 26-30 count.The Neuse River tributaries, particularly Clubfoot, Adams, Broad creeks and <strong>of</strong>fshoreOriental provide the Recreational Commercial Gear License (RCGL) shrimp trawl fishermenwith very important recreational shrimping locations. In 2003, 43% <strong>of</strong> the reported state RCGLshrimp trips were made in the Neuse River, with 17,134 pounds <strong>of</strong> shrimp caught.294
Table 1. Neuse River monthly shrimp landings 1994-2003.YearMonth 1994 1995 1996 1997 1998 1999 2000 2001 2002 2003Jan 0 0 0 0 0 0 0 0 0 0Feb 0 0 0 0 0 0 0 0 0 0Mar 0 42 284 0 0 0 0 0 0 0Apr 0 0 7 10 0 0 0 0 423 0May 2,131 2,395 59 0 0 293 0 0 6,543 0Jun 8,457 24,688 7,377 2,786 25,575 15,534 30,596 581 67,432 12,897Jul 42,900 18,318 67,212 36,562 13,636 156,384 143,645 12,780 89,561 60,587Aug 17,850 12,803 21,528 62,750 3,187 13,154 14,814 4,300 10,559 18,629Sep 15,578 18,936 8120 35,133 20,981 24,500 2,448 1,230 8,341 5826Oct 21,414 19,344 413 17,674 19,241 997 1,414 151 10,354 447Nov 6,648 12,513 770 3,518 1,130 725 1,117 0 6,564 0Dec 0 49 673 0 0 0 0 0 30 0Total 114,978 109,088 106,443 158,433 83,750 211,587 194,034 19,042 199,807 98,386In past years, the management <strong>of</strong> the Neuse River has included opening the river inearly June and leaving Adams Creek and West Bay opened (Figure 1). In years when shrimpare scarce or <strong>of</strong> average abundance, the closure lines stay the same the entire year. Whenthere are great numbers <strong>of</strong> juvenile shrimp in the tributaries, they may move out “early” insearch <strong>of</strong> room and food, or due to heavy rainfall in the critical weeks prior to their reachingharvestable size. During these years, the presence <strong>of</strong> small shrimp necessitates closures toprotect the small shrimp until they reach harvestable size.South River is currently left opened to trawling. It rarely contains shrimp, but is trawledregularly during the summer months for crabs. Most <strong>of</strong> Turnagain Bay is a Special SecondaryNursery Area, which opens with the other SSNAs in October.295
Figure 1.Neuse River open.In reviewing the past eleven years’ proclamations, the shrimp season began with a Juneopening and did not have to be closed for three years (Figure 1). For six out <strong>of</strong> the elevenyears, after the June opening, tributary creeks had to be closed in mid-June and were reopenedin mid-July. In 2001 and 2002, the initial June proclamation had the Neuse River closed to themouth due to small shrimp present in the normally opened waters at the beginning <strong>of</strong> theseason.296
Figure 2.Neuse River closed.The line that protects small shrimp on the north side <strong>of</strong> the river runs along the channelmarkers from Dawson Creek to the mouth <strong>of</strong> Neuse River. This line was used in 1999 for thefirst time and again in 2000 when overcrowding, weather, or both forced small shrimp out <strong>of</strong> theOriental area creeks and complaints began about catching small shrimp (Figure 3). The linealong the channel markers is a difficult line to enforce and <strong>of</strong>ten the same size shrimp will befound on the open side <strong>of</strong> the line as in the closed area. The capture <strong>of</strong> small shrimp in thatarea is wasteful and some closure line is warranted.297
Figure 3.North side <strong>of</strong> Neuse River closure.Once closed, either at the channel markers or at the river’s mouth, there is always aconsiderable difference <strong>of</strong> opinion among the public as to what the appropriate opening size is,with larger commercial boats wanting a larger count and RCGL fishermen being satisfied with40 or 50 (heads on) count shrimp for their freezers. DMF sampling is conducted to determinethe shrimp size and the river has been opened on approximately 30-35 count shrimp in mid-July. When the river, creeks and bays are opened, even though there is a conscious effort toopen as many areas as possible together to distribute the fishermen, there is always the grandopening aspect to contend with. For example, as many as 200 boats have been present forpast opening days in Adams Creek. This causes navigation hazards in concentrated areas,increases bycatch mortality, and reduces the number <strong>of</strong> shrimp available for the remainder <strong>of</strong>the season (catching the majority <strong>of</strong> them up at one time).Several changes to blue crab management proposed in the 2004 Blue Crab Fishery298
Management Plan update will have indirect benefits to the Neuse River shrimp fishery. Thechange in designated crab pot areas in most areas <strong>of</strong> the Neuse River from a distance <strong>of</strong>fshoreto the six-foot depth contour and prohibiting trawling within that contour from June throughNovember will greatly decrease shrimp trawling effort in the river, particularly by the smallercommercial vessels and the RCGL fishermen. The same plan proposes to make the minimummesh size for crab trawls in the western half <strong>of</strong> Pamlico Sound and its tributaries, includingNeuse River, four (4) inches stretched mesh. This should reduce impact on finfish and shrimp.These rules are scheduled to be effective September 1, 2005.The availability <strong>of</strong> quantitative bycatch data is lacking in the Neuse River system.Johnson (2003) quantified the catch <strong>of</strong> shrimp trawlers working in the Neuse River (n=8 tows)during the summers <strong>of</strong> 1999 and 2000. Overall, invertebrates made up 24% <strong>of</strong> the sampledcatches (Table 2). Atlantic croaker (44%), and spot (33%) accounted for 77% <strong>of</strong> the finfishbycatch (Table 3). The bycatch <strong>of</strong> southern flounder in shrimp trawls is <strong>of</strong> concern given thestatus <strong>of</strong> the stock. Figure 4 shows the catch-per-unit-effort (CPUE) <strong>of</strong> southern floundercaptured in the DMF’s Pamlico Sound survey. The overall CPUE <strong>of</strong> southern flounder in theNeuse River is seven fish per tow (1987-2003). The CPUE for the upper and middle section <strong>of</strong>the river is six per tow and for the lower section, nine southern flounder caught per tow.Table 2.Catch composition (top ten) by weight for shrimp trawl catches in the Neuse River(Johnson 2003).Total Percent <strong>of</strong> FrequencyRank Species weight (lbs) total catch<strong>of</strong>occurrence1 Croaker 1,021 32.82 82 Spot 783 25.15 83 <strong>Shrimp</strong> 354 11.37 84 Blue crabs 341 10.94 85 Other fish (undivided, etc.) 150 4.82 66 Pinfish 103 3.30 47 Menhaden 95 3.05 48 Invertebrates (other) 67 2.14 8Flounder, other or9 unspecified 53 1.70 510 Unknown drum species 50 1.60 396.91299
Table 3.Finfish catch composition (top ten) by weight for shrimp trawl catches in the NeuseRiver (Johnson 2003).Total % <strong>of</strong> total FrequencyRank Species weight (lbs) catch<strong>of</strong>occurrence1 Croaker 1,021 43.45 82 Spot 783 33.30 83 Other fish (undivided, etc.) 150 6.38 64 Pinfish 103 4.37 45 Menhaden 95 4.04 4Flounder, other or6 unspecified 53 2.25 57 Unknown drum species 50 2.12 38 Mackerel 30 1.26 49 Cutlassfish 22 0.92 210 Silver perch 11 0.45 298.53Management Option/Impacts+ potential positive impact <strong>of</strong> action- potential negative impact <strong>of</strong> action1. Status quo (potential to close and open when shrimp are <strong>of</strong> sufficient size)+ Flexibility in reacting to variable conditions (excessive rainfall, early migration)+ Access to resource by a variety <strong>of</strong> users+ No need for further rulemaking on the use <strong>of</strong> trawls in the SSNA- Does not minimize harvest <strong>of</strong> small shrimp and bycatch- Labor intensive and expensive to sample- Sometimes necessitates “grand openings”2. Implement closure <strong>of</strong> Neuse River and Adams Creek with initial June proclamation andopen in mid July when the majority <strong>of</strong> the shrimp reach 30-35 count (heads on).+ Protection <strong>of</strong> small shrimp and juvenile fish and crabs using bay and creek mouths+ Potential for larger shrimp when trawling is opened- Lose flexibility <strong>of</strong> management by proclamation- Loss <strong>of</strong> resource to RCGL and smaller commercial trawlers- Differing sizes <strong>of</strong> shrimp in different bays3. Prohibit all shrimp trawlers in Neuse River and tributaries+ Bycatch issue completely eliminated+ Potential for healthier shellfish/finfish stocks+ Decrease navigational and fixed vs. mobile gear conflicts in inside waters- Loss <strong>of</strong> income to commercial fishermen and dealers- Loss <strong>of</strong> recreational use <strong>of</strong> shrimp resource300
4. Prohibit shrimp and crab trawling (Prohibited Trawling Area) upstream <strong>of</strong> a line fromWilkinson Point to Cherry Point (Figure 5)+ Potential reduction in bycatch+ Less impact to bottom habitat from trawling- Potential loss <strong>of</strong> shrimp during years when they occur upstream <strong>of</strong> that lineFigure 5. Option 4AC Recommendation: Open on 26-30 count heads-on count on or after July 7. Restrict totalheadrope to 90 feet upstream <strong>of</strong> a line between Windmill Point at Oriental and Winthrop Point atAdams Creek.DMF Recommendation: Close in mid-June to allow for pink shrimp harvest, open in mid-July tomaximize brown shrimp catch (31-35 count) and close in mid-October (or whenever majority <strong>of</strong>white shrimp have left).Never open above Wilkinson Point to Cherry Point to reduce overall trawling impact on riverbottom and crabs and finfish.301
MFC Recommendation: Restrict total headrope to 90 feet upstream <strong>of</strong> a line between WindmillPoint at Oriental and Winthrop Point at Adams Creek. Never open above Wilkinson Point toCherry Point to reduce overall trawling impact on river bottom and crabs and finfish.302
12.21 Appendix 21. SHRIMP MANAGEMENT IN BAY RIVERBay River is a tributary <strong>of</strong> Pamlico Sound, located in Pamlico County, between thePamlico and Neuse rivers (Map 1). The main bottom type in Bay River is s<strong>of</strong>t mud, with patches<strong>of</strong> hard sand bottom. The shallow waters <strong>of</strong> the feeder creeks and bays contain patches <strong>of</strong>submerged aquatic vegetation (wild celery, and widgeongrass).Trawling (shrimp and crab) is only allowed in the main stem <strong>of</strong> the river. All feedercreeks and bays are classified as either Nursery Areas (Primary or Secondary) or no trawl areas(Map 2). Other commercial fisheries in Bay River include crab pot, crab trawl, gill net, oyster,and long-haul.Since 1994 Bay River has been closed five times to protect small shrimp. Most closuresoccur in mid to late June with openings in mid-July. The river is closed west <strong>of</strong> a line from BayPoint to Maw Point (Map 2).Bay River accounts for 0.2% <strong>of</strong> the total statewide shrimp production. Average annualshrimp landings are 13,917 pounds, with an average dockside value <strong>of</strong> $31,562. Ninety-sevenpercent <strong>of</strong> the shrimp landed from Bay River are caught by shrimp trawls (1994 – 2003 Tripticket Data). The remaining shrimp landings were reported from skimmer trawls (2.99%), crabpots (0.11%), crab trawls (0.01%), and channel net (0.02%). Landings from crab pots (June),crab trawls (March), and channel nets (August) were reported in 1995, while skimmer trawllandings were reported in July 1999.Bay River ranks 13 th in shrimp landings by shrimp trawls with average landings <strong>of</strong> 13,481pounds per year (Figure 1). The average dockside value <strong>of</strong> these landings is $30,432. Inaddition to shrimp, an average <strong>of</strong> 1,453 pounds <strong>of</strong> marketable bycatch with a dockside value <strong>of</strong>$1,022 is landed by shrimp trawls from Bay River. The landed bycatch is composed <strong>of</strong> bluecrabs (91%; 1,323 pounds/year), finfish (9%; 127 pounds/year), and mollusks (0.12%; 2pounds/year). Weakfish are the most common finfish species landed with average annuallandings <strong>of</strong> 45 pounds (Table 1), 95% <strong>of</strong> which are landed in July (Table 2). Flounder are thesecond most common finfish species with 36 pounds landed annually. Eighty-three percent <strong>of</strong>the flounder are landed during July (48%), October (20%), and April [15% (Table 2)].July accounts for 58% <strong>of</strong> the shrimp landings from shrimp trawls for Bay River (Tables 2and 3). The months <strong>of</strong> June (26%) and August (12%) are the other two main months <strong>of</strong> shrimpharvest from this system (Figure 2). Tables 4 through 6 and Figure 2 show the percentcontribution <strong>of</strong> daily shrimp landings by market grade for these three months.The percent contribution <strong>of</strong> yearly shrimp trawl landings by various sized vessels is givenin Table 7. Fifty-one percent <strong>of</strong> the shrimp trawl landings were harvested by vessels less than40 feet in length (Table 8). The annual numbers <strong>of</strong> licenses with shrimp trawl landings for BayRiver has average 17 since 1994 (Table 8).No fishery dependent data is available from shrimp trawls working in Bay River. TheDMF conducts a juvenile trawl survey in the nursery areas but no independent trawl surveys areconducted in the river proper. The only bycatch data available from this system is from geartesting conducted in 1996 and 1997. While these data should not be used for characterizationanalysis, catches can provide information on species composition and sizes <strong>of</strong> speciesvulnerable to shrimp trawls. In 148 ninety minute tows conducted in 1996 and 1997 with a 32foot shrimp trawl spot accounted for 57% <strong>of</strong> the finfish bycatch. Atlantic croaker was the next303
most abundant species accounting for 30% <strong>of</strong> the catch; this was followed by weakfish (6%),miscellaneous finfish species (4%), and southern flounder (3%). Ninety-six percent <strong>of</strong> thesouthern flounder captured were sublegal. Data from the DMF’s juvenile trawl survey showsthat the CPUE <strong>of</strong> southern flounder in Bay River (CPUE = 4) is comparable to those seen in theNeuse (CPUE = 4), Pamlico (CPUE = 3), and Pungo (CPUE = 4) rivers, and in the Bays <strong>of</strong>Pamlico County (CPUE = 5). These data suggest that Bay River is an important nursery areafor southern flounder. Given the suppressed stock scenario <strong>of</strong> southern flounder, it is unclearwhat specific impacts shrimp trawl bycatch has on the overall stock status at this time.However, any reduction in southern flounder fishing mortality, especially directed towardsublegal fish, would benefit the stock.Management <strong>of</strong> Bay River should include measures to further minimize southernflounder bycatch while still achieving the overall goal and objectives <strong>of</strong> this <strong>FMP</strong>. The goal <strong>of</strong>the North Carolina <strong>Shrimp</strong> Fishery Management Plan is to utilize a management strategy thatprovides adequate resource protection, optimizes the long-term commercial harvest, maximizessocial and economic value, provides sufficient opportunity for recreational shrimpers, andconsiders the needs <strong>of</strong> all user groups. To achieve this goal, it is recommended that thefollowing objectives be met:1. Minimize waste and enhance economic value <strong>of</strong> the shrimp resource by promoting moreeffective harvesting practices.2. Minimize harvest <strong>of</strong> non-target species <strong>of</strong> finfish and crustaceans and protected,threatened, and endangered species.3. Promote the protection, restoration, and enhancement <strong>of</strong> habitats and environmentalquality necessary for the enhancing the shrimp resource.4. Maintain a clear distinction between conservation goals and allocation issues.5. Reduce conflicts among and within user groups, including non-shrimping user groupsand activities.6. Encourage research and education to improve the understanding and management <strong>of</strong>the shrimp resource.304
8,000,000Pamlico Sound Total landings 36,378,4507,000,0006,000,0005,000,000Pounds4,000,0003,000,0002,000,0001,000,0000Pamlico SoundCore SoundNew RiverNewport RiverNeuse RiverNorth RiverTopstumpIWWCape fear RiverWhite Oak RiverBogue SoundPamlico RiverWaterIWW-BrunswickBay RiverCroatan SoundRoanoke SoundMasonboro SoundPungo RiverShallotte RiverLockwood FollyFigure 1. Total pounds <strong>of</strong> shrimp harvested by shrimp in major North Carolina waterbodiesbetween 1994-2003.Table 1. Landings (lbs) <strong>of</strong> finfish from shrimp trawls from Bay River North Carolina; 1994 –2003.Total Average PercentSpecies pounds pounds <strong>of</strong> totalWeakfish 453 45 35.54%Flounders 365 36 28.60%Sea mullet 192 19 15.06%Spot 92 9 7.22%Fish, Mixed 70 7 5.49%Atlantic croaker 53 5 4.16%Pigfish 19 2 1.49%Spanish Mackerel 16 2 1.26%Sheepshead 6 1 0.47%Harvestfish 4 0.4 0.31%Butterfish 3 0.3 0.24%Speckled Trout 2 0.2 0.16%305
Table 2. Monthly percent contribution <strong>of</strong> landed shrimp trawl catch for Bay River North Carolina; 1994 – 2003.MonthSpecies April May June July August September October November December Total<strong>Shrimp</strong> 0.01% 0.07% 25.60% 58.26% 11.93% 2.11% 1.76% 0.24% 0.01% 100.00%Blue crab 0.50% 1.53% 18.39% 52.84% 22.51% 2.18% 1.00% 0.85% 0.19% 100.00%Weakfish 0.00% 0.00% 1.32% 90.29% 1.10% 1.88% 5.41% 0.00% 0.00% 100.00%Flounders 14.81% 0.00% 10.01% 48.15% 3.70% 1.51% 20.16% 0.55% 1.10% 100.00%Sea mullet 6.25% 0.00% 7.29% 77.34% 1.56% 4.69% 2.86% 0.00% 0.00% 100.00%Spot 0.00% 0.00% 63.04% 23.91% 0.00% 7.61% 5.43% 0.00% 0.00% 100.00%Fish, mixed 0.00% 0.00% 57.14% 11.43% 18.57% 0.00% 12.86% 0.00% 0.00% 100.00%Atlantic croaker 0.00% 0.00% 35.85% 58.49% 5.66% 0.00% 0.00% 0.00% 0.00% 100.00%Pigfish 0.00% 0.00% 100.00% 0.00% 0.00% 0.00% 0.00% 0.00% 0.00% 100.00%Spanish mackerel 0.00% 0.00% 100.00% 0.00% 0.00% 0.00% 0.00% 0.00% 0.00% 100.00%Sheepshead 0.00% 0.00% 100.00% 0.00% 0.00% 0.00% 0.00% 0.00% 0.00% 100.00%Harvestfish 0.00% 0.00% 0.00% 0.00% 100.00% 0.00% 0.00% 0.00% 0.00% 100.00%Butterfish 0.00% 0.00% 33.33% 0.00% 0.00% 66.67% 0.00% 0.00% 0.00% 100.00%Speckled trout 0.00% 0.00% 0.00% 100.00% 0.00% 0.00% 0.00% 0.00% 0.00% 100.00%Squid 0.00% 0.00% 100.00% 0.00% 0.00% 0.00% 0.00% 0.00% 0.00% 100.00%Total 0.10% 0.20% 24.89% 57.81% 12.80% 2.12% 1.76% 0.30% 0.03% 100.00%Table 3. Monthly shrimp landings (lbs), and trips from shrimp trawls from Bay River North Carolina; 1994 – 2003.Total Average PercentPercent<strong>of</strong> totalMonth pounds pounds <strong>of</strong> total tripsApril 12 1 0.00% 0.16%May 96 10 0.10% 0.80%June 34,322 3,432 25.50% 11.90%July 78,860 7,886 58.50% 44.20%August 15,998 1,600 11.90% 21.60%September 2,825 283 2.10% 7.90%October 2,363 236 1.80% 10.10%November 325 33 0.20% 3.20%December 10 1 0.00% 0.20%Overall 134,811 13,481306
Table 4. Percent contribution <strong>of</strong> daily June shrimp landings* by market grade for Bay River, 1994 – 2003.Market grade Total Percent <strong>of</strong>Day 20/25 26/30 31/35 36/40 41/45 46/50 51/55 56/60 60/70 pounds monthly total10 0.00% 0.00% 0.00% 0.00% 0.00% 0.00% 0.00% 0.00% 100.00% 5 0.0212 0.00% 0.00% 0.00% 0.00% 0.00% 0.00% 0.00% 100.00% 0.00% 123 0.4714 0.00% 0.00% 0.00% 0.00% 0.00% 100.00% 0.00% 0.00% 0.00% 198 0.7617 0.00% 0.00% 0.00% 26.63% 0.00% 0.00% 0.00% 73.37% 0.00% 368 1.4118 0.00% 0.00% 0.00% 0.00% 0.00% 0.00% 0.00% 100.00% 0.00% 16 0.0619 0.00% 0.00% 0.00% 0.00% 100.00% 0.00% 0.00% 0.00% 0.00% 318 1.2220 0.00% 0.00% 0.00% 73.03% 13.15% 13.82% 0.00% 0.00% 0.00% 1,483 5.6721 0.00% 0.00% 35.17% 9.34% 9.46% 35.91% 0.00% 0.00% 10.12% 2,590 9.9022 0.00% 0.00% 0.00% 100.00% 0.00% 0.00% 0.00% 0.00% 0.00% 264 1.0123 0.00% 0.00% 95.52% 0.00% 0.00% 0.00% 0.00% 4.48% 0.00% 1,451 5.5524 0.00% 0.00% 0.00% 0.00% 16.36% 71.52% 12.12% 0.00% 0.00% 83 0.3225 0.00% 0.00% 59.31% 32.26% 0.00% 0.00% 0.00% 8.43% 0.00% 1,442 5.5126 0.00% 0.00% 0.00% 0.00% 100.00% 0.00% 0.00% 0.00% 0.00% 46 0.1827 0.00% 0.00% 76.08% 0.00% 0.00% 22.14% 1.78% 0.00% 0.00% 673 2.5728 4.81% 9.25% 33.92% 36.23% 0.00% 15.79% 0.00% 0.00% 0.00% 2,724 10.4229 0.00% 1.26% 0.00% 0.51% 0.00% 96.98% 0.15% 1.10% 0.00% 12,468 47.6730 0.00% 62.59% 0.00% 11.40% 0.00% 0.00% 3.73% 22.28% 0.00% 1,903 7.28Total 0.50% 6.12% 17.54% 13.08% 3.13% 53.77% 0.43% 4.42% 1.02% 26,154 100.00*Only showing heads on landings which represent 76% <strong>of</strong> the monthly total.307
Table 5. Percent contribution <strong>of</strong> daily July shrimp landings* by market grade for Bay River, 1994 – 2003.Market grade Total Percent <strong>of</strong>Day 16/20 20/25 26/30 31/35 36/40 41/45 46/50 51/55 56/60 60/70 70/80 Mixed poundsmonthly total1 0.00% 0.00% 5.18% 0.00% 7.27% 4.19% 83.35% 0.00% 0.00% 0.00% 0.00% 0.00% 811 1.232 0.00% 0.00% 23.08% 0.00% 0.00% 0.00% 76.92% 0.00% 0.00% 0.00% 0.00% 0.00% 228 0.343 0.00% 0.00% 76.67% 0.00% 10.49% 2.42% 10.41% 0.00% 0.00% 0.00% 0.00% 0.00% 1,239 1.884 0.00% 0.00% 1.50% 33.52% 62.94% 0.00% 0.00% 0.00% 2.04% 0.00% 0.00% 0.00% 3,675 5.565 0.00% 0.00% 17.51% 11.60% 29.64% 41.25% 0.00% 0.00% 0.00% 0.00% 0.00% 0.00% 1,508 2.286 0.00% 0.00% 84.84% 0.00% 15.16% 0.00% 0.00% 0.00% 0.00% 0.00% 0.00% 0.00% 244 0.377 0.00% 0.00% 16.21% 74.38% 0.00% 9.41% 0.00% 0.00% 0.00% 0.00% 0.00% 0.00% 1,881 2.858 0.00% 3.11% 88.37% 3.02% 5.50% 0.00% 0.00% 0.00% 0.00% 0.00% 0.00% 0.00% 3,475 5.269 0.00% 23.56% 15.92% 18.27% 42.24% 0.00% 0.00% 0.00% 0.00% 0.00% 0.00% 0.00% 1,106 1.6710 0.00% 1.15% 60.53% 25.51% 12.60% 0.00% 0.00% 0.00% 0.00% 0.22% 0.00% 0.00% 2,270 3.4411 0.00% 10.96% 54.51% 4.69% 0.00% 0.00% 0.00% 0.00% 0.00% 0.00% 29.85% 0.00% 1,387 2.1012 0.00% 54.10% 12.66% 33.23% 0.00% 0.00% 0.00% 0.00% 0.00% 0.00% 0.00% 0.00% 1,011 1.5313 0.00% 84.83% 10.67% 4.49% 0.00% 0.00% 0.00% 0.00% 0.00% 0.00% 0.00% 0.00% 890 1.3514 0.00% 8.89% 76.01% 10.54% 4.55% 0.00% 0.00% 0.00% 0.00% 0.00% 0.00% 0.00% 2,789 4.2215 0.00% 9.81% 45.80% 34.15% 6.83% 0.00% 1.22% 0.00% 2.20% 0.00% 0.00% 0.00% 1,478 2.2416 0.00% 26.92% 50.66% 17.91% 1.06% 0.71% 1.58% 1.16% 0.00% 0.00% 0.00% 0.00% 9,867 14.9417 0.00% 19.62% 32.50% 30.58% 15.23% 2.08% 0.00% 0.00% 0.00% 0.00% 0.00% 0.00% 3,130 4.7418 1.36% 37.86% 53.77% 6.73% 0.27% 0.00% 0.00% 0.00% 0.00% 0.00% 0.00% 0.00% 7,337 11.1119 0.00% 73.42% 18.60% 5.51% 0.00% 0.00% 0.00% 0.00% 0.00% 0.00% 0.00% 2.47% 1,215 1.8420 0.00% 89.90% 7.72% 0.00% 2.38% 0.00% 0.00% 0.00% 0.00% 0.00% 0.00% 0.00% 2,940 4.4521 2.05% 56.90% 35.78% 5.27% 0.00% 0.00% 0.00% 0.00% 0.00% 0.00% 0.00% 0.00% 2,921 4.4222 0.00% 22.03% 54.46% 23.51% 0.00% 0.00% 0.00% 0.00% 0.00% 0.00% 0.00% 0.00% 404 0.6123 0.92% 73.60% 20.34% 4.22% 0.92% 0.00% 0.00% 0.00% 0.00% 0.00% 0.00% 0.00% 4,360 6.6024 0.00% 14.96% 85.04% 0.00% 0.00% 0.00% 0.00% 0.00% 0.00% 0.00% 0.00% 0.00% 254 0.3825 0.00% 0.00% 100.00% 0.00% 0.00% 0.00% 0.00% 0.00% 0.00% 0.00% 0.00% 0.00% 92 0.1426 3.84% 13.13% 31.16% 51.87% 0.00% 0.00% 0.00% 0.00% 0.00% 0.00% 0.00% 0.00% 937 1.4227 6.01% 26.11% 31.59% 9.92% 26.37% 0.00% 0.00% 0.00% 0.00% 0.00% 0.00% 0.00% 383 0.5828 1.86% 82.85% 12.80% 0.00% 0.00% 2.49% 0.00% 0.00% 0.00% 0.00% 0.00% 0.00% 2,414 3.6629 24.40% 43.41% 30.51% 0.87% 0.00% 0.00% 0.59% 0.00% 0.00% 0.00% 0.23% 0.00% 2,193 3.3230 4.28% 79.00% 10.50% 5.72% 0.00% 0.00% 0.00% 0.49% 0.00% 0.00% 0.00% 0.00% 2,638 3.9931 13.00% 0.00% 87.00% 0.00% 0.00% 0.00% 0.00% 0.00% 0.00% 0.00% 0.00% 0.00% 200 0.30Unknown 0.00% 81.36% 0.00% 8.87% 0.00% 9.78% 0.00% 0.00% 0.00% 0.00% 0.00% 0.00% 767 1.16Total 1.48% 34.38% 37.84% 14.25% 7.53% 1.72% 1.77% 0.19% 0.16% 0.01% 0.63% 0.05% 66,042 100.00*Only showing heads on landings which represent 80% <strong>of</strong> the monthly total.308
Table 6. Percent contribution <strong>of</strong> daily August shrimp landings* by market grade for Bay River, 1994 – 2003.Market grade Total Percent <strong>of</strong>Day 16/20 20/25 26/30 31/35 36/40 41/45 46/50 51/55 56/60 60/70 70/80 Mixed poundsmonthly total1 23.50% 16.62% 46.43% 13.44% 0.00% 0.00% 0.00% 0.00% 0.00% 0.00% 0.00% 0.00% 1,919 14.922 14.24% 51.67% 32.27% 0.00% 0.00% 0.00% 1.52% 0.00% 0.00% 0.30% 0.00% 0.00% 660 5.133 39.10% 13.91% 24.44% 0.00% 0.00% 22.56% 0.00% 0.00% 0.00% 0.00% 0.00% 0.00% 532 4.144 6.11% 81.87% 8.04% 2.74% 0.62% 0.00% 0.62% 0.00% 0.00% 0.00% 0.00% 0.00% 1,605 12.485 87.74% 0.00% 5.22% 0.00% 7.04% 0.00% 0.00% 0.00% 0.00% 0.00% 0.00% 0.00% 881 6.856 42.17% 15.06% 42.77% 0.00% 0.00% 0.00% 0.00% 0.00% 0.00% 0.00% 0.00% 0.00% 166 1.297 49.30% 0.00% 16.55% 34.15% 0.00% 0.00% 0.00% 0.00% 0.00% 0.00% 0.00% 0.00% 284 2.218 19.18% 62.37% 12.26% 3.04% 3.14% 0.00% 0.00% 0.00% 0.00% 0.00% 0.00% 0.00% 954 7.429 6.43% 93.57% 0.00% 0.00% 0.00% 0.00% 0.00% 0.00% 0.00% 0.00% 0.00% 0.00% 389 3.0310 51.52% 8.03% 0.00% 6.90% 21.35% 0.00% 0.00% 0.00% 12.20% 0.00% 0.00% 0.00% 623 4.8511 0.00% 100.00% 0.00% 0.00% 0.00% 0.00% 0.00% 0.00% 0.00% 0.00% 0.00% 0.00% 547 4.2512 0.00% 100.00% 0.00% 0.00% 0.00% 0.00% 0.00% 0.00% 0.00% 0.00% 0.00% 0.00% 92 0.7213 37.40% 58.02% 0.00% 4.58% 0.00% 0.00% 0.00% 0.00% 0.00% 0.00% 0.00% 0.00% 131 1.0214 0.00% 59.36% 40.64% 0.00% 0.00% 0.00% 0.00% 0.00% 0.00% 0.00% 0.00% 0.00% 219 1.7015 11.85% 59.78% 22.59% 5.79% 0.00% 0.00% 0.00% 0.00% 0.00% 0.00% 0.00% 0.00% 363 2.8216 13.47% 74.21% 8.88% 3.44% 0.00% 0.00% 0.00% 0.00% 0.00% 0.00% 0.00% 0.00% 349 2.7117 100.00% 0.00% 0.00% 0.00% 0.00% 0.00% 0.00% 0.00% 0.00% 0.00% 0.00% 0.00% 146 1.1418 0.71% 99.29% 0.00% 0.00% 0.00% 0.00% 0.00% 0.00% 0.00% 0.00% 0.00% 0.00% 1,411 10.9719 33.62% 66.38% 0.00% 0.00% 0.00% 0.00% 0.00% 0.00% 0.00% 0.00% 0.00% 0.00% 235 1.8320 3.56% 69.33% 20.89% 0.00% 0.00% 0.00% 0.00% 0.00% 0.00% 6.22% 0.00% 0.00% 225 1.7521 0.00% 51.95% 0.00% 48.05% 0.00% 0.00% 0.00% 0.00% 0.00% 0.00% 0.00% 0.00% 77 0.6022 54.10% 0.00% 32.38% 8.61% 4.92% 0.00% 0.00% 0.00% 0.00% 0.00% 0.00% 0.00% 244 1.9023 55.36% 0.00% 33.04% 11.61% 0.00% 0.00% 0.00% 0.00% 0.00% 0.00% 0.00% 0.00% 112 0.8724 0.00% 0.00% 0.00% 93.55% 0.00% 6.45% 0.00% 0.00% 0.00% 0.00% 0.00% 0.00% 93 0.7225 36.13% 16.81% 0.00% 0.00% 47.06% 0.00% 0.00% 0.00% 0.00% 0.00% 0.00% 0.00% 119 0.9327 100.00% 0.00% 0.00% 0.00% 0.00% 0.00% 0.00% 0.00% 0.00% 0.00% 0.00% 0.00% 15 0.1229 60.16% 15.94% 0.00% 0.00% 23.90% 0.00% 0.00% 0.00% 0.00% 0.00% 0.00% 0.00% 251 1.9530 66.44% 0.00% 0.00% 0.00% 33.56% 0.00% 0.00% 0.00% 0.00% 0.00% 0.00% 0.00% 146 1.1431 52.86% 0.00% 0.00% 0.00% 0.00% 31.43% 15.71% 0.00% 0.00% 0.00% 0.00% 0.00% 70 0.54Total 25.52% 48.34% 15.62% 5.20% 3.20% 1.15% 0.24% 0.00% 0.59% 0.12% 0.00% 0.00% 12,858 100.00*Only showing heads on landings which represent 80% <strong>of</strong> the monthly total.309
Pounds%cumulative pounds14,000100.00%12,000June July August90.00%75%80.00%10,00070.00%Pounds8,0006,00050%60.00%50.00%40.00%4,00025%30.00%20.00%2,00010.00%06/1 6/8 6/15 6/22 6/29 7/6 7/13 7/20 7/27 8/3 8/10 8/17 8/24 8/310.00%Figure 2. Bay River daily (heads-on lbs and cumulative percent) shrimp trawl landings, 1994 – 2003.310
Table 7. Percent contribution <strong>of</strong> various vessel size classes to total shrimp trawl landings in Bay River; 1994 – 2003.Vessel size rangeYear < 20' 20 - 24' 25 - 29' 30 - 34' 35 - 39' 40 - 44' 45 - 49' 50 - 54' 55 - 59' > 60' Unknown Total1994 8.20% 1.18% 0.42% 9.31% 27.24% 0.00% 9.71% 0.00% 0.00% 28.30% 15.64% 100.00%1995 15.05% 0.00% 3.28% 12.13% 10.24% 0.00% 0.00% 0.00% 0.00% 59.30% 0.00% 100.00%1996 33.47% 2.31% 0.00% 0.00% 17.48% 0.00% 2.05% 0.00% 10.69% 32.84% 1.16% 100.00%1997 6.96% 0.00% 16.60% 0.00% 24.44% 0.00% 1.26% 30.31% 5.59% 14.84% 0.00% 100.00%1998 0.00% 4.35% 0.00% 0.00% 83.40% 0.00% 0.00% 0.00% 0.00% 12.25% 0.00% 100.00%1999 0.76% 0.00% 4.22% 15.51% 10.39% 1.26% 1.20% 0.00% 8.84% 0.00% 57.82% 100.00%2000 4.51% 3.36% 10.43% 10.00% 22.69% 13.11% 0.00% 2.34% 5.98% 27.59% 0.00% 100.00%2001 0.00% 2.20% 8.51% 24.59% 61.98% 0.81% 0.00% 0.00% 0.00% 0.00% 1.92% 100.00%2002 8.05% 2.20% 12.79% 25.76% 32.77% 16.26% 0.00% 0.00% 0.00% 2.17% 0.00% 100.00%2003 0.00% 1.49% 0.00% 33.63% 0.00% 0.00% 0.00% 0.00% 64.88% 0.00% 0.00% 100.00%Total 6.82% 1.55% 7.51% 11.90% 23.32% 5.39% 1.90% 4.30% 5.25% 19.40% 12.65% 100.00%Table 8. Percent contribution <strong>of</strong> three vessel size groups to yearly shrimp trawl landings in Bay River; 1994 – 2003.Vessel size range Number <strong>of</strong>Year < 20' 20 - 39' > 40' Total licenses1994 8.20% 38.15% 38.01% 84.36% 191995 15.05% 25.65% 59.30% 100.00% 121996 33.47% 19.79% 45.58% 98.84% 131997 6.96% 41.04% 52.00% 100.00% 151998 0.00% 87.75% 12.25% 100.00% 41999* 0.76% 30.12% 11.30% 42.18% 272000* 4.51% 46.48% 49.02% 100.00% 482001* 0.00% 97.27% 0.81% 98.08% 152002* 8.05% 73.52% 18.42% 100.00% 162003 0.00% 35.12% 64.88% 100.00% 3Total 6.82% 44.28% 36.25% 87.35%*Years that Bay River was closed to shrimping (also closed in 2004).311
Map 1. Map <strong>of</strong> Pamlico and Albemarle sounds North Carolina.312
Map 2. Map <strong>of</strong> Bay River North Carolina.313
Management Option/Impacts+ potential positive impact <strong>of</strong> action- potential negative impact <strong>of</strong> action1. Status quo (potential to close and open when shrimp are <strong>of</strong> sufficient size)+ Flexibility in reacting to variable conditions (excessive rainfall, early migration)+ Access to resource by a variety <strong>of</strong> users- Does not minimize harvest <strong>of</strong> small shrimp and bycatch- Labor intensive and expensive to sample- Necessitates “grand openings”2. Harvest Season (Month (s), or Month (s)/Day (s) closures)a) Implement closure <strong>of</strong> Bay River with initial June proclamation and open in midJuly (based on predetermined heads-on count).+ Eliminates grand openings (if coordinated with other areas)+ Protection <strong>of</strong> small shrimp and juvenile fish and crabs.+ Potential for larger shrimp when trawling is opened- Lose flexibility <strong>of</strong> management by proclamation- Loss <strong>of</strong> resource to RCGL and smaller commercial trawlersb) Implement split season for commercial and RCGL shrimpers (same as # 2 aboveexcept open to RCGL harvest 1 or 2 weeks prior to commercial opening)+ Protection <strong>of</strong> small shrimp and juvenile fish and crabs+ Allows access to resource by all users+ Potential for larger shrimp when trawling is opened- Lose flexibility <strong>of</strong> management by proclamationc) Open in July (based on predetermined heads-on count or pre determined date)and close to shrimp trawling in mid to late August+ Eliminates grand openings (if coordinated with other areas)+ Protection <strong>of</strong> small shrimp and juvenile fish and crabs+ Potential for larger shrimp when trawling is opened- Lose flexibility <strong>of</strong> management by proclamation- Loss <strong>of</strong> resource to RCGL and smaller commercial trawlers314
3. Area Closuresa) Prohibit all shrimp trawlers in Bay River+ Bycatch issue completely eliminated+ Potential for healthier shellfish/finfish stocks+ Decrease navigational and fixed vs. mobile gear conflicts in inside waters+ Allow for harvest <strong>of</strong> larger count shrimp once they migrate into Pamlico Sound- Loss <strong>of</strong> income to commercial fishermen and dealers- Loss <strong>of</strong> RCGL use <strong>of</strong> shrimp resourceb) Close portions <strong>of</strong> the river to shrimp trawl harvest.+ Decrease navigational and fixed vs. mobile gear conflicts in closed waters+ Allow for harvest <strong>of</strong> larger count shrimp once they migrate into Open areas- Loss <strong>of</strong> income to commercial fishermen and dealers- Loss <strong>of</strong> recreational use <strong>of</strong> shrimp resource4. Regulate Means and Methods (gear and vessel)a) Implement headrope size limit on shrimp trawlers working in Bay River+ Allows for all size classes <strong>of</strong> vessels to work+ Reduction in bycatch- Reduction in fishing power <strong>of</strong> larger vesselsb) Increase tailbag mesh size.+ Reduction in bycatch+ Catch larger size shrimp- Loss <strong>of</strong> smaller size shrimp- Insufficient data on different mesh sizes and shrimp loss and bycatch reductionc) Implement maximum vessel length restriction on shrimp trawlers working in BayRiver+ Decrease navigational and fixed vs. mobile gear conflicts in inside waters+ Reduction in bycatch- Loss <strong>of</strong> income to commercial fishermen and dealersAC Recommendation: Open on 26-30 heads-on count on or after July 7. Restrict totalheadrope to 90 feet upstream <strong>of</strong> a line between Maw Point and Bay River Point.DMF Recommendation: Open in July (31-35 count) and close to shrimp trawling in mid to lateAugust. Implement 90 foot headrope size limit on shrimp trawlers working in Bay River.MFC Recommendation: Open in July and close to shrimp trawling in mid to late August.Implement 90 foot headrope size limit on shrimp trawlers working in Bay River.315
12.22 Appendix 22. SHRIMP MANAGEMENT IN PAMLICO RIVERThe Pamlico River is a tributary <strong>of</strong> Pamlico Sound (Map 1). The main bottom type is s<strong>of</strong>tmud, with patches <strong>of</strong> hard sand bottom in waters less than six feet deep. The shallow waters <strong>of</strong>the feeder creeks and bays contain patches <strong>of</strong> submerged aquatic vegetation (wild celery, andwidgeongrass).Trawling (shrimp and crab) is only allowed in the main stem <strong>of</strong> the river. All feedercreeks and bays are classified as either Nursery Areas (Primary, Secondary, SpecialSecondary) or Inland waters all <strong>of</strong> which are closed to trawling (Map 2). Overall this system isapproximately 82,705 acres in size. 76,516 acres are under DMF jurisdiction. 1,414 acres areclassified as Primary Nursery areas, 11,231 acres as Secondary Nursery areas, 2,736 acres asSpecial Secondary Nursery areas, and 1,184 acres <strong>of</strong> no trawl areas. Seventy-nine percent <strong>of</strong>the water under DMF jurisdiction is open to trawling. Other commercial fisheries in The PamlicoRiver include crab pot, crab trawl, gill net, eel potting, pound netting, and long-haul. Over thelast 11 years the Pamlico River has not been closed to shrimp trawling.Pamlico River accounts for 0.60% <strong>of</strong> the total statewide shrimp production. Averageannual shrimp landings are 38,301 pounds, with an average dockside value <strong>of</strong> $91,355. Ninetyeightpercent <strong>of</strong> the shrimp landed from the Pamlico River are caught by shrimp trawls (1994 –2003 Trip ticket Data). Other gears with reported shrimp landings are; skimmer trawls (0.96%),crab trawls (0.49%), crab pots (0.14%), seines (0.06%), and sink gill net (0.02%).The Pamlico River ranks 11 th in shrimp landings by shrimp trawls with average annuallandings <strong>of</strong> 37,744 pounds (Figure 1). The average dockside value <strong>of</strong> these landings is$89,833. In addition to shrimp, an average <strong>of</strong> 1,474 pounds <strong>of</strong> marketable bycatch with adockside value <strong>of</strong> $1,187 is landed annually by shrimp trawls from the Pamlico River. Thelanded bycatch is composed <strong>of</strong> blue crabs (58%; 854 pounds/year), finfish (41%; 607pounds/year), and mollusks (0.5%; 9 pounds/year). Southern flounder are the most commonfinfish species landed with average annual landings <strong>of</strong> 248 pounds (Table 1), 45% <strong>of</strong> which arelanded in September (Table 2). July and August account for 74% <strong>of</strong> the blue crabs landed byshrimp trawls.July accounts for 40% <strong>of</strong> the shrimp landings from shrimp trawls for Pamlico River(Tables 2 and 3). The months <strong>of</strong> August (21%) and June (12%) are the other two main months<strong>of</strong> shrimp harvest from this system. Tables 4 through 6 show the percent contribution <strong>of</strong> dailyshrimp landings by market grade for these three months.The percent contribution <strong>of</strong> yearly shrimp trawl landings by various sized vessels is givenin Table 7. Sixty-four percent <strong>of</strong> the shrimp trawl landings were harvested by vessels greaterthan 40 feet in length (Table 8).No fishery dependent data is available from shrimp trawls working in Pamlico River. TheDMF conducts two trawl surveys in the Pamlico River Program 120 is a nursery area survey,while Program 195 samples the river proper. Data from Program 120 shows that the CPUE <strong>of</strong>southern flounder in Pamlico River (CPUE = 3) is less than those seen in Bay (CPUE = 4),Neuse (CPUE = 4), or Pungo (CPUE = 4) rivers, and in the Bays <strong>of</strong> Pamlico County (CPUE =5). However this area has the second highest CPUE (10 per tow) <strong>of</strong> southern flounder <strong>of</strong> allareas sampled in Program 195, the Pungo River has the highest. Figure 2 shows the CPUE <strong>of</strong>southern flounder from Program 195 by station and river section for the Pamlico River.Southern flounder make up 2% <strong>of</strong> the finfish captured in Program 195 in the Pamlico River.316
Spot are the most abundant species (46%), followed by Atlantic croaker (31%), menhaden(5%), weakfish (4%), silver perch (3%), and pinfish (3%). Given the suppressed stock scenario<strong>of</strong> southern flounder, it is unclear what specific impacts shrimp trawl bycatch has on the overallstock status at this time. However, any reduction in southern flounder fishing mortality,especially directed toward sublegal fish, would benefit the stock. Management <strong>of</strong> the PamlicoRiver should include measures to further minimize southern flounder bycatch while stillachieving the overall goal and objectives <strong>of</strong> this <strong>FMP</strong>.8,000,000Pamlico Sound Total landings 36,378,4507,000,0006,000,0005,000,000Pounds4,000,0003,000,0002,000,0001,000,0000Pamlico SoundCore SoundNew RiverNewport RiverNeuse RiverNorth RiverTopstumpIWWCape fear RiverWhite Oak RiverBogue SoundPamlico RiverWaterIWW-BrunswickBay RiverCroatan SoundRoanoke SoundMasonboro SoundPungo RiverShallotte RiverLockwood FollyFigure 1.Total pounds <strong>of</strong> shrimp harvested by shrimp in major North Carolina waterbodiesbetween 1994-2003.317
Table 1.Landings (lbs) <strong>of</strong> finfish from shrimp trawls from the Pamlico River North Carolina;1994 – 2003.Total Average PercentSpecies pounds pounds <strong>of</strong> totalFlounders 2,484 248 40.91%Sea mullet 1,411 141 23.23%Fish, Mixed 780 78 12.84%Spot 505 51 8.32%Weakfish 405 40 6.66%Bluefish 101 10 1.66%Atlantic croaker 92 9 1.51%Spadefish 85 9 1.40%Harvestfish 73 7 1.20%Butterfish 40 4 0.66%Pigfish 39 4 0.64%Sheepshead 24 2 0.40%Spanish Mackerel 15 2 0.25%Speckled trout 9 1 0.15%Cutlassfish 7 1 0.12%Black drum 2 0.2 0.03%Puffer 1 0.1 0.02%Total 6,073 607 100%318
Table 2. Monthly percent contribution <strong>of</strong> landed shrimp trawl catch for Pamlico River North Carolina; 1994 – 2003.MonthTotalSpecies January February April May June July August September OctoberNovemberDecember pounds<strong>Shrimp</strong> 0.46% 0.28% 0.05% 0.39% 12.09% 40.14% 20.80% 8.87% 7.18% 7.95% 1.78% 377,442Blue crab 0.00% 0.00% 0.29% 4.26% 15.22% 47.34% 26.40% 5.96% 0.00% 0.53% 0.00% 8,542Flounders 0.00% 0.00% 0.00% 2.42% 1.97% 12.77% 20.81% 45.37% 7.41% 6.44% 2.82% 2,484Sea mullet 0.00% 0.00% 0.00% 0.00% 11.91% 32.81% 22.54% 12.26% 10.13% 10.13% 0.21% 1,411Fish, mixed 0.00% 0.00% 0.00% 0.00% 2.95% 2.44% 23.08% 20.38% 4.62% 0.90% 45.64% 780Spot 0.00% 0.00% 0.00% 0.00% 0.00% 14.46% 40.59% 28.51% 14.85% 1.58% 0.00% 505Weakfish 0.00% 0.00% 0.00% 4.94% 1.98% 13.97% 22.99% 14.34% 6.18% 27.69% 7.91% 405Bluefish 0.00% 0.00% 0.00% 0.00% 0.00% 0.00% 99.01% 0.99% 0.00% 0.00% 0.00% 101Atlantic croaker 0.00% 0.00% 0.00% 0.00% 1.09% 2.17% 65.22% 28.26% 0.00% 3.26% 0.00% 92Spadefish 0.00% 0.00% 0.00% 0.00% 0.00% 11.76% 88.24% 0.00% 0.00% 0.00% 0.00% 85Squid, Loligo 0.00% 0.00% 0.00% 0.00% 0.00% 0.00% 0.00% 0.00% 0.00% 88.24% 11.76% 85Harvestfish 0.00% 0.00% 0.00% 0.00% 0.00% 0.00% 0.00% 94.52% 0.00% 5.48% 0.00% 73Butterfish 0.00% 0.00% 0.00% 0.00% 0.00% 30.00% 60.00% 0.00% 0.00% 7.50% 2.50% 40Pigfish 0.00% 0.00% 0.00% 0.00% 0.00% 0.00% 48.72% 0.00% 0.00% 51.28% 0.00% 39Sheepshead 0.00% 0.00% 0.00% 0.00% 0.00% 0.00% 0.00% 0.00% 0.00% 100.00% 0.00% 24Spanish mackerel 0.00% 0.00% 0.00% 0.00% 0.00% 13.33% 73.33% 13.33% 0.00% 0.00% 0.00% 15Speckled trout 0.00% 0.00% 0.00% 0.00% 0.00% 100.00% 0.00% 0.00% 0.00% 0.00% 0.00% 9Cutlassfish 0.00% 0.00% 0.00% 0.00% 0.00% 0.00% 100.00% 0.00% 0.00% 0.00% 0.00% 7Black drum 0.00% 0.00% 0.00% 0.00% 0.00% 0.00% 100.00% 0.00% 0.00% 0.00% 0.00% 2Puffer 0.00% 0.00% 0.00% 0.00% 0.00% 0.00% 0.00% 0.00% 0.00% 100.00% 0.00% 1Total 0.45% 0.27% 0.05% 0.49% 12.03% 39.91% 21.01% 9.12% 7.03% 7.81% 1.83% 392,062319
Table 3.Monthly shrimp landings (lbs) from shrimp trawls from Pamlico River North Carolina;1994 – 2003.PoundsPercentPercent<strong>of</strong> totalMonth total average <strong>of</strong> total tripsJanuary 1,747 175 0.46% 0.71February 1,041 104 0.28% 0.18April 177 18 0.05% 0.35May 1,469 147 0.39% 1.24June 45,635 4,564 12.09% 12.41July 151,472 15,147 40.14% 42.20August 78,509 7,851 20.80% 20.39September 33,485 3,349 8.87% 7.80October 27,105 2,711 7.18% 4.43November 30,011 3,001 7.95% 8.33December 6,709 671 1.78% 1.95Total 377,362 37,736 100.00% 100.00320
Table 4. Percent contribution <strong>of</strong> daily June shrimp landings* by market grade for Pamlico River, 1994 – 2003.Market grade Total Percent <strong>of</strong>Day 20/25 26/30 31/35 36/40 41/45 46/50 56/60 60/70 70/80 Mixed pounds monthly total6 10.31% 0.00% 0.00% 51.55% 0.00% 0.00% 0.00% 38.14% 0.00% 0.00% 97 0.228 0.00% 100.00% 0.00% 0.00% 0.00% 0.00% 0.00% 0.00% 0.00% 0.00% 862 1.9211 0.00% 0.00% 100.00% 0.00% 0.00% 0.00% 0.00% 0.00% 0.00% 0.00% 176 0.3920 0.00% 0.00% 0.00% 95.77% 0.00% 0.00% 0.00% 0.00% 4.23% 0.00% 1,869 4.1721 0.00% 0.00% 0.00% 24.46% 61.87% 0.00% 0.00% 13.67% 0.00% 0.00% 139 0.3122 0.00% 0.00% 0.00% 0.00% 0.00% 0.00% 100.00% 0.00% 0.00% 0.00% 406 0.9124 0.00% 0.00% 0.00% 0.00% 0.00% 0.00% 0.00% 0.00% 0.00% 100.00% 95 0.2125 0.00% 0.00% 61.83% 31.55% 3.39% 2.05% 0.00% 1.17% 0.00% 0.00% 6,985 15.5826 0.00% 0.00% 28.37% 58.41% 11.15% 2.07% 0.00% 0.00% 0.00% 0.00% 15,307 34.1427 0.00% 1.19% 28.52% 20.71% 5.13% 44.45% 0.00% 0.00% 0.00% 0.00% 5,399 12.0428 0.84% 33.53% 34.87% 14.18% 15.82% 0.12% 0.00% 0.00% 0.00% 0.65% 9,288 20.7129 0.00% 0.00% 82.44% 0.00% 12.99% 0.00% 0.00% 0.28% 0.00% 4.30% 3,957 8.8330 0.00% 0.00% 0.00% 0.00% 22.48% 0.00% 0.00% 0.00% 0.00% 77.52% 258 0.58Total 0.20% 9.01% 37.64% 34.47% 9.69% 6.40% 0.91% 0.33% 0.18% 1.17% 44,838 100.00*Only showing heads on landings, which represent 98% <strong>of</strong> the monthly total.321
Table 5. Percent contribution <strong>of</strong> daily July shrimp landings* by market grade for Pamlico River, 1994 – 2003.Market grade Total Percent <strong>of</strong>Day 16/20 20/25 26/30 31/35 36/40 41/45 46/50 51/55 56/60 60/70 80+ Mixed poundsmonthly total2 0.00% 0.00% 94.03% 0.00% 0.00% 0.00% 0.00% 0.00% 0.00% 0.00% 0.00% 5.97% 1,339 1.143 0.00% 0.00% 14.41% 74.12% 8.11% 0.00% 0.00% 1.83% 0.63% 0.90% 0.00% 0.00% 2,998 2.564 0.00% 0.00% 85.30% 0.00% 9.96% 4.74% 0.00% 0.00% 0.00% 0.00% 0.00% 0.00% 6,625 5.665 0.00% 5.14% 71.67% 21.84% 0.51% 0.00% 0.00% 0.00% 0.13% 0.00% 0.00% 0.73% 15,571 13.296 0.00% 0.00% 19.07% 0.00% 67.65% 0.95% 12.33% 0.00% 0.00% 0.00% 0.00% 0.00% 3,787 3.237 0.00% 0.00% 0.00% 74.75% 7.27% 0.00% 10.19% 0.00% 0.00% 0.00% 5.38% 2.39% 2,090 1.788 0.00% 3.05% 0.00% 37.41% 44.42% 0.00% 0.00% 15.12% 0.00% 0.00% 0.00% 0.00% 2,526 2.169 0.00% 0.00% 97.31% 1.75% 0.00% 0.00% 0.00% 0.94% 0.00% 0.00% 0.00% 0.00% 3,716 3.1710 0.00% 91.77% 0.00% 8.23% 0.00% 0.00% 0.00% 0.00% 0.00% 0.00% 0.00% 0.00% 1,421 1.2111 0.00% 54.48% 31.24% 0.00% 0.00% 0.00% 0.00% 0.00% 0.00% 0.00% 0.00% 14.28% 2,241 1.9112 0.00% 63.65% 31.06% 2.80% 0.53% 0.00% 0.00% 0.00% 0.00% 0.00% 0.00% 1.96% 12,248 10.4613 0.00% 2.37% 15.14% 37.88% 0.00% 23.66% 0.00% 14.72% 0.00% 5.47% 0.00% 0.76% 2,616 2.2314 0.00% 5.14% 84.05% 7.72% 0.00% 0.00% 0.00% 0.00% 0.00% 0.00% 0.00% 3.09% 972 0.8315 0.00% 5.62% 89.82% 3.63% 0.00% 0.00% 0.00% 0.00% 0.00% 0.00% 0.00% 0.94% 2,671 2.2816 0.00% 91.54% 0.00% 0.00% 0.00% 0.00% 5.38% 0.00% 0.00% 0.00% 0.00% 3.07% 1,301 1.1117 0.00% 62.77% 5.49% 31.74% 0.00% 0.00% 0.00% 0.00% 0.00% 0.00% 0.00% 0.00% 1,477 1.2618 0.00% 81.17% 14.88% 0.00% 0.00% 0.00% 0.00% 0.00% 0.00% 0.00% 0.00% 3.96% 3,791 3.2419 0.72% 98.03% 0.84% 0.00% 0.00% 0.00% 0.18% 0.00% 0.00% 0.00% 0.00% 0.23% 8,742 7.4620 0.00% 78.95% 0.00% 13.16% 7.89% 0.00% 0.00% 0.00% 0.00% 0.00% 0.00% 0.00% 760 0.6521 0.00% 0.00% 67.38% 0.00% 0.00% 0.00% 0.00% 0.00% 0.00% 0.00% 0.00% 32.62% 1,257 1.0722 0.52% 96.84% 0.00% 2.00% 0.00% 0.00% 0.00% 0.00% 0.00% 0.00% 0.00% 0.64% 3,106 2.6523 78.53% 20.27% 0.00% 0.00% 0.00% 0.00% 0.00% 0.00% 0.00% 0.00% 0.00% 1.20% 7,918 6.7624 67.77% 8.54% 1.39% 20.00% 0.00% 0.00% 0.00% 0.00% 2.31% 0.00% 0.00% 0.00% 5,551 4.7425 15.55% 0.00% 84.45% 0.00% 0.00% 0.00% 0.00% 0.00% 0.00% 0.00% 0.00% 0.00% 1,138 0.9726 6.52% 23.65% 63.42% 1.53% 0.00% 1.46% 0.00% 0.00% 0.04% 0.00% 0.00% 3.39% 5,612 4.7927 90.83% 1.91% 1.50% 0.00% 0.00% 0.00% 0.00% 0.00% 0.00% 0.00% 0.00% 5.76% 4,341 3.7128 76.51% 16.64% 0.65% 0.00% 0.00% 0.00% 0.00% 0.00% 0.00% 0.00% 1.27% 4.93% 4,929 4.2129 17.27% 49.09% 0.00% 0.00% 0.00% 0.00% 0.00% 0.00% 0.00% 0.00% 0.00% 33.64% 110 0.0930 86.40% 7.95% 0.00% 0.00% 4.63% 0.00% 0.20% 0.00% 0.00% 0.04% 0.00% 0.79% 5,094 4.3531 0.00% 69.08% 7.44% 11.74% 0.00% 0.00% 0.00% 0.00% 0.00% 0.00% 11.74% 0.00% 511 0.44Unknown 0.00% 100.00% 0.00% 0.00% 0.00% 0.00% 0.00% 0.00% 0.00% 0.00% 0.00% 0.00% 670 0.57Total 19.41% 29.56% 31.80% 9.99% 4.42% 0.90% 0.66% 0.73% 0.14% 0.15% 0.20% 2.03% 117,128 100.00*Only showing heads on landings which represent 77% <strong>of</strong> the monthly total.322
Table 6. Percent contribution <strong>of</strong> daily August shrimp landings* by market grade for Pamlico River, 1994 – 2003.Market grade Total Percent <strong>of</strong>Day 0/15 16/20 20/25 26/30 31/35 36/40 41/45 46/50 56/60 60/70 80+ Mixed poundsmonthly total1 0.00% 40.93% 0.00% 58.96% 0.11% 0.00% 0.00% 0.00% 0.00% 0.00% 0.00% 0.00% 6,269 19.172 0.00% 49.62% 34.47% 15.91% 0.00% 0.00% 0.00% 0.00% 0.00% 0.00% 0.00% 0.00% 264 0.813 0.00% 57.60% 13.40% 6.65% 0.00% 1.08% 0.00% 0.00% 0.00% 0.00% 0.00% 21.27% 2,045 6.254 0.00% 37.00% 30.31% 14.46% 0.00% 2.00% 0.00% 0.00% 0.00% 0.00% 0.00% 16.23% 1,300 3.985 0.00% 0.00% 0.00% 100.00% 0.00% 0.00% 0.00% 0.00% 0.00% 0.00% 0.00% 0.00% 219 0.676 0.00% 0.00% 92.43% 0.00% 0.00% 0.00% 0.00% 0.00% 0.00% 0.00% 0.00% 7.57% 489 1.497 0.00% 0.00% 52.97% 0.00% 0.00% 47.03% 0.00% 0.00% 0.00% 0.00% 0.00% 0.00% 202 0.628 0.00% 85.29% 14.71% 0.00% 0.00% 0.00% 0.00% 0.00% 0.00% 0.00% 0.00% 0.00% 680 2.089 0.00% 77.11% 22.89% 0.00% 0.00% 0.00% 0.00% 0.00% 0.00% 0.00% 0.00% 0.00% 2,630 8.0410 0.00% 0.00% 100.00% 0.00% 0.00% 0.00% 0.00% 0.00% 0.00% 0.00% 0.00% 0.00% 77 0.2411 0.00% 27.13% 11.58% 5.38% 0.00% 0.00% 0.00% 16.05% 34.00% 0.00% 5.87% 0.00% 1,209 3.7012 0.00% 12.77% 87.23% 0.00% 0.00% 0.00% 0.00% 0.00% 0.00% 0.00% 0.00% 0.00% 329 1.0113 0.00% 63.47% 36.53% 0.00% 0.00% 0.00% 0.00% 0.00% 0.00% 0.00% 0.00% 0.00% 646 1.9814 0.00% 100.00% 0.00% 0.00% 0.00% 0.00% 0.00% 0.00% 0.00% 0.00% 0.00% 0.00% 275 0.8415 0.00% 85.34% 0.00% 0.00% 14.66% 0.00% 0.00% 0.00% 0.00% 0.00% 0.00% 0.00% 3,343 10.2216 0.00% 0.00% 100.00% 0.00% 0.00% 0.00% 0.00% 0.00% 0.00% 0.00% 0.00% 0.00% 35 0.1117 0.00% 88.99% 10.55% 0.00% 0.00% 0.00% 0.00% 0.00% 0.00% 0.46% 0.00% 0.00% 218 0.6718 0.00% 74.94% 11.04% 0.00% 6.62% 0.00% 0.00% 0.00% 7.40% 0.00% 0.00% 0.00% 906 2.7719 97.43% 0.00% 0.00% 0.00% 0.00% 0.00% 0.00% 0.00% 2.57% 0.00% 0.00% 0.00% 2,723 8.3320 0.00% 70.52% 0.00% 0.00% 0.00% 0.00% 0.00% 0.00% 29.48% 0.00% 0.00% 0.00% 424 1.3021 0.00% 66.17% 0.00% 0.00% 0.00% 0.00% 0.00% 0.00% 33.83% 0.00% 0.00% 0.00% 201 0.6122 0.00% 94.78% 0.00% 0.00% 0.00% 0.00% 0.00% 0.00% 5.22% 0.00% 0.00% 0.00% 2,300 7.0323 0.00% 64.30% 11.52% 0.00% 0.00% 0.00% 0.00% 0.00% 24.17% 0.00% 0.00% 0.00% 1,241 3.7924 0.00% 68.10% 3.88% 0.00% 0.00% 0.00% 17.61% 0.00% 10.40% 0.00% 0.00% 0.00% 721 2.2026 0.00% 100.00% 0.00% 0.00% 0.00% 0.00% 0.00% 0.00% 0.00% 0.00% 0.00% 0.00% 1,090 3.3328 0.00% 0.00% 0.00% 0.00% 100.00% 0.00% 0.00% 0.00% 0.00% 0.00% 0.00% 0.00% 80 0.2429 0.00% 12.66% 0.00% 87.34% 0.00% 0.00% 0.00% 0.00% 0.00% 0.00% 0.00% 0.00% 790 2.4230 83.42% 0.00% 0.00% 0.00% 0.00% 16.58% 0.00% 0.00% 0.00% 0.00% 0.00% 0.00% 573 1.7531 0.00% 11.33% 0.00% 59.76% 0.00% 0.00% 28.92% 0.00% 0.00% 0.00% 0.00% 0.00% 415 1.27Unknown 0.00% 0.00% 100.00% 0.00% 0.00% 0.00% 0.00% 0.00% 0.00% 0.00% 0.00% 0.00% 1,008 3.08Total 9.57% 51.63% 12.53% 16.16% 1.95% 0.73% 0.76% 0.59% 3.78% 0.00% 0.22% 2.09% 32,702 100.00*Only showing heads on landings which represent 41% <strong>of</strong> the monthly total.323
Table 7. Percent contribution <strong>of</strong> various vessel size classes to total shrimp trawl landings in Pamlico River; 1994 – 2003.Vessel size rangeYear
Figure 2.Catch per unit effort (CPUE) <strong>of</strong> southern flounder in the Pamlico and Pungo rivers from Program 195, June andSeptember data combined, 1987 – 2003.325
Map 1. Map <strong>of</strong> Pamlico and Albemarle sounds North Carolina.326
Map 2. Map <strong>of</strong> Pamlico River North Carolina.327
Management Option/Impacts+ potential positive impact <strong>of</strong> action- potential negative impact <strong>of</strong> action1. Status quo (potential to close and open when shrimp are <strong>of</strong> sufficient size)+ Flexibility in reacting to variable conditions (excessive rainfall, early migration)+ Access to resource by a variety <strong>of</strong> users- Does not minimize harvest <strong>of</strong> small shrimp and bycatch- Labor intensive and expensive to sample- Necessitates “grand openings”2. Harvest Season (Month (s), or Month (s)/Day (s) closures)a) Implement closure <strong>of</strong> Pamlico River with initial June proclamation and open inmid July (based on predetermined heads-on count).+ Eliminates grand openings (if coordinated with other areas)+ Protection <strong>of</strong> small shrimp and juvenile fish and crabs.+ Potential for larger shrimp when trawling is opened- Lose flexibility <strong>of</strong> management by proclamation- Loss <strong>of</strong> resource to RCGL and smaller commercial trawlersb) Implement split season for commercial and RCGL shrimpers (same as # 2 aboveexcept open to RCGL harvest 1 or 2 weeks prior to commercial opening)+ Protection <strong>of</strong> small shrimp and juvenile fish and crabs+ Allows access to resource by all users+ Potential for larger shrimp when trawling is opened- Lose flexibility <strong>of</strong> management by proclamationc) Open in July (based on predetermined heads-on count or pre determined date)and close to shrimp trawling in mid to late August+ Eliminates grand openings (if coordinated with other areas)+ Protection <strong>of</strong> small shrimp and juvenile fish and crabs+ Potential for larger shrimp when trawling is opened- Lose flexibility <strong>of</strong> management by proclamation- Loss <strong>of</strong> resource to RCGL and smaller commercial trawlers328
3. Area Closuresa) Prohibit all shrimp trawlers in Pamlico River+ Bycatch issue completely eliminated+ Potential for healthier shellfish/finfish stocks+ Decrease navigational and fixed vs. mobile gear conflicts in inside waters+ Allow for harvest <strong>of</strong> larger count shrimp once they migrate into Pamlico Sound- Loss <strong>of</strong> income to commercial fishermen and dealers- Loss <strong>of</strong> RCGL use <strong>of</strong> shrimp resourceb) Close portions <strong>of</strong> the river to shrimp trawl harvest.+ Decrease navigational and fixed vs. mobile gear conflicts in closed waters+ Allow for harvest <strong>of</strong> larger count shrimp once they migrate into Open areas- Loss <strong>of</strong> income to commercial fishermen and dealers- Loss <strong>of</strong> recreational use <strong>of</strong> shrimp resource4. Regulate Means and Methods (gear and vessel)a) Implement headrope size limit on shrimp trawlers working in Pamlico River+ Allows for all size classes <strong>of</strong> vessels to work+ Reduction in bycatch- Reduction in fishing power <strong>of</strong> larger vesselsb) Increase tailbag mesh size.+ Reduction in bycatch+ Catch larger size shrimp- Loss <strong>of</strong> smaller size shrimp- Insufficient data on different mesh sizes and shrimp loss and bycatch reductionc) Implement maximum vessel length restriction on shrimp trawlers working inPamlico River+ Decrease navigational and fixed vs. mobile gear conflicts in inside waters+ Reduction in bycatch- Loss <strong>of</strong> income to commercial fishermen and dealersAC Recommendation: Open on 26-30 count heads-on count on or after July 7. Restrict totalheadrope to 90 feet upstream <strong>of</strong> a line between Wades Point and Goose Creek.DMF Recommendation: Open in July (31-35 heads-on) and close to shrimp trawling in August(July 7 through August 7). All waters upstream <strong>of</strong> a line from Wades Point to Goose Creek beclosed to shrimp trawling (Map 3) and 90 feet maximum combined headrope length in PamlicoRiver.MFC Recommendation: Open in July and close to shrimp trawling in August (July 7 throughAugust 7). All waters upstream <strong>of</strong> a line from Wades Point to Goose Creek be closed to shrimptrawling (Map 3) and 90 feet maximum combined headrope length in Pamlico River.329
WadesPointMap 3. Map <strong>of</strong> Pamlico River North Carolina.330
12.23 Appendix 23. SHRIMP MANAGEMENT IN PUNGO RIVERThe Pungo River is a tributary <strong>of</strong> Pamlico Sound (Map 1). The main bottom type is s<strong>of</strong>tmud, with patches <strong>of</strong> hard sand bottom. The shallow waters <strong>of</strong> the feeder creeks containpatches <strong>of</strong> submerged aquatic vegetation (wild celery, eel grass, and widgeongrass).Trawling (shrimp and crab) is only allowed in the main stem <strong>of</strong> the river. All feedercreeks are classified as either Nursery Areas (Primary, Secondary, Special Secondary) orInland waters all <strong>of</strong> which are closed to trawling (Map 2). Overall the Pungo River isapproximately 32,741 acres in size. Of that 25,530 acres are open to trawling. The remainderis either nursery areas (4,361 acres) or inland waters (3,850 acres) all <strong>of</strong> which is closed totrawling. Other commercial fisheries in the Pungo River include crab pot, crab trawl, gill net, eelpotting, pound netting, and long-haul. Over the last 11 years the Pungo River has not beenclosed to shrimp trawling.The Pungo River accounts for 0.05% <strong>of</strong> the total statewide shrimp production. Averageannual shrimp landings are 3,862 pounds, with an average dockside value <strong>of</strong> $8,565. Ninetyninepercent <strong>of</strong> the shrimp landed from Pungo River are caught by shrimp trawls (1996 – 2003Trip ticket Data). The remaining shrimp landings were reported from crab pots (67 pounds), anddip nets (30 pounds).The Pungo River ranks 17 th in shrimp landings by shrimp trawls with average landings <strong>of</strong>3,850 pounds per year (Figure 1). The average dockside value <strong>of</strong> these landings is $8,547. Inaddition to shrimp, an average <strong>of</strong> 189 pounds <strong>of</strong> marketable bycatch with an annual docksidevalue <strong>of</strong> $120 is landed by shrimp trawls from Pungo River. The landed bycatch is composed <strong>of</strong>blue crabs (1,504 total pounds, 1996 – 2003), flounder (9.5 total pounds, 1996 – 2003), andAtlantic croaker (2 total pounds, 1996 – 2003).August accounts for 35% <strong>of</strong> the shrimp landings from shrimp trawls for Pungo River(Table 1). June (26%), July (19%), and September (19%) are the other months with reportedshrimp harvest from this system. Tables 2 through 4 show the percent contribution <strong>of</strong> dailyshrimp landings by market grade for June, July, and August.The percent contribution <strong>of</strong> yearly shrimp trawl landings by various sized vessels is givenin Table 5. Sixty-two percent <strong>of</strong> the shrimp trawl landings were harvested by vessels greaterthan 40 feet in length (Table 6).No fishery dependent data is available from shrimp trawls working in the Pungo River.The DMF conducts two trawl surveys in the Pungo River Program 120 is a nursery area survey,while Program 195 samples the river proper. Data from Program 120 shows that the CPUE <strong>of</strong>southern flounder in Pungo River (CPUE = 4) is the same as those seen in Bay (CPUE = 4),and Neuse rivers (CPUE = 4), greater than the Pamlico (CPUE = 3), and less than those seenin the Bays <strong>of</strong> Pamlico County (CPUE = 5). However this area has the highest CPUE (15 pertow) <strong>of</strong> southern flounder <strong>of</strong> all areas sampled in Program 195. Figure 2 shows the CPUE <strong>of</strong>southern flounder by station and river section for the Pungo River. Overall Southern flounderare the 6 th most abundant finfish species captured in Program 195 in the Pungo River,accounting for 2% <strong>of</strong> the total finfish biomass. The most abundant species is Atlantic croaker(44%), which is followed by spot (38%), Atlantic menhaden (5%), weakfish (4%), and silverperch (3%). Given the suppressed stock scenario <strong>of</strong> southern flounder, it is unclear whatspecific impacts shrimp trawl bycatch has on the overall stock status at this time. However, anyreduction in southern flounder fishing mortality, especially directed toward sublegal fish, would331
enefit the stock. Management <strong>of</strong> Pungo River should include measures to further minimizesouthern flounder bycatch while still achieving the overall goal and objectives <strong>of</strong> this <strong>FMP</strong>.8,000,000Pamlico Sound Total landings 36,378,4507,000,0006,000,0005,000,000Pounds4,000,0003,000,0002,000,0001,000,0000Pamlico SoundCore SoundNew RiverNewport RiverNeuse RiverNorth RiverTopstumpIWWCape fear RiverWhite Oak RiverBogue SoundWaterPamlico RiverIWW-BrunswickBay RiverCroatan SoundRoanoke SoundMasonboro SoundPungo RiverShallotte RiverLockwood FollyFigure 1. Total pounds <strong>of</strong> shrimp harvested by shrimp in major North Carolina waterbodiesbetween 1994-2003.Table 1.Monthly shrimp landings (lbs) from shrimp trawls from Pungo River North Carolina;1996 – 2003.Pounds Percent Percent <strong>of</strong>Month Total Average <strong>of</strong> total Total tripsJune 8,143 1,018 26.44% 27.52%July 5,846 731 18.98% 44.95%August 10,820 1,352 35.13% 9.17%September 5,987 748 19.44% 18.35%332
Table 2. Percent contribution <strong>of</strong> daily June shrimp landings* by market grade for Pungo River, 1996 – 2003.Market grade Total Percent <strong>of</strong>Day 16/20 20/25 26/30 31/35 36/40 41/45 46/50 80+ Mixed pounds monthly total7 0.00% 0.00% 100.00% 0.00% 0.00% 0.00% 0.00% 0.00% 0.00% 187 2.79%17 0.00% 0.00% 0.00% 0.00% 0.00% 0.00% 100.00% 0.00% 0.00% 121 1.80%20 0.00% 0.00% 0.00% 0.00% 0.00% 46.15% 53.85% 0.00% 0.00% 52 0.77%21 0.00% 0.00% 0.00% 0.00% 100.00% 0.00% 0.00% 0.00% 0.00% 830 12.37%24 0.00% 0.00% 0.00% 0.00% 100.00% 0.00% 0.00% 0.00% 0.00% 60 0.89%25 0.00% 0.00% 0.00% 0.00% 100.00% 0.00% 0.00% 0.00% 0.00% 544 8.11%26 0.00% 0.00% 0.00% 91.15% 0.00% 0.00% 0.00% 8.85% 0.00% 339 5.05%27 0.00% 0.00% 0.00% 55.11% 44.89% 0.00% 0.00% 0.00% 0.00% 744 11.09%28 0.00% 0.00% 0.00% 39.81% 12.36% 0.00% 47.83% 0.00% 0.00% 1,173 17.48%29 0.00% 0.00% 0.00% 44.14% 42.93% 0.00% 12.93% 0.00% 0.00% 2,660 39.64%Total 0.00% 0.00% 2.79% 35.17% 45.53% 0.36% 15.71% 0.45% 0.00% 6,710 100.00%*Only showing heads on landings which represent 82% <strong>of</strong> the monthly total.Table 3. Percent contribution <strong>of</strong> daily July shrimp landings* by market grade for Pungo River, 1996 – 2003.Market grade Total Percent <strong>of</strong>Day 16/20 20/25 26/30 31/35 36/40 41/45 46/50 80+ Mixed pounds monthly total3 0.00% 0.00% 0.00% 100.00% 0.00% 0.00% 0.00% 0.00% 0.00% 107 7.21%6 0.00% 0.00% 0.00% 0.00% 32.35% 0.00% 47.06% 20.59% 0.00% 204 13.75%7 0.00% 0.00% 0.00% 0.00% 0.00% 0.00% 0.00% 0.00% 100.00% 10 0.67%8 0.00% 100.00% 0.00% 0.00% 0.00% 0.00% 0.00% 0.00% 0.00% 431 29.04%9 0.00% 100.00% 0.00% 0.00% 0.00% 0.00% 0.00% 0.00% 0.00% 65 4.38%10 0.00% 63.49% 0.00% 0.00% 0.00% 36.51% 0.00% 0.00% 0.00% 126 8.49%16 0.00% 0.00% 0.00% 100.00% 0.00% 0.00% 0.00% 0.00% 0.00% 228 15.36%17 0.00% 0.00% 0.00% 100.00% 0.00% 0.00% 0.00% 0.00% 0.00% 276 18.60%19 0.00% 100.00% 0.00% 0.00% 0.00% 0.00% 0.00% 0.00% 0.00% 37 2.49%Total 0.00% 41.31% 0.00% 41.17% 4.45% 3.10% 6.47% 2.83% 0.67% 1,484 100.00%*Only showing heads on landings which represent 25% <strong>of</strong> the monthly total.333
Table 4. Percent contribution <strong>of</strong> daily August shrimp landings* by market grade for Pungo River, 1996 – 2003.Market grade Total Percent <strong>of</strong>Day 16/20 20/25 26/30 31/35 36/40 41/45 46/50 80+ Mixed pounds monthly total7 84.52% 0.00% 0.00% 0.00% 15.48% 0.00% 0.00% 0.00% 0.00% 7,029 99.79%12 0.00% 0.00% 0.00% 0.00% 0.00% 0.00% 0.00% 0.00% 100.00% 7 0.10%13 0.00% 0.00% 0.00% 0.00% 0.00% 0.00% 0.00% 0.00% 100.00% 8 0.11%Total 84.34% 0.00% 0.00% 0.00% 15.45% 0.00% 0.00% 0.00% 0.21% 7,044 100.00%*Only showing heads on landings which represent 65% <strong>of</strong> the monthly total.Table 5. Percent contribution <strong>of</strong> various vessel size classes to total shrimp trawl landings in Pungo River; 1996 – 2003.Vessel size rangeYear < 20' 20 - 24' 25 - 29' 30 - 34' 35 - 39' 40 - 44' 45 - 49' 50 - 54' 55 - 59' > 60' Unknown Total1996 0.00% 0.00% 0.00% 0.00% 0.00% 0.00% 0.00% 0.00% 0.00% 0.00% 100.00% 100.00%1997 0.00% 0.55% 7.87% 0.00% 15.74% 26.86% 9.37% 0.00% 0.00% 39.60% 0.00% 100.00%1999 0.00% 0.00% 0.00% 0.00% 0.00% 0.00% 0.00% 0.00% 0.00% 100.00% 0.00% 100.00%2000 0.00% 0.00% 22.14% 0.00% 23.13% 2.09% 0.00% 0.00% 0.00% 51.63% 1.00% 100.00%2001 0.00% 4.88% 0.84% 9.95% 38.46% 6.56% 20.62% 0.00% 17.34% 0.00% 1.35% 100.00%2002 0.76% 7.11% 0.76% 5.93% 29.56% 6.10% 21.30% 0.00% 24.53% 3.94% 0.00% 100.00%2003 0.00% 100.00% 0.00% 0.00% 0.00% 0.00% 0.00% 0.00% 0.00% 0.00% 0.00% 100.00%Total 0.19% 2.95% 5.69% 3.72% 21.93% 4.59% 10.40% 0.00% 10.11% 37.08% 3.35% 100.00%334
Table 6. Percent contribution <strong>of</strong> three vessel size groups to yearly shrimp trawl landings in Pungo River; 1996 – 2003.Vessel size rangeYear < 20' 20 - 39' > 40' Total1996 0.00% 0.00% 0.00% 0.00%1997 0.00% 24.17% 75.83% 100.00%1999 0.00% 0.00% 100.00% 100.00%2000 0.00% 45.28% 53.72% 99.00%2001 0.00% 54.13% 44.52% 98.65%2002 0.76% 43.37% 55.87% 100.00%2003 0.00% 100.00% 0.00% 100.00%Total 0.19% 34.28% 62.18% 96.65%335
Map 1. Map <strong>of</strong> Pamlico and Albemarle sounds North Carolina.336
ProposedDMF notrawl lineMap 2. Map <strong>of</strong> Pungo River North Carolina.337
Upper PungoCPUE = 14Mid PungoCPUE = 15Lower PungoCPUE = 14Figure 2.Catch per unit effort (CPUE) <strong>of</strong> southern flounder in the Pamlico and Pungo rivers from Program 195, June andSeptember data combined, 1987 – 2003.338
Management Option/Impacts+ potential positive impact <strong>of</strong> action- potential negative impact <strong>of</strong> action1. Status quo (potential to close and open when shrimp are <strong>of</strong> sufficient size)+ Flexibility in reacting to variable conditions (excessive rainfall, early migration)+ Access to resource by a variety <strong>of</strong> users- Does not minimize harvest <strong>of</strong> small shrimp and bycatch- Labor intensive and expensive to sample- Necessitates “grand openings”2. Harvest Season (Month (s), or Month (s)/Day (s) closures)a) Implement closure <strong>of</strong> Pungo River with initial June proclamation and open in midJuly (based on predetermined heads-on count).+ Eliminates grand openings (if coordinated with other areas)+ Protection <strong>of</strong> small shrimp and juvenile fish and crabs.+ Potential for larger shrimp when trawling is opened- Lose flexibility <strong>of</strong> management by proclamation- Loss <strong>of</strong> resource to RCGL and smaller commercial trawlersb) Implement split season for commercial and RCGL shrimpers (same as # 2 aboveexcept open to RCGL harvest 1 or 2 weeks prior to commercial opening)+ Protection <strong>of</strong> small shrimp and juvenile fish and crabs+ Allows access to resource by all users+ Potential for larger shrimp when trawling is opened- Lose flexibility <strong>of</strong> management by proclamationc) Open in July (based on predetermined heads-on count or pre determined date)and close to shrimp trawling in mid to late August+ Eliminates grand openings (if coordinated with other areas)+ Protection <strong>of</strong> small shrimp and juvenile fish and crabs+ Potential for larger shrimp when trawling is opened- Lose flexibility <strong>of</strong> management by proclamation- Loss <strong>of</strong> resource to RCGL and smaller commercial trawlers339
3. Area Closuresa) Prohibit all shrimp trawlers in Pungo River+ Bycatch issue completely eliminated+ Potential for healthier shellfish/finfish stocks+ Decrease navigational and fixed vs. mobile gear conflicts in inside waters+ Allow for harvest <strong>of</strong> larger count shrimp once they migrate into Pamlico Sound- Loss <strong>of</strong> income to commercial fishermen and dealers- Loss <strong>of</strong> RCGL use <strong>of</strong> shrimp resourceb) Close portions <strong>of</strong> the river to shrimp trawl harvest.+ Decrease navigational and fixed vs. mobile gear conflicts in closed waters+ Allow for harvest <strong>of</strong> larger count shrimp once they migrate into Open areas- Loss <strong>of</strong> income to commercial fishermen and dealers- Loss <strong>of</strong> recreational use <strong>of</strong> shrimp resource4. Regulate Means and Methods (gear and vessel)a) Implement headrope size limit on shrimp trawlers working in Pungo River+ Allows for all size classes <strong>of</strong> vessels to work+ Reduction in bycatch- Reduction in fishing power <strong>of</strong> larger vesselsb) Increase tailbag mesh size.+ Reduction in bycatch+ Catch larger size shrimp- Loss <strong>of</strong> smaller size shrimp- Insufficient data on different mesh sizes and shrimp loss and bycatch reductionc) Implement maximum vessel length restriction on shrimp trawlers working inPungo River+ Decrease navigational and fixed vs. mobile gear conflicts in inside waters+ Reduction in bycatch- Loss <strong>of</strong> income to commercial fishermen and dealersAC Recommendation: Open on 26-30 count heads-on count on or after July 7. Restrict totalheadrope to 90 feet upstream <strong>of</strong> a line between Wades Point and Abels Bay.DMF, and MFC Recommendation: All waters upstream <strong>of</strong> a line from Wades Point to AbelsBay be closed to shrimp trawling (Map 2).340
12.24 Appendix 24. SHRIMP MANAGEMENT IN THE ATLANTIC OCEANNorth Carolina’s coastline on the Atlantic Ocean is comprised <strong>of</strong> barrier islands thatstretch approximately 484 kilometers. Shoals extending perpendicular from shore accompanycapes and inlets along North Carolina’s coastal ocean. Ocean currents converging with theseshoals, along with the meeting <strong>of</strong> the north-flowing Gulf Stream and the south-flowing VirginiaCoastal Labrador current create a nutrient rich environment for marine organisms. On average,24% <strong>of</strong> shrimp landed in North Carolina are harvested from these nearshore (< 3 miles) oceanwaters. Near-shore hardbottom areas, dense concentrations <strong>of</strong> marine algae, artificial reefsand shipwrecks limit the amount <strong>of</strong> trawlable bottom available to commercial fishers. The manyinlets separating the barrier islands act as corridors that marine organisms utilize as they enterand exit the estuaries. All three species <strong>of</strong> shrimp are harvested in the ocean waters.Since shrimp that migrate from the estuaries are usually large, the <strong>Division</strong> <strong>of</strong> <strong>Marine</strong><strong>Fisheries</strong> (DMF) does not actively manage the ocean waters. However, during the past fewyears and exclusively <strong>of</strong>f the Brunswick county coast, DMF has been requested by thefishermen to take a more active role in the management <strong>of</strong> the ocean shrimp fishery. Theserequests were precipitated as result <strong>of</strong> the heavy hurricane or tropical storm induced rains thathave impacted southeastern North Carolina with regularity since the mid 1990’s. Fresh waterfrom these heavy rains dramatically reduces salinities in the estuaries causing the shrimp toprematurely migrate from the estuaries into the ocean. When this occurs, DMF generally closesthe impacted ocean and estuarine waters. With the exception <strong>of</strong> 2001, closures <strong>of</strong> this naturehave occurred each year during the period 1999-2003.According to data supplied by the DMF trip ticket program, an average <strong>of</strong> 221 vesselslanded shrimp from the ocean during 1994-2003. Vessel size was variable but over 70% <strong>of</strong> thevessels in this fishery exceeded 40 ft. in length. Landings are charted by boat size and by yearin order to highlight the trends in the ocean fishery (Figure 1). Noteworthy is the fact that thenumber <strong>of</strong> vessels/participants harvesting shrimp in the ocean has been decreasing in the last10 years, with a dramatic decrease since 1999 (Figure 2).The DMF trip ticket program separates ocean landings based on whether the shrimpwere captured in federal ocean waters (> 3 miles) or state ocean waters (< 3 miles) (Figures 3and 4). The ocean fishery is prosecuted up and down the coast but the majority <strong>of</strong> the harvestoccurs in southeastern North Carolina (Onlsow County south) and in state waters less than 3miles from the beach. On average, landings from ocean waters less than 3 miles represented85.5% <strong>of</strong> the catch between 1994-2003 with approximately 75% <strong>of</strong> these shrimp being capturedin the ocean adjacent to Onslow, Carteret and Brunswick counties (Figure 5).Ten-year mean catches by percent <strong>of</strong> total pounds for the federal ocean waters (> 3miles) were highest in Carteret County, (41.2%) followed by Brunswick, Pamlico and Onslowcounties with 31.6, 16.3, and 5.8 percent respectively. Ten-year mean catches for state oceanwaters (
350000030000002500000200000015000001000000Unknown>71ft.61-70ft.51-60ft.41-50ft.31-40ft.21-30ft0-30ft50000001994 1995 1996 1997 1998 1999 2000 2001 2002 2003Figure 1. Landings in ocean waters by boat size and year 1994-2003.400350300Participants2502001501005001994 1995 1996 1997 1998 1999 2000 2001 2002 2003YEARFigure 2. Number <strong>of</strong> participants/vessels in ocean fishery 1994-2003.342
3000000450025000004000350020000003000Pounds150000025002000Trips> 3 miles< 3 milesTrips100000015005000001000500001994199519961997199819992000200120022003YearFigure 3. Landings in state and federal ocean waters and total trips, 1994-2003.3,000,0002,500,0002,000,0001,500,0001,000,000500,00001993 1994 1995 1996 1997 1998 1999 2000 2001 2002 2003Ocean >3 miOcean < 3 miFigure 4. Trend <strong>of</strong> Landings in state and federal waters 1994-2003.343
5,000,0004,500,0007,035,8694,000,0003,500,0003,000,0002,500,0002,000,0001,500,0001,000,000500,0000BEAUFORTBRUNSWICKCARTERETCOLUMBUSCRAVENDAREDUPLINHYDENEW HANOVERONSLOWPAMLICOPENDERROCKINGHAMSAMPSONUNIONOcean >3 miOcean < 3 miFigure 5.Combined ocean landings in pounds, by county, for the period 1994-2003 in stateand federal ocean waters.Marketable bycatch landed in ocean shrimp trawls was calculated based on trip ticketinformation provided to DMF. The total pounds <strong>of</strong> all landed species from shrimp trawls weresummed for the years 1994-20003 and the top 5 species by weight are noted for both state andfederal ocean waters (Figure 6). Excluding Penaeid shrimp, the remainder <strong>of</strong> the catch landedduring 1994-2003 included approximately 59 species <strong>of</strong> fish as well as rock shrimp, crab, squid,octopus, and conch. By weight, for both state and federal waters, Penaeid shrimp accountedfor 91.7% percent <strong>of</strong> the ocean trawl catch and the other species accounted for 9.3% <strong>of</strong> thecatch. Further analysis <strong>of</strong> the trip ticket data indicated that, in the landed catch, species otherthan Penaeid shrimp accounted for 12.2% <strong>of</strong> the take in federal waters and 8.9% in statewaters.344
5%6%17%Ocean >3 Miles44%Sea M ulletSpotFlounderButterfishSquidOther10%18%Ocean
The National <strong>Marine</strong> <strong>Fisheries</strong> Service, (NMFS) reporting to Congress in April, 1995provided data on bycatch proportions in the South Atlantic. All data was gathered by observersaboard commercial shrimp trawlers in normal fleet operations (with TEDs). Analysis revealedthat an average trawl pulled for one hour in the South Atlantic captured 1214 organismsweighing nearly 64 lbs. Commercial shrimp accounted for 29% <strong>of</strong> the total catch by number and20% by weight. Finfish represented 46% <strong>of</strong> the catch by number and 47% by weight. The ratio<strong>of</strong> finfish to shrimp per hour <strong>of</strong> trawling was calculated at 1.6 : 1 by number and 2.3 : 1 byweight. The ratio <strong>of</strong> all the species captured to shrimp was 4.5 : 1. Besides finfish, the otherportions <strong>of</strong> the typical catch were comprised <strong>of</strong> crustaceans (8% by weight, 11% by number)and other invertebrates (25% by weight and 14% by number (NMFS, 1995). The top 10 speciescaptured by weight are shown below (Table 1).Table 1.The top 10 species by weight found in South Atlantic shrimp trawl catches.SpeciesPercentCannonball jellyfish 14White <strong>Shrimp</strong> 9Spot 9Atlantic menhaden 9Brown shrimp 8Other jellyfish 8Atlantic croaker 6Southern kingfish (sea mullet) 4Blue Crab 4Star Drum 3Finfish to shrimp ratios are commonly used for relative comparison in bycatch studies.However, it must be realized that these ratios may vary widely relative to times and areas fishedand that it can be somewhat misleading to combine all <strong>of</strong> these variations into a single number.The NMFS study revealed that in the South Atlantic, the highest shrimp catches and the lowestfinfish catches (by number) occurred during September through May (NMFS, 1995).Diamond-Tissue’s 1995 characterizations study focused primarily on the inshore shrimpfishery but did contain data on 8 tows <strong>of</strong>f Carolina Beach. The boat used in this sampling hadthe required TEDs and BRDs. The catch in the ocean adjacent to Carolina Beach showedhigher percentages (by number) <strong>of</strong> fish than shrimp in July, but reversed in August. However,by weight, the percentage <strong>of</strong> fish was greater than shrimp in August. Ratios <strong>of</strong> finfish to shrimpby weight in July and August were 2.7 : 1 and 4 : 1 respectively. However, these data werebased on only 8 tows from 3 trips.BRD requirements have significantly reduced the amount <strong>of</strong> non-targeted bycatch inboth inshore and <strong>of</strong>fshore shrimp trawlers. However, due to the limited number <strong>of</strong> studies inNorth Carolina ocean waters, the trawlers’ impact on fish stocks needs more study.346
Current AuthorityNorth Carolina <strong>Fisheries</strong> Rules for Coastal Waters (15A NCAC)3J .0202 – Atlantic Ocean(2) It is unlawful to use trawls within one-half mile <strong>of</strong> the beach between the Virginialine and Oregon Inlet.(5) Finfish taken with shrimp or crab trawls:(a) It is unlawful to possess finfish (including pursuant to 15A NCAC 03M .0102)incidental to shrimp or crab trawl operations from December 1 through March31 unless the weight <strong>of</strong> the combined catch <strong>of</strong> shrimp and crabs exceeds theweight <strong>of</strong> finfish except as provided in Sub-Item (5)(b) <strong>of</strong> this Rule:(b) It is unlawful to possess 300 pounds <strong>of</strong> kingfish (Menticirrhus sp.) taken south<strong>of</strong> Bogue Inlet regardless <strong>of</strong> the amount <strong>of</strong> shrimp, crabs or finfish taken.(8) It is unlawful to use shrimp trawls in all waters west <strong>of</strong> a line beginning at thesoutheastern tip <strong>of</strong> Baldhead Island 33 o 50’ 29” N – 77 o 57’ 28” W from one hour aftersunset to one hour before sunrise.3L.0102 – WEEKEND SHRIMPING PROHIBITEDIt is unlawful to take shrimp by any method from 9:00 P.M. on Friday through 5:00 P.M. onSunday except:(1) In the Atlantic Ocean; or(2) With the use <strong>of</strong> fixed and channel nets, hand seines, and cast nets.The current rules which apply to the shrimp fishery in the Atlantic Ocean limit the amount <strong>of</strong>finfish that may be retained and were a result <strong>of</strong> an effort to limit the use <strong>of</strong> shrimp trawls to takefinfish during the flynet season. The night closure <strong>of</strong>f Brunswick County was initiated byshrimpers in the area to reduce effort. There was some discussion at the time <strong>of</strong> extending theweekend closure to the Ocean but it was never realized.Management Options/Impacts(+ potential positive impact <strong>of</strong> action)( - potential negative impact <strong>of</strong> action)1) Status quo (potential opening dates set by proclamation and determined by sampling)+ Flexibility in dealing with variety <strong>of</strong> conditions+ No need for further rulemaking- Does not address harvest <strong>of</strong> waste/bycatch2) Allow night-time trawling <strong>of</strong>f Brunswick County.+ Allow harvest when shrimp are available+ More efficient for individual operations- Modifications to strategy may not have intended effect- Possible increase in waste/bycatch3) Prohibit weekend trawling <strong>of</strong>f Brunswick County+ Decrease in waste/bycatch+ Decrease in interactions between trawlers and other user groups+ Possible increase in CPUE following closure- Economic loss to fishermen347
4) Prohibit all trawling+ Possible benefit to finfish stocks+ Eliminates any social conflicts between trawlers, piers and beach communities- Eliminates traditional trawl fishery in some areas- Financial hardship on shrimpers- Economic loss to the local economyAC, DMF, and MFC Recommendation: Status quo except examine the night closure <strong>of</strong>fBrunswick County.348
12.25 Appendix 25. SHRIMP MANAGEMENT IN PAMLICO SOUNDPamlico Sound system extends from Oregon Inlet south to Core Sound (Map 1). Salinityvaries from 25 - 30 ppt near the three inlets to near zero in the upper tributaries. Two large riversystems (Neuse and Tar-Pamlico) provide the major fresh water inputs. The average depth <strong>of</strong>the sound is 16 ft. Numerous small creeks and bays surround Pamlico Sound. The Sound isdivided into two basins east and west <strong>of</strong> Bluff Shoal. Extensive low salinity Juncus marshesborder the sound and many <strong>of</strong> the tributary bays and creeks. Significant SAV beds occur in thesound, with high salinity species (e.g., eel grass) along the shoals behind the Outer Banks inthe east and low salinity species (e.g., widgeon grass, wild celery) along some <strong>of</strong> the westernshores. There are diurnal tides <strong>of</strong> 2 - 3 ft near the three inlets, but virtually no lunar tides awayfrom the inlet areas. However, wind tides exceeding 2 ft regularly occur during storms.Trawling (shrimp and crab) is only allowed in the main portion <strong>of</strong> the sound. All feedercreeks and bays are classified as either Nursery Areas (Primary, Secondary, SpecialSecondary) or no trawl areas all <strong>of</strong> which are closed to trawling (Map 2). Overall this system isapproximately 1,129,577 acres in size. 1,088,258 acres are under DMF jurisdiction (coastaland joint waters). 5,400 acres are classified as Primary Nursery areas, 30,184 acres asSecondary Nursery areas, 1,916 acres as Special Secondary Nursery areas, and 172,128 acres<strong>of</strong> no trawl areas. Seventy-nine percent <strong>of</strong> the water under DMF jurisdiction is open to trawling.Other commercial fisheries in Pamlico Sound include crab pot, crab trawl, crab dredging, oysterdredging, clam kicking, gill net, pound netting, and long-haul. Over the last 11 years portions <strong>of</strong>western Pamlico Sound have been closed six times to shrimp trawling (Map 3).Pamlico Sound accounts for 51% <strong>of</strong> the total statewide shrimp production. Averageannual shrimp landings are 3,637,844 pounds, with an average dockside value <strong>of</strong> $8,993,767.Ninety-nine percent <strong>of</strong> the shrimp landed from the Pamlico Sound are caught by shrimp trawls(1994 – 2003 Trip ticket Data). Other gears with reported shrimp landings are; channel net(0.01%) skimmer trawls (0.03%), and crab trawls (0.03%).Pamlico Sound ranks 1 st in shrimp landings by shrimp trawls with average annuallandings <strong>of</strong> 3,634,168 pounds (Figure 1). The average dockside value <strong>of</strong> these landings is$8,984,478. In addition to shrimp, an average <strong>of</strong> 208,919 pounds <strong>of</strong> marketable bycatch with adockside value <strong>of</strong> $160,593 is landed annually by shrimp trawls from Pamlico Sound. Thelanded bycatch is composed <strong>of</strong> finfish (63%; 131,965 pounds/year), blue crabs (36%; 74,574pounds/year), and mollusks (1%; 2,378 pounds/year). Kingfishes are the most common finfishspecies landed with average annual landings <strong>of</strong> 39,057 pounds (Table 1), 92% <strong>of</strong> which arelanded from July through November (Table 2).July accounts for 30% <strong>of</strong> the shrimp landings from shrimp trawls for Pamlico Sound(Tables 2 and 3). The months <strong>of</strong> August (28%), September (16%), and October (14%) are theother three main months <strong>of</strong> shrimp harvest from this system.The percent contribution <strong>of</strong> yearly shrimp trawl landings by various sized vessels is givenin Table 4. Seventy-four percent <strong>of</strong> the shrimp trawl landings were harvested by vessels greaterthan 40 feet in length (Table 4).Although a detailed characterization study <strong>of</strong> bycatch in the shrimp trawl fishery has notbeen conducted for Pamlico Sound, preliminary data was collected in 1995 (Diamond-Tissue1999). Diamond-Tissue’s (1999) 1995 characterization study examined 16 tows conducted over5 trips (Tables 5 and 6). Penaeid shrimp were the most abundant species captured by weight349
and number. Atlantic croaker, spot, and weakfish were the top three finfish species captured(Tables 5 and 6).8,000,000Pamlico Sound Total landings 36,378,4507,000,0006,000,0005,000,000Pounds4,000,0003,000,0002,000,0001,000,0000Pamlico SoundCore SoundNew RiverNewport RiverNeuse RiverNorth RiverTopstumpIWWCape fear RiverWhite Oak RiverBogue SoundPamlico RiverWaterIWW-BrunswickBay RiverCroatan SoundRoanoke SoundMasonboro SoundPungo RiverShallotte RiverLockwood FollyFigure 1.Total pounds <strong>of</strong> shrimp harvested by shrimp in major North Carolina waterbodiesbetween 1994-2003.350
Table 1.Landings (lbs) <strong>of</strong> finfish from shrimp trawls from the Pamlico Sound North Carolina;1994 – 2003.PoundsPercentSpecies Total Average <strong>of</strong> totalKingfish 390,572 39,057 29.60%Flounders 360,464 36,046 27.32%Spot 229,863 22,986 17.42%Weakfish 137,707 13,771 10.44%Fish, Mixed 52,018 5,202 3.94%Butterfish 44,570 4,457 3.38%Croaker 33,982 3,398 2.58%Harvestfish 27,022 2,702 2.05%Spanish Mackerel 8,693 869 0.66%Sheepshead 7,345 735 0.56%Spadefish 6,961 696 0.53%Black drum 5,224 522 0.40%Bluefish 4,770 477 0.36%Pigfish 4,106 411 0.31%Cutlassfish 1,744 174 0.13%Puffer 1,052 105 0.08%False albacore 624 62 0.05%Pompano 606 61 0.05%Grouper, snowy 442 44 0.03%Snapper, cubera 400 40 0.03%Angelfish 202 20 0.02%Eels 182 18 0.01%Red drum 182 18 0.01%Speckled trout 141 14 0.01%Shark, angel 130 13 0.01%Mullets, jumping 116 12 0.01%Triggerfish 104 10 0.01%Porgies 84 8 0.01%Yellow perch 57 6 0.00%King mackerel 56 6 0.00%Menhaden bait 45 5 0.00%Hakes 42 4 0.00%Black sea bass 33 3 0.00%Pinfish 20 2 0.00%Monkfish 19 2 0.00%Cobia 15 2 0.00%Cod 11 1 0.00%Tautog 11 1 0.00%Crevalle jack 10 1 0.00%Boston mackerel 10 1 0.00%Bait 8 1 0.00%Mixed grouper 8 1 0.00%Shad 2 0 0.00%Permit 1 0 0.00%Total 1,319,650 131,965 100.00%351
Table 2. Monthly percent contribution <strong>of</strong> landed shrimp trawl catch for Pamlico Sound North Carolina; 1994 – 2003.MonthTotalSpecies January February March April May June July August September OctoberNovemberDecember pounds<strong>Shrimp</strong> 0.11% 0.03%0.00%0.09%0.80% 3.66% 30.06% 28.17% 16.08% 14.24% 6.11% 0.66%36,340,691Blue crab 1.00% 0.08%0.03%1.46%3.21% 12.71% 20.06% 17.07% 10.75% 12.73% 15.58% 5.33% 742,855Sea mullet (whiting, kingfish) 0.03% 0.09%0.02%0.23%1.20% 4.80% 17.42% 28.29% 12.82% 18.01% 15.08% 2.02% 390,572Flounders (Paralichthid) 0.21% 0.10%0.01%0.44%1.95% 3.22% 10.18% 16.37% 29.63% 24.83% 11.13% 1.92% 360,464Spot 0.00% 0.00%0.00%0.00%0.04% 0.58% 5.85% 19.26% 37.60% 32.06% 4.52% 0.09% 229,863Weakfish 0.06% 0.03%0.00%0.03%0.95% 2.83% 17.03% 27.24% 16.49% 19.11% 14.12% 2.09% 137,707Fish, mixed 0.00% 0.04%0.12%0.42%0.71% 2.98% 15.16% 18.77% 22.68% 18.20% 13.52% 7.41% 52,018Butterfish 0.02% 0.00%0.00%0.00%0.77% 3.28% 10.47% 25.48% 21.53% 23.15% 12.17% 3.15% 44,570Croaker 0.00% 0.00%0.00%0.05%0.19% 1.13% 9.23% 23.15% 36.77% 16.66% 9.05% 3.78% 33,982Harvestfish 0.00% 0.00%0.00%0.30%0.64% 5.66% 20.21% 26.60% 24.91% 19.53% 1.26% 0.89% 27,022Squid, Loligo (lbs) 0.00% 1.02%0.02%0.00%0.04% 0.69% 1.99% 12.42% 18.52% 19.59% 32.23% 13.48% 19,299Mackerel, Spanish 0.00% 0.00%0.00%0.01%0.62% 2.92% 7.49% 27.25% 35.48% 24.78% 1.45% 0.00% 8,693Sheepshead 0.00% 0.00%0.00%0.14%2.61% 7.31% 14.54% 12.02% 11.67% 41.76% 9.95% 0.00% 7,345Spadefish 0.00% 0.00%0.00%0.00%0.85% 6.68% 36.22% 43.38% 11.35% 1.52% 0.00% 0.00% 6,961Drum, black 2.83% 0.00%0.00%0.00%0.00% 0.34% 0.17% 2.16% 3.22% 28.91% 27.81% 34.55% 5,224Bluefish 0.00% 0.00%0.00%0.00%0.16% 1.69% 4.43% 35.61% 36.17% 18.97% 2.98% 0.00% 4,770Squid 0.00% 0.00%0.00%0.00%0.00% 0.77% 0.00% 0.50% 3.38% 61.01% 33.51% 0.84% 4,414Pigfish 0.00% 0.00%0.00%0.00%0.95% 1.84% 2.86% 5.33% 17.12% 33.82% 38.07% 0.00% 4,106Crab, Horseshoe 7.70% 0.00%0.00%0.00%0.00% 0.00% 0.00% 0.00% 0.00% 0.00% 62.23% 30.07% 2,883Cutlassfish 0.00% 0.00%0.00%0.00%0.00% 0.00% 1.99% 13.11% 45.17% 16.95% 22.79% 0.00% 1,744Puffer 0.00% 0.00%0.00%0.00%0.38% 0.10% 0.10% 0.10% 0.71% 10.18% 31.95% 56.49% 1,052<strong>Shrimp</strong>, Rock 0.00% 0.00%0.00%0.00%0.00% 0.00% 1.01% 69.88% 29.11% 0.00% 0.00% 0.00% 986False Albacore 0.00% 0.00%0.00%0.00%0.00% 0.00% 0.00% 0.00% 0.00%100.00% 0.00% 0.00% 624Pompano 0.00% 0.00%0.00%0.00%0.00% 0.50% 4.13% 16.52% 38.73% 39.47% 0.66% 0.00% 606Grouper, snowy 0.00% 0.00%0.00%0.00%0.00% 0.00% 0.00% 0.00% 100.00% 0.00% 0.00% 0.00% 442Snapper, cubera 0.00% 0.00%0.00%0.00%0.00% 0.00% 0.00% 0.00% 100.00% 0.00% 0.00% 0.00% 400Angelfish 0.00% 0.00%0.00%0.00%0.00% 0.00% 80.20% 14.85% 4.95% 0.00% 0.00% 0.00% 202Eels 0.00% 0.00%0.00%0.00%0.00% 0.00% 0.00% 18.68% 29.67% 37.36% 14.29% 0.00% 182Drum, red 0.00% 0.00%0.00%0.00%0.00% 0.00% 22.87% 9.92% 55.10% 12.12% 0.00% 0.00% 182Trout, Speckled 22.78% 0.00%0.00%0.00%1.42% 0.71% 15.66% 27.76% 1.42% 9.96% 20.28% 0.00% 141Shark, Angel 0.00% 0.00%0.00%0.00%0.00% 0.00%100.00% 0.00% 0.00% 0.00% 0.00% 0.00% 130Mullets, Jumping 0.00% 0.00%0.00%0.00%0.00% 0.00% 0.00% 22.41% 6.03% 71.55% 0.00% 0.00% 116352
Table 2. Cont.MonthTotalSpecies January February March April May June July August September OctoberNovemberDecember poundsTriggerfish 0.00% 0.00%0.00%0.00%0.00% 0.00% 7.69% 0.00% 0.00% 92.31% 0.00% 0.00% 104Porgies Uncl. 0.00% 0.00%0.00%0.00%0.00% 82.14% 0.00% 17.86% 0.00% 0.00% 0.00% 0.00% 84Yellow Perch 0.00% 0.00%0.00%0.00%0.00% 0.00% 0.00% 0.00% 0.00%100.00% 0.00% 0.00% 57Mackerel, King 0.00% 0.00%0.00%0.00%0.00% 0.00% 0.00% 68.52% 0.00% 31.48% 0.00% 0.00% 56Menhaden Bait (lb) 0.00% 0.00%0.00%0.00%0.00% 0.00% 0.00% 0.00% 88.89% 0.00% 4.44% 6.67% 45Hakes (Ling/Whiting) 83.33% 16.67%0.00%0.00%0.00% 0.00% 0.00% 0.00% 0.00% 0.00% 0.00% 0.00% 42Octopus (lbs) 0.00% 0.00%0.00%0.00%0.00% 0.00% 0.00%100.00% 0.00% 0.00% 0.00% 0.00% 37Sea Bass, Black 0.00% 0.00%0.00%0.00%0.00% 0.00% 30.30% 0.00% 3.03% 30.30% 0.00% 36.36% 33Conchs/Whelk (lbs meat) 0.00% 0.00%0.00%0.00%6.74% 77.53% 0.00% 0.00% 0.00% 0.00% 0.00% 15.73% 29Turtles, Snapper (lbs) 0.00% 0.00%0.00%0.00%0.00% 0.00% 0.00% 0.00% 100.00% 0.00% 0.00% 0.00% 22Pinfish 0.00% 0.00%0.00%0.00%0.00% 0.00% 0.00% 0.00% 0.00% 0.00% 100.00% 0.00% 20Monkfish (Whole) 0.00% 0.00%0.00%0.00%0.00% 42.11% 0.00% 0.00% 57.89% 0.00% 0.00% 0.00% 19Cobia 0.00% 0.00%0.00%0.00%0.00% 0.00%100.00% 0.00% 0.00% 0.00% 0.00% 0.00% 15Cod 0.00% 0.00%0.00%0.00%0.00% 0.00% 0.00% 0.00% 100.00% 0.00% 0.00% 0.00% 11Tautog 0.00% 0.00%0.00%0.00%0.00% 0.00% 0.00% 0.00% 100.00% 0.00% 0.00% 0.00% 11Crevalle jack 0.00% 0.00%0.00%0.00%0.00% 0.00% 0.00% 90.00% 10.00% 0.00% 0.00% 0.00% 10Mackerel, Boston 0.00% 0.00%0.00%0.00%0.00% 0.00% 0.00% 0.00% 0.00%100.00% 0.00% 0.00% 10Bait 0.00% 0.00%0.00%0.00%0.00% 0.00% 0.00% 0.00% 0.00% 0.00% 100.00% 0.00% 8Grouper, mixed 0.00% 0.00%0.00%0.00%0.00% 0.00% 0.00%100.00% 0.00% 0.00% 0.00% 0.00% 8Shad 0.00% 0.00%0.00%0.00%0.00% 0.00% 0.00% 0.00% 0.00%100.00% 0.00% 0.00% 2Permit 0.00% 0.00%0.00%0.00%0.00%100.00% 0.00% 0.00% 0.00% 0.00% 0.00% 0.00% 1Total 0.12% 0.03%0.00%0.12%0.86% 3.82% 29.25% 27.75% 16.25% 14.51% 6.49% 0.80%38,430,867353
Table 3.Monthly shrimp landings (lbs) from shrimp trawls from Pamlico Sound NorthCarolina; 1994 – 2003.Pounds PercentPercent<strong>of</strong> totalMonth total average <strong>of</strong> total tripsJanuary 38,624 3,862 0.11% 0.22%February 9,882 988 0.03% 0.06%March 1,328 133 0.00% 0.04%April 31,307 3,131 0.09% 0.56%May 290,861 29,086 0.80% 2.03%June 1,330,971 133,097 3.66% 6.08%July 10,923,071 1,092,307 30.06% 24.53%August 10,236,515 1,023,652 28.17% 28.78%September 5,845,062 584,506 16.08% 17.45%October 5,175,027 517,503 14.24% 13.00%November 2,219,694 221,969 6.11% 6.24%December 238,349 23,835 0.66% 1.01%Total 36,340,691 3,634,069 100.00% 100.00%Table 4.Percent contribution <strong>of</strong> three vessel size groups to yearly shrimp trawl landings inPamlico Sound; 1994 – 2003.Vessel size rangeNumber <strong>of</strong>Year 40' Total licenses1994 3% 14% 83% 98% 5091995 52% 14% 34% 98% 5191996 14% 12% 74% 97% 3811997 3% 16% 81% 97% 3351998 3% 15% 82% 98% 1851999 2% 19% 79% 97% 5092000 1% 19% 79% 98% 4202001 1% 22% 77% 99% 2982002 2% 18% 80% 100% 3542003 0% 13% 87% 100% 189Total 10% 17% 73% 98%354
Table 5.Catch composition (top ten species) by number for shrimp trawls in Pamlico Sound(from Diamond-Tissue 1999).Total Percent <strong>of</strong>Frequency<strong>of</strong>Rank Species number total number occurrence1 Penaeid shrimp 13,671 28.9 162 Atlantic croaker 12,046 25.5 163 Spot 8,043 17 164 Weakfish 5,047 10.7 155 Blue crab 2,023 4.3 146 Jellyfish 1,586 3.4 67 Silver perch 884 1.9 88 Summer flounder 656 1.4 119 Hogchoker 489 1 1210 Brown shrimp 392 0.8 694.9Table 6.Catch composition (top ten species) by weight for shrimp trawls in Pamlico Sound(from Diamond-Tissue 1999).Totalweight(pounds)Frequency<strong>of</strong>occurrencePercent <strong>of</strong>Rank Speciestotal weight1 Penaeid shrimp 635 22.4 162 Weakfish 583 20.5 153 Atlantic croaker 546 19.2 164 Spot 458 16.2 165 Blue crab 254 9.0 146 Silver perch 84 3.0 87 Summer flounder 71 2.5 118 Atlantic menhaden 45 1.6 59 Jellyfish 45 1.6 610 Hogchoker 27 0.9 1296.9355
Map 1. Map <strong>of</strong> Pamlico and Albemarle sounds North Carolina.356
Map 2. Map <strong>of</strong> Pamlico Sound North Carolina.357
Map 3 <strong>Shrimp</strong> areas closed by proclamation in Pamlico Sound.358
Management Option/Impacts+ potential positive impact <strong>of</strong> action- potential negative impact <strong>of</strong> action1. Status quo (potential to close and open when shrimp are <strong>of</strong> sufficient size)+ Flexibility in reacting to variable conditions (excessive rainfall, early migration)+ Access to resource by a variety <strong>of</strong> users- Does not minimize harvest <strong>of</strong> small shrimp and bycatch- Labor intensive and expensive to sample- Necessitates “grand openings”2. Harvest Season (Month (s), or Month (s)/Day (s) closures)a) Implement closure <strong>of</strong> Pamlico Sound with initial June proclamation and open inmid July (based on predetermined heads-on count).+ Eliminates grand openings (if coordinated with other areas)+ Protection <strong>of</strong> small shrimp and juvenile fish and crabs.+ Potential for larger shrimp when trawling is opened- Lose flexibility <strong>of</strong> management by proclamation- Loss <strong>of</strong> resource to RCGL and smaller commercial trawlersb) Implement split season for commercial and RCGL shrimpers (same as # 2 aboveexcept open to RCGL harvest 1 or 2 weeks prior to commercial opening)+ Protection <strong>of</strong> small shrimp and juvenile fish and crabs+ Allows access to resource by all users+ Potential for larger shrimp when trawling is opened- Lose flexibility <strong>of</strong> management by proclamationc) Open in July (based on predetermined heads-on count or pre determined date)and close to shrimp trawling in mid to late August+ Eliminates grand openings (if coordinated with other areas)+ Protection <strong>of</strong> small shrimp and juvenile fish and crabs+ Potential for larger shrimp when trawling is opened- Lose flexibility <strong>of</strong> management by proclamation- Loss <strong>of</strong> resource to RCGL and smaller commercial trawlers359
3. Area Closuresa) Prohibit all shrimp trawlers in Pamlico Sound+ Bycatch issue completely eliminated+ Potential for healthier shellfish/finfish stocks+ Decrease navigational and fixed vs. mobile gear conflicts in inside waters+ Allow for harvest <strong>of</strong> larger count shrimp once they migrate into Pamlico Sound- Loss <strong>of</strong> income to commercial fishermen and dealers- Loss <strong>of</strong> RCGL use <strong>of</strong> shrimp resourceb) Close portions <strong>of</strong> the river to shrimp trawl harvest.+ Decrease navigational and fixed vs. mobile gear conflicts in closed waters+ Allow for harvest <strong>of</strong> larger count shrimp once they migrate into Open areas- Loss <strong>of</strong> income to commercial fishermen and dealers- Loss <strong>of</strong> recreational use <strong>of</strong> shrimp resource4. Regulate Means and Methods (gear and vessel)a) Implement headrope size limit on shrimp trawlers working in Pamlico Sound+ Allows for all size classes <strong>of</strong> vessels to work+ Reduction in bycatch- Reduction in fishing power <strong>of</strong> larger vesselsb) Increase tailbag mesh size.+ Reduction in bycatch+ Catch larger size shrimp- Loss <strong>of</strong> smaller size shrimp- Insufficient data on different mesh sizes and shrimp loss and bycatch reductionc) Implement maximum vessel length restriction on shrimp trawlers working inPamlico Sound+ Decrease navigational and fixed vs. mobile gear conflicts in inside waters+ Reduction in bycatch- Loss <strong>of</strong> income to commercial fishermen and dealersAC and DMF Recommendation: Open on 26-30 heads-on count; July 5 opening for areas atthe mouths <strong>of</strong> the bays on the north side <strong>of</strong> the Sound.MFC Recommendation: Open on 31-35 heads-on count; July 5 opening for areas at themouths <strong>of</strong> the bays on the north side <strong>of</strong> the Sound.360
12.26 Appendix 26. SHRIMP MANAGEMENT IN ROANOKE SOUNDRoanoke Sound system extends from Oregon Inlet north to Albemarle Sound (Map 1).Trawling (shrimp and crab) is only allowed in the main portion <strong>of</strong> the sound. All feeder creeksand bays are classified as either Nursery Areas (Primary, Secondary, Special Secondary) or notrawl areas all <strong>of</strong> which are closed to trawling (Map 2). Overall this system is approximately21,168 acres in size. One hundred sixty seven acres are classified as Primary Nursery areas,168 acres as Secondary Nursery areas, and 468 acres as Special Secondary Nursery areas.The majority <strong>of</strong> the shrimp trawling in Roanoke Sound occurs in Roanoke channel. Othercommercial fisheries in Roanoke Sound include crab pot, crab trawl, gill net, pound netting, fykenet and long-haul.Roanoke Sound accounts for 0.11% <strong>of</strong> the total statewide shrimp production. Averageannual shrimp landings are 7,959 pounds, with an average dockside value <strong>of</strong> $16,514. Ninetyfivepercent <strong>of</strong> the shrimp landed from the Roanoke Sound are caught by shrimp trawls (1994 –2003 Trip ticket Data). Other gears with reported shrimp landings are crab pots (3.09%), peelerpots (1.45%), and crab trawls (0.02%).Roanoke Sound ranks 15 th in shrimp landings by shrimp trawls with average annuallandings <strong>of</strong> 7,597 pounds (Figure 1). The average dockside value <strong>of</strong> these landings is $15,770.In addition to shrimp, an average <strong>of</strong> 1,498 pounds <strong>of</strong> marketable bycatch with a dockside value<strong>of</strong> $1,472 is landed annually by shrimp trawls from Roanoke Sound. The landed bycatch iscomposed <strong>of</strong> blue crabs (92%; 1,364 pounds/year), and finfish (8%; 117 pounds/year).Flounder are the most common finfish species landed with average annual landings <strong>of</strong> 45pounds (Table 1), 89% <strong>of</strong> which are landed in July and August (Table 2).July accounts for 54% <strong>of</strong> the shrimp landings from shrimp trawls for Roanoke Sound(Tables 2 and 3). The months <strong>of</strong> August (32%), and September (9%) are the other two mainmonths <strong>of</strong> shrimp harvest from this system.The percent contribution <strong>of</strong> yearly shrimp trawl landings by various sized vessels is givenin Table 4. Seventy-two percent <strong>of</strong> the shrimp trawl landings were harvested by vessels 20 to39 feet in length (Table 4).Currently there are no bycatch estimates available from shrimp trawlers working inRoanoke Sound.361
8,000,000Pamlico Sound Total landings 36,378,4507,000,0006,000,0005,000,000Pounds4,000,0003,000,0002,000,0001,000,0000Pamlico SoundCore SoundNew RiverNewport RiverNeuse RiverNorth RiverTopstumpIWWCape fear RiverWhite Oak RiverBogue SoundWaterPamlico RiverIWW-BrunswickBay RiverCroatan SoundRoanoke SoundMasonboro SoundPungo RiverShallotte RiverLockwood FollyFigure 1.Total pounds <strong>of</strong> shrimp harvested by shrimp in major North Carolina waterbodiesbetween 1994-2003.362
Table 1.Landings (lbs) <strong>of</strong> finfish from shrimp trawls from the Roanoke Sound North Carolina;1994 – 2003.Pounds PercentSpecies total average <strong>of</strong> totalFlounders 448 45 38.14%Spot 387 39 32.95%Weakfish 97 10 8.26%Mullets 65 7 5.53%Fish, Mixed 48 5 4.09%Croaker 28 3 2.39%Harvestfish 28 3 2.38%Bait 18 2 1.53%Kingfish 15 2 1.31%Speckled trout 13 1 1.12%Spanish Mackerel 11 1 0.94%Pigfish 7 1 0.60%Black drum 6 1 0.51%Sheepshead 2 0 0.17%Butterfish 1 0 0.09%Total 1,174 117 100.00%363
Table 2. Monthly percent contribution <strong>of</strong> landed shrimp trawl catch for Roanoke Sound North Carolina; 1994 – 2003.MonthTotalSpecies March June July August September October November pounds<strong>Shrimp</strong> 0.10% 1.41% 53.67% 32.06% 9.24% 3.34% 0.18% 75,456Blue crab 0.00% 0.83% 21.07% 64.24% 9.01% 4.72% 0.13% 13,640Flounders 0.00% 0.22% 38.55% 50.45% 8.99% 1.79% 0.00% 448Spot 0.00% 0.00% 52.20% 20.93% 22.74% 4.13% 0.00% 387Weakfish 0.00% 0.00% 31.96% 43.30% 17.53% 7.22% 0.00% 97Mullets 0.00% 0.00% 0.00% 0.00% 0.00% 100.00% 0.00% 65Fish, mixed 0.00% 0.00% 0.00% 22.92% 77.08% 0.00% 0.00% 48Croaker 0.00% 0.00% 7.13% 39.19% 50.12% 3.56% 0.00% 28Harvestfish 0.00% 0.00% 7.14% 7.14% 53.57% 32.14% 0.00% 28Bait 0.00% 0.00% 100.00% 0.00% 0.00% 0.00% 0.00% 18Kingfish 0.00% 0.00% 6.52% 60.89% 26.08% 6.52% 0.00% 15Speckled trout 0.00% 0.00% 77.17% 0.00% 0.00% 22.83% 0.00% 13Spanish mackerel 0.00% 0.00% 0.00% 0.00% 45.45% 54.55% 0.00% 11Pigfish 0.00% 0.00% 0.00% 0.00% 100.00% 0.00% 0.00% 7Black drum 0.00% 0.00% 0.00% 0.00% 0.00% 100.00% 0.00% 6Sheepshead 0.00% 0.00% 100.00% 0.00% 0.00% 0.00% 0.00% 2Butterfish 0.00% 0.00% 0.00% 100.00% 0.00% 0.00% 0.00% 1Total 0.09% 1.30% 48.53% 36.93% 9.33% 3.64% 0.17% 90,270364
Table 3.Monthly shrimp landings (lbs) from shrimp trawls from Roanoke Sound NorthCarolina; 1994 – 2003.PercentPounds Percent <strong>of</strong> totalMonth total average <strong>of</strong> total tripsMarch 77 8 0.10% 0.08%June 1,062 106 1.41% 1.85%July 40,498 4,050 53.67% 45.84%August 24,189 2,419 32.06% 39.55%September 6,970 697 9.24% 9.49%October 2,521 252 3.34% 2.77%November 139 14 0.18% 0.42%Total 75,456 7,546Table 4.Percent contribution <strong>of</strong> three vessel size groups to yearly shrimp trawl landings inRoanoke Sound; 1994 – 2003.Vessel size rangeNumber <strong>of</strong>Year 40' Total licenses1994 33.33% 62.86% 3.81% 97.22% 511995 60.00% 40.00% 0.00% 71.43% 151996 30.00% 70.00% 0.00% 96.77% 351997 22.58% 72.58% 4.84% 93.94% 331998 20.00% 80.00% 0.00% 100.00% 41999 13.64% 81.82% 4.55% 100.00% 132000 12.73% 87.27% 0.00% 96.49% 212001 50.00% 0.00% 50.00% 100.00% 22002 17.31% 78.21% 4.49% 100.00% 532003 11.11% 88.89% 0.00% 100.00% 5Total 24.70% 72.13% 3.16% 95.65%365
RoanokeSoundMap 1. Map <strong>of</strong> Pamlico and Albemarle sounds North Carolina.366
Map 2. Map <strong>of</strong> Roanoke Sound North Carolina.367
Management Option/Impacts+ potential positive impact <strong>of</strong> action- potential negative impact <strong>of</strong> action1. Status quo (potential to close and open when shrimp are <strong>of</strong> sufficient size)+ Flexibility in reacting to variable conditions (excessive rainfall, early migration)+ Access to resource by a variety <strong>of</strong> users- Does not minimize harvest <strong>of</strong> small shrimp and bycatch- Labor intensive and expensive to sample- Necessitates “grand openings”2. Harvest Season (Month (s), or Month (s)/Day (s) closures)a) Implement closure <strong>of</strong> Roanoke Sound with initial June proclamation and open inmid July (based on predetermined heads-on count).+ Eliminates grand openings (if coordinated with other areas)+ Protection <strong>of</strong> small shrimp and juvenile fish and crabs.+ Potential for larger shrimp when trawling is opened- Lose flexibility <strong>of</strong> management by proclamation- Loss <strong>of</strong> resource to RCGL and smaller commercial trawlersb) Implement split season for commercial and RCGL shrimpers (same as # 2 aboveexcept open to RCGL harvest 1 or 2 weeks prior to commercial opening)+ Protection <strong>of</strong> small shrimp and juvenile fish and crabs+ Allows access to resource by all users+ Potential for larger shrimp when trawling is opened- Lose flexibility <strong>of</strong> management by proclamationc) Open in July (based on predetermined heads-on count or pre determined date)and close to shrimp trawling in mid to late August+ Eliminates grand openings (if coordinated with other areas)+ Protection <strong>of</strong> small shrimp and juvenile fish and crabs+ Potential for larger shrimp when trawling is opened- Lose flexibility <strong>of</strong> management by proclamation- Loss <strong>of</strong> resource to RCGL and smaller commercial trawlers368
3. Area Closuresa) Prohibit all shrimp trawlers in Roanoke Sound+ Bycatch issue completely eliminated+ Potential for healthier shellfish/finfish stocks+ Decrease navigational and fixed vs. mobile gear conflicts in inside waters+ Allow for harvest <strong>of</strong> larger count shrimp once they migrate into Roanoke Sound- Loss <strong>of</strong> income to commercial fishermen and dealers- Loss <strong>of</strong> RCGL use <strong>of</strong> shrimp resourceb) Close portions <strong>of</strong> the river to shrimp trawl harvest.+ Decrease navigational and fixed vs. mobile gear conflicts in closed waters+ Allow for harvest <strong>of</strong> larger count shrimp once they migrate into Open areas- Loss <strong>of</strong> income to commercial fishermen and dealers- Loss <strong>of</strong> recreational use <strong>of</strong> shrimp resource4. Regulate Means and Methods (gear and vessel)a) Implement headrope size limit on shrimp trawlers working in Roanoke Sound+ Allows for all size classes <strong>of</strong> vessels to work+ Reduction in bycatch- Reduction in fishing power <strong>of</strong> larger vesselsb) Increase tailbag mesh size.+ Reduction in bycatch+ Catch larger size shrimp- Loss <strong>of</strong> smaller size shrimp- Insufficient data on different mesh sizes and shrimp loss and bycatch reductionc) Implement maximum vessel length restriction on shrimp trawlers working inRoanoke Sound+ Decrease navigational and fixed vs. mobile gear conflicts in inside waters+ Reduction in bycatch- Loss <strong>of</strong> income to commercial fishermen and dealersAC, DMF, and MFC Recommendation: Status quo.369
12.27 Appendix 27. SHRIMP MANAGEMENT IN CROATAN SOUNDCroatan Sound is bound by Pamlico Sound to the south and Albemarle Sound to theNorth (Map 1). This system is approximately 26,272 acres in size. There are no nursery areasin Croatan Sound. One hundred and thirty five acres are classified as inland areas and areclosed to trawling (Map 2). The majority <strong>of</strong> the shrimp trawling in Croatan Sound occurs in deepholes and sloughs. Other commercial fisheries in Croatan Sound include crab pot, crab trawl,gill net, and pound netting,Croatan Sound accounts for 0.14% <strong>of</strong> the total statewide shrimp production. Averageannual shrimp landings are 9,605 pounds, with an average dockside value <strong>of</strong> $23,067. Ninetyeightpercent <strong>of</strong> the shrimp landed from the Croatan Sound are caught by shrimp trawls (1994 –2003 Trip ticket Data). Other gears with reported shrimp landings are crab pots (1.3%), andcrab trawls (0.1%).Croatan Sound ranks 14 th in shrimp landings by shrimp trawls with average annuallandings <strong>of</strong> 9,657 pounds (Figure 1). The average dockside value <strong>of</strong> these landings is $23,067.In addition to shrimp, an average <strong>of</strong> 3,222 pounds <strong>of</strong> marketable bycatch with a dockside value<strong>of</strong> $3,357 is landed annually by shrimp trawls from Croatan Sound. The landed bycatch iscomposed <strong>of</strong> blue crabs (92%; 2,973 pounds/year), and finfish (8%; 248 pounds/year). Spot arethe most common finfish species landed with average annual landings <strong>of</strong> 103 pounds (Table 1),88% <strong>of</strong> which are landed in July and August (Table 2).August accounts for 44% <strong>of</strong> the shrimp landings from shrimp trawls for Croatan Sound(Tables 2 and 3). The months <strong>of</strong> July (30%), September (12%), and October (13%) are theother three main months <strong>of</strong> shrimp harvest from this system.The percent contribution <strong>of</strong> yearly shrimp trawl landings by various sized vessels is givenin Table 4. Sixty percent <strong>of</strong> the shrimp trawl landings were harvested by vessels 20 to 39 feet inlength (Table 4).Currently there are no bycatch estimates available from shrimp trawlers working inCroatan Sound.370
8,000,000Pamlico Sound Total landings 36,378,4507,000,0006,000,0005,000,000Pounds4,000,0003,000,0002,000,0001,000,0000Pamlico SoundCore SoundNew RiverNewport RiverNeuse RiverNorth RiverTopstumpIWWCape fear RiverWhite Oak RiverBogue SoundPamlico RiverWaterIWW-BrunswickBay RiverCroatan SoundRoanoke SoundMasonboro SoundPungo RiverShallotte RiverLockwood FollyFigure 1.Total pounds <strong>of</strong> shrimp harvested by shrimp in major North Carolina waterbodiesbetween 1994-2003.371
Table 1.Landings (lbs) <strong>of</strong> finfish from shrimp trawls from the Croatan Sound North Carolina;1994 – 2003.PoundsPercentSpecies total average <strong>of</strong> totalSpot 1,027 103 41.37%Flounders 441 44 17.74%Weakfish 440 44 17.72%Fish, mixed 195 20 7.85%Croaker 108 11 4.35%Sheepshead 76 8 3.06%Harvestfish 58 6 2.34%Kingfish 47 5 1.89%Black drum 26 3 1.05%Butterfish 15 2 0.60%Mullets 15 2 0.60%Spanish mackerel 12 1 0.48%Bluefish 8 1 0.32%Pigfish 5 1 0.20%Bait 4 0 0.16%Spadefish 3 0 0.12%Speckled trout 2 0 0.08%Pompano 1 0 0.04%Total 2,483 248372
Table 2. Monthly percent contribution <strong>of</strong> landed shrimp trawl catch for Croatan Sound North Carolina; 1994 – 2003.MonthTotalSpecies February June July August September October November December pounds<strong>Shrimp</strong> 0.11% 0.24% 30.44% 44.18% 11.65% 13.11% 0.02% 0.27% 96,053Blue Crab 0.05% 0.01% 20.90% 67.64% 9.00% 2.40% 0.00% 0.00% 29,739Spot 0.00% 0.00% 21.13% 66.60% 9.64% 2.63% 0.00% 0.00% 1,027Flounders 0.00% 0.00% 20.32% 50.40% 24.29% 4.99% 0.00% 0.00% 441Weakfish 0.00% 0.00% 13.41% 51.36% 26.59% 8.64% 0.00% 0.00% 440Fish, Mixed 0.00% 0.00% 0.00% 97.44% 2.56% 0.00% 0.00% 0.00% 195Croaker 0.00% 0.00% 25.93% 54.63% 19.44% 0.00% 0.00% 0.00% 108Sheepshead 0.00% 0.00% 9.21% 71.05% 19.74% 0.00% 0.00% 0.00% 76Harvestfish 0.00% 0.00% 10.34% 29.31% 51.72% 8.62% 0.00% 0.00% 58Kingfish 0.00% 0.00% 6.38% 46.81% 42.55% 4.26% 0.00% 0.00% 47Black drum 0.00% 0.00% 92.31% 7.69% 0.00% 0.00% 0.00% 0.00% 26Butterfish 0.00% 0.00% 0.00% 100.00% 0.00% 0.00% 0.00% 0.00% 15Mullets 0.00% 0.00% 0.00% 13.33% 86.67% 0.00% 0.00% 0.00% 15Spanish Mackerel 0.00% 0.00% 8.33% 66.67% 25.00% 0.00% 0.00% 0.00% 12Bluefish 0.00% 0.00% 12.50% 87.50% 0.00% 0.00% 0.00% 0.00% 8Pigfish 0.00% 0.00% 0.00% 20.00% 20.00% 60.00% 0.00% 0.00% 5Bait 0.00% 0.00% 100.00% 0.00% 0.00% 0.00% 0.00% 0.00% 4Spadefish 0.00% 0.00% 66.67% 33.33% 0.00% 0.00% 0.00% 0.00% 3Speckled trout 0.00% 0.00% 0.00% 0.00% 100.00% 0.00% 0.00% 0.00% 2Pompano 0.00% 0.00% 0.00% 0.00% 100.00% 0.00% 0.00% 0.00% 1Total 0.10% 0.18% 27.98% 49.94% 11.15% 10.45% 0.01% 0.20% 128,274373
Table 3.Monthly shrimp landings (lbs) from shrimp trawls from Croatan Sound NorthCarolina; 1994 – 2003.PercentPounds Percent <strong>of</strong> totalMonth total average <strong>of</strong> total tripsFebruary 108 11 0.11% 0.11%June 232 23 0.24% 0.23%July 29,234 2,923 30.44% 25.04%August 42,432 4,243 44.18% 53.53%September 11,185 1,119 11.65% 16.12%October 12,591 1,259 13.11% 4.89%November 16 2 0.02% 0.04%December 255 26 0.27% 0.04%Total 96,053 9,605Table 4.Percent contribution <strong>of</strong> three vessel size groups to yearly shrimp trawl landings inCroatan Sound; 1994 – 2003.Vessel size rangeNumber <strong>of</strong>Year 40' Total licenses1994 26% 72% 2% 98% 231995 92% 6% 2% 89% 171996 19% 77% 5% 96% 191997 16% 70% 14% 97% 301998 20% 70% 10% 100% 61999 5% 67% 29% 100% 162000 29% 62% 10% 97% 542001 45% 27% 27% 100% 52002 19% 60% 21% 100% 182003 0% 80% 20% 100% 4Total 29% 60% 11% 97%374
CroatanSoundMap 1. Map <strong>of</strong> Pamlico and Albemarle sounds North Carolina.375
Map 2. Map <strong>of</strong> Croatan Sound North Carolina.376
Management Option/Impacts+ potential positive impact <strong>of</strong> action- potential negative impact <strong>of</strong> action1. Status quo (potential to close and open when shrimp are <strong>of</strong> sufficient size)+ Flexibility in reacting to variable conditions (excessive rainfall, early migration)+ Access to resource by a variety <strong>of</strong> users- Does not minimize harvest <strong>of</strong> small shrimp and bycatch- Labor intensive and expensive to sample- Necessitates “grand openings”2. Harvest Season (Month (s), or Month (s)/Day (s) closures)a) Implement closure <strong>of</strong> Croatan Sound with initial June proclamation and open inmid July (based on predetermined heads-on count).+ Eliminates grand openings (if coordinated with other areas)+ Protection <strong>of</strong> small shrimp and juvenile fish and crabs.+ Potential for larger shrimp when trawling is opened- Lose flexibility <strong>of</strong> management by proclamation- Loss <strong>of</strong> resource to RCGL and smaller commercial trawlersb) Implement split season for commercial and RCGL shrimpers (same as # 2 aboveexcept open to RCGL harvest 1 or 2 weeks prior to commercial opening)+ Protection <strong>of</strong> small shrimp and juvenile fish and crabs+ Allows access to resource by all users+ Potential for larger shrimp when trawling is opened- Lose flexibility <strong>of</strong> management by proclamationc) Open in July (based on predetermined heads-on count or pre determined date)and close to shrimp trawling in mid to late August+ Eliminates grand openings (if coordinated with other areas)+ Protection <strong>of</strong> small shrimp and juvenile fish and crabs+ Potential for larger shrimp when trawling is opened- Lose flexibility <strong>of</strong> management by proclamation- Loss <strong>of</strong> resource to RCGL and smaller commercial trawlers377
3. Area Closuresa) Prohibit all shrimp trawlers in Croatan Sound+ Bycatch issue completely eliminated+ Potential for healthier shellfish/finfish stocks+ Decrease navigational and fixed vs. mobile gear conflicts in inside waters+ Allow for harvest <strong>of</strong> larger count shrimp once they migrate into Croatan Sound- Loss <strong>of</strong> income to commercial fishermen and dealers- Loss <strong>of</strong> RCGL use <strong>of</strong> shrimp resourceb) Close portions <strong>of</strong> the river to shrimp trawl harvest.+ Decrease navigational and fixed vs. mobile gear conflicts in closed waters+ Allow for harvest <strong>of</strong> larger count shrimp once they migrate into Open areas- Loss <strong>of</strong> income to commercial fishermen and dealers- Loss <strong>of</strong> recreational use <strong>of</strong> shrimp resource4. Regulate Means and Methods (gear and vessel)a) Implement headrope size limit on shrimp trawlers working in Croatan Sound+ Allows for all size classes <strong>of</strong> vessels to work+ Reduction in bycatch- Reduction in fishing power <strong>of</strong> larger vesselsb) Increase tailbag mesh size.+ Reduction in bycatch+ Catch larger size shrimp- Loss <strong>of</strong> smaller size shrimp- Insufficient data on different mesh sizes and shrimp loss and bycatch reductionc) Implement maximum vessel length restriction on shrimp trawlers working inCroatan Sound+ Decrease navigational and fixed vs. mobile gear conflicts in inside waters+ Reduction in bycatch- Loss <strong>of</strong> income to commercial fishermen and dealersAC, DMF, and MFC Recommendation: Status quo.378
12.28 Appendix 28. PROPOSED RULES15A NCAC 03L .0103 is proposed for amendment as follows:15A NCAC 03L .0103 PROHIBITED NETS, AND NETS, MESH SIZES AND AREAS(a) It is unlawful to take shrimp with nets with mesh lengths less than the following:(1) Trawl net - one and one-half inches;(2) Fixed nets, channel nets, float nets, butterfly nets, and hand seines - one andone-fourth inches; and(3) Cast net - no restriction.(b) It is unlawful to take shrimp with a net constructed in such a manner as to contain an inneror outer liner <strong>of</strong> any mesh size. Net material used as chafing gear shall be no less than fourinches mesh length except that chafing gear with small smaller mesh may be used only on thebottom one-half <strong>of</strong> the tailbag. Such chafing gear shall not be tied in a manner that forms anadditional tailbag.(c) It is unlawful to take shrimp with trawls which have a combined headrope <strong>of</strong> greater than 90feet in internal coastal waters except:(1) Pamlico Sound;(2) Pamlico River downstream <strong>of</strong> a line from a point 35° 18.5882’N – 76° 28.9625’Wat Pamlico Point; running northerly to a point 35° 22.3741’N – 76° 28.6905’W atWillow Point;(3) Neuse River northeast <strong>of</strong> a line from a point 34° 58.2000’N – 76° 40.5167’W atWinthrop Point on the eastern shore <strong>of</strong> the entrance to Adam’s Creek runningnortherly to a point 35° 01.0744’ N – 76° 42.1550’ W at Windmill Point at theentrance <strong>of</strong> Greens Creek at Oriental.(d) It is unlawful to use a shrimp trawl in the areas described in 03R .0114.History Note: Authority G.S. 113-134; 113-182; 143B-289.52;Eff. January 1, 1991.15A NCAC 03O .0302 is proposed for amendment as follows:15A NCAC 03O .0302AUTHORIZED GEAR(a) The following are the only commercial fishing gear authorized (including restrictions) for useunder a valid Recreational Commercial Gear License:(1) One seine 30 feet or over in length but not greater than 100 feet with a meshlength less than 2 ½ inches when deployed or retrieved without the use <strong>of</strong> avessel or any other mechanical methods. A vessel may only be used to transportthe seine;(2) One shrimp trawl with a headrope not exceeding 26 feet in length per vessel.Mechanical methods for retrieving the trawl otter trawls are not authorized forrecreational purposes.(3) With or without a vessel, five eel, fish, shrimp, or crab pots in any combination,except only two pots <strong>of</strong> the five may be eel pots. Peeler pots are not authorizedfor recreational purposes;(4) One multiple hook or multiple bait trotline up to 100 feet in length;(5) Gill Nets:(A) Not more than 100 yards <strong>of</strong> gill nets with a mesh length equal to orgreater than2 ½ inches except as provided in (C) <strong>of</strong> this Subparagraph. Attendanceshall be required at all times;379
(B)(C)(D)Not more than 100 yards <strong>of</strong> gill nets with a mesh length equal to orgreater than 5 ½ inches except as provided in (C) <strong>of</strong> this Subparagraph.Attendance shall be required when used from one hour after sunrisethrough one hour before sunset in internal coastal fishing waters east andnorth <strong>of</strong> the Highway 58 Bridge at Emerald Isle and in the Atlantic Oceaneast and north <strong>of</strong> 77° 04.0000’ W. Attendance shall be required at alltimes in internal coastal fishing waters west and south <strong>of</strong> the Highway 58Bridge at Emerald Isle and in the Atlantic Ocean west and south <strong>of</strong> 77°04.0000’ W; andNot more than 100 yards <strong>of</strong> gill net may be used at any one time, exceptthat when two or more Recreational Commercial Gear License holdersare on board, a maximum <strong>of</strong> 200 yards may be used from a vessel;It is unlawful to possess aboard a vessel more than 100 yards <strong>of</strong> gill netswith a mesh length less than 5 ½ inches and more than 100 yards <strong>of</strong> gillnets with a mesh length equal to or greater than 5 ½ inches identified asrecreational commercial fishing equipment when only one RecreationalCommercial Gear License holder is on board. It is unlawful to possessaboard a vessel more than 200 yards <strong>of</strong> gill nets with a mesh length lessthan 5 ½ inches and more than 200 yards <strong>of</strong> gill nets with a mesh lengthequal to or greater than 5 ½ inches identified as recreational commercialfishing equipment when two or more Recreational Commercial GearLicense holders are on board; and(6) A hand-operated device generating pulsating electrical current for the taking <strong>of</strong>catfish in the area described in 15A NCAC 03J .0304.(7) Skimmer trawls not exceeding 26 feet in total combined width.(b) It is unlawful to use more than the quantity <strong>of</strong> authorized gear specified in Subparagraphs(a)(1) through (a)(6) <strong>of</strong> this Rule, regardless <strong>of</strong> the number <strong>of</strong> individuals aboard a vesselpossessing a valid Recreational Commercial Gear License.(c) It is unlawful for a person to violate the restrictions <strong>of</strong> or use gear other than that authorizedby Paragraph (a) <strong>of</strong> this Rule.(d) Unless otherwise provided, this Rule does not exempt Recreational Commercial GearLicense holders from the provisions <strong>of</strong> other applicable rules <strong>of</strong> the <strong>Marine</strong> <strong>Fisheries</strong>Commission or provisions <strong>of</strong> proclamations issued by the <strong>Fisheries</strong> Director as authorized bythe <strong>Marine</strong> <strong>Fisheries</strong> Commission.History Note: Filed as a Temporary Adoption Eff. August 9, 1994, for a period <strong>of</strong> 180 days oruntil the permanent rule becomes effective, whichever is sooner;Authority G.S. 113-134; 113-173;Eff. February 1, 1995;Temporary Amendment Eff. August 1, 1999; July 1, 1999;Amended Eff. August 1, 2000;Temporary Amendment Eff. August 1, 2000;Amended Eff. November 1, 2005; August 1, 2002.380
15A NCAC 03O .0303 is proposed for amendment as follows:15A NCAC 03O .0303 RECREATIONAL COMMERCIAL GEAR LICENSEPOSSESSION LIMITS(a) It is unlawful to possess more than a single recreational possession limit when only oneperson aboard a vessel possesses a valid Recreational Commercial Gear License andrecreational commercial fishing equipment as defined in 15A NCAC 3O .0302(a) is used,regardless <strong>of</strong> the number <strong>of</strong> persons on board.(b) It is unlawful to possess individual recreational possession limits in excess <strong>of</strong> the number <strong>of</strong>individuals aboard a vessel holding valid Recreational Commercial Gear Licenses. Licencesexcept as provided in Paragraph (f) <strong>of</strong> this Rule.(c) It is unlawful for any person who holds both a Recreational Commercial Gear License and aStandard or Retired Standard Commercial Fishing License and who is in possession <strong>of</strong>identified recreational commercial fishing equipment as defined in 15A NCAC 3O .0302(a), toexceed the single recreational possession limit.(d) It is unlawful for persons aboard a vessel collectively holding only one RecreationalCommercial Gear License and any Standard Commercial Fishing License or Retired StandardCommercial Fishing License and who are in possession <strong>of</strong> any identified recreationalcommercial fishing equipment as defined in 15A NCAC 3O .0302(a), to exceed one recreationalpossession limit.(e) It is unlawful to possess more than 48 quarts, heads on, or 30 quarts, heads <strong>of</strong>f, <strong>of</strong> shrimpwhen only one person aboard a vessel possesses a valid Recreational Commercial GearLicense and recreational commercial fishing equipment as defined in 15A NCAC 3O .0302(a) isused.(f) It is unlawful to possess more than 96 quarts, heads on or 60 quarts, heads <strong>of</strong>f, <strong>of</strong> shrimp ifmore than one person aboard a vessel possesses a valid Recreational Commercial GearLicense and recreational commercial fishing equipment as defined in 15A NCAC 3O .0302(a) isused.History Note: Filed as a Temporary Adoption Eff. August 9, 1994, for a period <strong>of</strong> 180 days oruntil the permanent rule becomes effective, whichever is sooner;Authority G.S. 113-134; 113-170.4; 113-173; 143B-289.52;Eff. February 1, 1995;Temporary Amendment Eff. June 7, 1998;Amended Eff. April 1, 1999;Temporary Amendment Eff. July 1, 1999;Amended Eff. August 1, 2000.15A NCAC 03R .0106 is proposed for amendment as follows:15A NCAC 03R .0106 TRAWL NETS PROHIBITEDThe trawl net prohibited areas referenced in 15A NCAC 03J .0104 (b)(4) are delineated in thefollowing coastal water areas:(1) In Pamlico, Sound Core and Back sounds - within the area described by a linebeginning at a point 35° 43.7457' N - 75° 30.7014' W on the south shore <strong>of</strong>Eagles Nest Bay on Pea Island; running westerly to a point 35° 42.9500' N - 75°34.1500' W; running southerly to a point 35° 39.3500' N – 75° 34.4000' W;running southeasterly to a point 35° 35.8931' N - 75° 31.1514' W inChicamacomico Channel near Beacon "ICC"; running southerly to a point 35°28.5610' N - 75° 31.5825' W on Gull Island; running southwesterly to a point 35°381
22.8671' N - 75° 33.5851' W in Avon Channel near Beacon "1"; runningsouthwesterly to a point 35° 18.9603' N - 75° 36.0817' W in Cape Channel nearBeacon "2"; running westerly to a point 35° 16.7588' N - 75° 44.2554' W inRollinson Channel near Beacon "42RC"; running southwesterly to a point 35°14.0337' N - 75° 45.9643' W southwest <strong>of</strong> Oliver Reef near the quick-flashingbeacon; running westerly to a point 35° 09.3650' N – 76° 00.6377' W in Big FootSlough Channel near Beacon "14BF"; running southwesterly to a point 35°08.4523' N – 76° 02.6651'W in Nine Foot Shoal Channel near Beacon "9";running westerly to a point 35° 07.1000' N – 76° 06.9000' W; runningsouthwesterly to a point 35° 01.4985' N – 76° 11.4353' W near Beacon "HL";running southwesterly to a point 35° 00.2728' N - 76° 12.1903' W near Beacon"2CS"; running southerly to a point 34° 59.5027' N – 76° 12.3204' W inWainwright Channel immediately east <strong>of</strong> the northern tip <strong>of</strong> Wainwright Island;running easterly to a point 34° 58.8333' N – 76° 09.2167' W on Core Banks;running northerly along the shoreline and across the inlets following theCOLREGS Demarcation lines to the point <strong>of</strong> beginning; 34° 58.6760’N – 76°12.4164’W; running southerly to a point 34°56.6697’N – 76° 13.6052’W nearMarker “15”; running southwesterly to a point 34° 54.1584’N – 76° 16.9016’W;running southwesterly to a point 34° 52.1484’N – 76° 19.2607’W; runningsouthwesterly to a point 34° 51.0617’N – 76° 21.0449’W; running southwesterlyto a point 34° 48.3137' N - 76° 24.3717' W; running southwesterly to a point 34°46.3739' N – 76° 26.1526' W; running southwesterly to a point 34° 44.5795' N –76° 27.5136' W; running southwesterly to a point 34° 43.4895' N – 76° 28.9411'W near Beacon "37A"; running southwesterly to a point 34° 40.4500' N – 76°30.6833' W; running westerly to a point 34° 40.7061' N – 76° 31.5893' W nearBeacon "35" in Back Sound; running westerly to a point 34° 41.3178' N - 76°33.8092' W near Buoy "3"; running southwesterly to a point 34° 39.6601' N – 76°34.4078' W on Shackleford Banks; running easterly and northeasterly along theshoreline and across Barden Inlet following the COLREGS Demarcation line;then running northerly along the shoreline across the inlets following theCOLREGS Demarcation line up the Outer Banks to Eagles Nest Bay at the point<strong>of</strong> beginning.(2) In Northern Pamlico Sound, Stumpy Point Bay - north <strong>of</strong> a line beginning at apoint 35° 40.9719' N - 75° 44.4213' W on Drain Point; running westerly to a point35° 40.6550' N - 75° 45.6869' W on Kazer Point;(3) In the Pamlico River area, lower Goose Creek - south <strong>of</strong> a line beginning at apoint 35° 18.2676' N - 76° 37.4706' W on the north shore <strong>of</strong> Snode Creek;running easterly to a point 35° 18.1660' N - 76° 36.9095' W on Store Point;(4) In the Bay River Area:(a) In Dump Creek - north <strong>of</strong> a line beginning at a point 35° 11.6666' N - 76°33.4207' W on the west shore; running southeasterly to a point 35°11.3926' N - 76° 32.8993' W on the east shore;(b) In Rockhole Bay - north <strong>of</strong> a line beginning at a point 35° 11.3926' N - 76°32.8993' W on the west shore; running southeasterly to a point 35°11.1321' N - 76° 32.1360' W on the east shore;(c) In Vandemere Creek - north <strong>of</strong> a line beginning at a point 35° 11.2681' N -76° 39.5220' W on the west shore; running southerly to a point 35°11.0879' N - 76° 39.3200' W on the east shore;(d) In Cedar Creek - west <strong>of</strong> a line beginning at a point 35° 11.2681' N - 76°39.5220' W on the north shore; running southwesterly to a point 35°11.1033' N - 76° 39.7321' W on the south shore <strong>of</strong> an unnamed tributary;382
(e) In Chapel Creek - north <strong>of</strong> a line beginning at a point 35° 08.6768' N - 76°42.7985' W on the west shore; running easterly to a point 35° 08.7677' N- 76° 42.3604' W on the east shore;(f) In Upper Bay River - west <strong>of</strong> a line beginning at a point 35° 08.6704' N -76° 43.0836' W on the north shore; running southwesterly to a point 35°08.4590' N - 76° 43.1930' W on the south shore;(5) In the Neuse River Area, Pierce Creek - west <strong>of</strong> a line beginning at a point 35°02.4336' N - 76° 39.7653' W on the north shore; running southerly to a point 35°02.3767' N - 76° 39.7876' W on the south shore.(6) In Core and Back sounds beginning at a point 34° 50.4333' N – 76° 20.2000' Won Core Banks near Drum Inlet; running northwesterly to a point 34° 51.0617' N– 76° 21.0449' W; running southwesterly to a point 34° 48.3137' N - 76° 24.3717'W; running southwesterly to a point 34° 46.3739' N – 76° 26.1526' W; runningsouthwesterly to a point 34° 44.5795' N – 76° 27.5136' W; running southwesterlyto a point 34° 43.4895' N – 76° 28.9411' W near Beacon "37A"; runningsouthwesterly to a point 34° 40.4500' N – 76° 30.6833' W; running westerly to apoint 34° 40.7061' N – 76° 31.5893' W near Beacon "35" in Back Sound; runningwesterly to a point 34° 41.3178' N - 76° 33.8092' W near Buoy "3"; runningsouthwesterly to a point 34° 39.6601' N – 76° 34.4078' W on Shackleford Banks;running easterly and northeasterly along the shoreline and across Barden Inletfollowing the COLREGS Demarcation line to the point <strong>of</strong> beginning.(7)(6) In Cape Lookout Bight, all <strong>of</strong> Cape Lookout Bight - southwest <strong>of</strong> the COLREGSDemarcation line at Barden Inlet to the northeastern most point <strong>of</strong> PowerSquadron Spit; running northeasterly to a point 34° 38.6150' N – 76° 32.7434' Won Shackleford Banks.(7) Newport River - all waters upstream <strong>of</strong> a line beginning at a point 34° 45.6960’N– 76° 43.5180’ W near Penn Point; running northeasterly to a point 34° 46.5733’N – 76° 42.6350’ W at Hardesty Farms subdivision.(8) White Oak River - all waters upstream <strong>of</strong> a line beginning at a point on the westside <strong>of</strong> the river 34° 43.3425’ N – 77° 07.2209’ W; running northerly to a point 34°43.6445’N – 77° 07.3177’ W in the river above Cahoon’s Slough; runningeasterly to a point 34° 43.5588’ N – 77° 06.6206’ W at Hancock Point.(9) Intracoastal Waterway - all waters in the maintained channel from a point nearMarker #105 34° 18.8167’ N – 77° 42.8833’ W running southerly to a point at theWrightsville Beach Drawbridge 34° 12.9500’ N – 77° 47.9833’ W.(10) Cape Fear River - all waters bounded by a line beginning at a point near FortFisher 33° 57.5333’ N – 77° 56.9333’ W running southwesterly along The Rocksto a point 33° 55.1833’ N – 77° 58.0833’ W running southeasterly and southerlyalong the shorelines <strong>of</strong> Second and Buzzard’s Bays to a point 33° 53.0333’ N –57.9333’ W running northeastly and northwestly along the barrier islandshorelines <strong>of</strong> Buzzard’s Bay, Second Bay and The Basin back to the point <strong>of</strong>origin.(11) Cape Creek - all waters upstream <strong>of</strong> a line beginning at a point on the northshore 33° 53.6167’ N – 77° 59.3333’ W running southwesterly to a point on thesouth shore 33° 53.3667’ N – 77° 59.4667’ W.(12) Bald Head Creek - all waters upstream <strong>of</strong> a line beginning at a point on the westshore 33° 52.8667’ N – 77° 59.8000’ W running easterly to a point on the eastshore 33° 52.8667’ N – 77° 59.7167’ W.History Note: Authority G.S. 113-134; 113-182; 143B-289.52;Eff. January 1, 1991;383
Amended Eff. March 1, 1994;Recodified from 15A NCAC 3R .0006 Eff. December 17, 1996;Amended Eff. August 1, 2004; April 1, 1997.15A NCAC 03R .0114 is proposed for adoption as follows:15A NCAC 03R .0114 SHRIMP TRAWL PROHIBITED AREASThe shrimp trawl prohibited areas referenced in 15A NCAC 03L .0103(d) are delineated in thefollowing coastal water areas:(1) Pungo River- all waters upstream <strong>of</strong> a line from a point 35° 23.3166’N – 76°34.4833’W at Wades Point; running westerly to a point 35° 23.6463’N – 76°31.0003’W on the north shore <strong>of</strong> the entrance to Abels Bay.(2) Pamlico River- all waters upstream <strong>of</strong> a line from a point 35° 20.5108’N – 76°37.7218’W on the western shore <strong>of</strong> the entrance to Goose Creek; runningnortheasterly to a point 35° 23.3166’N – 76° 34.4833’W at Wades Point.(3) Neuse River- all waters upstream <strong>of</strong> a line from a point 34° 56.3658’N – 76°48.7110’W at Cherry Point; running northerly to a point 34° 57.9116’N – 76°48.2240’W at Wilkerson Point.History Note: Authority G.S. 113-134; 113-182; 143B-289.52;384