2010 Proceedings - ElasticityConference.org
2010 Proceedings - ElasticityConference.org
2010 Proceedings - ElasticityConference.org

You also want an ePaper? Increase the reach of your titles
YUMPU automatically turns print PDFs into web optimized ePapers that Google loves.
<strong>2010</strong> SPONSORSThe Conference Organizers wish to express appreciationto the following companiesfor providing support of this year’s Conference:Ultrasonix Medical Corporationfor sponsoringthe Awards for Best Student Oral PresentationMedison Corporation, Koreafor sponsoringPrinting of the Conference <strong>Proceedings</strong> Books2
Page No.5:04P – 5:06P014 ULTRASOUND ELASTOGRAPHY AS AN ADJUVANT TO CONVENTIONAL ULTRASOUND IN 36THE PRE–OPERATIVE DIAGNOSIS OF MALIGNANT AXILLARY LYMPH NODES IN PATIENTSWITH SUSPECTED BREAST CANCER: A PILOT STUDY.K Taylor 1 , S O’Keeffe 1 , MG Wallis 1 , RJ Housden 2 , GM Treece 2 .1 Addenbrookes Hospital, Cambridge, England, UK; 2 University of Cambridge, Cambridge, England, UK.5:06P – 5:08P025 CHARACTERIZATION OF STRAIN ELASTOGRAMS DURING LARGE TISSUE DEFORMATIONS. 37H Marie 1 , S Vadde 1 , S Gadapa 1 , H Kukatla 1 , Yong Zhang 1 , JR Sullins 1 .1 Youngstown State University, Meshell Hall, One University Plaza, Youngstown, OH, 44555, USA.5:08P – 5:10P027 STRAIN MAPPING BY IMAGE CORRELATION FOR X–RAY ELASTOGRAPHY. 38BH Han 1 , MH Cho 1 , SY Lee 1 .1 Kyung Hee University, Yongin, Kyungki, SOUTH KOREA.5:10P – 5:12P051 NANO–SCALE SHEAR WAVE MEASUREMENTS USING OPTICAL COHERENCE 39TOMOGRAPHY (OCT).A Grimwood 1 , JC Bamber 2 , J Holmes 3 , P Tomlins 4 , Q Pankhurst 1 .1 Royal Institution of Great Britain, London, England, UK; 2 Institute of Cancer Research, Sutton,Surrey, England, UK; 3 Michelson Diagnostics Ltd., Orpington, Kent, England, UK; 4 NationalPhysical Laboratory, Teddington, Middx, England, UK.5:12P – 5:14P054 IN VIVO EVALUATION OF FREEHAND STRAIN IMAGING ON BENIGN AND MALIGNANT 40BREAST LESIONS.E Brusseau 1 , V Detti 1 , A Coulon 2 , E Maissiat 2 , N Boublay 3 , Y Berthezène 2 , J Fromageau 4 , N Bush 4 ,JC Bamber 4 .1 CREATIS–LRMN, Université Lyon, Villeurbanne, FRANCE; 2 Hôpital de la Croix–Rousse, Lyon,FRANCE; 3 Pôle Imagerie/IMER, Bron, FRANCE; 4 Institute of Cancer Research, Sutton, Surrey,England, UK.5:14P – 5:16P057 IMAGING OF CARDIOVASCULAR WALL–FLOW COUPLING IN VIVO. 41J Luo 1 , EE Konofagou 1 .1 Columbia University, New York, NY, USA.5:16P – 5:18P059 ARF–DRIVEN ASSESSMENT OF IN VIVO MYOCARDIAL CYCLIC STIFFNESS VARIATION. 42R Bouchard 1 , SJ Hsu 1 , ML Palmeri 1 , NC Rouze 1 , GE Trahey 1 . Presented by D Bradway 1 .1 Duke University, Durham, NC, USA.5:18P – 5:20P092 BREAST CANCER DIAGNOSIS USING NONLINEAR ELASTICITY IMAGING: SOME INITIAL RESULTS. 43S Goenezen 1 , Z Sink 1 , AA Oberai 1 , JF Dord 1 , PE Barbone 2 , TJ Hall 3 , J Jiang 3 .1 Rensselaer Polytechnic Institute, Troy, NY, USA; 2 Boston University, Boston, MA, USA; 3 Universityof Wisconsin–Madison, Madison, WI, USA.5:20P – 5:22P100 LATERAL MOTION COMPENSATION IN ULTRASOUND STRAIN IMAGING. 44MK Jeong 1 , SJ Kwon 1 , MK Park 1 , MH Bae 2 , SS Park 3 .1 Daejin University, Pocheon, Gyeonggi, KOREA; 2 Hallym University, Chuncheon, Gangweon,KOREA; 3 Medison Research Institute, Seoul, KOREA.(Session POS continues on next page)indicates Presenter7
(Session POS continued from previous page)5:22P – 5:24P103 TISSUE MICRO–MOTION IN HUMAN ERECTOR SPINAE AND QUADRICEPS MUSCLESOBSERVED IN VIVO USING ULTRASOUND ELASTOGRAPHY TECHNIQUES.JR Fox 1 , HM Langevin 1 , C Koptuich 1 .1 University of Vermont, Burlington, VT, USA.Page No.455:24P – 5:26P107 REAL–TIME GRAPHICS PROCESSING UNIT BASED ULTRASOUND ELASTOGRAPHY. 46NP Deshmukh 1 , H Rivaz 1 , PJ Stolka 1 , H Kang 1 , GD Hager 1 , ME Alaf 2 , EM Boctor 1,3 .1 Johns Hopkins University, Baltimore, MD, USA; 2 Johns Hopkins Medical Institutions, Baltimore,MD, USA; 3 Johns Hopkins Medicine, Baltimore, MD, USA.5:26P – 6:00P DiscussionSaturday 6:00P – 8:00POpening Dinner Reception <strong>Proceedings</strong> Book SigningBallroom II & IIISunday, October 17 7:00A – 10:30P7:00A – 8:00AGROUP BREAKFASTGolden Cliff/Eagles Nest7:00A – 5:30PRegistration Desk OpenBallroom Foyer8:00A – 5:30P Session POS: Posters Ballroom IIISession EEX: Equipment ExhibitBallroom IIISunday 7:45A – 8:00AOPENING REMARKSKJ Parker, J OphirBallroom ISunday 8:00A – 10:00ASession MIP–1: Methods for Imaging Elastic Tissue Properties – IChair: JL Gennisson, France Co-Chair: H Eskandari, Canada Ballroom IPage No.8:00A – 8:15A035 SHEAR WAVE ELASTOGRAPHY OF THE KIDNEY: PRE–CLINICAL STUDY ON A KIDNEYFIBROSIS MODEL AND CLINICAL FEASABILITY STUDY ON 70 HUMAN RENAL TRANSPLANTS.JL Gennisson 1 , N Grenier 3 , R Hubrecht 3 , L Couzy 3 , Y Delmas 3 , M Derieppe 1 , S Lepreux 3 , A Criton 2 ,J Bercoff 2 , M Tanter 1 .1 Institut Langevin–Ondes et Images, ESPCI ParisTech, Paris, FRANCE; 2 Supersonic Imagine,Aix en Provence, FRANCE; 3 Service de Néphrologie, Hôpital Pellegrin, Bordeaux, FRANCE.478:15A – 8:30A004 IMAGING TISSUE MECHANICAL PROPERTIES BY TRACKING HIGH AMPLITUDE SHEARWAVES GENERATED VIA TRANSIENT NEEDLE PERTURBATION.RJ DeWall 1 , T Varghese 1 , EL Madsen 1 .1 University of Wisconsin–Madison, Madison, WI, USA.488:30A – 8:45A007 A NEW METHOD FOR THE ACQUISITION OF STRAIN IMAGE VOLUMES. 49RJ Housden 1 , C Uff 2 , L Chen 1 , AH Gee 1 , GM Treece 1 , RW Prager 1 , JC Bamber 2 .1 University of Cambridge, Cambridge, England, UK; 2 Institute of Cancer Research, Sutton, Surrey,England, UK.8indicates Presenter
Page No.8:45A – 9:00A008 ELASTICITY IMAGING USING HARMONIC EXCITATION, ULTRAFAST IMAGING AND PLANAR 50INVERSION OF THE WAVE EQUATION.R Zahiri Azar 1,2 , K Dickie 1 , C Chung 1 , A Baghani 2 , SE Sacludean 2 , L Pelissier 1 .1 Ultrasonix Medical Corporation, Richmond, BC, CANADA; 2 University of British Columbia,Vancouver, BC, CANADA.9:00A – 9:15A029 IN–VIVO EVALUATION OF UTERINE ABNORMALITIES BASED ON ULTRASOUND SALINEINFUSED SONOHYSTEROGRAPHY STRAIN IMAGING.EA Omari 1 , T Varghese 1 , MA Kliewer 1 .1 University of Wisconsin–Madison, Madison, WI, USA.519:15A – 9:30A032 ON THE PROPAGATION OF GUIDED ELASTIC WAVES IN THIN PLATES FOR QUANTITATIVE 52SHEAR WAVE ELASTOGRAPHY OF THE CORNEA AND THE SKIN.TM Nguyen 1 , JL Gennisson 1 , D Touboul 3 , P Humbert 4 , J Bercoff 2 , M Fink 1 , M Tanter 1 .1 Institut Langevin Ondes et Images, ESPCI ParisTech, Paris, FRANCE; 2 SuperSonic Imagine, Aix enProvence, FRANCE; 3 Centre Hospitalo–Universitaire de Bordeaux, Bordeaux, FRANCE; 4 CentreHospitalo–Universitaire de Besançon, Besançon, FRANCE.9:30A – 9:45A039 A CORRELATION TOMOGRAPHY OF COMPLEX SHEAR WAVE FIELD IN SOFT SOLIDS. 53S Catheline 1 , T Gallot 1 , P Roux 1 , J Brum 1 , C Negreira 2 .1 Grenoble University & CNRS, LGIT, Grenoble, FRANCE; 2 Science University, LAU, Montevideo,URUGUAY.9:45A – 10:00A036 IN–VIVO TIME REVERSAL ELASTOGRAPHY: A PASSIVE CORRELATION TOMOGRAPHY. 54T Gallot 1 , S Catheline 1 , P Roux 1 , J Brum 1 , C Negreira 2 .1 Grenoble University & CNRS, LGIT, Grenoble, FRANCE; 2 Science University, LAU, Montevideo,URUGUAY.10:00A – 10:30ACOFFEE BREAKBallroom IIISunday 10:30A – 12:00PSession CAA–1: Clinical and Animal Applications – IChair: D Cosgrove, UK Co-Chair: H Langevin, USA Ballroom IPage No.10:30A – 10:45A062 PRELIMINARY ASSESSMENT OF SHEARWAVE TM ELASTOGRAPHY FEATURES IN 55PREDICTING BREAST LESION MALIGNANCY.D Cosgrove 1 , C Doré 2 , R Hooley 3 , E Mendelson 4 , L Barke 5 , A Cossi 6 , B Cavanaugh 7 , L Larsen 8 .1 Imperial College, Hammersmith Hospital, London, England, UK; 2 London, England, UK; 3 YaleMedical Center, Yale, CT, USA; 4 Northwestern Medical Center, Chicago, IL, USA; 5 Sally Jobe BreastCenter, Denver, CO, USA, ; 6 Boston Medical Center, Boston, MA, USA; 7 Thomas Jefferson University,Philadelphia, PA; USA, 8 University of Southern California, Los Angeles, CA, USA.10:45A – 11:00A009 AXIAL SHEAR STRAIN FEATURE FOR DIFFERENTIATING BREAST LESIONS. 56H Xu 1 , M Rao 1 , T Varghese 1 , S Baker 1 , AM Sommer 1 , TJ Hall 1 , GA Sisney 1 , ES Burnside 1 .1 University of Wisconsin–Madison, Madison, WI, USA.(Session CAA–1 continues on next page)indicates Presenter9
(Session CAA–1 continued from previous page)Page No.11:00A – 11:15A018 ARFI IMAGING OF HUMAN PROSTATE IN VIVO: INITIAL FINDINGS FROM 20 PATIENTS. 57L Zhai 1 , S Rosenzweig 1 , T Polascik 2 , W Foo 2 , V Mouraviev 2 , J Madden 2 , ML Palmeri 1 , KR Nightingale 1 .1 Duke University; Durham, NC, USA; 2 Duke University Medical Center, Durham, NC, USA.11:15A – 11:30A074 ELECTRODE DISPLACEMENT BASED STRAIN IMAGING FOR MONITORING IN–VIVOOPEN–SURGERY THERMAL ABLATION THERAPIES.N Rubert 1 , S Bharat 1 , R J Dewall 1 , A Andreano 1 , C Brace 1 , J Jiang 1 , L Sampson 1 , T Varghese 1 .1 University of Wisconsin–Madison, Madison, WI, USA.5811:30A – 11:45A028 STRAIN RATIO IN REAL TIME SONOELASTOGRAPHY OF THE PROSTATE AS A 59SEMI–QUANTITATIVE MEASUREMENT TOOL: IMPACT ON PROSTATE CANCER DETECTION.D Junker 1 , F Aigner 1 , T De Zordo 1 , F Pedross 1 , G Schaefer 1 , G Mikuz 1 , W Horninger 1 , W Jaschke 1 ,F Frauscher 1 . Presented by A Lebovici 1 .1 Medical University Innsbruck, Innsbruck, AUSTRIA.11:45A – 12:00P104 THORACOLUMBAR FASCIA SHEAR PLANE MOTION IN CHRONIC LOW BACK PAIN. 60HM Langevin 1 , JR Fox 1 , C Koptiuch 1 , NA Bouffard 1 .1 University of Vermont, Burlington, VT, USA.12:00P – 1:30PGROUP LUNCHGolden Cliff/Eagles NestSunday 1:30P – 3:15PSession MPT–1: Mechanical Properties of Tissues – IChair: GE Trahey, USA Co-Chair: CR Hazard, USA Ballroom IPage No.1:30P – 1:45P024 A FEASIBILITY STUDY OF CALIBRATING OPTICAL STRAIN ELASTOGRAMS WITH 61BIOMECHANICAL TESTING.H Marie 1 , S Vadde 1 , H Kukatla 1 , S Gadapa 1 , Yong Zhang 1 , JR Sullins 1 .1 Youngstown State University, Youngstown, OH, USA.1:45P – 2:00P005 QUANTIFYING STORAGE MODULUS OF HUMAN HEPATIC CANCERS WITH EX VIVODYNAMIC COMPRESSION TESTING.RJ DeWall 1 , S Bharat 1 , T Varghese 1 , ME Hanson 1 , MA Kliewer 1 .1 University of Wisconsin–Madison, Madison, WI, USA.2:00P – 2:15P030 QUANTIFICATION OF THE VISCOELASTIC CHARACTERISTICS OF THE UTERUS ANDASSOCIATED PATHOLOGIES.EA Omari 1 , MZ Kiss 1 , T Varghese 1 , MA Kliewer 1 , JM Harter 1 , EM Hartenbach 1 .1 University of Wisconsin–Madison, Madison, WI, USA.2:15P – 2:30P034 NONLINEAR SHEAR MODULUS QUANTIFICATION BY COMBINING STATIC AND DYNAMICELASTOGRAPHY.H Latorre–Ossa 1 , JL Gennisson 1 , E De Brosses 1 , M Tanter 1 .1 Institut Langevin–Ondes et Images, ESPCI Paris Tech, Paris, FRANCE.6263642:30P – 2:45P075 ULTRASOUND ELASTICITY IMAGING OF HUMAN POSTERIOR TIBIAL TENDON. 65L Gao 1 , C Geffre 1 , J Szivek 1 , MS Taljanovic 1 , LD Latt 1 , RS Witte 1 .1 University of Arizona, Tucson, AZ, USA.10indicates Presenter
Page No.2:45P – 3:00P096 FREQUENCY DEPENDENCE IN PHASE WAVE SPEEDS RECOVERED FROM INTERFERENCE 66PATTERNS MADE WITH ARC DATA.A Thomas 1 , K Lin 1 , JR McLaughlin 1 , CR Hazard 2 , K Thomenius 2 , Z Hah 3 , KJ Parker 3 , DJ Rubens 4 .1 Rensselaer Polytechnic Institute, Troy, NY, USA; 2 GE Global Research, Niskayuna, NY, USA; 3 Universityof Rochester, Rochester, NY, USA; 4 University of Rochester Medical Center, Rochester, NY, USA.3:00P – 3:15P097 NEW COMBINATION OF ARC DATA: IMAGING SHEAR MODULI AND MATCHING PHANTOM 67RECOVERY FREQUENCY DEPENDENCE TO VISCOELASTIC MODELS.K Lin 1 , A Thomas 1 , JR McLaughlin 1 , CR Hazard 2 , K Thomenius 2 , Z Hah 3 , KJ Parker 3 , DJ Rubens 4 .1 Rensselaer Polytechnic Institute, Troy, NY, USA; 2 GE Global Research, Niskayuna, NY, USA; 3 Universityof Rochester, Rochester, NY, USA; 4 University of Rochester Medical Center, Rochester, NY, USA.3:15P – 3:45PCOFFEE BREAKBallroom IIISunday 3:45P – 5:30PSession SIP–1: Signal and Image Processing – IChair: S Catheline, France Co-Chair: R Zahiri Azar, Canada Ballroom IPage No.3:45P – 4:00P006 A NORMALIZATION ALGORITHM FOR AXIAL–SHEAR STRAIN ELASTOGRAPHY. 68L Chen 1 , RJ Housden 1 , GM Treece 1 , AH Gee 1 , RW Prager 1 .1 University of Cambridge, Cambridge, England, UK.4:00P – 4:15P089 LOCAL INVERSION OF THE WAVE EQUATION FOR ELASTICITY IMAGING USING FIR FILTERS. 69A Baghani 1 , R Zahiri Azar 1 , SE Salcudean 1 , R Rohling 1 .1 University of British Columbia, Vancouver, BC, CANADA.4:15P – 4:30P033 INVERSE PROBLEMS IN DYNAMIC ELASTOGRAPHY: THEORETICAL, EXPERIMENTAL ANDNUMERICAL ANALYSIS.T Deffieux 1 , JL Gennisson 1 , B Larrat 1 , M Fink 1 , M Tanter 1 .1 Institut Langevin–Ondes et Images, ESPCI Paris Tech, Paris, FRANCE.704:30P – 4:45P042 INCREASE IN SPATIAL RESOLUTION OF LATERAL MODULATION IMAGING. 71C Sumi 1 , K Shimizu 1 , Y Takanashi 1 .1 Sophia University, Chiyodaku, Tokyo, JAPAN.4:45P – 5:00P091 BANDPASS SAMPLING OF HIGH FREQUENCY TISSUE MOTION. 72H Eskandari 1 , O Goksel 1 , SE Salcudean 1 , R Rohling 1 .1 University of British Columbia, Vancouver, BC, CANADA.5:00P – 5:15P049 A FAST GPU BASED 3D ULTRASOUND DEFORMATION SIMULATION FOR BENCHMARKINGMOTION TRACKING ALGORITHMS.TG Fisher 1 , TJ Hall 1 .1 University of Wisconsin–Madison, Madison, WI, USA.735:15P – 5:30P061 A COUPLED SPECKLE TRACKING ALGORITHM FOR ELASTICITY IMAGING: INITIAL IN VIVOEXPERIENCE.J Jiang 1 , TJ Hall 1 .1 University of Wisconsin–Madison, Madison, WI, USA.74indicates Presenter11
Sunday 5:30P – 6:30PGroup Photo6:30P – 7:30P No Conference ActivitiesTBASunday 7:30P – 10:30PConference Dinner & Musical EventBallroom I<strong>Proceedings</strong> Book SigningAnnouncement of Student Best Paper Award RecipientsMusical Event:Selections performed by Rich Wyman, Pianist, Singer, SongwriterMonday, October 18 7:00A – 5:30P7:00A – 8:00AGROUP BREAKFASTGolden Cliff/Eagles Nest7:00A – 5:30PRegistration Desk OpenBallroom Foyer8:00A – 5:30P Session POS: Posters Ballroom IIISession EEX: Equipment ExhibitBallroom IIIMonday 8:00A – 10:00ASession CVE: Cardiovascular ElasticityChair: CL de Korte, The Netherlands Co-Chair: EE Konofagou, USA Ballroom IPage No.8:00A – 8:15A019 A MODEL–BASED APPROACH TO INTRAVASCULAR ULTRASOUND ELASTOGRAPHY. 75MS Richards 1 , MM Doyley 1 .1 University of Rochester, Rochester, NY, USA.8:15A – 8:30A020 RF–BASED 2D STRAIN IMAGING IN THE NORMAL AND DISEASED ABDOMINAL AORTA. 76RGP Lopata 1,2 , HHG Hansen 3 , GW Schurink 4 , CL de Korte 3 , EMH Bosboom 1,2 , FN van de Vosse 1,2 .1 Eindhoven University of Technology, Eindhoven, The NETHERLANDS; 2 Maastricht UniversityMedical Center, Maastricht, The NETHERLANDS; 3 Radboud University Nijmegen Medical Center,Nijmegen, The NETHERLANDS; 4 Maastricht University Medical Center, Maastricht, TheNETHERLANDS.8:30A – 8:45A021 4D CARDIAC STRAIN IMAGING USING RF–DATA IN YOUNG CHILDREN. 77RGP Lopata 1,2 , MM Nillesen 3 , JM Thijssen 3 , L Kapusta 3 , CL de Korte 3 .1 Eindhoven University of Technology, Eindhoven, The NETHERLANDS; 2 Maastricht UniversityMedical Center, Maastricht, The NETHERLANDS; 3 Radboud University Nijmegen Medical Center,Nijmegen, The NETHERLANDS.8:45A – 9:00A003 SEGMENTAL DISPLACEMENT AND STRAIN ANALYSIS OF LEFT VENTRICULARDEFORMATIONS.C Ma 1 , H Chen 2 , T Varghese 1 , PS Rahko 1 , AF Kelly 1 .1 University of Wisconsin–Madison, Madison, WI, USA; 2 Emory University, Atlanta, GA, USA.7812indicates Presenter
9:00A – 9:15A022 METHOD FOR MINIMIZING THE EFFECT OF CATHETER ECCENTRICITY IN INTRAVASCULARULTRASOUND ELASTOGRAPHY.S Jing 1 , MS Richards, MM Doyley 1 .1 University of Rochester, Rochester, NY, USA.Page No.799:15A – 9:30A023 PLAQUE VISUALIZATION WITH A COMBINED B–MODE/ARFI/DOPPLER REAL–TIMEIMAGING SYSTEM: TEMPORAL AND SPATIAL STABILITY.JR Doherty 1 , DM Dumont 1 , JJ Dahl 1 , JD Allen 1 , GE Trahey 1 .1 Duke University, Durham, NC, USA.809:30A – 9:45A037 NON–INVASIVE MULTI–ANGLE STRAIN IMAGING IN PULSATING VESSELS. 81HHG Hansen 1 , M Keijts 1,2 , RGP Lopata 2,3 , T Idzenga 1 , CL de Korte 1 .1 Radboud University Nijmegen Medical Center, Nijmegen, The NETHERLANDS; 2 EindhovenUniversity of Technology, Eindhoven, THE NETHERLANDS; 3 Maastricht University, Maastricht, TheNETHERLANDS.9:45A – 10:00A045 INTRAVASCULAR ULTRASOUND ELASTOGRAPHY OF CORONARY ARTERIES: A PRE– AND 82POST–ATHERECTOMY STUDY.Y Majdouline 1 , Y Saijo 2 , F Destrempes 1 , J Ohayon 3 , G Cloutier 1 .1 University of Montréal Hospital Research Center (CRCHUM), Montréal, Québec, CANADA; 2 TohokuUniversity, Aobaku, Sendai, JAPAN; 3 UJF, CNRS UMR 5525, In 3 S, Grenoble, FRANCE.10:00A – 10:30ACOFFEE BREAKBallroom IIIMonday 10:30A – 12:00PSession MIP–2: Methods for Imaging Elastic Tissue Properties – IIChair: B Guzina, USA Co-Chair: K Kim, USA Ballroom IPage No.10:30A – 10:45A043 QUANTIFYING THE IMPACT OF SHEAR WAVELENGTH ON SHEAR WAVE SPEED 83ESTIMATION.ML Palmeri 1 , NC Rouze 1 , MH Wang 1 , X Ding 1 , KR Nightingale 1 .1 Duke University, Durham, NC, USA.10:45A – 11:00A040 INTERNAL INDENTATION FOR DIRECT MODULUS ESTIMATION. 84J Vappou 1 , EE Konofagou 1 .1 Columbia University, New York, NY, USA.11:00A – 11:15A050 SHEAR STRAIN ELASTOGRAPHY USING OPTICAL COHERENCE TOMOGRAPHY AS A MEANS 85OF GENERATING CONTRAST.A Grimwood 1 , L Garcia 2 , JC Bamber 2 , J Holmes 3 , P Woolliams 4 , P Tomlins 4 , Q Pankhurst 1 .1 Royal Institution of Great Britain, London, England, UK; 2 Institute of Cancer Research, Sutton,Surrey, England, UK; 3 Michelson Diagnostics Ltd., Orpington, Kent, England, UK; 4 NationalPhysical Laboratory, Teddington, Middx, England, UK.11:15A – 11:30A055 NUMERICAL EVALUATION OF CORRELATION BASED 3D SPECKLE TRACKING FORCARDIAC ULTRASOUND ELASTICITY IMAGING.S Tripathy 1 , MA Simon 1 , K Kim 1 .1 University of Pittsburgh, Pittsburgh, PA, USA.86(Session MIP–2 continues on next page)indicates Presenter13
(Session MIP–2 continued from previous page)11:30A – 11:45A015 TRANSTHORACIC ACOUSTIC RADIATION FORCE IMPULSE IMAGING OF CARDIACFUNCTION.DP Bradway 1 , SJ Hsu 2 , PD Wolf 1 , GE Trahey 1 .1 Duke University, Durham, NC, USA; 2 Siemens Healthcare, Issaquah, WA, USA.Page No.8711:45A – 12:00P064 EX VIVO FEASIBILITY OF HARMONIC MOTION IMAGING OF HUMAN BREAST TUMORS. 88EE Konofagou 1 , C Maleke 1 .1 Columbia University, New York, NY, USA.12:00P – 1:30PGROUP LUNCHGolden Cliff/Eagles NestMonday 1:30P – 2:45PSession BTM: Biomechanical Tissue ModelingChair: G Cloutier, Canada Co-Chair: R Righetti, USA Ballroom IPage No.1:30P – 1:45P001 PARAMETRIC ANALYSIS OF AXIAL SHEAR STRAIN IMAGING ON ELLIPSOIDAL MASSES. 89H Xu 1 , T Varghese 1 .1 University of Wisconsin–Madison, Madison, WI, USA.1:45P – 2:00P011 THE FINITE DIFFERENCE MODEL OF SHEAR WAVE PROPAGATION IN VISCOELASTIC 90TISSUE.G Cheng 1 , X Han 1 , W Tan 1 , CR Hazard 2 .1 GE Global Research, Shanghai, Pudong District, CHINA; 2 GE Global Research, Niskayuna, NY, USA.2:00P – 2:15P012 FINITE ELEMENT SIMULATION OF SHEAR WAVE PROPAGATION INDUCED BY A VCTEPROBE.S Audière 1,2 , M Charbit 1 , E Angelini 1 , V Miette 2 , J Oudry 2 , L Sandrin 2 .1 Institut Telecom, Telecom ParisTech, CNRS LTCI, Paris, FRANCE; 2 Echosens, Paris, FRANCE.912:15P – 2:30P080 EFFECT OF BOUNDARY CONDITIONS ON THE PERFORMANCE OF POROELASTOGRAPHYTECHNIQUES IN COMPLEX SIMULATED MEDIA.A Chaudhry 1 , G Unnikrishnan 1 , JN Reddy 1 , R Righetti 1 .1 Texas A&M University, College Station, TX, USA.922:30P – 2:45P093 FEM SIMULATION OF HARMONIC TISSUE EXCITATION FOR PROSTATE ELASTOGRAPHY. 93O Goksel 1 , SE Salcudean 1 .1 University of British Columbia, Vancouver, BC, CANADA.Monday 2:45P – 3:30PSession FIP: Forward and Inverse ProblemsChair: JR McLaughlin, USA Co-Chair: C Sumi, Japan Ballroom IPage No.2:45P – 3:00P084 ALGORITHMS FOR QUANTIATIVE NONLINEAR ELASTICITY IMAGING IN THREE DIMENSIONS. 94S Goenezen 1 , JF Dord 1 , PE Barbone 2 , AA Oberai 1 .1 Rensselaer Polytechnic Institute, Troy, NY, USA; 2 Boston University, Boston, MA, USA.14indicates Presenter
Page No.3:00P – 3:15P085 A DIRECT ALGORITHM FOR TIME–HARMONIC ELASTICITY IMAGING WITH MULTIPLE SOURCES. 95Yixiao Zhang 1 , AA Oberai 1 , PE Barbone 2 , I Harari 3 .1 Rensselaer Polytechnic Institute, Troy, NY, USA; 2 Boston University, Boston, MA, USA; 3 Tel AvivUniversity, Ramat Aviv, ISRAEL.3:15P – 3:30P094 MESH ADAPTATION FOR IMPROVING INVERSE–PROBLEM RECONSTRUCTION. 96O Goksel 1 , H Eskandari 1 , SE Salcudean 1 .1 University of British Columbia, Vancouver, BC, CANADA.3:30P – 4:00PCOFFEE BREAKBallroom IIIMonday 4:00P – 5:30PSession CAA–2: Clinical and Animal Applications – IIChair: W Weitzel, USA Co-Chair: H Feltovich, USA Ballroom IPage No.4:00P – 4:15P038 ULTRASOUND ELASTICITY IMAGING IN THE DETECTION OF INTESTINAL FIBROSIS AND 97EDEMA/INFLAMMATION IN RATS AND HUMANS WITH CROHN’S DISEASE.JM Rubin 1 , RW Stidham 1 , PDR Higgins 1 , J Xu 2 , LA Johnson 1 , M Zhang 1 , D Moons 1 , B McKenna 1 ,K Kim 2 .1 University of Michigan, Ann Arbor, MI, USA; 2 University of Pittsburgh, Pittsburgh, PA, USA.4:15P – 4:30P068 CONTRAST DIFFERENCES IN ULTRASOUND B–MODE AND STRAIN IMAGES OF BRAIN 98TUMORS – PRELIMINARY RESULTS.T Selbekk 1,2 , R Brekken 1,2 , O Solheim 2,3 , G Unsgaard 2,3 .1 SINTEF, Trondheim, NORWAY; 2 The Norwegian University of Science and Technology, Trondheim,NORWAY; 3 St. Olav Hospital, Trondheim University Hospital, Trondheim, NORWAY.4:30P – 4:45P072 DOUBLE PUSH ARF ASSESSMENT OF MUSCULAR MECHANICAL PROPERTIES IN A DOGMODEL OF DMD WITH MYOSTATIN VARIATION.MR Scola 1 , JN Kornegay 1 , CM Gallippi 1 .1 The University of North Carolina at Chapel Hill, Chapel Hill, NC, USA.994:45P – 5:00P069 BREAST ELASTOGRAPHY: EXPERIENCE OF 800 CASES. 100E Fleury 1 .1 CTC Genese Medicina Diagnóstica, São Paulo, BRAZIL.5:00P – 5:15P026 DOES THE ELASTOGRAPHY/B–MODE LENGTH RATIO PREDICT BREAST CANCER TUMOR 101GRADE?RG Barr 1 , JR Grajo 2 , C Peterson 1 .1 Southwoods Radiology Consultants, Youngstown, OH, USA; 2 University of South Florida, Tampa, FL, USA.5:15P – 5:30P101 AXIAL–SHEAR STRAIN ELASTOGRAPHY FOR BREAST LESION CLASSIFICATION: INITIAL 102RESULTS FROM RETROSPECTIVE IN VIVO DATA.AK Thittai 1 , JM Yamal 2 , LM Mobbs 3 , CM Kraemer–Chant 3 , S Chekuri 1 , BS Garra 3 , J Ophir 1 .1 The University of Texas Medical School, Houston, TX, USA; 2 The University of Texas School ofPublic Health, Houston, TX, USA; 3 Fletcher Allen Health Care, Burlington, VT, USA.After 5:30PNo Conference ActivitiesMonday 6:15P Bus Departure from SnowbirdA bus will be available for going to dinner for the evening. Ask at the Registration Desk for details.indicates Presenter15
Tuesday, October 19 7:00A – 10:00P7:00A – 8:00AGROUP BREAKFASTGolden Cliff/Eagles Nest7:00A – 4:00PRegistration Desk OpenBallroom Foyer8:00A – 4:00P Session POS: Posters Ballroom IIISession EEX: Equipment ExhibitBallroom IIITuesday 8:00A – 9:00ASession CAA–3: Clinical and Animal Applications – IIIChair: JM Rubin, USA Co-Chair: ML Palmeri, USA Ballroom IPage No.8:00A – 8:15A063 BREAST FAT: SHEAR–WAVE ELASTICITY MEASUREMENTS. 103D Cosgrove 1 , R Hooley 2 , E Mendelson 3 , L Barke 4 , A Cossi 5 , B Cavanaugh 6,7 , L Larsen 8 .1 Imperial College, Hammersmith Hospital, London, England, UK; 2 Yale Medical Center, Yale, CT,USA; 3 Northwestern Medical Center, Chicago, IL, USA; 4 Sally Jobe Breast Center, Denver, CO, USA;5 Boston Medical Center, Boston, MA, USA; 6 Thomas Jefferson University, Philadelphia, PA, USA;7 University of Southern California, Los Angeles, CA, USA.8:15A – 8:30A106 MONITORING ABLATIVE THERAPY USING ULTRASOUND ELASTOGRAPHY: CLINICAL RESULTS. 104H Rivaz 1 , U Hamper 2 , M Choti 2 , GD Hager 1 , EM Boctor 1 .1 Johns Hopkins University, Baltimore, MD, USA; 2 Johns Hopkins Medical Institutes, Baltimore, MD, USA.8:30A – 8:45A070 PROSTATE ELASTOGRAPHY: INITIAL EXPERIENCE AND CLINICAL PERSPECTIVE. 105E Fleury 1 .1 CTC Genese Medicina Diagnóstica, São Paulo, BRAZIL.8:45A – 9:00A087 PROSTATE MECHANICAL IMAGING: CLINICAL RESULTS. 106V Egorov 1 , N Sarvazyan 1 , RE Weiss 2 , M Ankem 2 , JW Slaton 3 , LA Mynderse 4 , PR Sieber 5 , MD Efros 6 ,M Patel 1 , AP Sarvazyan 1 .1 Artann Laboratories, Trenton, NJ, USA; 2 Robert Wood Johnson Medical School, University ofMedicine and Dentistry of New Jersey, New Brunswick, NJ, USA; 3 Minneapolis VA Medical Center,Minneapolis, MN, USA; 4 Mayo Clinic, Rochester, MN, USA; 5 Urological Associates of Lancaster,Lancaster, PA, USA; 6 Accumed Research Associates, Garden City, NY, USA.Tuesday 9:00A – 10:15ASession MIP–3: Methods for Imaging Elastic Tissue Properties – IIIChair: TJ Hall, USA Co-Chair: RJ Housden, UK Ballroom IPage No.9:00A – 9:15A056 DETECTION OF LAYERS OF ALIGNED COLLAGEN IN HUMAN CERVICAL TISSUE USING 107ULTRASOUND.LM Reusch 1 , J Anderson 1 , L Carlson 1 , C Pehlke 1 , MA Kliewer 1 , JM Harter 1 , JJ Dahl 2 , ML Palmeri 2 ,K Eliceiri 1 , H Feltovich 1,3 , TJ Hall 1 .1 University of Wisconsin–Madison, Madison, WI, USA; 2 Duke University, Durham, NC, USA;3 Maternal Fetal Medicine, Intermountain Healthcare, Park City, UT, USA.9:15A – 9:30A060 ELASTICITY RECONSTRUCTION WITH DUAL TRANSDUCER MOTION TRACKING. 108JM Abeysekera 1 , A Baghani 1 , H Eskandari 1 , R Rohling 1 .1 University of British Columbia, Vancouver, BC, CANADA.16indicates Presenter
Page No.9:30A – 9:45A066 FREQUENCY DOMAIN EXTRACTION OF VISCOELASTIC PROPERTIES USING ACOUSTIC 109RADIATION FORCE.SM Frew 1 , A Baghani 1 , H Eskandari 1 , R Zahiri Azar 1 , SE Salcudean 1 .1 University of British Columbia, Vancouver, BC, CANADA.9:45A – 10:00A073 CORTICAL ELASTICITY MEASUREMENT DURING ULTRASOUND-GUIDED KIDNEY BIOPSY:AN EX–VIVO STUDY.GH Kruger 1 , JM Rubin 1 , DW Park 1 , A Hinger 1 , J Hamilton 2 , P Gottschalk 2 , WF Weitzel 1 .1 University of Michigan, Ann Arbor, MI, USA; 2 Epsilon Imaging, Inc., Ann Arbor, MI, USA.11010:00A – 10:15A078 HIGH FRAME RATE 2D WAVE IMAGING ON CONVENTIONAL ULTRASOUND USING SECTOR 111SUBDIVISION, DELAY COMPENSATION, AND ANGULAR COMPOUNDING.R Zahiri Azar 1,2 , A Baghani 2 , SE Sacludean 2 , R Rohling 2 .1 Ultrasonix Medical Corporation, Richmond, BC, CANADA; 2 University of British Columbia,Vancouver, BC, CANADA.10:15A – 10:45ACOFFEE BREAKBallroom IIITuesday 10:45A – 12:00PSession MPT–2: Mechanical Properties of Tissues – IIChair: KJ Parker, USA Co-Chair: E Brusseau, France Ballroom IPage No.10:45A – 11:00A098 IN VIVO FREQUENCY DEPENDENT SHEAR VISCOELASTIC PROPERTIES OF THE BRAIN 112IN NORMAL PRESSURE HYDROCEPHALUS.K Lin 1 , JR McLaughlin 1 , KJ Streitberger 2 , E Weiner 2 , J Hoffmann 2,3 , FB Freimann 4 , D Klatt 2 , J Braun 2 ,C Sprung 4 , R Klingebiel 2,5 , I Sack 2 .1 Rensselaer Polytechnic Institute, Troy, NY, USA; 2 University Medicine Berlin, Berlin, GERMANY;3 University of California San Francisco, San Francisco, CA, USA; 4 University Berlin, Berlin,GERMANY; 5 Klinik im Park, Zürich, SWITZERLAND.11:00A – 11:15A047 A NOVEL INSTRUMENT FOR THE VISCOELASTIC SPECTROSCOPY OF BIOMATERIALS AND 113TISSUE MIMICKING MATERIALS FROM 10 TO 1000 HZ.C Schmitt 1 , A Hadj Henni 1 , MÉ Tremblay 2 , M Hamdine 2 , MC Heuzey 2 , PJ Carreau 2 , G Cloutier 1 .1 University of Montréal Hospital Research Center (CRCHUM), Montréal, Québec, CANADA; 2 ÉcolePolytechnique, Montréal, Québec, CANADA.11:15A – 11:30A067 FURTHER CHARACTERISATION OF CHANGES IN AXIAL STRAIN ELASTOGRAMS DUE TOTHE PRESENCE OF SLIPPERY TUMOR BOUNDARIES. PART I: SIMULATION STUDY.L Garcia 1 , J Fromageau 1 , JC Bamber 1 , C Uff 1 .1 Institute of Cancer Research, Sutton, Surrey, England, UK.11:30A – 11:45A081 FURTHER CHARACTERISATION OF CHANGES IN AXIAL STRAIN ELASTOGRAMS DUE TO THEPRESENCE OF SLIPPERY TUMOR BOUNDARIES. PART II: EXPERIMENTAL VERIFICATION.C Uff 1 , L Garcia 1 , J Fromageau 1 , JC Bamber 1 .1 Institute of Cancer Research, Sutton, Surrey, England, UK.11411511:45A – 12:00P082 MEASURING THE YOUNG’S MODULUS OF HUMAN BRAIN IN VIVO WITH SHEAR WAVE 116ELASTOGRAPHY.C Uff 1 , JC Bamber 1 , NL Dorward 2 .1 Institute of Cancer Research, Sutton, Surrey, England, UK; 2 Royal Free Hospital, London, England, UK.indicates Presenter17
12:00P – 1:30PGROUP LUNCHGolden Cliff/Eagles NestTuesday 1:30P – 3:30PSession MIP–4: Methods for Imaging Elastic Tissue Properties – IVChair: KJ Parker, USA Co-Chair: J Vappou, USA Ballroom IPage No.1:30P – 1:45P095 CAN MRI ACCURATELY MEASURE TRANSIENT DISPLACEMENT WAVEFORMS? 117A COMPARISON WITH ULTRAFAST ULTRASOUND IMAGING.R Souchon 1 , JL Gennisson 2 , M Tanter 2 , JY Chapelon 1 , O Rouvière 1,3 .1 INSERM, Lyon, FRANCE; 2 Institut Langevin–Ondes et Images, ESPCI ParisTech, Paris, FRANCE;3 Hospices Civils de Lyon, Lyon, FRANCE.1:45P – 2:00P079 A GPU–BASED–TIME CONSTANT ESTIMATOR FOR REAL–TIME ELASTOGRAPHY 118APPLICATIONS.SP Nair 1 , X Yang 1 , TA Krouskop 2 , R Righetti 1 .1 Texas A&M University, College Station, TX, USA; 2 National Institute for Human Performance,Houston, TX, USA.2:00P – 2:15P058 SYNTHESIS AND ANALYSIS OF CRAWLING WAVES GENERATED FROM RADIATION FORCE. 119Z Hah 1 , CR Hazard 2 , DJ Rubens 1 , KJ Parker 1 .1 University of Rochester, Rochester, NY, USA; 2 GE Global Research, Niskayuna, NY, USA.2:15P – 2:30P065 A SIMULATION FRAMEWORK FOR HARMONIC MOTION IMAGING FOR FOCUSEDULTRASOUND (HMIFU) WITH EX VIVO VALIDATION.GY Hou 1 , J Luo 1 , C Maleke 1 , J Vappou 1 , EE Konofagou 1 .1 Columbia University, New York, NY, USA.1202:30P – 2:45P083 IDENTIFICATION OF NON–LINEAR MATERIAL PROPERTIES OF TISSUE PHANTOMS USING A 121REGULARIZED INVERSION METHOD.JF Dord 1 , S Goenezen 1 , AA Oberai 1 , PE Barbone 2 , TJ Hall 3 , J Jiang 3 .1 Rensselaer Polytechnic Institute, Troy, NY, USA; 2 Boston University, Boston, MA, USA; 3 Universityof Wisconsin–Madison, Madison, WI, USA.2:45P – 3:00P088 PROSTATE CANCER DETECTION BY CRAWLING WAVES: PRELIMINARY RESULTS. 122L An 1 , Z Hah 1 , Y Cho 1 , B Mills 1 , S Mao 1 , L Baxter 2 , L Kushner 2 , J Yao 2 , J Joseph 2 , DJ Rubens 2 ,J Strang 2 , KJ Parker 1 .1 University of Rochester, Rochester, NY, USA; 2 University of Rochester Medical Center, Rochester,NY, USA.3:00P – 3:15P102 VISUALIZATION OF HIFU–INDUCED LESION BOUNDARIES BY AXIAL–SHEAR STRAINELASTOGRAPHY.AK Thittai 1 , B Galaz 1 , J Ophir 1 .1 The University of Texas Medical School, Houston, TX, USA.1233:15P – 3:30P108 EFFECT OF LOW–FREQUENCY ULTRASOUND MODULATION ON THE ACOUSTIC RADIATIONFORCE IN FLUIDS AND SOFT TISSUES.EV Dontsov 1 , BB Guzina 1 .1 University of Minnesota, Minneapolis, MN, USA.12418indicates Presenter
3:30P – 4:00PCOFFEE BREAKBallroom IIITuesday 4:00P – 5:30PSession SIP–2: Signal and Image Processing – IIChair: SE Salcudean, Canada Co-Chair: AK Thittai, USA Ballroom IPage No.4:00P – 4:15P086 GPU UTILIZATION FOR FAST 3D MOTION TRACKING ALGORITHMS. 125TG Fisher 1 , TJ Hall 1 .1 University of Wisconsin–Madison, Madison, WI, USA.4:15P – 4:30P017 SUBSAMPLE DISPLACEMENT INTERPOLATION USING WINDOWED–SINCRECONSTRUCTION WITH NUMERICAL OPTIMIZATION.MM McCormick 1 , T Varghese 1 .1 University of Wisconsin–Madison, Madison, WI, USA.1264:30P – 4:45P090 ULTRASOUND ELASTICITY IMAGING USING THE CURL OF THE DISPLACEMENT. 127A Baghani 1 , R Zahiri Azar 1 , SE Salcudean 1 , R Rohling 1 .1 University of British Columbia, Vancouver, BC, CANADA.4:45P – 5:00P041 DISPLACEMENT ESTIMATION OF THE CAROTID ARTERY USING SYNTHETIC APERTUREIMAGING.S Korukonda 1 , MM Doyley 1 .1 University of Rochester, Rochester, NY, USA.1285:00P – 5:15P105 ROBUST REAL TIME REGULARIZED ULTRASOUND ELASTOGRAPHY. 129H Rivaz 1 , EM Boctor 1 , GD Hager 1 .1 Johns Hopkins University, Baltimore, MD, USA.5:15P – 5:30P010 A METHOD FOR AUTOMATIC PROSTATE SEGMENTATION USING COMBINED ULTRASOUND 130B–MODE AND ELASTOGRAPHY IMAGES.SS Mahdavi 1 , M Moradi 1 , WJ Morris 2 , SE Salcudean 1 .1 University of British Columbia, Vancouver, BC, CANADA; 2 Vancouver Cancer Center of the BritishColumbia Cancer Agency, Vancouver, BC, CANADA5:30P – 7:00P No Conference ActivitiesTuesday 7:00P – 10:00PClosing Pizza Party<strong>Proceedings</strong> Book SigningAtrium Loungeindicates Presenter19
Session EEX:Equipment ExhibitBallroom IIISuperSonic Imagine, Inc.Bothell, WA, USA.E & I, Ltd.Rochester, NY, USA.20indicates Presenter
Rich WymanInternational singer, songwriter, pianist.A native of Allentown, Pennsylvania, Rich Wymandiscovered the piano at the age of seven, after hetaught himself to read music and had taken classicalviolin at age five. By age eight, he was composing, at14, performing and at 15, recording. Classically trainedfor 15 years, Rich graduated from the High School forthe Performing Arts in Fort Lauderdale, Florida. Hereceived his college education at New York Universityand the acclaimed Manhattan School of Musicstudying composition and piano. Currently, he toursextensively throughout Europe and the U.S. and lives inPark City, Utah with his wife, Lisa, and their two sons.Rich is also an acclaimed music producer and film composer. The recipient of nine ASCAPAwards, he has worked with top names in the music industry including Eddie Van Halenand Andy Johns and opened concerts for Alanis Morissette and The Goo Goo Dolls.Rich is a powerful and passionate performer, dedicated to creating original, rock pianowith soul. Rich Wyman’s accomplishments include award-winning songwriter, pianist,music producer and film composer. Rich is a representative for civil and socialimprovements, an international ambassador for 1We and, in his spare time, an avidmountain biker and snowboarder.Tonight’s performance will delight you with Rich’s original compositions and his uniquepiano jazz rock style. Get ready to dance, rock or just listen and enjoy!A detailed program will be available at the Conference Dinner.Sunday, October 17 th , <strong>2010</strong>Performance will start at 9:00 pm21
AUTHOR INDEXAUTHOR PAGE AUTHOR PAGEAbeysekera, JM 108 Dontsov, EV 124Aigner, F 59 Dord, JF 43, 94, 121Alaf, ME 46 Doré, C 55Allen, JD 80 Dorward, NL 116An, L 122 Doyley, MM 75, 79, 128Anderson, J 107 Dumont, DM 80Andreano, A 58 Efros, MD 106Angelini, E 91 Egorov, V 106Ankem, M 106 Eliceiri, K 107Audière, S 91 Eskandari, H 72, 96, 108, 109Bae, MH 44 Feltovich, H 107Baghani, A 50, 69, 108, 109, 111, 127 Fink, M 27, 52, 70Baker, S 56 Fisher, TG 73, 125Bamber, JC 39, 40, 49, 85, 114, 115, 116 Fleury, E 32, 100, 105Barbone, PE 43, 94, 95, 121 Foo, W 57Barke, L 55, 103 Fox, JR 45, 60Barr, RG 101 Frauscher, F 59Baxter, L 122 Freimann, FB 112Bercoff, J 47, 52 Frew, SM 109Berthezène, Y 40 Fromageau, J 40, 114, 115Bharat, S 58, 61 Fujikura, K 31Boctor, EM 46, 104, 129 Gadapa, S 37, 62Bosboom, EMH 78 Galaz, B 123Boublay, N 40 Gallippi, CM 99Bouchard, R 42 Gallot, T 53, 54Bouffard, NA 60 Gao, L 65Brace, C 58 Garcia, L 85, 114, 115Bradway, DP 87 Garra, BS 102Braun, J 112 Gee, AH 49, 68Brekken, R 98 Geffre, C 65Brum, J 53, 54 Gennisson, JL 47, 52, 64, 70, 119Brusseau, E 40 Goenezen, S 43, 94, 121Burnside, ES 56 Goksel, O 72, 93, 96Bush, N 40 Gottschalk, P 110Carlson, L 107 Grajo, JR 101Carreau, PJ 113 Grenier, N 47Catheline, S 53, 54 Grimwood, A 39, 85Cavanaugh, B 55, 103 Guzina, BB 124Chapelon, JY 117 Hager, GD 46, 104, 129Charbit, M 91 Hah, Z 66, 67, 119, 122Chaudhry, A 92 Hall, TJ 43, 56, 73, 74, 107, 121, 125Chekuri, S 102 Hamdine, M 113Chen, H 35, 78 Hamilton, J 110Chen, L 49, 68 Hamper, U 104Cheng, G 90 Han, BH 38Cho, MH 38 Han, X 90Cho, Y 122 Hansen HHG 76, 81Choti, M 104 Hanson, ME 61Chung, C 51 Harari, I 95Cloutier, G 25, 28, 82, 113 Hartenbach, EM 63Cosgrove, D 55, 103 Harter, JM 63, 107Cossi, A 55, 103 Hazard, CR 34, 66, 67, 90, 119Coulon, A 40 Hadj Henni, A 28, 113Couzy, L 47 Heuzey, MC 113Criton, A 47 Higgins, PDR 97Dahl, JJ 80, 107 Hinger, A 110De Brosses, E 64 Hoffmann, J 112de Korte, CL 76, 77, 81 Holmes, J 39, 85De Zordo, T 59 Hooley, R 55, 103Deffieux, T 70 Horninger, W 59Delmas, Y 47 Hou, GY 120Derieppe, M 47 Housden, RJ 36, 49, 68Deshmukh, NP 46 Hsu, SJ 42, 87Destrempes, F 82 Hubrecht, R 47Detti, V 40 Humbert, P 52DeWall, RJ 48, 58, 61 Idzenga, T 81Dickie, K 50 Jaschke, W 59Ding, X 83 Jeong, MK 44Doan, BT 29 Jiang, J 43, 58, 74, 121Doherty, JR 80 Jing, S 7922
AUTHOR INDEXAUTHOR PAGE AUTHOR PAGE AUTHOR PAGEJohnson, LA 97 Ophir, J 102, 123 Tavitian, B 27Joseph, J 122 Oudry, J 91 Taylor, K 36Jugé, L 29 Palmeri, ML 43, 57, 83, 107 Thijssen, JM 77Junker, D 59 Pankhurst, Q 39, 85 Thittai, AK 102, 123Kang, H 46 Park, DW 110 Thomas, A 66, 67Kapusta, L 77 Park, MK 44 Thomenius, K 66, 67Keijts, M 81 Park, S 34 Tomlins, P 39, 85Kelly, AF 78 Park, SS 44 Touboul, D 52Kim, K 86, 97 Parker, KJ 66, 67, 121, 122 Trahey, GE 42, 80, 87Kiss, MZ 63 Patel, M 106 Treece, GM 36, 49, 68Klatt, D 112 Pedross, F 59 Tremblay, MÉ 113Kliewer, MA 51, 61, 63, 107 Pehlke, C 107 Tripathy, S 86Klingebiel, R 112 Pelissier, L 50 Uff, C 49, 114, 115, 116Konofagou, EE 30,31,41,84,88,120 Peterson, C 101 Unnikrishnan, G 92Koptuich, C 45, 60 Polascik, T 57 Unsgaard, G 98Kornegay, JN 99 Prager, RW 49, 68 Vadde, S 37, 62Korukonda, S 128 Provost, J 31 van de Vosse, FN 76Kraemer–Chant, CM 102 Rahko, PS 78 Vappou, J 84, 120Krouskop, TA 118 Rao, M 56 Varghese, T 26,35,48,51,56,58,Kruger, GH 110 Reddy, JN 92 61,63,78,89,126Kukatla, H 37, 62 Reusch, LM 107 Wallis, MG 36Kushner, L 122 Richards, MS 75, 79 Wan, EY 30Kwon, SJ 44 Righetti, R 92, 118 Wang, MH 83Langevin, HM 45, 60 Rivaz, H 46, 104, 129 Weiner, E 112Larrat, B 70 Rohling, R 69, 72, 108, 111, 127 Weiss, RE 106Larsen, L 55, 103 Rosenzweig, S 57 Weitzel, WF 110Latorre–Ossa, H 64 Rouvière, O 117 Witte, RS 65Latt, LD 65 Roux, P 53, 54 Wolf, PD 87Lee, SY 38 Rouze, NC 42, 83 Woolliams, P 85Lee, WN 30, 31 Rubens, DJ 66, 67, 119, 122 Xu, H 56, 89Lepreux, S 47 Rubert, N 58 Xu, J 97Lin, K 66, 67, 112 Rubin, JM 97, 110 Yamal, JM 102Lopata, RGP 76, 77, 81 Sack, I 112 Yang, X 118Luo, J 41, 120 Sahebjavaher, RS 33 Yao, J 122Ma, C 35, 78 Saijo, Y 82 Zahiri Azar, R 50,69,109,111,127Macé, E 27 Salcudean, SE 24, 33, 50, 69, 72, 93, Zhai, L 57Madden, J 57 96, 109, 111, 127, 130 Zhang, M 97Madsen, EL 48 Sampson, L 58 Zhang, Yixiao 95Mahdavi, SS 130 Sandrin, L 91 Zhang, Yong 37, 62Maissiat, E 40 Sarvazyan, AP 106Majdouline, Y 82 Sarvazyan, N 106Maleke, C 88, 120 Schaefer, G 59Mao, S 122 Scherman, D 29Marie, H 37, 62 Schmitt, C 28, 113Martín, A 27 Schurink, GW 76McCormick, MM 26, 126 Scola, MR 99McKenna, B 97 Seguin, J 29McLaughlin, JR 66, 67, 112 Selbekk, T 98Mendelson, E 55, 103 Shimizu, K 71Miette, V 91 Sieber, PR 106Mikuz, G 59 Simon, MA 86Mills, B 122 Sink, Z 43Mobbs, LM 102 Sinkus, R 29, 33Montaldo, G 27 Sisney, GA 56Moons, D 97 Slaton, JW 106Moradi, M 130 Solheim, O 98Morris, WJ 130 Sommer, AM 56Mouraviev, V 57 Souchon, R 117Mynderse, LA 106 Sprung, C 112Nair, SP 118 Stidham, RW 97Negreira, C 53, 54 Stolka, PJ 46Nguyen, TM 52 Strang, J 122Nightingale, KR 57, 83 Streitberger, KJ 112Nillesen, MM 77 Sullins, JR 37, 62O’Keeffe, S 36 Sumi, C 71Oberai, AA 43, 94, 95, 121 Szivek, J 65Oe, Y 30 Takanashi, Y 71Ohayon, J 82 Taljanovic, MS 65Okrasinski, SJ 30 Tan, W 90Omari, EA 51, 63 Tanter, M 27,47,52,64,70,11723
ABSTRACTSNinth International Conferenceon the Ultrasonic Measurement and Imagingof Tissue Elasticity ©Snowbird, Utah, USAOctober 16–19, <strong>2010</strong>Session TUT: TutorialsSaturday, October 16 12:00P – 2:00P109 PROSTATE ELASTOGRAPHY AND ITS APPLICATIONS.S. E. Salcudean 1 .1 Electrical and Computer Engineering Department, University of British Columbia, Vancouver,BC, CANADA.Elasticity imaging of the prostate has several potential applications, including:The objective replacement of the digital rectal examination for screening purposesprostate contouring for radiation treatment, image guidance for biopsy and focal treatmentand deformation modeling for the simulation of prostate interventions such as biopsies andbrachytherapy.This tutorial will describe approaches to prostate elasticity imaging, including magnetic resonanceelastography, with an emphasis on ultrasound elastography. We will provide a brief survey of prostatecancer imaging results using elastography. We will then show that ultrasound elastography providesbetter delineation of the prostate gland than conventional B–mode imaging, and we will outlineapproaches to prostate intervention simulation using deformable tissue models.Elastography(a) (b) (c)Figure 1: (a) Transverse Ultrasound B–Mode, (b) UltrasoundElastography and (c) MRI images of the Prostate fortwo patients.US B–ModeMRFigure 2: Prostate surface shapesin the three modalities(c)Figure 3: (a) Brachytherapy stepper withendorectal transducer; (b) meshfor patient–specific anatomicalfinite element model; (c) screenview of brachytherapy simulatorwith graphical and hapticfeedback showing synthesizedtransversal ultrasound view andthe corresponding patientanatomy.(a)(b)24indicates Presenter
110 NON–INVASIVE VASCULAR ULTRASOUND ELASTOGRAPHY: REVIEW OF CHALLENGES OFPOTENTIALLY HIGH IMPACT CLINICAL IMAGING METHODS.Guy Cloutier 1 .1 Laboratory of Biorheology and Medical Ultrasonics, University of Montréal Hospital; Radiology,Radio–Oncology and Nuclear Medicine Department, and Institute of Biomedical Engineering,University of Montréal, Montréal, Québec, CANADA.Background: Only a minority of patients with carotid arterial disease encounter warning symptoms asthe majority of strokes are caused by previously–asymptomatic lesions. Since morbidity and mortalityafter acute stroke are unacceptably high, patients should be diagnosed and treated before they developany symptoms. Vulnerable carotid plaque usually consists of a thin fibrous cap, a large lipid core anddense macrophage inflammation on or beneath its surface. These tissue transformations areaccompanied by changes in vessel wall elasticity. In this context, mechanical properties of arteries arebelieved to be of predictive values for prevention of plaque rupture and acute thrombosis formation.Within the last few years, non–invasive vascular ultrasound elasticity imaging methods were developed toaddress this issue, and to provide an objective evaluation of changes in rigidity of the vascular wall beforethe occurrence of significant atherosclerosis. Methods were conceptualized and tested in phantoms, invivo in animal models, and some technologies were applied on a few human cases in vivo. Few studies sofar were conducted with large populations, but on–going protocols are currently tested.Objective: This presentation will be focussing on promising technologies such as pulse–wave velocityimaging with ultrafast scanning, vibroacoustography and supersonic shear–wave elasticity imaging. Acomparative review of those methods aimed at quantifying the increase in rigidity of the artery wall duetypically to hypertension and early atherosclerosis will be presented. For more advance lesions withatherosclerotic plaque and vessel narrowing, dynamic ultrasound elastography proved to be feasible. Acomparative assessment of the acoustic radiation force and supersonic shear–wave imaging methods willbe presented. A competing approach also aiming at quantifying the mechanical properties ofatherosclerotic plaques is the non–invasive vascular elastography (NIVE) technology that maps tissuedeformations produced by the natural pulsation of the artery. Recent achievements of leading groupsdeveloping ultrasound NIVE will be summarized.Critical Opinion: At the end of this tutorial, the audience should have captured major challengesattributed to each of these methods. A summary of on–going activities at the Laboratory of Biorheologyand Medical Ultrasonics of the University of Montréal Hospital Research Center will also be described.indicates Presenter25
Session SAS: Oral Presentations of Finalists for Student Awards SessionSaturday, October 16 2:30P – 4:30PSponsored by Ultrasonix Medical Corporation, Vancouver, BC, Canada016 REDUCTION OF REVERBERATION ARTIFACTS IN CAROTID STRAIN IMAGES WITHBAYESIAN REGULARIZATION.Matthew M. McCormick 1 , Tomy Varghese 1 .1 University of Wisconsin–Madison, 1111 Highland Ave, Madison, WI, USA.Background: Motion tracking for ultrasound strain imaging is challenging due to noise sources such asdeformation induced decorrelation, decorrelation due to out–of–plane motion and reverberations.Decorrelation can result in erroneous identification of true similarity metric peaks in block matchingmethods. Reverberations result in a motion of the reverberation echo that is discontinuous with themotion of signals from local tissue.Aims: A method for Bayesian regularization introduced by Hayton [1] involves treating the similaritymetric image (cross–correlation, sum of squared difference, etc.) as a probability image. Each metricimage is shifted by the theoretical lower bound and scaled so the members sum to unity. A probabilityimage is iteratively modified by neighboring probability images according to Bayes’ Theorem:The likelihood term is chosen as the product of the maximum value of neighboring probabilitiesmodulated by a Gaussian like term that falls off in magnitude with distance from the currentdisplacement:Methods: The effectiveness of the method is demonstrated using a human common carotid artery strainimage in longitudinal orientation. Figure 1 shows the B–mode ultrasound and region of interestcontaining the intimal layer (a) and a large reverberation (b).Results: Figure 2 shows neighboring probability images located at the reverberation, axial displacementimage and axial strain image at iteration 0 (no regularization), and successive iterations. The true peakeventually emerges, and the artifact is removed without loss of resolution in the strain image.Conclusions: The demonstrated method reduces decorrelation and reverberation noise artifacts by fusinginformation from neighboring blocks prior to displacement and strain being estimated. It is robust to thedecorrelation and reverberation noise present and results in minimal loss of spatial resolution,computational time and additional memory requirements.Acknowledgements: This work is supported by NIH grant 5R21EB010098–01.References:[1] Hayton P. et al.: A Non–Rigid Registration Algorithm for Dynamic Breast MR Images. Artificial Intelligence, V144,pp. 125–156, 1999.AB (a)Figure 1: Carotid B–Mode and region of interest.(a) Vessel intima (b) Reverberation.(b)ABFigure 2: Neighboring probability images, displacement images, andstrain images, respectively.A) Iteration 0: No regularization. (c) Displacement in oppositedirection of surrounding tissue due to reverberation.B) Iteration 2: Regularization isolates bi–modal distributionfrom the reverb and local tissue.C) Iteration 3: Further influence from surrounding tissueyields the correct displacement and strain.(c)C26indicates Presenter
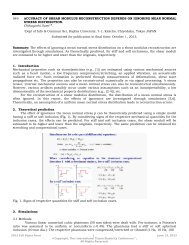
031 IN VIVO STUDY OF CEREBRAL ISCHEMIA USING SHEAR WAVE IMAGING.E Macé 1 , A Martín 2 , G Montaldo 1 , M Fink 1 , B Tavitian 2 , M Tanter 1 .1 Institut Langevin, ESPCI ParisTech, Paris, FRANCE; 2 Experimental Molecular MedicineLaboratory, CEA–SHFJ, Orsay, FRANCE.Background: Stroke is the third leading cause of death in industrialized countries and the most frequentcause of permanent disability in adults worldwide. So far, neuroimaging methods have beenindispensable in understanding the different pathological processes underlying ischemic stroke in boththe laboratory and clinic.Aims: We investigated the potential of Shear Wave Imaging to provide new information on ischemiclesions and in particular to see if, like in many <strong>org</strong>ans [1], stiffness is modified in damaged tissues.Methods: Focal cerebral ischemia was produced in rats by transient 2 hour occlusion of the middlecerebral artery in the right brain hemisphere [2]. To follow the evolution of the ischemic lesion, rats weretrepanned, and Shear Wave Imaging scans were performed in vivo in control animals and at 1, 2, 4 and 7days after the stroke. Shear Wave Imaging consists of generating a shear wave and tracking itspropagation using ultrafast ultrasound imaging to obtain a quantitative map of local brain stiffness [3].We used an ultrafast ultrasound scanner from Supersonic Imagine (France) programmed with customsequences and an 8MHz linear probe.Results: The ischemic lesion was found to be very soft compared to healthy brain tissue. The mean valuein the ischemic hemisphere was
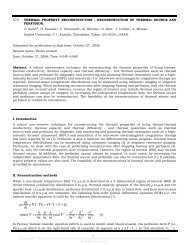
046 SHEAR WAVE INDUCED RESONANCE ELASTOGRAPHY APPLIED TO THE VISCOELASTICCHARACTERIZATION OF MIMICKING VENOUS THROMBOSIS.Cédric Schmitt 1 , Anis Hadj Henni 1 , Guy Cloutier 1 .1 Laboratory of Biorheology and Medical Ultrasonics, University of Montréal Hospital ResearchCenter (CRCHUM), Montréal, Québec, CANADA.Background: Mechanical parameters based on compression elastography were proven adapted to agedeep vein thrombosis (DVT) and hence could be of interest for staging recurrent thrombotic events.However, such a technique is subjective and operator dependent. Recently, we proposed SWIR (shearwave induced resonance) elastography [1], as a new imaging technique capable of improving conventionalcompression and dynamic elastography methods. This technique takes advantage of properly polarizedshear waves to induce resonance of a confined mechanical heterogeneity (i.e., cylinder inclusionembedded in a second medium). Such resonance signature is suitable to estimate quantitatively theviscoelasticity of the heterogeneity, and thus of a DVT in the vascular context.Aim: Our goal is to adapt SWIR elastography for in vivo DVT characterization, and to exploit theresonance information to assess viscoelastic parameters of DVT during aging and following therapy.Methods: Realistic agar–gelatin phantoms composed of a fluid–filled artery and a mimicking incipient total(Figure 1a and 1c) or partial venous clot were built and tested in in vitro experiments. Corresponding modelingusing the finite element method (FEM) was developed to simulate experimental conditions. Transient shearwaves at different frequencies were generated by the vibration of a rigid plate at the medium surface (Figure1a), or by a needle introduced in proximity of the region of interest and simulating a radiation pressure on aline segment. Induced propagation of shear waves was imaged with an ultrafast Ultrasonix SonixRP scanner(Ultrasonix Medical Corp., Richmond, Canada) with a dedicated post–processing reconstruction strategy toreach a high frame rate (3851 frames/sec). After validation of FEM models, an inverse problem (IP) strategywas formulated to recover, from vibration spectra, mechanical parameters of blood clots. DVT phantoms werethen used to characterize mimicking clots with different viscoelasticities using the IP approach.Results: Vibration spectra were composed of frequencies with high motion amplitude or resonancefrequencies which were related to clot mechanical parameters. The frequency of the first resonance wasused as input to the IP formulation to estimate mimicking clot elasticity and viscosity that typicallyranged between 0.4–3.1kPa and 0.09–0.29Pa’s, respectively. Experimental and simulation validation ofthe displacement map at resonance induced by a plate vibration are depicted in Figure 1d and 1b,respectively. Total and partial clot viscoelasticities calculated using either the plate or needle vibration,were in good agreement with reference measurements.G tissue = (18.4 + i××0.8) kPaG inclusion = (2 + i××0.03) kPaFigure 1: Phantom geometry used in the FEM tosimulate the interaction of shear waves withrealistic DVT and artery morphology for a totalocclusion; (a) schematic, (c) experimentalB–mode image. A transient vibration, centeredat 125Hz, was generated by the plate motionfollowing the z–direction. (b) Simulated and (d)experimental stationary normalizeddisplacement fields at the first resonancefrequency (123Hz).(a) Z‐axis vibrationsmimickinglumen artery rigid platemimicking venoustotal clot38 mmConclusions: The feasibility of SWIR to mechanically characterize mimicking DVT was investigated. Sucha novel modality has the advantage to estimate clot viscoelastic parameters from the vibration resonancefrequencies of the mechanical heterogeneity with a single line of measurement (within the clot). It alsoprovides information which is less dependent on the accuracy of shear wave motion displacements.Acknowledgment: Funding was obtained from the Canadian Institutes of Health Research (#MOP–84358).Reference:[1] Hadj Henni, A., Schmitt, C. and Cloutier, G.: Shear Wave Induced Resonance Elastography of Soft HeterogeneousMedia. J. Biomech., 43 (8), pp. 1488–1493, <strong>2010</strong>.yz(c)x33 mm(b)(d)Displacement (a.u.)28indicates Presenter
048 CHARACTERIZATION OF TUMOR VASCULARIZATION IN MICE USING MRE AT 7T.L Jugé 1 , BT Doan 2 , J Seguin 2 , D Scherman 2 , R Sinkus 3 .1 Service RMN, ENSCP, Paris, FRANCE; 2 UPCG, UMR 8151, Unité de Pharmacologie, Chimique etGénétique, et d’Imagerie, Paris, FRANCE; 3 Laboratoire Ondes et Acoustique, ESPCI, Paris, FRANCE.Background: Assessment and follow up of neo–angiogenesis are major challenges in studying cancer forthe development of new therapeutic strategies. The micro–vascularization of tumors is usuallycharacterized via perfusion MRI. In order to develop new MRI methods for characterizing tumors in mice,we applied Magnetic Resonance Elastography (MRE), a recent technique for assessing the viscoelasticproperties of tissues [1, 2]. MRE supplies new physical parameters for improving the specificity in breastcancer diagnosis and liver fibrosis staging [3]. Our working hypothesis is that alterations of tissuevascularization lead to significant changes in the viscoelastic properties which are also accompanied bychanges in tissue diffusivity as measured via Diffusion Weighted MRI.Aims: Characterization of neo–vascularization by MRE during tumor growth in 2 mouse models at 7T.Methods: CT26 tumors were implanted on the flank (ectotopic model) and in the colon (orthotopic model)of mice Balb–C JRJ (n=6). Five (primitive stage), eleven (angiogenic stage) and eighteen (angiogenic +necrosis stage) days after implantation, tumors were imaged in vivo on a horizontal spectrometer 7T(Bruker Pharmascan). Each mouse underwent the following imaging protocol: quantitative T1 T2relaxation maps, quantitative ADC map (9 b values: 0 to 2000s/mm²), high resolution T2–weightedimages for an accurate depiction of the anatomy (RARE sequence, 123µm x123µm in plane resolution)and finally 3D steady–state MRE with a frequency of mechanical excitation of 1000Hz. Reconstructedmaps of Gd (elasticity) and Gl (viscosity) had in isotropic voxel resolution of (300µm) 3 . After MRI study,tumors were taken off and histopathology was performed to assess the details of their microvasculararchitecture by optical microscopy and morphologic (volume and weigh) parameters.Results: For the ectotopic model Gd and Gl of CT26 increased significantly (P
052 EARLY DETECTION OF CORONARY STENOSIS WITH MYOCARDIAL ELASTOGRAPHY:A CLINICAL FEASIBILITY STUDY.Stanley J. Okrasinski 1 , Elaine Y. Wan 2 , Wei–Ning Lee 1 , Yukiko Oe 2 and Elisa E. Konofagou 1,3 .1 Biomedical Engineering Department, Columbia University, 351 Engineering Terrace, 1210Amsterdam Avenue, New York, NY, 10032, USA; 2 Cardiology Division, Columbia University, 622West 168 th Street, New York, NY, 10032, USA; 3 Radiology Department, Columbia University, 630West 168 th Street, New York, NY, 10032, USA.Background: Cardiovascular disease is the leading cause of death worldwide. 2D echocardiography iscommonly used in cardiology to assess wall motion abnormalities as a result of coronary artery stenosis(CAS). However, the abnormalities may not be manifested until significant levels of CAS are present. CTangiography is a technique which is regarded as the current gold standard in diagnosing CAS, though itexposes patients to a high level of x–ray radiation. Myocardial Elastography (ME) [1,2] is a non–invasive,radio frequency (RF) based, angle independent [3] technique which has been previously validated againstsonomicrometry to provide accurate identification of ischemia at various levels of stenosis in canines [4].Aims: This study investigates the capability of ME to detect and localize CAS in human subjects.Methods: Five human subjects, three with CAS, two without CAS, were included in this study.Fluoroscopy and CT angiography following catheterization were performed in all subjects. Short–axis RFframes were acquired using a clinical ultrasound scanner (Ultrasonix SonixRP, Ultrasonix MedicalCorporation, BC, Canada) with a 3.3MHz phased array (SA4–2) of up to 300 frames/second using anautomated motion–gated technique. Inter–frame axial and lateral displacements were estimated usingnormalized cross–correlation (window size: 9.2mm, 80% overlap) and were then accumulated throughoutthe entire systolic phase. Axial and lateral Lagrangian strains were estimated using a least squaresestimator (window size: 14mm). The centroid of the segmented endocardium was selected and used toconvert axial and lateral strains to radial and circumferential strains. The associated B–mode cine loopswere evaluated by a cardiologist for motion abnormalities, and an index of 1 to 7 was assigned to eachwall segment according to its contractility, where 1 represented normal contractility.Results: Table 1 shows the average radial and circumferential strains in the myocardial segment perfused bythe stenosed artery. In two of the cases where CAS was present, the left anterior descending (LAD) and leftcircumflex (LCX) arteries both exhibited stenosis higher than 80% at the ostial level. In the third CAS case,the right coronary artery (RCA) exhibited a mid–level stenosis lower than 40%. However, despite the CASpresence in all pathological cases studied, wall motion scores indicated an absence of abnormalities (index=1).Angiography results Myocardial Segment Radial strain Circumferential StrainNo stenoses Anterioseptal 34±5% -36±8%>80% LAD stenosis Anterioseptal -38±6% 22±20%>80% LCX stenosis Posteriolateral -32±1% 8±5%
053 MAPPING THE ELECTRICAL ACTIVATION SEQUENCE OF THE HEART USINGELECTROMECHANICAL WAVE IMAGING: A VALIDATION STUDY IN CANINES.Jean Provost 1 , Wei–Ning Lee 1 , Kana Fujikura 1 and Elisa E. Konofagou 1 .1 Columbia University, New York, NY, USA.Background: Cardiac conduction abnormalities constitute a major cause of death and disabilityworldwide. However, as of today, no technique routinely used in the clinic can non–invasively providemaps of the electrical activation sequence of the heart for accurate diagnosis and treatment planning andmonitoring. Electromechanical Wave Imaging (EWI) is a novel imaging modality that maps theelectromechanical activation sequence of the heart non–invasively by estimating regional transientdeformations at very high frame rates.Aims: In this presentation, we demonstrate that the electrical and electromechanical activationsequences are highly correlated during sinus rhythm and pacing in canines.Methods: Four mongrel canines, ranging from 23 to 32kg in weight, were anesthetized before undergoinglateral thoracotomy. After removal of the pericardium, up to 12 electrodes were implanted epicardially topace the heart and map the electrical activity. Radio frequency (RF) frames were acquired using anUltrasonix RP with a 3.3MHz phased array at up to 500 frames/second, using a motion–gated,automated composite technique. Axial incremental displacements and strains were estimated using RFcross–correlation (window size: 4.6mm, 80% overlap) and a least squares estimator (window size:6.75mm), respectively. In canines, the Electromechanical Wave (EMW), i.e., the propagating deformationsresulting from the regional electrical activation of the myocardium, was mapped onto two standard 2Dechocardiographic views and displayed in a 3D bi–plane view, during six conduction configurations, i.e.,sinus rhythm and five different pacing schemes. Isochrones of the EMW were generated using a novelautomatic cross–correlation method. Electrical and electromechanical activation times were thenaveraged in each echocardiographic segment and compared.Results: Complex electrical activation patterns were mapped in vivo during six conduction schemes inboth ventricles. During pacing, the EMW isochrones demonstrated the capability of EWI to localize aunique pacing site in all five pacing cases. 3D isochronal maps of the EMW were obtained when pacing(1) from the basal region of the lateral wall, (2) from the apical region of the lateral wall, (3) from the left–ventricular apex, (4) from the right–ventricular apex and (5) from the mid–level of the posterior walldisplayed. In each case, the location of the earliest activation was in excellent agreement with the positionof the pacing lead and propagation occurred from the epicardium to the endocardium. During sinusrhythm, the activation patterns obtained were in excellent agreement with transmural propagationpatterns available in the literature, i.e., activation was initiated at multiple locations in ventricles, fromthe endocardium to the epicardium. A monotonic relationship between the electrical andelectromechanical activation times was found, hereby confirming that EWI can accurately map theactivation sequence.Conclusions: This initial validation underlines the potential of EWI to serve as a unique non–invasiveimaging tool for diagnosis and treatment planning, and monitoring of arrhythmias through ultrasound–based mapping of the transmural electromechanical activation sequence in real–time, reliably and non–invasively.Acknowledgements: This study was supported in part by the National Institutes of Health (R01EB006042,R21HL096094). J. Provost was supported in part by the Natural Sciences and Engineering Research Council ofCanada (NSERC) and Le Fonds Québécois de la Recherche sur la Nature et les Technologies (FQRNT).indicates Presenter31
071 THYROID ELASTOGRAPHY: EXPERIENCE OF 200 CASES.E Fleury 1 .1 CTC Genese Medicina Diagnóstica, São Paulo/SP, BRAZIL.Background: Thyroid masses are very common in our environment. It is believed that about 50% of thepopulation subjected to ultrasound of the thyroid present with an abnormal result. These abnormalitiesusually have little clinical significance, nor chance of malignancy and are considered as incidentallesions. Many of these patients undergo fine needle aspiration biopsies for cytological diagnosis of thelesions. However, the rate of malignancy described in the literature of FNA is less than 5%. Sonography isthe primary method of screening for thyroid lesions, and, currently, it appears that there is not anauxiliary tool to help on the differentiation of benign and malignant lesions. Studies are being carried outusing ultrasound color Doppler scan, but in our practice we do not have good results with it [1]. In thiscontext, studies are being carried out using the elastography as an auxiliary tool for the diagnosis ofthyroid lesions, bearing in mind that benign lesions (colloid and goiter) tend to appear as soft, whilemalignant lesions (papillary and follicular carcinoma) as hard. In our results, we concluded thatelastography of thyroid lesions can contribute to reducing the number of biopsies with negative results,without affecting the sensitivity of the method.Aims: To demonstrate the results of 200 elastographic studies of thyroid lesions.Methods: The author compares the findings by elastography with the results of 200 fine needle aspirationsof thyroid lesions from 01/07/2009 to 01/01/<strong>2010</strong>. The elastographic studies were performed by tworadiologists with 6 and 17 years of experience in thyroid imaging. Examinations were performed using aSonix SP (Ultrasonix Medical Corporation, Vancouver, Canada) US system and a 5–14MHz multi–frequencylinear probe. For the elastography study, special software was used for the Ultrasonix system, version 3.0.2(Beta1), upgraded to the commercial version 2.6. Was used for elastographic classification a two pointscore, where score 1 corresponds to soft lesions and 2 to rigid lesions [2,3]. The lesions were dividedaccording to their histology as benign or malignant.Results: Results showed that all malignant lesions had a rigid appearance on the elastographic study.There were no false negative results. The results shows sensibility for cancer of 100%, specificity of 77.1%,predictive positive value of 38.4%, predictive negative value of 100% and diagnostic accuracy of 80%.Conclusions: The author demonstrates that elastography can help in the diagnosis of thyroid lesions bysonography.Figure 1: Heterogeneous mass on the left lobe ofthyroid, soft on elastography, confirmedFigure 2: A mass on the right lobe of the thyroid,hard on elastography, confirmed aspapillary carcinoma by cytology.as colloid mass by cytology.References:[1] C Asteria, A Giovanardi, A Pizzocaro, L Cozzaglio, A Morabito, F Somalvico, A Zoppo: US–Elastography in theDifferential Diagnosis of Benign and Malignant Thyroid Nodules. Thyroid, 18(5), pp. 523–31, May 2008.[2] EFC Fleury, JC Fleury, S Piato, D Roveda Jr.: New Elastographic Classification of Breast Lesions During andafter Compression. Diagn Interv Radiol, 15(2), pp. 96–103, Jun 2009.[3] EFC Fleury, JC Fleury, VM Oliveira, JF Rinaldi, D Roveda Jr.: Proposal for the Systematization of the ElastographicStudy of Mammary Lesions through Ultrasound Scan. Rev Assoc Med Bras, 55(2), pp. 192–6, Mar 2009.32indicates Presenter
076 TRANS–PERINEAL PROSTATE MRE AT 3T.RS Sahebjavaher 1 , R Sinkus 2 , SE Salcudean 1 .1 University of British Columbia, Vancouver, BC, CANADA; 2 Institut Langevin, CNRS UMR 7587,Univ. Paris 7, ESPCI Paristech, Laboratoire Ondes et Acoustique, Paris, FRANCE.Background: Magnetic resonance elastography (MRE) is a noninvasive technique to image viscoelasticproperties in–vivo using externally applied vibrations. There has been a great interest to apply MREtechniques for in–vivo imaging of prostate cancer. However, current methods [1–3] have limitations withacquiring high-SNR motion encoded MR-signals at 1.5T, and inducing shear waves of sufficientamplitude into the prostate reliably in a patient-friendly manner.Aims: To assess the feasibility of MR elastography of the prostate with transperineal excitation at 3T.Methods: To acquire high quality MRE, a second harmonic pulse sequence was implemented on a 3Tscanner. The sensitivity loss of the second harmonic approach is offset by the shorter TE thus enablingacquisition of high SNR data especially at higher magnetic fields [4]. The mechanical excitation (~45Hz) isgenerated by a commercial electromagnetic exciter (4808 Bruehl & Kjaer) that is placed in the consoleroom. The vibrations are transferred to the patient in the scanner (supine position) using a novelhydraulic transmission system that is MR safe. To reliably induce vibrations of sufficient amplitude in theprostate, the distal end of the exciter is applied to the perineal region of the subject as shown inFigure 1a. This allows for efficient transfer of compressional waves to the prostate that are mode–converted to shear waves at tissue interfaces. MRE was performed on five healthy subjects. After a high–resolution anatomical scan, MRE was acquired for a 64x64 matrix and 7 slices centered where the glandappears largest on the transverse plane. The voxel size was 1.5mm 3 isotropic, and the signal wasaveraged twice with an EPI factor of 5 where the total imaging time was ~20min. A cardiac coil was used.Images were processed offline, similar to the approach described in [4]. A region of interest (Figure 1b)surrounding the prostate was manually segmented, and the values for dynamic shear modulus andamplitude were extracted.Results: Preliminary results for one of the subjects are shown in Figure 1b–d. Mechanical waves aretransmitted effectively into the prostate and produce sufficient shear waves for successful reconstruction.The peak amplitude of the mechanical wave was 7µm (mean 3.3µm) as seen in Figure 1c. A map of thedynamic shear modulus G d is shown in Figure 1d where we observe a close correspondence between theelasticity and T2 weighted images. For example, regions such as the urethra and the stiffer zonessurrounding it can be visually identified Figure 1d. Also, we observed that mechanical excitations appliedto the perineum did not cause discomfort for the subjects compared to cases were the excitation wasapplied to the pelvis (used in previous studies).Figure 1: (a) Setup of transperineal excitation;images of (b) anatomy, (c) wave amplitudeand (d) shear modulus of in–vivo prostate.(a) Mechanical Excitation Appliedat the Perineum(b) T2 Image ofSegmented Prostate(c) Total Wave amplitude(μm)(d) Dynamic ShearModulus Gd (kPa)Conclusions: MRE of the prostate at 3T with the second harmonic approach using a hydraulic exciterapplied to the perineum is feasible. Applying the mechanical excitation to the perineum is comfortable forthe patients even for extended imaging examinations. This method also allows for the use of endorectalcoils (not used in this study) to boost SNR. Elasticity values obtained in this study are consistent amongsubjects, however, these values differ significantly from those reported in the literature (1–71kPa).Further work will characterize the hydraulic actuation system in more detail and will validate theelasticity measurements and their repeatability.Acknowledgements: This work was supported by NSERC and CIHR.References:[1] Sinkus, R., et al.: <strong>Proceedings</strong> of the 11th Annual Meeting of ISMRM, Toronto, Canada, p. 586, 2003.[2] Kemper, J., et al.: Fortschr Röntgenstr 176, pp. 1–6, 2004.[3] Dresner, M.A., et al.: <strong>Proceedings</strong> of the 10th Annual Meeting of ISMRM, Philadelphia, USA, p. 526, 1999.[4] Herzka, D.A., et al.: MRM, Vol. 62(2), pp. 284–291, 2009.indicates Presenter33
Session POS: PostersSaturday, October 16 5:00P – 6:00P(For Viewing and Discussion through Tuesday, October 19, 4:00P)013 ANALYSIS OF SHEAR VELOCITY ESTIMATION BIAS FOR PEAK TRACKING ALGORITHMS.Christopher R. Hazard 1 , Suhyun Park 1 .1 GE Global Research, One Research Circle, Niskayuna, NY, 12309, USA.Background: Quantifying the velocity of shear waves in tissue may have clinical utility in the diagnosis ofbreast cancer, the staging of liver fibrosis and other applications. Shear velocity provides a quantitativemeasurement of the stiffness of the tissue. Viscosity is another important parameter that affects theshape of the propagating shear waves [1]. High viscosity values lead to rapid attenuation of the travellingshear waves. Several groups have suggested using radiation force to induce shear waves in the tissue.These acoustically generated shear waves are then tracked with ultrasound to provide displacementprofiles at multiple locations in the tissue [2–5]. There are multiple algorithms in the literature forestimating the shear velocity from such displacement profiles. Chen et al., use the dispersion of the shearphase velocity to estimate the viscosity and shear modulus assuming a Voigt model of the tissue [7].Palmeri et al. developed an algorithm, called Lateral Time To Peak (LTTP), which estimates the shearspeed by tracking the peak displacement and assuming that peak travels at the shear velocity [6]. Theynote that the peak travels at the shear velocity for elastic media.Aims: The goal of this theoretical study was to better understand the effect of viscosity on the LTTPalgorithm.Methods: Using the Green’s function formalism of Bercoff et al. [1] an analytical expression for thevelocity estimated by the LTTP algorithm is derived for an impulsive shear wave excitation. Thisexpression gives some insight into the effect of viscosity. Simulations of the shear wave propagation usingthe Green’s function are used to further evaluate the effect of viscosity for more realistic spatiallyextended excitations.Results: The derived expression for the estimated velocity using the LTTP algorithm for an impulse is2 2vLTTP c2 s4rwhere vLTTP is the estimated velocity, is the viscosity, cs is the actual shear speed, and r is distance fromthe impulsive push. The expression shows a bias which occurs at high viscosity and when theobservation is made close to the push. Simulations further illustrate this bias and show that qualitativelythis holds even for more complicated shear wave excitation functions. Using multiple observationdistances allows for a correction when the excitation is impulsive, but this strategy is less successful withmore complex excitations such as those created by a push pulse from a standard imaging transducer.Conclusions: The shear velocity estimated by the LTTP algorithm exhibits a bias when the viscosity islarge and the observation is made close to the pushing location. This suggests that the observationlocation should be as far from the push as possible given the signal–to–noise limitations. This analysis isbased on the Green’s function derived assuming the Voigt model and is thus limited to situations inwhich the Voigt model is a good representation of the real tissue response.References:[1] Bercoff, J., Tanter, M., Muller, M., Fink, M.: The Role of Viscosity in the Impulse Diffraction Field of ElasticWaves Induced by the Acoustic Radiation Force. IEEE Trans. UFFC, 51(11), pp. 1523–1536, November, 2004.[2] Sugimoto, T, Ueha, S, Itoh, K: Tissue Hardness Measurement using the Radiation Force of Focused Ultrasound.UFFC Symposium 1990, pp 1377–1380, 1990.[3] Sarvazyan, AP., Rudenko, OV., Swanson, SD., Fowlkes, JB., Emelianov, SY.: Shear Wave Elasticity Imaging: ANew Ultrasonic Technology of Medical Diagnostics. Ultrasound in Med. and Biol., 24(9), pp. 1419–1435, 1998.[4] Bercoff J, Tanter M, Fink M: Supersonic Shear Imaging: A New Technique for Soft Tissue Elasticity Mapping.IEEE Trans. UFFC, 51(4), pp. 396–409, 2004.[5] Nightingale K, McAleavey S, Trahey G: Shear Wave Generation using Acoustic Radiation Force: In Vivo andEx Vivo Results. Ultrasound Med Biol., 29(12), pp. 1715–1723, 2003.[6] Palmeri, ML., Wang, MH., Dahl, JJ., Frinkley, KD., Nightingale, KR.: Quantifying Hepatic Shear Modulus In Vivousing Acoustic Radiation Force. Ultrasound Med. Biol., 34(4), pp. 546–558, April, 2008.[7] Chen S, Fatemi M, Greenleaf JF.: Quantifying Elasticity and Viscosity from Measurement of Shear Wave SpeedDispersion. J Acoust Soc Am, 115(6), pp. 2781–5, June, 2004.34indicates Presenter
002 CARDIAC DEFORMATION MODEL FOR 3D STRAIN IMAGING.Chi Ma 1 , Hao Chen 2 , Tomy Varghese 1 .1 University of Wisconsin–Madison, Madison, WI, USA; 2 Emory University, Atlanta, GA, USA.Background: Cardiac strain imaging [1-4] is a promising modality for evaluating myocardial functionalityby imaging local and global strain distributions. Newer two–dimensional (2D) cardiac ultrasoundtransducers will enable three–dimensional (3D) cardiac strain imaging. However, most of currentechocardiography systems provide data only over small sections and typically only provide 3D B–modedata. A 3D cardiac deformation model is therefore essential for the development of strain estimationalgorithms for future 3D cardiac strain imaging or strain imaging applications.Aims: We propose to develop and incorporate 3D cardiac deformation models with simulated2D ultrasound transducers enabling evaluation and testing of 3D strain estimation algorithms.Methods: Finite element analysis (FEA) based canine heart model developed by the Cardiac MechanicsResearch Group at UCSD was used to construct a 3D numerical canine heart deformation model. Thisdata set contains the deformation of 1296 points located within the cardiac wall at a sampling rate of250Hz. The original motion vectors were resampled into 3D continuous smooth surfaces using non–linear3D interpolation. These finer displacement patterns were used to position scatterers and to track theirdeformation over the cardiac cycle, which was then incorporated into an ultrasound simulation program[5]. Approximately 1.1 million scatterers were positioned within the cardiac wall, for a number density ofaround 10 scatterers/cm 3 to ensure Rayleigh scattering statistics. A frequency domain based simulationprogram [1] for linear/phased array transducers is used to generate simulated ultrasound radiofrequency(RF) data. We obtained a total of 125 RF frames over a cardiac cycle under the 250Hz temporal framerate. A 2D multi–level strain estimation algorithm was used to estimate frame–to–frame localdisplacements, with B–Mode data used for the first cross-correlation step to estimate coarsedisplacements, with the final step using RF data with a 4 wavelength × 5 A–line windows with a 50%overlap to obtain the fine displacement estimates [6]. RF data along both parasternal short axis and longaxis of the left ventricle were generated and utilized for strain imaging. Statistically significant simulationresults using independent data sets will be presented.Results: We quantitatively compare the deformation of the cardiac wall obtained from ultrasound RFdata to actual scatterer movement or deformation (obtained from FEA). Eleven ROI numbered from one toeleven were used in the comparison as shown on the B–mode image (Figure 1). Estimated mean axialdisplacements and strains closely match the actual scatterer deformations for the eleven different ROI.Curve shapes comparing the mean estimated and actual displacement and strain for 4 of the ROI inFigures 2 and 3, respectively are almost identical, indicating displacement and strain tracking accuracy.Conclusions: A 3D cardiac deformation model is proposed for evaluating 3D displacement tracking andstrain estimation algorithms for cardiac strain imaging. Validation using ultrasound simulations and2D strain estimation methods show encouraging results.Acknowledgements: This work was supported by NIH grants 5R21EB010098 and R01CA112192.References:[1] E. Konofagou, J. D’Hooge, J. Ophir: Ultrasound Med Biol, Vol. 27, No. 4, pp. 475–82, 2002.[2] T. Varghese, JA Zagzebski, PS. Rahko, CS Breburda: Ultrason Imaging, 25(1), pp. 1–16, 2003.[3] S. Langeland, J. D'hooge, T. Claessens, et al.: IEEE Trans Ultrason Ferroel Freq Cont, 51(11), pp. 1537–46, 2004.[4] RG. Lopata, MM. Nillesen, CN. Verrijp, et al.: Phys Med Biol, Vol. 55, No. 4, pp. 963-79, <strong>2010</strong>.[5] Y. Li and J. A. Zagzebski: IEEE Trans Ultrason Ferroelectr Freq Control, Vol. 46, No. 3, pp. 690–699, 1999.[6] H. Chen and T. Varghese: Medical Physics, Vol. 36, No. 6, pp. 2098–2106, 2009.Figure 1: Short axis B–modeimage fromultrasound simulationFigure 2: Comparison of estimatedand ideal displacement at4 of the ROI’s shown inFigure 3: Comparison of estimated andideal axial strain at 4 of theROI’s shown in Figure 1.indicates Presenter35
014 ULTRASOUND ELASTOGRAPHY AS AN ADJUVANT TO CONVENTIONAL ULTRASOUND INTHE PRE–OPERATIVE DIAGNOSIS OF MALIGNANT AXILLARY LYMPH NODES IN PATIENTSWITH SUSPECTED BREAST CANCER: A PILOT STUDY.K Taylor 1 , S O’Keeffe 1 , MG Wallis 1 , RJ Housden 2 , GM Treece 2 .1 Cambridge Breast Unit, Box 97, Addenbrookes Hospital, Hills Rd, Cambridge CB2 2QQ, England,UK; 2 Engineering Department, University of Cambridge, Trumpington St, Cambridge CB2 1PZ,England, UK.Background: Axillary node status is the most important prognostic indicator for survival from breastcancer. Conventional ultrasound (US) is currently accepted as the imaging modality of choice in the pre–operative assessment of axillary lymph nodes (ALN). However, US has recognized limitations [1], includinga false negative rate which means that up to one third of ALNs with apparently normal node morphologyare in fact metastatic [2]. Hence, there is a need for an imaging adjunct to US to increase sensitivity.Ultrasound elastography (UE) has been investigated in a wide range of clinical applications, includingassessment of breast lesions, with limited research into identification and differentiation of lymph nodesgenerally. However, there are no published papers to date involving UE of axillary lymph nodes.Aims: To compare the use of UE with US in the diagnosis of malignant ALNs in patients with suspectedbreast cancer.Methods: 50 women with suspected breast cancer on US underwent routine imaging of ipsilateral ALNs,performed on a Toshiba Aplio ultrasound machine (Toshiba Medical Systems, Tochigi, Japan) followed byquasi–static UE performed using Stradwin software [3] interfaced to an Ultrasonix Sonix RP (UltrasonixMedical Corp., Richmond, Canada) ultrasound machine with an 8–16 MHz transducer. Elastograms werecreated and displayed in grayscale (white as soft, black as stiff), with conventional US images displayedsimultaneously side by side. UE images were visually scored 1–4 (normal–malignant) in terms of apparentstiffness and then compared with visual findings from US and the gold standard of surgical histology. Anumerical indication of stiffness was determined from UE by comparison of normalised strain in thelesion and background.Results: Of the 50 evaluated ALNs, 25 were normal on histology, indistinguishable from backgroundtissue on UE and had normal morphology on US. 25 ALNs were metastatic on histology. Those completelymetastatically replaced on US appeared uniformly stiff (black) on UE (Figure 1) and stiffnessmeasurements concurred with this. Evaluation of results is ongoing at present, but preliminary findingssuggest that ALNs appearing indeterminate on US nevertheless show a significant degree of stiffness onUE (Figure 2).Conclusions: For the first time it has been demonstrated that normal and abnormal axillary lymph nodescan be differentiated using UE both visually and with strain values. Practice is needed to perform UEsuccessfully in all cases and further research is necessary to consolidate these promising results.Acknowledgements: This work was supported by Translation Award 081511/Z/06/Z from the Wellcome Trust andthe National Institute for Health Research (NIHR) Cambridge Biomedical Research Centre (BMRC).References:[1] Alvarez S. et al.: Role of Sonography in the Diagnosis of Axillary Lymph Node Metastases in Breast Cancer: ASystemic Review. American Journal of Roentgenology, 186, pp. 1342–1348, 2006.[2] Britton P. et al.: Use of Ultrasound Guided Axillary Node Core Biopsy in Staging of Early Breast Cancer.European Journal of Radiology, 19, pp. 561–569, 2009.[3] Chen L et al.: Initial Clinical Experience of an Ultrasonic Strain Imaging System with Novel Noise–MaskingCapability. British Journal of Radiology, in press <strong>2010</strong>.Elastogram Sonogram Elastogram SonogramFigure 1: ALN is clear on both UE and US.Figure 2: ALN is indeterminate on US but apparent on UE.36indicates Presenter
025 CHARACTERIZATION OF STRAIN ELASTOGRAMS DURING LARGE TISSUE DEFORMATIONS.Hazel Marie 1 , Susheel Vadde 1 , Shalini Gadapa 1 , Harish Kukatla 1 , Yong Zhang 1 , John R. Sullins 1 .1 Youngstown State University, Meshell Hall, One University Plaza, Youngstown, OH, 44555, USA.Background: The majority of elastography studies deal with tissues under relatively small deformations.An investigation of biomechanical behavior of soft tissue undergone a very large deformation using anoninvasive elasticity imaging method is rare. However, in certain medical applications, it is highlydesirable to understand whether and how material property variations associated with large deformationscan be observed and evaluated in an elastogram [1, 2].Aims: To characterize the patterns and variations of optical strain elastograms of soft tissue exhibitedduring three deformation stages: linear, plastic and rupture. This type of information is potentially usefulfor assessing tissue damages and early detection of muscle micro–tears or micro–fractures.Methods: Thirty–one tissue samples harvested from the abdominal areas of hybrid rats were collected.The samples were cut into a roughly dumbbell shape with a width of 1.8–2.5cm at both ends and 0.7–1.3cm in the middle. The sample length is about 8–11cm. With a standard Instron Tensiometer (Model5500R), a sample was vertically stretched until it reached a breaking point. The entire deformationprocess was recorded with a SONY HD camcorder. The inter–frame displacement was computed using anoptical flow algorithm, and a strain elastogram was obtained by taking the first order derivative of thedisplacement data.Results: As can be seen in the figures below, strain elastograms showed distinctive patterns in threedeformation stages. In the linear stage, strain pattern was relatively uniform or randomly distributed,suggesting that the original structure of muscle fiber was well maintained which is essential to have alinear response to external forces. In the plastic stage, tissue structure started to differentiate, showinghigher strain values at the bottom of sample, indicating that permanent damage has been done to thetissue that was under a continuous tensile stress. Finally, in the rupture stage, a zone of large strainvalues was observed that corresponds to the location where the sample was completely broken.Conclusions: Biomechanical tensile tests using thirty–one rat tissue samples demonstrated that anoptical strain elastogram has the potential of providing a quantitative spatial description of tissueproperty changes during three deformation stages.Acknowledgements: This work was partially supported by Ohio Board of Regents Research Incentive Grant #34241,Youngstown State University URC Grant 08–#8, and St. Elizabeth Health Center.References:[1] W.E. Garrett Jr.: Muscle Strain Injuries: Clinical and Basic Aspects. Medicine & Science in Sports & Exercise,22(4). pp. 436–443, 1990.[2] R.D. Boutin, R.C. Fritz, and L.S. Steinbach: Imaging of Sports–Related Muscle Injuries. Magnetic ResonanceImaging Clinics of North America, 11(2), pp. 341–371, 2003.Figure 1:A tissue sample andits strain elastogramin liner deformation.Figure 2:A tissue sample andits strain elastogramin plastic deformation.Figure 3:A tissue sample andits strain elastogramduring rupture stage.indicates Presenter37
027 STRAIN MAPPING BY IMAGE CORRELATION FOR X–RAY ELASTOGRAPHY.Byung H. Han 1 , Min H. Cho 1 , Soo Y. Lee 1 .1 Kyung Hee University, 1 Seochun, Kiheung, Yongin, Kyungki, SOUTH KOREA.Background: Ultrasound images and magnetic resonance (MR) images have lower resolution than X–rayimages for elastography [1,2]. The high noise level in ultrasound imaging causes the poor quality of anelasticity image due to the uncertainty of signal in the reconstruction process of inverse problem. The MRelastography also needs the additive devices which produce oscillating pulses. The X–ray elastographyusing the image correlation technique with the image sets of pre– and post–compression has advantagesof high resolution owing to short wavelength of X–rays [3] and low–cost realization with a simplecompressing device in tomosynthesis or tomography [4].Aims: To calculate the strain map with a breast–mimicking phantom as a feasibility study of X–rayelastography.Methods: A breast–mimicking phantom is made of epoxy which consists of a soft background and a hardinclusion around the center (Figure 1). The stiffness level of the soft and hard parts is controlled by theamount of polyamine hardener. In order to mimic glandular ducts of the breast, the phantom containsthe tree–shaped red algae soaked into the contrast agent (Omnipaque 300, GE Healthcare, USA) in thesoft part as well as the hard part. The Young’s moduli of the soft background and the hard inclusion are60kPa and 2800kPa, respectively. We acquired images of the phantom pre– and post–compression withthe depth of 2.66mm in the homemade micro–computed tomography (micro–CT) using a micro–focusX–ray source (L8121–01, Hamamatsu, Japan) and a flat–panel detector (C7943CP–02, Hamamatsu,Japan). In order to calculate the strain map, first, we measured the displacement vectors from the 3Dmicro–CT images with and without compression using segmentation and digital image correlationtechniques. We made the FEM simulation with ANSYS (ANSYS Inc., USA) for the comparison of the strainmap with the experimental data.Results: Experimental results and simulation data are shown in Figure 2.(a) (b) (c) (d)Figure 1: A breast-mimickingphantom.Figure 2: (a) Image before compression, (b) image aftercompression, (c) z–directional strain map in segmentedregions, (d) z–directional strain map in FEM simulation.Conclusions: There are common–low strains in the vicinity of the hard part in the simulated strain mapand the experimental strains of the segmented regions mimicking glandular ducts and cancerous tissueswith high intensity in X–ray images. The proposed method of strain calculation is expected to give thevaluable information to find stiff abnormal areas over the other imaging modality.Acknowledgements: This work was supported by grants from the National Research Foundation of Korea(No: 2009–0078310).References:[1] K. Nightingale, S. McAleavey, G. Trahey: Shear–Wave Generation using Acoustic Radiation Force: In Vivo andEx Vivo Results. Ultrasound in Medicine and Biology, Vol. 29, pp. 1715–1723, 2003.[2] A. Manduca, T.E. Oliphant, M.A. Dresner, J.L. Mahowald, S.A. Kruse, E. Amromin, J.P. Felmlee, J.F. Greenleaf,R.L. Ehman: Magnetic Resonance Elastography: Non–Invasive Mapping of Tissue Elasticity. Medical ImageAnalysis, Vol. 5, pp. 237–254, 2001.[3] S.C. Lee, H.K. Kim, I.K. Chun, M.H. Cho, S.Y. Lee, M.H. Cho: A Flat-Panel Detector Based Micro-CT System:Performance Evaluation for Small-Animal Imaging. Physics in Medicine and Biology, Vol. 48, pp. 4173–4185, 2003.[4] J.M. Park, E.A. Franken, M. Garg, L.L. Fajardo, L.T. Niklason: Breast Tomosynthesis: Present Considerationsand Future Applications. RadioGraphics, Vol. 27, pp. S231–S240, 2007.38indicates Presenter
051 NANO–SCALE SHEAR WAVE MEASUREMENTS USING SWEPT-SOURCE OPTICALCOHERENCE TOMOGRAPHY (OCT).A Grimwood 1 , JC Bamber 2 , J Holmes 3 , P Tomlins 4 , Q Pankhurst 1 .1 Royal Institution of Great Britain, London, England, UK; 2 Institute of Cancer Research, Sutton,Surrey, England, UK; 3 Michelson Diagnostics Ltd., Orpington, Kent, England, UK; 4 NationalPhysical Laboratory, Teddington, Middx, England, UK.Introduction: Shear waves generated with a surface indenter were measured using optical coherencetomography. Analyzing phase information from the image data allowed detection of displacements withamplitudes estimated to be as small as ~20nm. Displacement frequencies were also measured via FourierTransform to produce spectra containing peaks at the indenter frequency.Background: Swept–source optical coherence tomography (OCT) is an optical imaging modality with aresolution on the micron–scale. Displacements significantly smaller than the system’s pixel size (
054 IN VIVO EVALUATION OF FREEHAND STRAIN IMAGING ON BENIGN AND MALIGNANTBREAST LESIONS.Elisabeth Brusseau 1 , Valérie Detti 1 , Agnès Coulon 2 , Emmanuele Maissiat 2 , Nawèle Boublay 3 ,Yves Berthezène 2 , Jérémie Fromageau 4 , Nigel Bush 4 , Jeffrey C. Bamber 4 .1 CREATIS–LRMN; CNRS UMR5220; Inserm U630; INSA–Lyon; Université Lyon 1, Bât. BlaisePascal, 7 av. Jean Capelle, 69621 Villeurbanne, FRANCE; 2 Service de Radiologie, HôpitalCroix–Rousse, 69004 Lyon, FRANCE; 3 Pôle Imagerie/IMER, Les Tilleuls, 52 Bd Pinel, 69677 BronCedex 03, FRANCE; 4 Institute of Cancer Research, 15 Cotswold Rd, Sutton, Surrey SM2 5NG, UK.Background: Breast cancer is the most common cancer in women worldwide. In the USA, for the year2009, 192,370 new cases of invasive breast cancers and 40,170 female deaths were estimated [1]. In thisstudy, the objective is to evaluate the performance of our 2D locally regularized strain estimationtechnique [2] with clinical data, by examining breast lesions during clinical routine. Our method alreadyprovided easily interpretable strain images with data acquired in a freehand configuration onelastography–dedicated phantoms and ex vivo dog tissue lesions [3].Aims: Assessing the quality of strain images with 5 clinical cases of benign and malignant breast lesions.Methods: Our 2D locally regularized strain estimation method computes the deformation relatedparameters (translations and scaling factors) as those that produce the best match between an initialultrasound radio frequency (RF) region and its deformed version. In practical terms, the parameterestimation is performed through the constrained maximization of the normalized correlation coefficient (orNCC) between regions. When a parameter estimate is detected as insufficiently reliable (NCC
057 IMAGING OF CARDIOVASCULAR WALL–FLOW COUPLING IN VIVO.Jianwen Luo 1 , Elisa E. Konofagou 1,2 .1 Ultrasound and Elasticity Imaging Laboratory, Biomedical Engineering Department, 2 RadiologyDepartment, Columbia University, New York, NY, USA.Background: Speckle tracking–based methods have been developed to estimate cardiovascular wallmotion in normal and pathological cases in vivo [1–3], while blood flow velocity is routinely measured inthe clinic. The mechanical property and geometry changes as a result of disease may affect both wallmotion and blood flow, while the latter two are also coupled and influence one another [4,5].Simultaneous and registered imaging of both cardiovascular wall motion and blood flow velocity maycontribute to more complete computational models of cardiovascular mechanical and fluid dynamics andincrease understanding of their interaction, as well as provide additional diagnostic information.Aims: To determine the feasibility of imaging the coupling of cardiovascular wall motion with blood flowin vivo.Methods: A high frame rate data acquisition system previously described [1] was used here. A normaland an infarcted murine left ventricle (with left anterior descending coronary artery ligation) [2], and anormal and an aneurysmal (with Angiotensin II infusion) abdominal aorta [3] were scanned inlongitudinal view with a 30MHz ultrasound probe (VisualSonics Inc., Toronto, Canada). With aretrospective ECG gating technique, 2D radio frequency (RF) frame sequences in a complete cardiac cyclewere reconstructed at the very high frame rate of 8kHz [1–3]. The axial wall velocity and blood flowvelocity were simultaneously estimated from the same RF data using a time–efficient 1D normalizedcross–correlation technique previously described [6].Results: Simultaneous, correlated, spatially and temporally registered imaging of both cardiovascularwall motion and blood flow in murine left ventricle and aorta was shown to be feasible over the entirecardiac cycle. In the normal aorta, the wall motion (0.4cm/s) and flow velocity (10cm/s) were uniformand synchronized along the entire vessel imaged. The aortic wall expanded as the blood flow velocityincreased during systole. The wall motion and flow velocity were thus well coupled and correlated. In theaneurysmal aorta, reduced and spatially varied wall motion (10 folds) wasdetected in the infarcted left ventricle, while vortex flow patterns were imaged in diastolic phases of bothnormal and infarcted left ventricles. More synchronized coupling between myocardial wall motion andblood flow was depicted in the normal heart, where the blood moves towards the interventricular septum(>8cm/s) after the mitral valve opens (i.e., rapid filling phase), and the septal wall simultaneouslyundergoes outward motion (>2cm/s). In the infarcted heart, however, the basal septum moves in therapid filling phase, about 20ms before the mitral valve opens and the blood moves.Conclusions: Cardiovascular wall motion and blood flow and their respective coupling weresimultaneously imaged in mice in vivo. This information may provide important information for thediagnosis of cardiovascular disease as well as essential parameters for biomechanical modeling of thefluid–solid interaction between the blood and the cardiovascular wall.Acknowledgements: This work was supported in part by the NIH (1R01HL098830).References:[1] Pernot et al.: ECG–Gated, Mechanical and Electromechanical Wave Imaging of Cardiovascular Tissues In Vivo.Ultrasound Med. Biol., 33(7), pp. 1075–1085, 2007.[2] Luo et al.: Myocardial Elastography at Both High Temporal and Spatial Resolution for the Detection of Infarcts.Ultrasound Med. Biol., 33(8), pp. 1206–1223, 2007.[3] Luo et al.: Pulse Wave Imaging of Normal and Aneurysmal Abdominal Aortas In Vivo. IEEE Trans. Med. Imaging,28(4), pp. 477–486, 2009.[4] Edvardsen et al.: Interaction between Left Ventricular Wall Motion and Intraventricular Flow Propagation inAcute and Chronic Ischemia. Am. J. Physiol.–Heart Circul. Physiol., 289(2), pp. H732–H737, 2005.[5] Watanabe, et al.: Computer Simulation of Blood Flow, Left Ventricular Wall Motion and Their Interrelationship byFluid–Structure Interaction Finite Element Method. JSME Int. J. Ser. C, 45(4), pp. 1003–1012, 2002.[6] Luo and Konofagou: A Fast Normalized Cross–Correlation Method for Motion Estimation. IEEE Trans. Ultrason.Ferroelectr. Control, 57(6), pp. 1347–1357, <strong>2010</strong>.indicates Presenter41
059 ARF–DRIVEN ASSESSMENT OF IN VIVO MYOCARDIAL CYCLIC STIFFNESS VARIATION.Richard Bouchard 1 , Stephen J. Hsu 1 , Mark L. Palmeri 1 , Ned C. Rouze 1 , Gregg E. Trahey 1 .1 Duke University, Durham, NC, USA.Background: A noninvasive means of assessing myocardial elasticity would be of tremendous value indiagnosing cardiac disease, which often manifests itself as changes in tissue stiffness. Acoustic radiationforce (ARF)–driven techniques have demonstrated their ability to discern elastic properties of soft tissue. Forthe purpose of myocardial elasticity imaging, a novel ARF–based imaging technique, the displacement ratiorate (DRR) method, was developed. The advantages of this new method are that it requires a relatively smalltemporal (
092 BREAST CANCER DIAGNOSIS USING NONLINEAR ELASTICITY IMAGING: SOME INITIALRESULTS.S. Goenezen 1 , Z. Sink 1 , A.A. Oberai 1 , J.–F. Dord 1 , P.E. Barbone 2 , J. Jiang 3 , T.J. Hall 3 .1 Rensselaer Polytechnic Institute, Troy, NY, USA; 2 Boston University, Boston, MA, USA;3 University of Wisconsin–Madison, Madison, WI, USA.Background: Recent ex–vivo measurements of breast tissue samples have revealed that both benign andmalignant tumors exhibit elevated linear elastic modulus. However, malignant tumors tend to stiffen at afaster rate with overall applied strain when compared with benign tumors [1]. This opens the possibilityof using images of nonlinear elastic parameters for distinguishing malignant and benign tumors.Aims: The goal of this study is to determine whether nonlinear elasticity images can be used todifferentiate benign and malignant breast tumors.Methods: Displacement data from ten patients (five fibroadenomas and five invasive ductal carcinomas) wereused. The details of the study as well as the associated compliances are described in [2]. A freehandcompression technique was used to induce displacements with maximum overall strain in the range of 20%.The displacements were obtained using a guided–search block–matching algorithm described in [3].Displacement estimates were obtained on a 200*200 micron grid and were down–sampled by a factor of fourfor the modulus reconstructions. For the modulus reconstruction, an incompressible plane stress model wasassumed, and two deformation fields, one at an overall strain of about 1% and another at a strain of about12%, were utilized. An exponential strain energy density function with two parameters, the shear modulus atsmall strain and a nonlinear parameter that quantified the level of strain hardening, was used. The inversealgorithm is described in [4]. The shear modulus distribution was determined up to a multiplicative parameterusing the small deformation displacement field, and, thereafter, the nonlinear parameter was determined upto an additive constant using the large deformation displacement field. Total Variation Diminishing (TVD)regularization was used for the shear modulus and the nonlinear parameter. B–mode ultrasound and linearelastic modulus images were used to locate the extent of the tumor. Once the tumor location was determined,average values of the linear shear modulus and the nonlinear parameter were evaluated.Results: The following trends were observed and quantified: (1) The contrast in the linear elastic modulusbetween the tumor and the background was about the same for benign and malignant tumors. (2) Thecontrast in the nonlinear parameter between the tumor and the background for malignant tumors wassignificantly greater. The Figure1a and b represent material reconstructions for fibroadenoma (FA), whereasFigure 1c and d are from an invasive ductal carcinoma (IDC). Mu is the shear modulus and gamma is thenonlinear parameter. One can observe that gamma is much larger for IDC than for FA within the tumor.Figure 1: (a) (b) (c) (d)Conclusions: Using a small set of data, an initial attempt was made to test the utility of nonlinearelasticity imaging in diagnosing malignant breast tumors. Encouraging results were obtained thatconfirmed that with increasing overall applied strain, malignant breast tumors stiffen more steeply thanbenign breast tumors. Further work involves generating three–dimensional images, the use of moreaccurate material models and better understanding of the role of regularization.Acknowledgements: We acknowledge the support of NIH Grants R01CA100373, R21CA133488 and R01CA140271.References:[1] O'Hagan, JJ and Samani, A: Measurements of the Hyperelastic Properties of 44 Pathological Ex Vivo BreastTissue Samples. Physics in Medicine and Biology, 54, pp. 2557–2569, 2009.[2] Burnside ES, Hall TJ, Sommer AM, et al.: Using Ultrasound Strain Imaging to Distinguish Benign and MalignantSolid Breast Masses. Radiology, 245(2), pp. 401–410, 2007.[3] Jiang J and Hall TJ: A Generalized Speckle Tracking Algorithm for Ultrasonic Strain Imaging using DynamicProgramming. Ultrasound Med Biol, 35(11), pp. 1863–1879, 2009.[4] NH Gokhale, PE Barbone and AA Oberai: Solution of the Nonlinear Elasticity Imaging Inverse Problem: TheCompressible Case. Inverse Problems, 24 045010, 2008.indicates Presenter43
100 LATERAL MOTION COMPENSATION IN ULTRASOUND STRAIN IMAGING.Mok–Kun Jeong 1 , Sung–Jae Kwon 1 , Myung–Ki Park 1 , Moo–Ho Bae 2 , Dong–Kuk Shin 31 Electronic and Communication Engineering Departments, Daejin University, Pocheon, Gyeonggi,KOREA; 2 Electronic Engineering Department, Hallym University, Chuncheon, Gangweon, KOREA;3 Medison Research Institute, Seoul, KOREA.Background: In strain imaging based on manual palpation, the compressed tissue in the human bodyundergoes 3–D displacements. To reduce the amount of computation, current ultrasound strain imagingsystems produce strain images by estimating 1–D displacements along the direction of the scan line(axial). Thus, displacements, if any, perpendicular to the scan line direction (lateral) increase signaldecorrelation, incurring errors in the estimated displacements. Lateral displacements are estimated usingan autocorrelation method and are used to improve the strain image quality.Aims: Among 3–D motion, the motion in the elevation direction does not significantly affect the axialdisplacement estimation because the ultrasound beam resolution in that direction is relatively low. So themotion in the lateral direction is mainly responsible for errors in estimating the displacement in the axialdirection. Thus, our goal is to reduce errors in estimating axial displacements by taking into accountlateral motion.Methods: Displacements in the axial direction are estimated by applying an autocorrelation method tocomplex data obtained by demodulating the pre– and post–compression ultrasound signals. Followingcompensation of axial motion using the estimated axial displacements, what remains is a dataset withlateral motion only. A 1–D data sequence is formed by taking samples in the dataset at the same depthand collecting them in the lateral direction. The data sequence is converted into an analytic signal, whichis complex, by the use of 1–D spatial Hilbert transform. Lateral displacements are estimated by applyingan autocorrelation–based displacement estimation technique to the analytic signal. Chen et al. [1] took a2–D frequency domain approach, followed by phase–based zero–crossing detection. The estimated lateraldisplacement information is applied to the original scan lines to produce new lateral–motion–compensated scan lines using linear interpolation [2]. With the original and the new scan lines that havebeen compensated for axial and lateral motions available, the estimation of axial displacements wasperformed again to obtain compensated estimates. Experiments were carried out to confirm thealgorithm. A 10 mm diameter cylindrical inclusion five times stiffer than the background was embeddedin a homogeneous phantom. Under external compression, the vicinity of the inclusion underwentsignificant lateral motions. Ultrasound data were acquired by applying 1% compression using a clinicalscanner (Accuvix V10, Medison) with a linear array transducer (L15–12).Results: Figure 1a shows strain images before and Figure 1b after compensation of lateral motion. Thestrain image after lateral motion compensation shows a more uniform background area than the strainimage before lateral motion compensation. The maximum lateral displacement in the background wasfound to be 2.17 scan lines (0.43 mm). An SNR improvement of 12.7 dB was achieved in the backgroundregion to the right of the inclusion.Conclusions: The axial and lateral displacements are finely estimated from the analytic signal obtainedthrough the use of Hilbert transform. Experiments on a phantom demonstrate that the strain imagequality is improved after lateral motion compensation.(a)(b)Figure 1: (a) Strain image before lateral motioncompensation and (b) strain image afterlateral motion compensation.Acknowledgements: This work was supported by Medison.References:[1] X. Chen, M. J. Zohdy, Y. Emelianov, and M. O’Donnell: Lateral Speckle Tracking Using Synthetic Lateral Phase.IEEE Trans. UFFC, Vol. 51, No. 5, pp. 540–550, 2004.[2] E. Konofagou and J. Ophir: A New Elastographic Method for Estimation and Imaging of Lateral Displacements,Lateral Strains, Corrected Axial Strains and Poisson's Ratios in Tissues. UMB, Vol. 24, No. 8, pp. 1183–1199, 1998.44indicates Presenter
103 TISSUE MICRO–MOTION IN HUMAN ERECTOR SPINAE AND QUADRICEPS MUSCLESOBSERVED IN VIVO USING ULTRASOUND ELASTOGRAPHY TECHNIQUES.James R. Fox 1 , Helene M. Langevin 1 , Cathryn Koptiuch 11 University of Vermont, C–448 Given, Burlington, VT 05405, USA.Background: Ultrasound based elastography techniques provide, in their first order, a local assessmentof tissue displacement. These measures can, depending on the physical and computational parametersused in capturing and processing the data, provide very high resolution displacement maps fromsequential radiofrequency (RF) data capture, often on the order of microns. We have been using thesetechniques to describe both axial and lateral connective tissue displacements in response to variousmechanical inputs including acupuncture and passive trunk motion. We have observed that when time–sequenced RF data are collected over a stationary target field, there is a repeatable and predictablestructure to the signal that can be modified by the orientation of the transducer with respect theunderlying muscle orientation. This signal displays a fairly typical frequency and frequency/amplitudecontent for each orientation.Aims: To quantify and describe the low frequency micro–motions observed in the erector spinae andquadriceps muscles.Methods: Sixteen subjects, (Male:9, Mean Age:34, Mean BMI:25.8; Female:7, Mean Age:34, MeanBMI:23.6) were tested. An ultrasound scanner (Terason, Model 3000) with a 5–12MHz, 7.5MHz centerfrequency, transducer was used. The cineloop frame rate was 25fps. For measurements of the erectorspinae, subjects were positioned prone on a table. The L2–3 interspace was identified by manualpalpation. The ultrasound transducer was positioned 1.9cm lateral to the midline, centered on the L2–3interspace, oriented parallel to the spine and held in place with a clamp. Additional measures were madeafter rotating the transducer 35, 45, 70, and 90 degrees from this orientation. The subject was instructedto complete a normal inhalation and then hold his/her breath for the duration of a 10 second datacollection. For quadriceps measurement, the subject was positioned supine on a table. The transversemidpoint of the muscle was located using ultrasound imaging 15cm proximal to the knee. The RF datawere used to determine lateral displacement using standard elastography cross–correlation techniqueswithin a 10mm wide by 1mm deep zone located at the junction of the muscle and the deep fascia. An FFTof the lateral displacement data using a 250 point Hann window was determined.Results: The FFT revealed a typical low frequency content with dominant peaks near 4Hz, the magnitudeof these peaks varying with the transducer orientation with respect to the underlying muscle. Figure 1shows the composite FFT data for all 16 subjects showing the differences in frequency content of lateraldisplacement signals derived from the erector spine. A similar pattern was observed in the rectus femorismuscle.Conclusions: The data suggest an interesting relationship between the small, low frequency lateralmicro–motions observable using ultrasound elastography and the directionality of the ultrasoundtransducer orientation. It is speculated that there may be a relationship of this motion to a phenomenonof muscle vibrations that emit a detectable sound and that can be quantified using acoustic myographytechniques, or may be transducer induced as in vibrography.Acknowledgements: This project was funded by NCCAM RO1–AT003479.Figure 1: Composite FFT's of allsubjects for longitudinal andtransverse orientations of theultrasound transducer.indicates Presenter45
107 REAL–TIME GRAPHICS PROCESSING UNIT BASED ULTRASOUND ELASTOGRAPHY.N.P. Deshmukh 1 , H. Rivaz 1 , P.J. Stolka 1 , H. Kang 1 , G.D. Hager 1 , M.E. Alaf 2 , E.M. Boctor 1,3 .1 Johns Hopkins University, Baltimore, MD, USA; 2 Johns Hopkins Medical Institutions, Baltimore,MD, USA; 3 Johns Hopkins Medicine, Baltimore, MD, USA.Background: Elastography involves imaging the mechanical properties of tissue and has numerous clinicalapplications [1]. With the quasi–static elastography approach, tissue strain is generated by compressing thetissue and taking the pre– and post–compression ultrasound (US) images under freehand palpation.Real–time elastography has numerous applications e.g. in the detection of cancer tumors, ablationmonitoring, etc. The graphics processing unit (GPU) hardware frees the CPU on an US machine to performother useful tasks, and it is cheap and requires low maintenance compared to an array of clusters. Thereare other real–time implementations based on DSP/FGPA processors, but these systems need specializedhardware. GPU processors can be connected via PCI express slot available on most modern systems whicheases portability and allows use on the existing hardware. It is easier to program GPUs than DSPs andFGPAs. The performance of GPUs in terms of floating point computation is better than FGPAs [2,3].Aims: Real–time implementation of normalized cross–correlation (NCC) and AnalyticMinimization/Dynamic Programming (AM/DP) elastography on the GPU to facilitate the development of acheap and compact system that is easily deployable in an operating room. A speed comparison of NCCand AM/DP with their corresponding serial implementation has been shown.Methods: NCC elastography involves cross–correlation of small windows in pre– and post–compressionimages. The number of output strain samples is equal to these search windows. This essentially meanswe get data–independence for the output strain, so we can parallelize cross–correlation computation ofthese small windows. These windows are chosen along the radiofrequency (RF) lines, which is along thedirection of compression [4]. DP elastography involves fast optimization of the cost function for findingthe minimum displacement along the RF lines. DP elastography calculates integer displacement costfunction. For sub–integer displacement, AM elastography is used. In serial implementation of AM/DP,computation of cost function is done from left to right in the lateral direction of image pairs andcomputation of cost function for a RF–line takes the weighted cost function from the previous RF–line asinput. In parallel implementation, AM/DP is individually applied to each of the RF lines on different coresof the GPU with parallelization of some intermediate steps to get the strain output [5].Results: In this work, a speed of 285fps (frames per second) for the parallel NCC algorithm was obtainedcompared to 30fps for the serial NCC algorithm on C, for an RF image of 641 samples and 71 RF lines.For the parallel AM/DP algorithm on the GPU, a speed of 5fps compared to 0.5fps was obtained for thesame serial implementation of AM/DP on C function in Matlab, for an RF image of 1040 samples and256 RF lines. Figures 1 and 2 show output from NCC and AM/DP elastography. The vertical artifacts inFigure 2 occur due to the parallel version of AM/DP algorithm not taking input from previous RF lines.Figure 1: Elastogram outputfrom NCC elastography.Figure 2: Elastogram output fromAM/DP elastography.Conclusions: We attain an approximately 10 times improvement in the running time of NCC and AM/DPelastography methods compared to their serial implementations. The parallel implementation of AM/DPelastography generates artifacts (which are not present in the serial implementation [5]) which will befocus of the future research.Acknowledgements: This work was supported by NCI SPORE Grant P50CA58236.References:[1] Ophir et al.: Elastography: A Quantitative Method for Imaging the Elasticity of Biological Tissues. UltrasonicImaging, Vol. 13, Is. 2, pp. 111–134, April 1991.[2] D.B. Thomas et al.: Double–Precision Floating–Point Performance of Computational Devices: FGPAs, CPUs andGPUs. ACM/SIGDA International Symp. on Field-Programmable Gate Arrays, pp. 63–72, 2009.[3] Miaoqing et al.: Accelerating Double Precision Floating–Point Hessenberg Reduction on FPGA and MulticoreArchitectures. Proc. of <strong>2010</strong> SAAHPC’10, Knoxville, TN, USA, (in press), <strong>2010</strong>.[4] N Deshmukh et al.: GPU–Based Elasticity Imaging Algorithms. MICCAI–GRID Workshop, pp. 45–54, 2009.[5] Rivaz H et al.: Real–Time Regularized Ultrasound Elastography. IEEE Trans. Medical Imaging, (in press).46indicates Presenter
Session MIP–1: Methods for Imaging Elastic Tissue Properties – ISunday, October 17 8:00A – 10:00A035 SHEAR WAVE ELASTOGRAPHY OF THE KIDNEY: PRE–CLINICAL STUDY ON A KIDNEYFIBROSIS MODEL AND CLINICAL FEASABILITY STUDY ON 70 HUMAN RENALTRANSPLANTS.Jean–Luc Gennisson 1 , Nicolas Grenier 3 , Regis Hubrecht 3 , Lionel Couzy 3 , Yahsou Delmas 3 ,Marc Derieppe 1 , Sébastien Lepreux 3 , Aline Criton 2 , Jeremy Bercoff 2 , Mickaël Tanter 1 .1 Institut Langevin–Ondes et Images, ESPCI ParisTech, CNRS UMR7587, INSERM U979, Paris,FRANCE; 2 Supersonic Imagine, Aix en Provence, FRANCE; 3 Service de Néphrologie, HôpitalPellegrin, Bordeaux, FRANCE.Background: An increasing number of patients is affected by chronic kidney disease (CKD) world whilewith ensuing end–stage renal disease (ESRD). A change in global approach to CKD from costly treatment ofESRD to more aggressive primary and secondary prevention is imperative. This improvement needs a betterunderstanding of mechanisms underlying renal scarring and a development of specific therapies to slow theprogression and development of modern diagnostic tools to characterize these underlying processes. Thenumber of patients with ESRD underestimates CKD has probably grown by more than a factor 50 in thelast ten years due to initiation factors as hypertension, diabetes, hyperlipidemia, obesity or smoking.Aims: In this work, the Supersonic Shear Imaging technique (SSI) was proven to be able to provide aquantitative follow up of kidney fibrosis on rats. Then, the technique was adapted on curved probes andproposed to map the in vivo viscoelastic properties of human renal transplants and compared with biopsy.Methods: The SSI technique is based on the radiation force induced by a conventional ultrasonic probe,to generate a planar shear wave deep into tissues. Then shear wave propagation throughout the mediumis caught in real time thanks to an ultrafast ultrasound scanner (5000 frames/s). Lastly, a time of flightalgorithm applied on these data allows computing a map of the shear wave velocity of the kidney. Afollow–up study for 8 weeks on a model of glomerulosclerosis induced by L–Name on 50 rats has beenconducted in order to investigate the accuracy of the technique. Quantitative maps of the kidney cortexwere performed with an 8MHz linear probe. On human renal transplants, quantitative maps of the cortexelasticity were produced for each patient with a 2.5MHz curved array.Results: In the animal study, the results show an increase of the elasticity of the cortex of the kidney intime with a Young’s modulus ranging from 9 to 25kPa. Results are compared to histological measurementas proteinuria and or quantification of fibrosis with trichrome. On human renal transplants, three groupswere studied: a control group, subjects with an early or late nonfunctional transplant. The resultsobtained using a curved ultrasonic probe show an 8cm depth by 10cm width map of the Young’smodulus for the 70 patients. Elasticity varies between groups from 9 to 50kPa. Results were compared tohistology and showed a good agreement between fibrosis markers and Young’s modulus.Conclusions: Here we have demonstrated the feasibility of inducing shear waves using the supersonicshear imaging technique in vivo in rats and human kidneys. The good reproducibility and accuracy of theshear elasticity are discussed. The elasticity was proved to be clearly related to kidney fibrosis. As fibroticprocess is responsible for the development of most CKD, noninvasive identification and follow–up of thisprocess could improve renal prognosis if adapted targeted therapies can be applied.(a)(b)Figure 1: Ultrasound imaged in gray scale and elasticity mapping in color of: (a) a pathological rat kidney after 4weeks of diet inducing renal fibrosis; (b) a human renal transplant from the control group. Vertical axes arein cm and the color scale in kPa.indicates Presenter47
004 IMAGING TISSUE MECHANICAL PROPERTIES BY TRACKING HIGH AMPLITUDE SHEARWAVES GENERATED VIA TRANSIENT NEEDLE PERTURBATION.Ryan J. DeWall 1,2 , Tomy Varghese 1,2 and Ernest L. Madsen 1 .1 Medical Physics, 2 Biomedical Engineering Departments, University of Wisconsin–Madison,1111 Highland Ave., Madison, WI, USA.Background: Abdominal ablation procedures provide a minimally invasive alternative to surgical resectionfor some hepatic tumors. Ultrasound imaging is often used for needle guidance because of its real–timeimaging capabilities. However, traditional ultrasound imaging has been shown to be a poor modality formonitoring ablation procedures because of the unpredictable variation in the echogenic properties ofablated and untreated tissue. Small displacement of the radiofrequency (RF) needle or microwave antennahas been used to generate strain images, which have been shown to delineate ablated volumes. However,strain is not an inherent mechanical property of tissue. Measurement of Young’s Modulus provides morequantitative information. Shear wave tracking techniques such as acoustic radiation force imaging (ARFI)can be used to quantify shear wave velocity (SWV), which is proportional to Young’s Modulus [1].Aims: We propose using transient perturbation of the RF needle or microwave antenna to generate shearwaves and determine SWV in the ablated and surrounding untreated tissue. This was validated inphantoms and tested ex vivo.Methods: Two gelatin–oil dispersion phantoms were used in this study. Phantom 1 contained a stiffellipsoid (E = 28.0kPa, SWV = 3.06m/s) bonded to a 1.6mm diameter stainless steel rod in a softbackground (7.8kPa, SWV = 1.61m/s). Phantom 2 was similar but also contained a partially ablatedregion (15.2kPa, SWV = 2.25m/s). A piezoelectric actuator provided a 100 micron perturbation to the rod.The resulting shear waves were tracked using an Ultrasonix SonixTOUCH scanner and an L14–5/38transducer. A GUI developed using the Texo SDK facilitates high frame rate tracking of the shear waves.Four tracking locations (~0.3mm spacing) were sequentially scanned at a frame rate of 2600Hz for asingle perturbation. For the proceeding perturbation, the next four locations were sequenced. Thisprocess was repeated across the face of the transducer. The time–to–peak tracking method was used togenerate SWV images. Finite element analysis (FEA) models of the phantoms were compared to thephantom results. The technique was then tested ex vivo on ablations created in bovine liver tissue.Results: Our results show good boundary demarcation between the ellipsoid and the surroundingbackground in Phantom 1 (Figure 1). SWV in ROIs in the ellipsoid (two averaged, black ROIs in Figure 1)and background (two averaged, white ROIs in Figure 1) were 3.13 and 1.57m/s, respectively. Goodboundary demarcation was also shown in Phantom 2. SWV in the ellipsoid, partially ablated region andsurrounding background were 3.23, 2.06, and 1.52m/s, respectively. FEA and phantom results showedgood agreement. SWV reconstructions ex vivo overestimated the SWV in the ablated volumes but providedoverall good delineation of the ablated region from the surrounding untreated tissue.Figure 1: a) B–mode and (b–d) shearwave velocity images fromPhantom 1. (a) (b) (c) (d)Conclusions: These results show the feasibility of generating and tracking shear waves using transientelectrode perturbation. Good boundary delineation was observed, and differences between ablated andpartially ablated regions were detectable.Acknowledgements: This work is supported in part by NIH grants R01 CA112192–04, R01 CA112192–S103 andT32 CA09206–31.References:[1] Palmeri ML, Wang MH, Dahl JJ, Frinkley KD, and Nightingale KR: Quantifying Hepatic Shear Modulus In Vivousing Acoustic Radiation Force. UMB, 34(4), pp. 546–58, 2008.48indicates Presenter
007 A NEW METHOD FOR THE ACQUISITION OF STRAIN IMAGE VOLUMES.RJ Housden 1 , C Uff 2 , L Chen 1 , AH Gee 1 , GM Treece 1 , RW Prager 1 , JC Bamber 2 .1 Engineering Department, University of Cambridge, Cambridge, England, UK; 2 Institute of CancerResearch, Sutton, Surrey, England, UK.Background: 3D axial strain imaging is potentially useful for producing a complete picture of theanatomy and accurately measuring the volume of stiff or soft inclusions. Currently, there are twoapproaches to quasistatic 3D strain imaging. The Frame Sequence method uses a conventional 2D probeapplying a continuous axial oscillatory motion to produce a sequence of 2D axial strain imagesdistributed in 3D space [1]. Pairs of images are compared sequentially and a quality–weighted spatialaveraging process [2] displays the best data at each 3D location. This method has been evaluated but hasthe practical difficulty of achieving adequate elevational frame density in a hand controlled motion andthe requirement of some means to track the probe motion, such as a position sensor. The alternativeVolume Pair method records two or more overlaid volumes with a small change in pressure between themand then compares one volume to the next [3,4]. However, this method is also difficult in clinical practicebecause the single freehand compression must be carefully applied to ensure high quality strain data.Aims: To develop a variation on the frame sequence method that overcomes its practical limitations.Methods: The method uses a GE RSP6–12 mechanically–swept 3D probe interfaced to a DynamicImaging Diasus ultrasound machine. The probe gradually sweeps out a volume, recording several framesat each step of the motor, while a continuous axial up and down motion is applied by hand. The resultingdata set is similar to a standard frame sequence recording, but the probe controls the elevational motion,ensuring adequate frame density. Also, the method relies on a continuous axial motion and quality–weighted averaging of multiple frames at each step, rather than a single carefully controlled compression,to produce good data. Comparisons were made to volume pair data recorded using the RSP6–12.Results: We have performed numerous scans using the two methods: quantitative comparisons, usingaverage SNR e over many small kernels, have shown that the new method produces higher quality data.Typical strain images are shown below. In Figure 1, the scanning subject is a stiff inclusion in a CIRSelasticity QA phantom (model 049). The new method is also effective in vivo, as shown in Figure 2. Thescan using the new method was acquired with minimal effort, whereas the volume pair result required amore careful scanning technique and multiple attempts to achieve the correct compressive motion.Figure 1: Three orthogonal views and a 3D view of a CIRSelasticity QA phantom. The left images show thenew method; the right are from a volume pairscan. Average SNRe values are calculated in the3D region indicated by the dashed line.Figure 2: An in vivo scan of a human calf muscle. Left: thenew method; right: volume pair. In both figures,the blue areas at the bottom mask regions oflow quality strain data.Conclusions: We have developed a new technique for acquisition of axial strain image volumes. Ourexperience is that while the volume pair approach occasionally produces very high quality images, thenew method more reliably produces images of useful quality. Also, it requires a much less carefulscanning technique to achieve this quality, making it an attractive option for clinical scanning. Themethod is currently under clinical evaluation for assisting resection of brain tumours.Acknowledgements: This work was supported by EPSRC grant number EP/E030882/1.References:[1] Lindop J, Treece G, et al.: 3D Elastography using Freehand Ultrasound. UMB, 32, pp. 529–545, 2006.[2] Lindop J, Treece G, et al.: An Intelligent Interface for Freehand Strain Imaging. UMB, 34, pp. 1117–1128, 2008.[3] Treece G, Lindop J, et al.: Freehand Ultrasound Elastography with a 3–D Probe. UMB, 34, pp. 463–474, 2008.[4] Bharat S, Fisher T, et al.: Three–Dimensional Electrode Displacement Elastography using the Siemens C7F2fourSight Four–Dimensional Ultrasound Transducer. UMB, 34, pp. 1307–1316, 2008.indicates Presenter49
008 ELASTICITY IMAGING USING HARMONIC EXCITATION, ULTRAFAST IMAGING AND PLANARINVERSION OF THE WAVE EQUATION.R. Zahiri Azar 1,2 , K. Dickie 1 , C. Chung 1 , A. Baghani 2 , S.E. Sacludean 2 , L. Pelissier 1 .1 Ultrasonix Medical Corporation, Richmond, CANADA; 2 University of British Columbia,Vancouver, BC, CANADA.Background: Harmonic excitation of soft tissue followed by the inversion of the governing wave equationin steady–state is commonly used in magnetic resonance elastography to image the absolute values oftissue elasticity [1]. Harmonic motion imaging with conventional ultrasound typically requires either asmall area of interest or long acquisition time [2]. To image elasticity, ultrasound elastography hasfocused mainly on the imaging of the propagation of transient waves with ultrafast scanners [3].Aim: To measure harmonic motion with ultrafast ultrasound and to solve for the absolute values of theelasticity and the loss modulus from the governing wave equation.Methods: Experiments were performed on a commercial elasticity phantom (Model 049, CIRS Inc., VA,USA) which contains several spherical inclusions with different diameters and elasticity values. An externalharmonic exciter was mounted on top of the phantom to vibrate it continuously. The SonixTOUCHultrasound machine (Ultrasonix Medical Corp., Richmond, Canada) was used to image the propagation ofmechanical waves. Similarly to [3], plane wave transmits using all elements followed by parallel acquisitionof pre–beamformed data from all channels were used to achieve high frame rates (up to 20kHz dependingon the imaging depth). The Texo software was used to program the SonixTOUCH to transmit plane waves at5kHz. The SonixDAQ was used to acquire the pre–beamformed echo signals from up to 40mm depth for128 channels for 250 transmits (i.e 50ms). Pre–beamformed data were then transferred to a PC for off–lineprocessing. Parallel beamforming was employed to reconstruct the radiofrequency (RF) frames from thechannel data. Axial displacement images were estimated from these reconstructed RF frames usingnormalized cross–correlation (W=1mm and ∆W=50%) with cosine fitting for sub–sample estimation. Thecomplex wave image at the excitation frequency was extracted from the displacement data using temporalFourier analysis. Finally, the planar Algebraic Helmholtz Inversion of the wave equation [1] was used toestimate the absolute value of the elasticity from the complex wave image.Results: The phantom Young’s moduli of 29kPa and 6kPa for the background and the soft inclusion wereestimated to be 32kPa and 9kPa, respectively. The experimental results for excitation frequency of 200Hzfor the softest inclusion are shown in Figure 1.Conclusions: The results show that the absolute value of elasticity can be reliably imaged in steady–statewith ultrasound. Inversion of the wave equation in steady–state offers several advantages over transientwaves. Temporal filtering can be employed to extract the frequency of interest from displacement data [2].Also, spatial filtering can be used to remove unwanted wavelengths from the wave image [1]. Furtherinvestigations are required to compare the results with transient elastography.Acknowledgements: The authors would like to acknowledge Dr. Ralph Sinkus, Dr. Ingolf Sack and Dr. SebastianPapazoglou for their valuable feedback on the wave inversion algorithms.References:[1] S. Papazoglou, U. Hamhaber, J. Braun and I. Sack: Algebraic Helmholtz Inversion in Planar Magnetic ResonanceElastography. Physics in Medicine and Biology, Vol. 53, pp. 3147–3158, 2008.[2] A. Baghani, A. Brant, S. Salcudean, R. Rohling: A High Frame Rate Ultrasound System for the Study of TissueMotions. IEEE Trans. Ultrason., Ferroelectric, Frequency Control, (in press).[3] Bercoff J, Chaffai S, Tanter M, Sandrin L, Catheline S, Fink M., Gennisson J, and Meunier M: In Vivo BreastTumor Detection using Transient Elastography,” Ultrasound in Medicine and Biology, 29, pp. 1387–1396, 2003.(a) Sonogram (b) Real part of the wave image [μm] (c) Imaginary part of the wave image [μm] (d) Real Part of Young’s Modulus [kPa]Figure 1: (a) Sonogram generated from beamformed RF frame, (b) estimated real part and (c) imaginary part of the wave image, and(d) estimated real part of the complex modulus image of the elasticity phantom with soft inclusion at 200Hz.50indicates Presenter
029 IN–VIVO EVALUATION OF UTERINE ABNORMALITIES BASED ON ULTRASOUND SALINEINFUSED SONOHYSTEROGRAPHY STRAIN IMAGING.Eenas A. Omari 1,2 , Tomy Varghese 1,2 , Mark A. Kliewer 3 .1 Medical Physics, 2 Biomedical Engineering, 3 Radiology Departments, University of Wisconsin–Madison, 1111 Highland Ave., Madison, WI, USA.Background: More than 60% of uterine abnormalities are due to abnormal uterine bleeding, causedeither due to benign conditions such as leiomyomas, endometrial polyps, adenomyosis or malignantendometrial cancers [1]. Since clinical treatment for these conditions is very different, it is very importantto make a correct diagnosis.Aims: Saline infused sonohysterography is currently used to evaluate and enhance visualization of theendometrium but lacks the ability to differentiate between different masses. Since uterine masses havedifferent stiffness characteristics than the surrounding background, we show the feasibility of usingultrasound strain imaging to determine variation in the stiffness of the uterine masses.Methods: Radiofrequency (RF) data were acquired on 8 patients using a Siemens Antares ultrasoundsystem with an EC9–4 transvaginal ultrasound transducer during a saline infused sonohysterographyprocedure at the University of Wisconsin Hospital and Clinics. During the procedure, saline was injectedinto the uterus, to push apart the walls of the uterine cavity, providing the deformation required for strainimaging. Strain images were estimated using a two–dimensional multilevel hybrid algorithm for ultrasoundsector array transducers which estimates displacement slopes using least squares estimation [2].Results: Strain images estimated using the two–dimensional multilevel hybrid algorithm provide additionalnew information that supplement current clinical B–mode diagnostic imaging. Stiffer masses, such asfibroids, are clearly differentiated on the strain images, which appear to be darker when compared to thenormal uterine tissue. Figure 1a shows a B–mode image, currently used clinically, and Figure 1b shows astrain image obtained by processing the pre– and post–compressed B–mode and RF echo signals. The strainimage in Figure 1b indicates an area where a fibroid is present and its border is defined.Conclusions: Ultrasound saline infused sonohysterography based strain imaging can be used todetermine variations in the stiffness of uterine masses in–vivo. Our results demonstrate the feasibility ofimproving clinical diagnosis based on strain imaging. Further evaluation is required with additionalpatient data to evaluate additional uterine pathologies.Acknowledgements: This work is funded by NIH grant 5R21CA140939.Figure 1: (a) B–Mode Image (b) Strain ImageReferences:[1] Spencer, CP and MI Whitehead: Endometrial Assessment Re–Visited. Br J Obstet Gynaecol, pp. 623–632, 1999.[2] Chen, Hao and Tomy Varghese: Multilevel Hybrid 2D Strain Imaging Algorithm for Ultrasound Sector/PhasedArrays. Medical Physics, 36, No. 6, pp. 2098–2106, 2009.indicates Presenter51
032 ON THE PROPAGATION OF GUIDED ELASTIC WAVES IN THIN PLATES FOR QUANTITATIVESHEAR WAVE ELASTOGRAPHY OF THE CORNEA AND THE SKIN.Thu–Mai Nguyen 1 , Jean–Luc Gennisson 1 , David Touboul 3 , Philippe Humbert 4 , Jeremy Bercoff 2 ,Mathias Fink 1 , Mickaël Tanter 1 .1 Institut Langevin Ondes et Images, ESPCI ParisTech, CNRS UMR 7587, INSERM ERL U979,Paris, FRANCE; 2 SuperSonic Imagine, Aix en Provence, FRANCE; 3 Centre Hospitalo–Universitairede Bordeaux, FRANCE; 4 Centre Hospitalo–Universitaire de Besançon, FRANCE.Background: Quantitative measurements of skin and cornea biomechanical properties have manyapplications in medicine. In ophthalmology, it could lead to a better diagnosis of pathologies ormonitoring of treatments. In dermatology, it could help skin lesion removal monitoring. In the frameworkof Supersonic Shear Imaging (SSI), these <strong>org</strong>ans are characterized by their complex sub–wavelengthgeometry (thin plate) that strongly influences the shear wave propagation.Aims: The aim of this work is to refine and use the SSI technique to quantitatively map in real timecornea and skin elasticity. In this study, a method for the quantification of elastic modulus in thesetissues is proposed. The shear wave dispersion induced by the guided propagation in such thin layers isestimated and fitted to the analytical dispersion curve derived from the leaky Lamb Wave theory.Methods: The SSI technique consists of generating a shear wave by ultrasonic radiation force andimaging its propagation through the medium at a high frame rate (20kHz). For infinite media, shear wavevelocity is then linked to Young’s modulus. In cornea and skin layers, the high–frequency shear wave(from 500 to 2000Hz) is guided similarly to a Lamb wave, with plate thickness (
039 A CORRELATION TOMOGRAPHY OF COMPLEX SHEAR WAVE FIELD IN SOFT SOLIDS.Stefan Catheline 1 , Thomas Gallot 1 , Philippe Roux 1 , Javier Brum 1 , Carlos Negreira 2 .1 Grenoble University & CNRS, LGIT, Grenoble, FRANCE; 2 Science University, LAU, Montevideo,URUGUAY.Background: Shear waves in a soft solid can be focalized using time–reversal (TR) methods [1]. The shearvelocity, directly related to the elasticity of the medium, can be extracted from the TR field.Aims: This study proposes to perform quantitative imaging of the mechanical properties inside a softsolid where a diffuse elastic field is present.Methods: Shear waves are created by finger impacts all over the surface of the solid. One component ofthe vectorial field inside the solid is measured by ultrasonic techniques developed in elastography.Inspired from Green’s function retrieval methods, the TR field is computed from cross–correlation of thisrandom–like displacement signal. One point is chosen as a virtual source where the spatio–temporalrefocusing is observed. Thus the method allows focalization of shear wave everywhere inside the solidwithout any source embedded in the solid.Results: The local shear velocity is then deduced from the TR field. Finally, a two dimensional velocitymap of a bi–layer medium is performed as shown in Figure 1.Conclusions: Extracting elastic parameter in soft solids from a diffuse elastic field can be potentiallyuseful in the human body where muscle activities create permanently erratic shear waves. Inspired byseismology [2], this technique would be a passive shear wave speed tomography for soft tissues.Acknowledgements:References:[1] S. Catheline, N. Benech, X. Brum, and C. Negreira: Time Reversal of Elastic Waves in Soft Solids.Phys.Rev.Letter, 100, 064301, 2008.[2] M. Campillo and A. Paul: Long–Range Correlations in the Diffuse Seismic Coda. Science, 299, pp. 547–549, 2003.(a)(b)Figure 1: (a) Sonogram of a 2–layerphantom. (b) The shearwave speed tomographyimage.indicates Presenter53
036 IN–VIVO TIME REVERSAL ELASTOGRAPHY: A PASSIVE CORRELATION TOMOGRAPHY.Thomas Gallot 1 , Stefan Catheline 1 , Philippe Roux 1 , Javier Brum 1 , Carlos Negreira 2 .1 Grenoble University & CNRS, LGIT, Grenoble, FRANCE; 2 Science University, LAU, Montevideo,URUGUAY.Background: Time Reversal experiments allow focalization of waves in soft solids [1]. The mechanicalproperties of the medium can be extracted from the refocusing field. Furthermore, correlation ofnoise–like signals is a recent method to extract information from multiple scattered wave fields [2].Aims: In this work, the Time Reversal experiment becomes passive yielding to an in–vivo tomography ofshear waves.Methods: Heartbeats, breathing and muscle activity, the human body presents natural sources ofvibration creating a complex shear wave field. Indeed, the shear wave noise inside soft tissue is measuredby ultrasonic techniques developed in elastography. The particle motions estimated along lines or planesinside the medium can be used as artificial stars for time reversal experiments. In another language,Green’s functions can be recovered from noise correlations which results in a totally passive imagingtechnique.Results: The physiological noise is demonstrated in this work to be useful for in–vivo quantitative elasticityimaging in the liver. In comparison to a sonogram (Figure 1a), quantitative imaging of the shear speed inthe liver region is presented (Figure 1b). Good correspondence is found between the two images at theinterface between abdominal muscle and the liver, around z=10mm. The average shear wave speed inmuscle and liver, 1.2m/s and 3.5m/s respectively, is in quantitative agreement with other studies [3,4].Conclusions: This in–vivo experiment demonstrates the feasibility of passive elastography. Futureapplications will focus on moving <strong>org</strong>ans like the heart where elastography with active methods is notachievable.References:[1] Benech et al.: 1–D Elasticity Assessment in Soft Solids from Shear Wave Correlation: The Time–ReversalApproach. IEEE Trans. Ultrason. Ferroelectr., 56 (11), pp 2400–2410, 2009.[2] M. Campillo and A. Paul: Long–Range Correlations in the Diffuse Seismic Coda. Science, 299, pp. 547–549,2003.[3] J.L. Gennisson et al. : Human Muscle Hardness Assessment During Incremental Isometric Contraction UsingTransient Elastography. J. Biomech., 38(7), pp. 1543–1550, 2005.[4] Muller et al.: Quantitative Viscoelasticity Mapping of Human Liver Using Supersonic Shear Imaging: PreliminaryIn Vivo Feasibility Study. Ultrasound in Med. & Biol., 35(2), pp. 219–229, 2009.Figure 1: a) Sonogram of a liver region, theinterface between belly muscleand the liver is visible aroundz=10mm.b) The passive shear wave speedtomography from the correlationwidth shows the same interfaceand the shear speed values arein agreement with literature[3,4].54indicates Presenter
Session CAA–1: Clinical and Animal Applications – ISunday, October 17 10:30A – 12:00P062 PRELIMINARY ASSESSMENT OF SHEARWAVE TM ELASTOGRAPHY FEATURES INPREDICTING BREAST LESION MALIGNANCY.D Cosgrove 1 , C Doré 2 , R Hooley 3 , E Mendelson 4 , L Barke 5 , A Cossi 6 , B Cavanaugh 7 , L Larsen 8 .1 Imperial College, Hammersmith Hospital, London, England, UK; 2 London, England, UK; 3 Yale MedicalCenter, Yale, CT, USA; 4 Northwestern Medical Center, Chicago, IL, USA; 5 Sally Jobe Breast Center,Denver, CO, USA, ; 6 Boston Medical Center, Boston, MA, USA; 7 Thomas Jefferson University,Philadelphia, PA; USA, 8 University of Southern California, Los Angeles, CA, USA.Background: Shear wave elastography (SWE) provides a quantitative measurement of tissue stiffnesswith high spatial resolution and may improve characterization of breast masses.Aims: To evaluate the reproducibility of SWE and impact of adding SWE [1] features to the BI–RADS ®classification of breast masses from the first 1000 cases in a prospective multicenter trial.Methods: SWE studies were performed on a on a prototype of the Aixplorer system (Supersonic Imagine,Aix–en–Provence, France). A subset of 192 breast lesions (42.71% malignant) was analyzed.Reproducibility of SWE images and measurements was assessed; logistic regression analysis wasperformed to predict the pathology findings. SWE features were added to the ultrasound BI–RADS togenerate models that were challenged by comparing the areas under the ROC curves (A z ), and thesensitivity and specificity scores.Results: In the preliminary analysis, intra–operator reproducibility of SWE size (R0.93) and meanelasticity (R=0.88) measurements were in near–perfect agreement. Using the best three–variable model(BIRADS + elasticity shape + maximum elasticity), the A z increased from 0.77 to 0.93 specificity increasedfrom 61.8% to 87.3%, although sensitivity decreased from 92.7% to 87.8%. Adding more variables did noteffect further improvements.Conclusions: In this ongoing study, SWE provided reproducible information (elasticity values and SWEmapping) that improved the characterization of breast lesions. These features are directly linked to thecharacteristics of SWE: local quantification and millimeter resolution. Further evaluation of the study isin progress.Acknowledgements: The BE1 Collaborative Group study was sponsored by Supersonic Imagine and comprisedcenters in the USA and Europe. Their support and participation is gratefully acknowledged.References:[1] Tanter M, Bercoff J, Athanasiou A, Deffieux T, Gennisson JL, Montaldo G, Muller M, Tardivon A and Fink M:Quantitative Assessment of Breast Lesion Viscoelasticity: Initial Clinical Results using Supersonic ShearImaging. Ultrasound Med Biol, 34(9), pp. 1373–86, 2008.Figure 1: This suspicious lesion was classified asBI–RADS 4B on B–mode but SWEshowed low kPa values (around 50kPa)so was reclassified as BI–RADS 3. Biopsyshowed fibrocystic change only.indicates Presenter55
009 AXIAL SHEAR STRAIN FEATURE FOR DIFFERENTIATING BREAST LESIONS.Haiyan Xu 1,2 , Min Rao 1 , T Varghese 1,2 , S Baker 1 , AM Sommer 1 , TJ Hall 1 , GA Sisney 3 , ES Burnside 3 .1 Medical Physics Department, 2 Electrical and Computer Engineering Department, 3 RadiologyDepartment, University of Wisconsin–Madison, Madison, WI 53705, USA.Background: Ultrasound–based axial strain imaging has been used to aid in distinguishing benign frommalignant breast masses, based on the stiffness and size–ratio (ratio of mass dimensions on the strainimage to that on the B–mode image). The desmoplastic scirrhous reaction evoked by infiltrating cancersalso tend to make these masses become firmly attached to background tissue and are thereby less mobileduring applied deformations when compared to benign masses like fibroadenomas. We utilize thevariations in the bonding between different breast masses for characterization.Aims: The feasibility of using the normalized axial shear strain feature to differentiate between benignand malignant breast masses utilizing ultrasound radiofrequency (RF) data acquired in–vivo on patientsscheduled for biopsy is evaluated. The normalized axial shear strain area feature estimates the degree ofbonding of breast masses to background tissue and may provides improved differentiation of benign frommalignant breast masses leading to improved breast cancer diagnosis [1,2].Methods: In–vivo RF data were acquired using a Siemens SONOLINE Antares real–time clinical scannerequipped with a VFX13–5 linear array transducer at the University of Wisconsin–Madison Breast Center.Free–hand palpation with deformation up to 10% was utilized to acquire pre– and post–deformation RFdata to generate ultrasound axial strain and axial shear strain images. The axial strain and the axialcomponent of shear strain are generated using a two–dimensional cross–correlation algorithm. Axialshear strain values normalized to breast mass dimensions, applied strain and strain contrast wereutilized to estimate feature values for differentiating benign from malignant masses. In this study, wecompare in–vivo feature values of 8 malignant tumors and 33 fibroadenomas using axial shear strains tothat obtained from biopsy results which are considered the diagnostic standard to evaluate the feasibilityof our approach.Results: Our results indicate that the normalized axial shear strain area (NASSA) feature is significantlylarger for malignant masses when compared to fibroadenomas. These results corroborate in-vivo resultsreported by Thittaikumar et al. [1], on 15 benign and 15 malignant masses. Axial shear strain valuesgreater than a specified threshold along with correlation coefficient values greater than 0.75, are overlaidon the corresponding B–mode images and utilized for diagnosis. A scatter plot of the shear strain areafeature indicates the ability to differentiate benign from malignant breast masses. Based on resultsobtained using a linear classifier, the area under the receiver operator characteristic curve was 0.996,showing the potential of this feature to noninvasively differentiate breast masses.Conclusions: Axial shear strain images may provide additional information which along with currentlyutilized axial strain and B–mode images may improve differentiation of benign and malignant breastmasses and may reduce unnecessary biopsy thereby reducing patient morbidity.Acknowledgements: This work is supported by Komen grant BCTR0601153 and NIH–NCI grants 5R21CA140939and R01CA112192–S103.2Biopsy CancerBiopsy Fibroadenoma1.51Figure 1: Scatter plot of NASSA valuesfor 41 patients (8 malignant,33 benign fibroadenomas)00 10 20 30 40 50References:[1] Thitaikumar, A., Mobbs, L., Kraemer–Chant, C., Garra, B., and Ophir, J.: Breast Tumor Classification using AxialShear Strain Elastography: A Feasibility Study. Phys Med Biol; 53(17), pp. 4809–4823, 2008.[2] Xu, H, Rao, M, Varghese, T, Sommer, A, Baker S, Hall TJ, Sisney G.A. Burnside, B.: Ultrasound Med Biol, (inpress), <strong>2010</strong>.0.556indicates Presenter
018 ARFI IMAGING OF HUMAN PROSTATE IN VIVO: INITIAL FINDINGS FROM 20 PATIENTS.Liang Zhai 1 , Stephen Rosenzweig 1 , Thomas Polascik 2 , Wen–Chi Foo 3 , Vladimir Mouraviev 2 ,John Madden 3 , Mark L. Palmeri 1 and Kathy R. Nightingale 1 .1 Biomedical Engineering Department, Duke University, Durham, NC, USA; 2 Duke Prostate Centerand Division of Urologic Surgery, Surgery Department; 3 Pathology Department, MedicineDepartment, Duke University Medical Center, Durham, NC, USA.Background: Elasticity imaging techniques have shown promise for guiding clinical procedures such asneedle biopsy and focal therapy [1]. Yet, challenges have been reported associated with achieving uniformcompression on the prostate. Acoustic radiation force impulse (ARFI) imaging is an elasticity imagingmethod that uses remotely generated, focused acoustic beams to interrogate tissue stiffness [2], whichcan overcome this problem. By monitoring tissue displacement response to impulse acoustic radiationforce, relative stiffness among structures inside the soft tissue can be inferred based on the resultantdisplacement amplitudes in ARFI images. Previously, we have demontrated the capability of ARFI imagingto resolve various prostatic structures in excised prostate specimens [3]. In this work, we performed apilot study on 20 patients to investigate the feasibility of ARFI prostate imaging in vivo.Aims: The goal of this study is to investigate the feasibility of ARFI imaging to visualize the internalstructures and prostate cancer (PCa) in human prostate in vivo.Methods: Twenty patients were consented under an IRB approved protocol and imaged in Duke MedicalCenter. A modified Siemens Antares TM scanner and a 3D wobbler, end–firing, transrectal probe, EV9F4was used to acquire in vivo ARFI data. ARFI excitation pulses used a center frequency of 4.0 MHz, focaldepth of 20 mm, F/# 2.9 and duration of 100 s. Tracking beams used 4:1 parallel–receive techniques toreduce acquisition time. Each 2D ARFI imaging plane consisted of 55 pushing locations, and the entire3D volume of the prostate was acquired using 50 2D planes with 1.8 degree increments. The in vivo studywas performed at the beginning of the prostatectomy surgery when the patient was anesthetized. Theprostate was imaged again after it was surgically removed, and compared to the in vivo ARFI images toexplore potential stiffness differences of prostatic tissue under the two conditions. During histologicalanalysis, pathologies and anatomic structures were identified in each histological slide. These slides werethen digitized and assembled together to recontruct the volume of each prostate. Finally, thereconstructed histological volumes were registered to the 3D ARFI data to identify various prostatestructures in ARFI images.Results: Compared to the matched B–mode images, ARFI images portray prostate structures with highercontrast. Similar stiffness contrast was observed among prostate tissues in registered in vivo and ex vivoARFI images. Zonal anatomy was visualized. PCa was shown to be stiffer than the normal surroundingtissue in the peripheral and transitional zones. Initial data suggest that prostate cancer with higherGleason's scores seems to be better visualized in ARFI images.Conclusions: This on–going pilot study demonstrates that prostatic structures such as zonal anatomy,BPH and focal PCa lesions can be visualized in ARFI images. As such, this technology has the potential toprovide improved image guidance for prostate needle biopsy and focal therapy.Acknowledgements: The authors would like to thank Siemens Healthcare, Ultrasound Business Unit for theirtechnical support. This work is supported by NIH R01EB002132, NIH R01CA114075, NIH R01CA142824 and DODPCRP W81XWH–08–10132.References:[1] Konig K, Scheipers U, Pesavento A, Lorenz A, Ermert H, Senge T: Initial Experiences with Real-Time ElastographyGuided Biopsies of the Prostate. J Urol., 174, pp. 115–117, 2005.[2] Nightingale K, Palmeri M, Nightingale R, Trahey G: On the Feasibility of Remote Palpation using AcousticRadiation Force. JASA, 110(1), pp. 625–634, 2001.[3] Zhai L, Madden J, Foo W, Palmeri M, Mouraviev V, Polascik T, Nightingale K: Acoustic Radiation Force ImpulseImaging of Human Prostate Ex Vivo. Ultrasound Med. Biol., 36(4), pp. 576–588, <strong>2010</strong>.indicates Presenter57
074 ELECTRODE DISPLACEMENT BASED STRAIN IMAGING FOR MONITORING IN–VIVOOPEN–SURGERY THERMAL ABLATION THERAPIES.N Rubert 1 , S Bharat 1 , RJ Dewall 1 , A Andreano 2 , C Brace 2 , J Jiang 1 , L Sampson 2 , T Varghese 1 .1 Medical Physics Department, 2 Radiology Department, University of Wisconsin–Madison, Madison,WI, USA.Background: Radiofrequency (RF) ablation therapy is being increasingly used to non–invasively destroyhepatic tumors. Convenient, cost–effective imaging for monitoring the extent of thermal ablation is criticalfor the success of this technique. Ultrasound B–mode images are widely used for monitoring theplacement of the ablation electrode when performing RF ablation procedures. However, B–mode imagesare not reliable for displaying the extent of the thermal ablation zone. The thermal ablation does haveelevated stiffness, making imaging modalities which display tissue mechanical properties attractive formonitoring the extent of the ablation zone.Aims: The aim of this study is to assess the ability of two–dimensional electrode displacement basedstrain imaging to accurately monitor the extent of thermal ablations.Methods: Open abdominal RF ablation procedures (n=13) were performed on porcine animal models. Ineach animal three or four RF ablations were created, a maximum of one in each lobe of the liver. Strainimaging using electrode displacement was performed within ten minutes of each ablation procedure.Manually applied minute displacements (< 1mm) of the unconstrained end of the ablation electrode wereused to displace the ablated region bonded to the active end of the electrode. A Siemens Antares clinical(Siemens Medical Solution, USA, Inc., Issaquah, WA) real–time scanner equipped with a 10 MHz centerfrequency linear array transducer (VFX 13–5), was used to record RF data as the ablation electrode wasdisplaced. For gross pathology measurements, the livers were excised following the RF ablations and eachthermal ablation zone was sliced through the assumed imaging plane using a commercially availablemeat slicer. The recorded RF data were used to create electrode displacement strain images off line.Manual contouring of the ablated region was performed by three of the authors, along with an automatedsegmentation algorithm in order to determine the extent of the thermal ablation zones. The depiction ofthe thermal ablation zone in the strain images was compared to gross pathology measurements forcross–sectional area comparisons using linear regression analysis.Results: Manual cross–sectional area measurements from strain images of these ablation zones andareas measured using automated segmentation were correlated with areas measured on histopathologyimages using linear regression. For each individual and the automated segmentation, the correlationcoefficient was found to be R = 0.824, R = 0.901, R = 0.465 and R = 0.828, respectively. The linearregression was also performed after averaging together the areas measured manually yielding acorrelation coefficient of R = 0.894.Conclusions: This study further demonstrates that electrode displacement based strain imaging iscapable of providing high contrast images from a widely available commercial ultrasound system whichmay be used to assess the extent of thermal ablation zones.Acknowledgements: This work was funded by NIH–NCI Grants R01 CA112192–04 and R01 CA112192–03S1. RyanDeWall is also supported in part by NIH Grant T32 CA09206–31.References:[1] N. Rubert, S. Bharat, R. J. DeWall, et al.: Electrode Displacement Strain Imaging of Thermally Ablated LiverTissue in An In Vivo Animal Model. Medical Physics, Vol. 37, No. 3, <strong>2010</strong>.Figure 1: B-mode image of thermal ablation.Arrow indicates shadowing fromablation electrode.Figure 2: Corresponding Strain Image.58indicates Presenter
028 STRAIN RATIO IN REAL TIME SONOELASTOGRAPHY OF THE PROSTATE AS ASEMI–QUANTITATIVE MEASUREMENT TOOL: IMPACT ON PROSTATE CANCER DETECTION.D Junker 1 , F Aigner 1 , T De Zordo 1 , F Pedross 1 , G Schaefer 1 , G Mikuz 1 , W Horninger 1 , W Jaschke 1 ,F Frauscher 1 . Presented by A Lebovici 1 1 Medical University Innsbruck, Innsbruck, AUSTRIA.Background: Prostate cancer (PCa) has increased tissue stiffness (higher cell density) than the normalsurrounding tissue under compression [1]. Real time sonoelastography (RTE) allows assessment of tissueelasticity of the prostate and, therefore, can demonstrate PCa as a hard area [2].Aims: To assess the value of semi–quantitative strain–ratio measurement of tissue elasticity todifferentiate benign stiff areas of the prostate, i.e. fibrosis or prostatitis, from malignant stiff areas andthereby reduce the number of biopsy cores with its related costs and complications.Methods: Sixty–nine men were included in this study. All patients had elevated prostate specific antigen(PSA) serum levels and were scheduled for prostate biopsy. Tissue elasticity was assessed with real timesonoelastography using a Hitachi ultrasound machine (Hitachi EUB 8500, Tokyo, Japan), capable ofcolor coding hard areas, i.e. blue. Prostate cancer has decreased tissue elasticity due to its high celldensity. The uroradiologists biopsied up to 5 core samples from stiff outer gland areas of the prostatetargeted by RTE. The degree of stiffness of a hard outer gland area was quantified with strain ratio, asemi–quantitative measurement tool integrated in the ultrasound machine and displayed on the left sideof the screen. The strain ratio is calculated by comparing the suspicious stiff area with the area thatshows the lowest stiffness in the same slice. Furthermore, each biopsy core was reviewed by a pathologistand reported as either cancer with an assigned Gleason score or as benign tissue.Results: Overall, 104 hard prostate outer gland areas were measured using RTE with strain ratio valuesand were histologically analyzed. We divided the obtained values in 3 groups. Group A, with values between0 and 40, showed a cancer detection rate of 19%. Group B, with values between 41 and 80, showed acancer detection rate of 25%. Group C, with values > 80, showed a cancer detection rate of 36%. Cancer–negative hard areas histology revealed prostatitis, adenomyomatosis, atrophia or hyperplasia.Conclusions: A hard lesion of the prostate with an assigned high strain ratio value has a higher chanceto be malignant. Nevertheless, in our study we found a considerable number of PCa in the low strain ratiovalue group. It was not possible to calculate a strain ratio cut off value level ruling out PCa anddecreasing the number of false positive findings on RTE and therefore reducing biopsy cores with itsrelated costs and complication.Figure 1References:[1] Krouskop TA, Wheeler TM, Kallel F, Garra BS, Hall T: Ultrason Imaging, 20(4), pp. 260–74, Oct 1998.[2] Pallwein L, Aigner F, et al.: Prostate Cancer Diagnosis: Value of Real–Time Elastography. Review. AbdominalImaging, 33(6), pp. 729–35, Nov–Dec 2008.indicates Presenter59
104 THORACOLUMBAR FASCIA SHEAR PLANE MOTION IN CHRONIC LOW BACK PAIN.HM Langevin 1,2 , JR Fox 1 , C Koptiuch 1 , NA Bouffard 1 .1 Neurology Department, 2 Orthopedics and Rehabilitation Department, University of Vermont,Burlington, VT, USA.Background: Connective tissue is increasingly recognized as an important potential contributor tochronic musculoskeletal pain including low back pain [1]. The thoracolumbar fascia in humans iscomposed of several layers of dense connective tissue separated by layers of loose connective tissueallowing the dense layers to glide past one another. The dense layers correspond to the aponeuroses ofmuscles with different directions of pull: longitudinal for latissimus dorsi and erector spinae andtransverse for internal/external obliques and latissimus dorsi. During passive trunk flexion/extension,shear plane motion can be observed with B–scan ultrasound between the dense connective tissue layerswithin the thoracolumbar fascia. We hypothesized that this shear plane motion could be quantified usingultrasound elasticity imaging techniques. We further hypothesized that this shear plane motion would bereduced in human subjects with chronic low back pain of greater than 12 months duration (LBP)compared with control subjects without low back pain (No–LBP).Aims: To quantify the relative motion of the connective tissue layer closest to the muscle relative to theconnective tissue immediately superficial to it in both a normal group and a chronic low back pain groupof subjects.Methods: So far, we have tested 128 subjects (73 with LBP and 55 with No–LBP). Groups were frequencymatched for age, sex and body mass index. Subjects were placed prone on a motorized articulated tablecapable of inducing passive flexion/extension of the back standardized with respect to rate and range. Anultrasound cineloop was collected over a 10 second period of a 15 degree flexion/extension at 0.5Hz. Theultrasound transducer was placed longitudinally 2cm lateral to the midline at the level of the L2/3interspace. Ultrasound data were collected using a Terason 3000 ultrasound machine equipped with a10MHz linear array transducer. The cineloop frame rate was 25fps. The ultrasound radiofrequency (RF)data were collected and analyzed for displacement using elasticity imaging cross–correlation techniques[2,3]. We quantified the motion between the connective tissue layers closest to muscle relative to theconnective tissue layers immediately superficial to it, identifying this as the perimuscular shear plane.Two rectangular regions of interest (ROI) were identified on each ultrasound B–scan image. These ROIsmeasured 10mm wide and 2mm deep and were located superior and inferior to the perimuscular shearplane. Total lateral displacement was determined within these ROIs over the period of the flexion portionof one cycle of the table. Relative motion of tissue between the two ROIs was determined by integratingthe area under the curve of the difference in the time based displacement history.Results: Preliminary analyses suggest that male subjects with LBP (but not females) had on average~20% less perimuscular shear plane motion than subjects without LBP. Mean±SE % lateral shear strainwas 56.7±27.5 vs. 70.2±25.2 for LBP and No–LBP respectively (p
Session MPT–1: Mechanical Properties of Tissues – ISunday, October 17 1:30P – 3:15P024 A FEASIBILITY STUDY OF CALIBRATING OPTICAL STRAIN ELASTOGRAMS WITHBIOMECHANICAL TESTING.Hazel Marie 1 , Susheel Vadde 1 , Harish Kukatla 1 , Shalini Gadapa 1 , Yong Zhang 1 , John R. Sullins 1 .1 Youngstown State University, Meshell Hall, One University Plaza, Youngstown, OH, 44555, USA.Background: There are two fundamental approaches in imaging elastic properties of soft tissue:1) A direct method that estimates absolute elasticity (Young’s modulus) from observed tissuedisplacement [1];2) An indirect method that computes a strain elastogram from which relative property variations canbe examined [2].The second method has the advantage in that it avoids the numerical difficulties associated with solvingan ill–posed inverse problem that often plague the direct method. However, the indirect method does notprovide absolute elasticity values that may be desirable in certain clinical settings.Aims: The aim of this study is to find an alternative approach that infers absolute elasticity informationfrom a relative strain elastogram. This is accomplished through the calibration of an optical strain imagewith biomechanical tensile testing results.Methods: Specimen of Mesenchymal Stromal Cells (MSC) treated rabbit tissues were subjected to theforce–extension tensiometric tests. During a test, a sample went through a complete deformation cycle(linear, plastic and post–rupture stages). Video sequences of tissue deformation were captured using aSONY HD camcorder (Figure 1). A robust optical flow algorithm was used to compute a flow imagebetween two adjacent frames that quantifies the tissue deformation. A strain elastogram was obtained byconvolving the flow images with a weighted gradient filter. A strain elastogram is shown in Figure 2. Thepixel–level property heterogeneity can be observed.Results: To facilitate elastogram calibration, we defined an “elastographic strain” by taking the average ofall pixel values in an elastogram. The “elastographic strain” of a video sequence that captured both linearand plastic deformations of a specimen (more than 5000 frames) was plotted against the stress data inFigure 3. The stress–strain curve derived from the “elastographic strain” matched almost perfectly withthat of the tensile test. The Young’s modulus values estimated from the first linear segment of stress–strain curves are: 666kPa (tensile test) and 691kPa (elastogram). The Young’s modulus values estimatedfrom the second linear segments are: 672kPa (tensile test) and 690kPa (elastogram).Conclusions: A preliminary study has shown that a strain elastogram can yield much more informationwhen calibrated properly with a tensile test. One promising application is that a calibrated elastogramusing a finite element model will enable us to assess wound healing effect on a much finer scale.Acknowledgements: This work was partially supported by Ohio Board of Regents Research Incentive Grant #34241,Youngstown State University URC Grant 08–#8, and St. Elizabeth Health Center.References:[1] F. Kallel and M. Bertrand: Tissue Elasticity Reconstruction using Linear Perturbation Method. IEEE Trans. onMedical Imaging, Vol. 15, pp. 299–313, 1996.[2] J. Ophir, E. I. Cespedes, H. Ponnekanti, Y. Yazdi, and X. Li: Elastography: A Quantitative Method for Imaging theElasticity of Biological Tissues. Ultrasonic Imaging, Vol. 13, pp. 111–134, 1991.Figure 1: A video frame of aspecimen during atensile test.Figure 2: An optical strainelastogram that showsproperty heterogeneity.Figure 3: Stress–strain curves fromthe tensile test and thestrain elastogram.indicates Presenter61
005 QUANTIFYING STORAGE MODULUS OF HUMAN HEPATIC CANCERS WITH EX VIVODYNAMIC COMPRESSION TESTING.Ryan J. DeWall 1,2 , Shyam Bharat 1 , Tomy Varghese 1,2 , Meghan E. Hanson 3 and Mark A. Kliewer 3 .1 Medical Physics, 2 Biomedical Engineering, 3 Radiology Departments, University of Wisconsin–Madison, 1111 Highland Ave., Madison, WI, USA.Background: Manual palpation has long been used by physicians to qualitatively detect the presence ofdiseases such as cancer. Recently, ultrasound elastography has provided several diagnostic techniquesthat quantify this mechanical information, which may complement traditional B–mode imaging in theclinic. Quasistatic electrode displacement approaches have shown good boundary demarcation ofabdominal ablations on strain images [1]. Shear wave tracking techniques such as acoustic radiationforce imaging (ARFI) and 1D transient elastography have been used to reconstruct Young’s Modulus insmall regions of interest (ROIs) in the liver, which may be used as a noninvasive diagnostic alternative tobiopsy to detect liver fibrosis [2,3]. However, few studies have quantified the elasticity of human hepaticpathologies using ex vivo mechanical tests. These data will provide complementary information whilediagnosing diseases using new elastographic techniques.Aims: Our aim is to dynamically test human hepatic cancers and surrounding liver tissue to quantify thestorage modulus (E’). The impact of strain hardening on the underlying contrast is also evaluated todetermine the potential benefits of pre–compression in delineating lesions using elastography techniques.Methods: Liver samples were obtained from the UW Pathology Lab and dynamically tested using anEnduraTEC ELF 3220 (Bose Corporation, EnduraTEC Systems Group, Minnetonka, MN). Samples wereobtained from patients who underwent surgical resection at the University of Wisconsin Hospital and Clinics(Madison, WI). All protocols and procedures for this study were approved by the University of WisconsinInstitutional Review Board. One cubic centimeter samples were dynamically tested with 1–6% pre–compressionand 2, 3 and 4% amplitudes (e.g. 1% pre–compression with 2% amplitude is tested from 1–3% compression).Testing frequencies of 1, 10, 20 and 30 Hz were used for each test. For each specimen tested we measured E’,the elastic portion of the compression cycle.Results: Table 1 shows the pathologies obtained thus far in this study, including hepatocellularcarcinoma (HCC), colon metastases (Mets), rectal mets, gastrointestinal (GIST) mets and cirrhosis. Ourresults indicate that some of the cancers are significantly stiffer than surrounding background tissue. Inparticular, some colon mets and the GIST met tested were significantly stiffer than the surroundingbackground. HCCs were approximately the same stiffness as the surrounding background. Strainhardening was observed, particularly in the colon mets and neuroendocrine met samples.Table 1: E’ for 1–3% Dynamic Compression Test (1HzFrequency)Pathology E’ (kPa) NNormal 3.3 ± 1.3 14HCC 3.5 ± 1.5 2Colon Mets 23.1 ± 23.0 7Rectal Mets 30.9 1GIST Mets 4.3 1Neuroendocrine Mets 3.9 1Cirrhosis 13.7 ± 6.8 2Conclusions: These results present E’ obtained from mechanical testing of pathologic and normal liversamples through a range of pre–compression values. Some cancers were significantly stiffer than thesurrounding background, indicating that elastographic techniques may be a useful diagnostic tool in thesecases. However, some cancers were approximately the same stiffness as the surrounding background (e.g.HCCs). Strain hardening was also observed with some cancers, which suggests that pre–compression mayincrease the contrast between the cancer and surrounding background.Acknowledgements: This work is supported in part by NIH grants R01 CA112192–04, R01 CA112192–S103 andT32 CA09206–31.References:[1] Rubert N et al.: Electrode Displacement Strain Imaging of Thermally–Ablated Liver Tissue in an In Vitro AnimalModel. Med Phys, 37(3), pp. 1075–82, <strong>2010</strong>.[2] Sandrin L et al.: Transient Elastography: A New Noninvasive Method for Assessment of Hepatic Fibrosis. UMB,29(12), pp. 1705–13, 2003.[3] Palmeri ML, Wang MH, Dahl JJ, Frinkley KD, and Nightingale KR: Quantifying Hepatic Shear Modulus In Vivousing Acoustic Radiation Force. UMB, 34(4), pp. 546–58, 2008.62indicates Presenter
030 QUANTIFICATION OF THE VISCOELASTIC CHARACTERISTICS OF THE UTERUS ANDASSOCIATED PATHOLOGIES.Eenas A Omari 1,2 , MZ Kiss 1 , T Varghese 1,2 , MA Kliewer 3 , JM Harter 4 , EM Hartenbach 5 .1 Medical Physics, 2 Electrical and Computer Engineering, 3 Radiology, 4 Pathology, 5 Obstetrics andGynecology Departments, University of Wisconsin–Madison, 1111 Highland Ave., Madison, WI, USA.Background: Abnormal uterine bleeding is the number one cause of gynecological visits, bleeding iscaused either due to benign conditions such as leiomyomas, endometrial polyps, adenomyosis ormalignant endometrial cancers [1]. Ultrasound saline infusion based strain imaging, a minimally invasivealternative to hysteroscopy or uterine biopsies, is currently being investigated to be used to distinguishbetween different masses that cause abnormal bleeding.Aims: In order to characterize uterine masses in vivo using ultrasound saline infusion based strainimaging, it is important to determine the effectiveness of differentiating between the stiffer (fibroids) andsofter (endometrial polyps) masses that cause uterine bleeding. Quantification of the complex modulus isinvestigated in this research.Methods: Normal and abnormal uterine tissue is obtained from hysterectomies performed at theUniversity of Wisconsin Hospital and Clinics. A mechanical testing system (MTM), EnduraTEC model3200 ElectorForce (ELF), is used to evaluate sections of uterine masses with dimensions of approximatelyone cubic centimeter to determine the Young’s storage modulus. Dynamic testing is performed withcompression ranges of 2%, 3% and 4% in amplitude over a frequency range 1–30 Hz.Results: Results are obtained for 5 normal uterine tissue samples and 3 uterine fibroids. The Young’s storagemodulus at the lowest frequency of the mechanical testing (1Hz) and a percent strain (2–4%) for normaluterine tissue is approximately 29.7kPa with standard deviation of 2.2kPa, and the loss modulus is 8.8kPawith standard deviation of 1.6kPa. The Young’s storage modulus for fibroid uterine tissue was found onaverage to be 97.2kPa with 6.5kPa standard deviation, and the loss modulus is 3kPa with standard deviationof 1.6kPa, using the same pre–compression and similar cyclic deformation. Table 1 lists the storage modulus(E’) and loss modulus (E’’) for normal uterine tissue and fibroid extracted from uterine tissue.Patient E’ (kPa) E” (kPa) Patient E’ (kPa) E” (kPa)Normal 1 27.2 8.1 Fibroid 1 90.7 28.8Normal 2 29.9 6.7 Fibroid 2 103.7 32Normal 3 31.7 10.2 Fibroid 3 97.3 30.1Normal 4 27.8 8.7Normal 5 31.9 10.4Table 1: E’ and E’’ for 1 to 4% Dynamic Compression Test (1Hz frequency)Conclusions: We show that fibroids are significantly stiffer when compared to normal uterine tissue.Further mechanical testing will be performed on normal and different abnormal uterine tissue, such aspolyps, fibroid and cancerous, as they become available.Acknowledgments: This work is funded by NIH grant 5R21CA140939.References:[1] Spencer, CP and MI Whitehead: Endometrial Assessment Re–Visited. Br J Obstet Gynaecol, pp. 623–632, 1999.indicates Presenter63
034 NONLINEAR SHEAR MODULUS QUANTIFICATION BY COMBINING STATIC AND DYNAMICELASTOGRAPHY.Heldmuth Latorre–Ossa 1 , Jean-Luc Gennisson 1 , Emilie De Brosses 1 , Mickaël Tanter 1 .1 Institut Langevin–Ondes et Images, ESPCI ParisTech, CNRS UMR7587, INSERM U979, Paris, FRANCE.Background: The assessment of mechanical properties of soft media is enjoying a growing interest in thefield of medical imaging as pathologies are often correlated with a local change in stiffness. To date,advanced techniques in this field have been concentrating on the estimation of the second order elasticmodulus (the shear modulus, µ). However, it could be useful to study additional tissue mechanicalproperties such as shear nonlinearity (the third order elastic modulus, A) in order to have more accuratetissue characterization.Aims: The goal of acoustoelasticity experiments [1] is to retrieve the nonlinear shear modulus (A) in softsolids by applying uniaxial stress () at the medium’s surface. In quasi–incompressible soft solids, thistheory is governed by the following equation: ρVS ² = µ0 - σ(A/12µ0), where µ0 is the material shear modulusat = 0, VS is the shear wave speed and ρ is the medium density. Here, we propose a method combiningstatic elastography (uniaxial quasi–static compressions) and dynamic elastography (Supersonic ShearImaging (SSI) technique) to compute the 2D stress map of the medium which is subsequently used tocalculate the nonlinear shear modulus.Methods: Two tissue mimicking phantoms (2% Agar – 5% Gelatin) containing a soft (2% A – 3%G) andhard inclusion (2% A – 8% G) are axially compressed in steps of 0.1 mm from 0 to 5 mm. Firstly, at eachcompression step, the SSI technique allows quantitatively mapping the Young’s modulus of the medium.Shear waves are generated directly inside the medium through ultrasonic radiation force and caught byusing an ultrafast ultrasound scanner (5000 frames/s). Then, a time of flight algorithm is employed toestimate the shear wave speed which is directly related to the Young’s modulus (E) by the well knownequation E ≈ 3µ = 3ρVS ² . Sets of ultrasonic raw–data are acquired before and after uniaxial compression tocompute the axial 2D strain map (ε). Next, the stress (σ) map is retrieved according to Hooke’s equation(σ = E.ε) and can be also used to stepwise crawl up the stress–strain curve. Lastly, the acoustoelasticitytheory in soft media [1] is applied to map the nonlinear shear modulus A, by knowing the stress variationas a function of the shear modulus at each compression step.Results: Tissue 2D strain and stress maps were successfully calculated for both phantoms. Experimentalresults were compared to numerical simulations and showed good accordance. Figure 1 presents the resultsfor the phantom with a soft inclusion: the shear modulus (a), the cumulative strain (b) and the cumulativestress (c) after 1 mm compression. Figure 1(d) presents the nonlinear shear modulus for the same phantomwhere the nonlinear shear modulus had a mean value of -70 ± 4 kPa and 82 ± 23 kPa for the inclusion and itssurrounding media respectively. For the phantom with a hard inclusion, the nonlinear shear modulus had amean value of -8 ± 7 kPa for the inclusion and 40 ± 9 kPa for its surrounding media.Figure 1:(a) shear modulus, (b) cumulative strain map and (c) cumulative stress map after 1 mm compression, (d)nonlinear shear modulus (A) after 5 mm compression.Conclusions: Results show that for applied stress, the elasticity of biological tissues is linked to nonlinearity.The quantification of the nonlinear shear modulus could play a key role in improving the clinical diagnosis oftissue pathologies. Although we have proved capability to quantify stress and shear nonlinearity in phantoms,it is necessary to carry out in vivo studies to validate the obtained results. In addition to the nonlinear shearmodulus, knowing the stress distribution could be an important factor to better understandmechano-transduction processes (processes of genes activation in cells due to applied stress) in vivo [2].References:[1] Gennisson J.L., Rénier M., et al.: Acoustoelasticity in Soft Solids: Assessment of the Nonlinear Shear Moduluswith the Acoustic Radiation Force. J. Acoust. Soc. Am., 122 (6), pp. 3211–3219, 2007.[2] E. Brouzés, E. Farge: Interplay of Mechanical Deformation and Patterned Gene Expression in DevelopingEmbryos. Current Opinion in Genetics and Development, 4, pp. 367–374.64indicates Presenter
075 ULTRASOUND ELASTICITY IMAGING OF HUMAN POSTERIOR TIBIAL TENDON.Liang Gao 1 , Chris Geffre 1, John Szivek 1 , Mihra S. Taljanovic 1 , L. Daniel Latt 1 , Russell S. Witte 1 .1 University of Arizona, Tucson, AZ, USABackground: Posterior tibial tendon dysfunction (PTTD) leads to a progressive flatfoot deformity that isaccompanied by pain [1] and decreased gait efficiency [2]. PTTD is exceedingly common, affecting 3.3% ofwomen over the age of 40 [3]. There is a continuum of disease from tendon inflammation to irreversibletendon degeneration. Due to the pain that is experienced in the inflamed tendon, it is often difficult toclinically differentiate an inflamed tendon from one that has undergone degenerative change. Inflamedtendons are treated with immobilization and rest, whereas, those that have undergone irreversibledegenerative change are treated with surgery [1]. Ultrasound elasticity imaging (UEI) allows for thenoninvasive characterization of the mechanical properties of soft tissue structures, such as tendon. It ishypothesized that UEI will yield different load–deformation curves for normal and degenerated tendons.This technique can then be applied to tendons of unknown degenerative status to help avoid needlesssurgery or futile prolonged immobilization.Aims: The goal of this study was to demonstrate feasibility of UEI to noninvasively map the mechanicalproperties of human tendon using a controlled, ex vivo preparation. We implemented a 2D phase–sensitivecross–correlation speckle tracking algorithm [4] to determine the mechanical properties of the humanposterior tibial tendon under controlled external force. Our long term goal is to compare normal anddysfunctional posterior tibial tendons and further refine UEI as a diagnostic tool for PTTD.Methods: The posterior tibial tendon from a normal human cadaver was partially dissected at one endand connected to a mechanical testing system (MTS 810, Eden Prairie, MN). The MTS applied a forcethrough a Labview interface (National Instruments). The system also recorded the force and strokeduring the stretch. The movement of the tendon was simultaneously measured in real time at a framerate of 80Hz using a clinical ultrasound scanner (Zonare Medical Systems) and a 14MHz linear array(L14–5). Displacement at each pixel was obtained using the raw RF data and a 2D phase sensitivecross–correlation algorithm between ultrasound frames. A weighted least–squares spline method [5] wasalso used to improve tracking performance. Based on the axial and lateral displacements and externalforce, mechanical properties of the tendon, such as stiffness (k) and Young’s modulus (), were estimated.Results: In the B–mode ultrasound movies, the posterior tibial tendon can be easily distinguished fromsurrounding soft tissue and bone. 2D displacement and strain maps were calculated both parallel andperpendicular to the tendon axis, providing enhanced contrast of the tendon during the stretch sub–regionsinside the tendon (Figure 1a) were chosen for further analysis. Based on the slope of the tendonforce–displacement curve and geometry of the tendon, k and were calculated (Figure 1b). The average kand for one tendon were approximately 30N/mm and 200MPa at small load (
096 FREQUENCY DEPENDENCE IN PHASE WAVE SPEEDS RECOVERED FROM INTERFERENCEPATTERNS MADE WITH ARC DATA.Ashley Thomas 1 , Kui Lin 1 , Joyce R. McLaughlin 1 , Christopher R. Hazard 2 , Kai Thomenius 2 ,Zaegyoo Hah 3 , Kevin J. Parker 3 , Deborah J. Rubens 4 .1 Rensselaer Polytechnic Institute, Troy, NY, USA; 2 GE Global Research, Niskayuna, NY, USA; 3 Universityof Rochester, Rochester, NY, USA; 4 University of Rochester Medical Center, Rochester, NY, USA.Background: Acoustic radiation crawling wave sonoelastography (ARC) is an extension of traditionalcrawling wave sonoelastography, where two mechanical point or line sources oscillate at nearbyfrequencies on either side of the image plane, thereby inducing a moving interference pattern of shearwaves [1,2]. The gain in using two different frequencies is that a moving interference pattern can beimaged, where the speed of the interference pattern is a fraction of the shear wave speed. The interferencepattern data is used to produce the targeted biomechanical shear wave speed image. Images of excisedprostate glands match histology slides of the same cross section well [3]. In ARC sonoelastography, theexcitations at opposite sides of the imaging region are made using acoustic radiation force.Aims: The goal is to identify inclusions in phantoms and to exhibit the frequency dependence of thephase wave speed of interference patterns made from ARC data.Methods: Two distinct displacement data sets are obtained using a specially programmed GE Logiq 9ultrasound machine. An interference pattern is created synthetically by repeating and delaying one ofthe data sets and adding it to the other. By varying the delay times, the dominant frequency contentin the interference pattern can be changed. We utilize ARC displacement data that has been obtainedfor a phantom with a circular inclusion. We create several interference patterns, varying thedominant frequency. Then we recover the phase wave speed of each interference pattern using twomethods: (1) a local arrival time method and (2) an L 1 minimization 2D phase unwrapping method [3].Results: In this presentation, we will image the phase wave speed recovered from interference patternswith varying dominant frequencies. In addition, we will plot the mean inclusion phase wave speed as afunction of frequency and exhibit best–fit for several viscoelastic models. In Figure 1, we show phase wavespeed images recovered from synthetic interference patterns at two different frequencies using the localarrival time method. The mean inclusion wave speed for frequency, f = 277.7Hz, is 3.6m/s, and the meaninclusion wave speed for frequency, f = 416.6Hz, is 3.9m/s.Conclusions: Phantoms are successfully imaged with ARC data, and frequency dependency matches areobtained with both fractional and linear solid models.Acknowledgements: The authors acknowledge partial funding from NIH Grant No. R01AG029804, ONR and NPSC.Data were collected at the University of Rochester using GE equipment. This work was performed at IPRPI, theInverse Problems Center at Rensselaer Polytechnic Institute.References:[1] Z. Wu, L.S. Taylor, D.J. Rubens and K.J. Parker: Sonoelastographic Imaging of Interference Patterns forEstimation of the Shear Velocity of Homogeneous Biomaterials. Phys. Med. Biol., 49, pp. 911–922, 2004.[2] J.R. McLaughlin, D. Renzi, K.J. Parker and Z. Wu: Shear Wave Speed Recovery Using Moving InterferencePatterns Obtained in Sonoelastography Experiments. J. Acoust. Soc. Am., 121(4), pp. 2438–2446, 2007.[3] K. Lin, J. McLaughlin, A. Thomas, K. Parker, B. Castaneda and D.J. Rubens: Two–Dimensional Shear WaveSpeed and Crawling Wave Speed Recoveries from In Vitro Prostate Data. Submitted J. Acoust. Soc. Am., <strong>2010</strong>.Figure 1: (a) B–mode image ofa phantom; (b) and(c) phase wavespeeds computed fortwo differentfrequencies. Eachfrequency contentdata set is obtainedfrom a differentdelay/add sequence. (a) (b) (c)66indicates Presenter
097 NEW COMBINATION OF ARC DATA: IMAGING SHEAR MODULI AND MATCHING PHANTOMRECOVERY FREQUENCY DEPENDENCE TO VISCOELASTIC MODELS.K Lin 1 , A Thomas 1 , JR McLaughlin 1 , CR Hazard 2 , K Thomenius 2 , Z Hah 3 , KJ Parker 3 , DJ Rubens 4 .1 Rensselaer Polytechnic Institute, Troy, NY, USA; 2 GE Global Research, Niskayuna, NY, USA; 3 Universityof Rochester, Rochester, NY, USA; 4 University of Rochester Medical Center, Rochester, NY, USA.Background: In the acoustic radiation crawling wave sonoelastography (ARC), the excitations at oppositesides of the imaging region are made using acoustic radiation force instead of mechanical vibrations inthe traditional crawling wave sonoelastography [1,2]. As an alternative to finding the phase wave speedfrom an interference pattern of shear waves measured, the frequency dependent complex shear moduluscan be obtained from a novel combination of two single component displacement data sets generatedfrom the two separate excitations on either side of the image plane in ARC.Aims: We aim to establish a constructive combination of the two displacement data sets measured inARC and reconstruct images of complex shear modulus by a stable PDE solver. The goal is to obtain bestfits of the frequency dependence of the viscoelastic shear stiffness parameters for two viscoelastic models.Methods: Two displacement data sets are generated by two separate sources at opposite sides of imageplane in a phantom with a circular inclusion. A specially programmed GE Logiq 9 ultrasound machine isutilized for data acquisition. The time trace from each data set is synthetically extended by delaying andadding with a 12 points’ window. The frequency content of each data set is then extracted from theFourier Transform of the extended time traces and combined together to reconstruct the complexmodulus with a first order convergent linear complex PDE solver and a 2D phase unwrapping algorithm[3]. The viscoelastic shear stiffness parameters in the fractional element model and the standard linearsolid model are calculated by a least–square fit to the reconstructed complex shear modulus.Results: Images of complex shear modulus from ARC displacement data in a phantom with 6mmdiameter inclusion are presented for increasing frequencies and the averaged absolute value of complexmodulus inside the inclusion is plotted to exhibit a consistent pattern of frequency dependence. The fittedviscoelastic shear stiffness parameters are also plotted against frequencies with a similar pattern. For thetwo complex shear modulus reconstruction images shown below, the averaged modulus inside theinclusion is 3.4998kPa for frequency f = 66.6Hz and 10.9714kPa for frequency f = 125Hz.Conclusions: From a novel combination of ARC displacement data sets, stable recovery of complex shearmodulus is achieved, and the fit of the frequency dependence of the viscoelastic shear stiffnessparameters is established for the fractional element model and standard linear solid model.Acknowledgements: We acknowledge partial funding from NIH Grant No. R01AG029804. This work was performedat the Inverse Problem Center at Rensselaer Polytechnic Institute, GE Global Research and University of Rochester.References:[1] Z. Wu, L. S. Taylor, D. J. Rubens and K. J. Parker: Sonoelastographic Imaging of Interference Patterns forEstimation of the Shear Velocity of Homogeneous Biomaterials. Phys. Med. Biol., 49, pp. 911–922, 2004.[2] J. R. McLaughlin, D. Renzi, K. J. Parker and Z. Wu: Shear Wave Speed Recovery using Moving InterferencePatterns Obtained in Sonoelastography Experiments. J. Acoust. Soc. Am., 121(4), pp. 2438–2446, 2007.[3] K. Lin, J. McLaughlin, A. Thomas, K. Parker, B. Castaneda and D. J. Rubens: Two–Dimensional Shear WaveSpeed and Crawling Wave Speed Recoveries from In Vitro Prostate Data. J. Acoust. Soc. Am. (submitted), <strong>2010</strong>.indicates Presenter67
Session SIP–1: Signal and Image Processing – ISunday, October 17 3:45P – 5:30P006 A NORMALIZATION ALGORITHM FOR AXIAL–SHEAR STRAIN ELASTOGRAPHY.Lujie Chen 1 , R. James Housden 1 , Graham M. Treece 1 , Andrew H. Gee 1 , Richard W. Prager 1 .1 University of Cambridge, Cambridge, England, UK.Background: Recently, there has been interest in correlating the slip pattern of a suspicious lesion to itsmalignancy. Some evidence suggests that the slip pattern is better characterized by the axial–shear strainthan the axial strain [1]. While the difference between the two is simply the direction of the gradient inthe same axial displacement field, the two images have very different properties that impact onvisualization. For example, unlike the axial strain where the absolute value is of interest, the shear strainis more useful when visualized as a signed quantity. This creates a problem when taking a time averageon a sequence of shear strain fields recorded with both compression and relaxation: the signed valuesfrom the different strain directions may cancel, resulting in a loss of information. Furthermore, themajority of data values in a shear strain field are close to zero, which makes it difficult to extractsufficient information to compensate for the variations in probe motion.Aims: To develop a normalization method for axial–shear strain imaging.Methods: An axial strain field can be normalized by fitting a two–dimensional (2D) function to the axialstrain data. The function s = a(1+by)(1+cx) (y and x denote the axial and lateral directions respectively, a,b and c are found by least–squares regression) allows for typical stress variation in the axial and lateraldirections [2]. We propose that the same function, s, can also be used to normalize the shear strain field:'yx(x,y) = arctan[ yx (x,y)/s(x,y)], where yx is the raw shear strain and 'yx is the normalized shear strain.The advantages of this procedure are threefold. Firstly, all data are bounded within the range [-/2, /2],so a display range can be selected with ease. Secondly, since s embodies an estimate of the axial andlateral stress variation, 'yx is compensated accordingly to produce a relatively uniform background.Thirdly, the sign of s is a reliable indicator of the probe's motion (compression or relaxation). Dividing yxby s makes the sign of 'yx independent of this motion.Results: Several phantom and in vivo data sets were tested. Figure 1 shows a sample analysis from a brainscan, which comprises 50 shear strain fields. The axial strain image, Figure 1b, suggests that the tumour isstiffer than the surrounding tissue, subsequently confirmed by histology. The raw shear strain images,Figures 1d–f, indicate that there is a slip boundary around the tumour, but there is no clear contrastbetween the tumour and the background. Better contrast is evident in the normalized shear strain image,Figure 1c. A dark upper left quadrant slip pattern, indicated in Figure 1c, is further evidence of a stiffinclusion. It is stable in the normalized shear strain images but not in Figures 1d–f. With normalization, thesign of the shear data is determined by a property of the tissue and not the probe motion.Conclusions: The proposed normalization method for axial–shear strain facilitates automatic selection ofthe display range, compensates for variations in the probe motion, preserves the signed values duringtime averaging and is able to decouple certain slip patterns inherent to tissue properties from thoseinduced by the probe motion.Acknowledgements: We would like to thank Dr. Christopher Uff for providing the in vivo data set. This work wasfunded by Translation Award 081511/Z/06/Z from the Wellcome Trust.References:[1] A. Thitai Kumar, J. Ophir, and T.A. Krouskop: Noise Performance and Signal–to–Noise ratio of Shear StrainElastograms. Ultrasonic Imaging, Vol. 27, pp. 145–165, 2005.[2] J.E. Lindop, G.M. Treece, A.H. Gee, and R.W. Prager:An Intelligent Interface for Freehand Strain Imaging.Ultrasound in Medicine and Biology, Vol. 34, No. 7,pp. 1117–1128, 2008.Figure 1: Results for the in vivo brain scan. (a) B–mode image,(b) normalized axial strain and (c) normalized shear strain atframe 30 of 50. Raw shear strain at (d) frame 20, (e) frame30 and (f) frame 40. The axial and shear strain images wereobtained under a progressive time average of ten frames.68indicates Presenter
089 LOCAL INVERSION OF THE WAVE EQUATION FOR ELASTICITY IMAGING USING FIRFILTERS.Ali Baghani 1 , Reza Zahiri Azar 1 , Septimiu E. Salcudean 1 , Robert Rohling 1 .1 University of British Columbia, Vancouver, BC, CANADA.Background: Local inversion of the wave equation is one of the techniques used for estimating tissueelasticity from the measured displacements [1]. The equation usually used can be written as μ=–ρ(2πf) 2 u/Δu, where u is a component of the displacement or its curl, f is the frequency of excitation, ρ is thedensity and µ is the shear modulus. The quotient in this formula estimates the (squared) wavelength. Thenumerical calculation of the Laplacian Δ, is the main challenge for wavelength (or frequency) estimation.Aims: To develop custom FIR filters to accurately perform the Laplacian operator for elasticity estimation.Methods: Since the range of elasticity values for most soft tissues is known to be from 5–500 kPa, therange of wavelengths for each frequency of excitation can be calculated. For instance at 200 Hz, thewavelength is from 6.5–65 mm or the spatial frequency from 15.5–155/m. For a typical filter size of15×15×3, there are 675 coefficients to be determined. These coefficients were determined by weighted leastsquares optimization. The error function was the sum of squared differences between the frequencyresponse of the FIR filter and a target frequency response at a number of chosen frequencies. Inside the15.5–155/m frequency range, the target frequency response was chosen to be the true Laplacian. Thespatial variation of the displacements outside the frequency range was considered to be noise, and thetarget frequency response was chosen as a decaying exponential in this range. This is a simple method todeal with measurement noise. If a noise model is available from experiments, it can be incorporated in thefilter design. The spatial frequency domain was sampled uniformly inside the frequency range. To reducethe size of the optimization problem, it was sampled randomly outside the frequency range. Simulationscreated with FEM were used to validate the designed FIR filters and compare against other methods.Results: Figure 1a shows the true elasticity map of the simulated phantom. The background andinclusion have elasticity values of 50 and 100 kPa, respectively. Figure 1b–e show the elastogramsobtained from four different methods by using the data without noise. Figure. 1f–i show thecorresponding elastograms for added white Gaussian noise (SNR = 40 db). In 1b and 1f, the simple 3point finite difference formula was used (filter size=3×3×3). In 1c and 1g, a truncated Laplacian ofGaussian was used (filter size=15×15×3). In 1d and 1h, the local frequency estimator (LFE) was used with7 filter banks [2]. In 1e and 1i the designed FIR filter was used (filter size=15×15×3).Conclusions: Although the finite difference formula gives accurate estimates in the absence of noise(Figure 1b), other methods are needed when dealing with measurement noise in ultrasound data. TheLaplacian of Gaussian (Figure 1c and 1g) gives consistent results in the presence of noise. However, theabsolute values of elasticities are biased. LFE filters (Figure 1d and 1h) produce lower bias. Customdesigned FIR filters (Figure 1e and 1i) give consistent results in the presence of noise and recover theelasticity values correctly.Acknowledgements: This research was supported by Natural Sciences and Engineering Research Council (NSERC).References:[1] T.E. Oliphant: Direct Methods for Dynamic Elastography Reconstruction: Optimal Inversion of the InteriorHelmholtz Problem. Ph.D. dissertation, Mayo Graduate School, 2001.[2] A. Manduca, et al: Visualization of Tissue Elasticity by Magnetic Resonance Elastography. Lecture Notes inComputer Science, Volume 1131, pp. 63–68, 1996.(b) (c) (d) (e)(a)(f) (g) (h) (i)Figure 1: (a) Original distribution of elasticity, (b)–(i) reconstructed elastograms using different methods (see text).indicates Presenter69
033 INVERSE PROBLEMS IN DYNAMIC ELASTOGRAPHY: THEORETICAL, EXPERIMENTAL ANDNUMERICAL ANALYSIS.Thomas Deffieux 1 , Jean–Luc Gennisson 1 , Benoit Larrat 1 , Mathias Fink 1 , Mickaël Tanter 1 .1 Institut Langevin–Ondes et Images, ESPCI Paris Tech, CNRS UMR 7587, INSERM ERL U979,Paris, FRANCE.Background: Dynamic elastography imaging techniques allow quantitative estimation of elasticity thanksto analysis of shear waves propagating in a medium. The possibilities raised by such quantitativetechniques are particularly important for diagnostic purposes, especially for liver fibrosis staging orbreast cancer screening. In dynamic elastography, a force is first applied to generate a shear wave; itspropagation is then imaged and analyzed. By inverting the wave equation or computing the shear wavepropagation velocity, it is possible to retrieve the shear modulus of the medium. Among those techniques,we can distinguish Magnetic Resonance Elastography (MRE), which uses an external mechanical vibratorwith a Magnetic Resonance Imaging (MRI) system to generate and acquire in 3D a complexmonochromatic shear wave in its steady state, and Shear Wave Imaging (SWI), which uses acousticradiation force and an ultrafast ultrasound scanner to generate and image a transient plane shear wave.The two approaches can lead to two natural inversion strategies, the 3D local wave equation in MRE andthe 1D time of flight estimation in SWI made possible by plane shear wave generation.Aims: The goal of this study is to compare both approaches in terms of inverse problems to highlighttheir strengths and drawbacks.Methods: Using a theoretical framework based on the Cramer–Rao Lower Bound and probability theory,the statistical properties of both inversions are derived and explicated in terms of SNR, bias andresolution. Experimental measurements of displacement fields in a calibrated phantom are performedand used as input and control for the theory. Numerical simulations are also performed to investigate theheterogeneous case (with spherical inclusions) and the link between SNR, bias and resolution.Results: In vitro displacements SNRs were found higher in SWI (16dB) than in MRE (10dB) as well asreconstructed elasticity maps SNRs (37dB versus 25dB, respectively). The theoretical frameworks allow agood prediction of the noise and resolution behavior for both approaches and is validated by experimentsand simulations. The SWI approach allows getting higher resolution (500µm) for a given SNR than what ispossible in MRE (2mm) for much shorter acquisition times.Conclusions: The plane wave assumption, made possible in SWI, allows a more robust inverse problemthan the full wave equation inversion. Its general benefits seem to overcome its limitation forexperimental noise levels in the tested cases.70indicates Presenter
042 INCREASE IN SPATIAL RESOLUTION OF LATERAL MODULATION IMAGING.Chikayoshi Sumi 1 , Kunio Shimizu 1 , Yuuki Takanashi 1 .1 Sophia University, 7-1, Kioicho, Chiyodaku, Tokyo, JAPAN.Background: A number of ultrasonic (US) displacement/velocity measurement methods have beenextensively developed for measurements of blood flow, tissue motion and strain [1]. Lateral modulation(LM) methods have also been reported using steered, crossed beams, and these methods permitmeasurements of displacement vectors [1]. LM echo imaging has almost the same lateral resolution asaxial resolution [2]. The beamforming is also used for US microscope, acoustical radiation force imaging(ARFI), high intensity focus ultrasound (HIFU) treatment etc by us. Another new beam steering methodusing only a steering angle (ASTA) [3] is also proposed. The measurements achievable are also used forreconstructing mechanical properties of living tissues (breast, liver, heart, blood) (e.g., [4]).Aims: For the improvement of measurement accuracy and imaging quality by increasing a spatialresolution of echo signals, our previously proposed virtual source is used [5]. The new virtual source usesan arbitrary position ahead of the physical array elements as a virtual source position. Regular orrandom scattering media (material) or holes like point acoustical sources can be used as virtual sources.Moreover, the new Method A is also proposed for LM and ASTA, in which low frequency spectra aredisregarded for increasing the instantaneous frequencies [3]. In conjunction, the spectral division method(Method B) [3] is also proposed for obtaining simultaneous equations in multidimensional autocorrelationand Doppler methods [1]. As a version of ASTA, a non–steering beam is used together with the rotation ofa coordinate system (Method C) [3]. Simultaneous B–mode imaging can also be performed. Recall that forLM, non–symmetric arbitrary steering angles can also be used. For LM and ASTA, when beamforming ispreformed, after receiving echo signals for a beamforming or after obtaining synthesized steering beams,by rotating the coordinate in the spatial or frequency domain, the axial, lateral and elevation frequenciescan also be controlled (Method D) [3]. For LM, this rotation also allows the use of non–symmetric steeringangles with 1D displacement measurement methods (Method E) [3].Methods: An US linear array type transducer was used (US element pitch, 0.2mm; US frequency,7.5MHz). Experiments were performed using the same agar phantom(40 (axial)96 (lateral)40 (elevation) mm 3 ) which was described previously [2,5]. The concentrations of theagar in the stiff cylindrical inclusion (dia.=10mm, depth=19mm) and in the surrounding region were6.0 and 3.0%, respectively. The relative shear modulus obtained was 3.29. The phantom was compressed ina lateral direction. A rectangular ROI 13.7 (axial) 13.2 (lateral) mm was centered on the inclusion. WithLM and ASTA, the same parabolic modulation was performed as described in [2]. The lateral modulationfrequency achieved was 3.75MHz. For Method C, a plane wave transmission was also performed.Results: For virtual sources at depths of 1.0 to 9.0mm, LM was achieved. The lateral resolutions wereevaluated for various depths using a lateral shape of 2D autocorrelation function. The lateral widths ofmain lobes revealed that the virtual source yielded higher uniform lateral resolutions than the physicalsources [5]. Also new Methods A to E worked well. Specifically for Method C, statistics of displacementvectors (magnitudes and angles) measured and shear moduli reconstructed in the inclusion wereevaluated. For instance, for a rotation of 45°, the order of accuracies were, LM > Method C > Method B(ASTA) > Method C with a plane wave >> a conventional beamforming (e.g., means of displacementmagnitudes, about 0.85mm vs SDs, 0.019; 0.020; 0.037; 0.057; 1.208 mm).Conclusions: The virtual source proposed mitigated the physical and electrical limitations for using smallerUS array elements and a smaller pitch such that both high lateral resolution and high echo SNR wereobtained. New methods A to E were also effective. Method C yielded a larger bandwidth than a beamsteering with instantaneous frequencies determined geometrically. However, because the beam steeringallows yielding a higher axial frequency than Method C, Method D may yield more accurate results.Moreover, Method C also allowed no use of a spherical focusing for a transmission. Thus, a use of Method Cwill yield a more accurate 3D displacement vector measurement than conventional 3D beamforming.References:[1] C. Sumi: IEEE Trans. UFFC, 55, pp. 24–43, 2008.[2] C. Sumi, et al.: IEEE Trans. UFFC, 55, pp. 2607–2625, 2008.[3] C. Sumi: Utilization of an Ultrasonic Beam Steering Angle. Rep Med Imag (in press).[4] C. Sumi: Relative Shear Modulus Reconstruction with No Geometrical Artifact. Acoust Sci Tech (in press).[5] C. Sumi, et al.: Effective Ultrasonic Virtual Sources Which Can Be Positioned Independently of Physical ApertureFocus Positions. Rep Med Imag (in press).indicates Presenter71
091 BANDPASS SAMPLING OF HIGH FREQUENCY TISSUE MOTION.H Eskandari 1 , O Goksel 1 , S E Salcudean 1 , R Rohling 1 .1 University of British Columbia, Vancouver, BC, CANADA.Background: Quantitative characterization and inversion of the wave equation requires a high frequencyexcitation. Given the low frame rate of standard ultrasound systems, it is not possible to performdynamic elastography on a large ROI. Based on the conventional sampling theorem, the minimumsampling frequency to avoid aliasing is twice the maximum frequency in the signal.Aims: The objective of this work is to introduce the idea of bandpass sampling (BPS) for dynamicelastography to enable sampling of high frequency tissue motion using the conventional settings of a lowframe rate ultrasound system.Methods: A bandpass signal may still be recovered when sampled at a rate lower than the Nyquist rate[1]. As illustrated in Figure 1, when a bandpass signal is sampled at a lower sampling rate, the spectrumis repeatedly shifted to the baseband frequencies. With the appropriate choice of the sampling frequency,spectrum overlaps can be avoided, and the signal can be accurately recovered. With a spectral bandwidthof B and a center frequency of f c , the allowable bandpass sampling frequency (f s ) falls in the rangemax{2B, (2f c +B)/(m+1)} < f s < (2f c -B)/m, where m is a positive integer indicating the minimum number ofhalf–shifts f s /2 required to project the original spectrum to the baseband [1]. Since even a single spectralline will exhibit a non–zero bandwidth after sampling, the finite observation time imposes additionalguard–bands on f s.Results: Simulations have been performed by modeling tissue deformation with the finite element method.These deformations were then used in the Field II software package to simulate the radiofrequency (RF)data, assuming standard settings of the ultrasound systems. Also, the experimental set–up and theelasticity reconstruction algorithm in [2] have been used to collect tissue–mimicking phantom data. Aphantom with a hard inclusion was vibrated at 120Hz, and RF frames were collected at 50Hz. As expectedfrom the theory of bandpass sampling, the original spectrum could be observed at 20Hz. The motiontracking data and the elasticity estimation results indicate that the reconstruction was accurate whencompared to the case where a higher sampling frequency (i.e. 334Hz) was chosen (Figure 2).Conclusions: Bandpass sampling has not been previously explored for dynamic elastography. Usingbandpass sampling, it is feasible to use conventional beamforming on diagnostic ultrasound systems toperform high frequency dynamic elastography. Bandpass sampling is simpler to implement onultrasound machines, compared to beam interleaving techniques. However, one of the limitations ofbandpass sampling is the lower SNR due to low–frequency noise and tissue motion (e.g. respiratory)which will be studied in future work.Acknowledgements: The authors would like to thank NSERC for funding this work.References:[1] W. M. Waters and B. R. Jarrett: Bandpass Signal Sampling and Coherent Detection. IEEE Trans. on Aerospaceand Electronic Systems, Col. AES–18, No. 6, pp. 731–736, Nov. 1982.[2] H. Eskandari, S. Salcudean, R. Rohling, and J. Ohayon: Viscoelastic Characterization of Soft Tissue fromDynamic Finite Element Models. Physics in Medicine and Biology, Vol. 53, No. 22, pp. 6569–6590, Nov. 2008.(a)(b)Figure 1: (a) The original spectrum of a bandpass signal and (b) the spectrumafter bandpass sampling at a low sampling rate (fs).Figure 2: Phantom displacementsat 120Hz when sampledat (a) 334Hz and (b) 50Hzand the reconstructedelasticity at the samesampling rates (c) and (d).(a) (b) (c) (d)72indicates Presenter
049 A FAST GPU BASED 3D ULTRASOUND DEFORMATION SIMULATION FOR BENCHMARKINGMOTION TRACKING ALGORITHMS.Ted G. Fisher 1 , Timothy J. Hall 1 .1 School of Medicine and Public Health, University of Wisconsin–Madison, Madison, WI, USA.Background: Simulated ultrasound data has been used for many years to investigate different spatio–temporal sampling problems and motion tracking techniques. Field II is commonly used but is quite timeconsuming unless a computing cluster is used [1]. Alternate methods [2] have been performed with goodsuccess, but when presented with a volume of scatterers, these methods take considerable computation timeas well. The complexity of these simulations, and the associated long computational time, is not needed forday to day testing of motion tracking algorithms. The use of a graphics processing unit (GPU) has thepotential to greatly speed up the simulation process by taking advantage of the parallel nature of the problem.Aims: The aim of this project is to create a fast method of simulating pre– and post–deformation volumesof ultrasound data in order to test how well different tracking strategies perform under different motion.Methods: Using CUDA (Nvidia, Santa Clara, CA, USA) we are able access the memory and computing powerof the CUDA–enabled GPU. With this, we are able to run thousands of threads executing concurrently inorder to do massively parallel computations. To simulate a typical 3D ultrasound radiofrequency (RF) signal, avolume of data was first populated with random numbers representing the scattering function at that point,T(x,y,z). The scattering field is then deformed by applying a 3x3 transform matrix on each coordinateeffectively mapping the old coordinates to new coordinates: (x,y,z) -> (x’,y’,z’). Each coordinate is independentof neighboring coordinates (homogenous media) which leads to parallel computation. Using this method,different compressions, expansions and shears can be applied. To determine the value of the scatteringfunction at these deformed coordinates, T(x’,y’,z’), cubic spline interpolation [3] of the original scatteringfunction is used. These new values of the scattering function represent the scattering function values ofdeformed volume at the original grid coordinates, T’(x,y,z). To simulate an RF signal, we convolve the twovolumes of data with a pre–calculated ultrasound 3D PSF. The initial implementation assumes separability ofthe PSF(x,y,z) = PSF(x) * PSF(y) * PSF(z) [4]. The elevation and lateral PSFs are represented by Gaussian curveswith different widths while the axial PSF is represented by a modulated Gaussian pulse. By modeling as such,we are assuming a linear, spatial–shift-invariant system. Assuming PSF separability simplifies thecalculations and makes the algorithm much more parallel.Results: Using an Nvidia GTX 260 video card, deforming a 1024x256x64 grid takes about 10ms or1640Mpixels/s. Using the cubic spline interpolation to regrid the data takes about 14ms or1200Mpixels/s. The 3D convolution takes on average 100ms, or 16.4Mpixels/s. Overall, it takes around2 seconds to simulate the 2 volumes of ultrasound data (3.3 * 10 6 points combined). This includes time tocopy data to and from the CPU, as well as any other CPU time (generating the random numbers, etc).Conclusions: The use of a GPU is quite advantageous in the acceleration of simulations. With thesimulation code written for the GPU, there is an order of magnitude acceleration as compared to C++ codeand two orders of magnitude when compared to Matlab code for doing comparable computations. We arecurrently limited to 2048 points in any of the three directions due to the CUDA limitations on texturereferences. Being able to rapidly change the types of deformations or the size of the PSF of the ultrasoundpulse will help with testing of how different motion tracking strategies perform in different situations.Acknowledgements: We gratefully acknowledge the support fromNIH grants T32–009206 and R21CA133488.References:[1] Jensen J, Nikolov S: Fast Simulation of Ultrasound Images.<strong>Proceedings</strong> the IEEE Ultras Symp in Puerto Rico, Oct 2000.[2] Rao M, Varghese T, Zagzebski JA: Simulation of UltrasoundTwo-Dimensional Array Transducers using a FrequencyDomain Model. Med Phys, Vol. 35, pp. 3162–9, 2008.[3] Ruijters D, ter Haar Romeny B, Suetens P: EfficientGPU–Based Texture Interpolation using Uniform B–Splines.Journal of Graphics Tools, Vol. 13, No. 4, pp. 61–69, 2008.[4] Kallel F, Ophir J: Three–Dimensional Tissue Motion and itsEffect on Image Noise in Elastography. IEEE Trans on UltraFerro and Freq Control, Vol. 44, pp. 1286–96, 1997.(a) (b) (c) (d) (e)Figure 1: (a) Undeformed Scatter Field; (b) DeformedScatter Field, Plane 2% Uniaxial Strain; (c)Deformed RF Plane; (d) Sample AxialDisplacements from Motion Tracking; (e)Sample Axial Strain from Motion TrackingDisplacements.indicates Presenter73
061 A COUPLED SPECKLE TRACKING ALGORITHM FOR ELASTICITY IMAGING: INITIAL IN VIVOEXPERIENCE.Jingfeng Jiang 1 and Timothy J. Hall 1 .1 Medical Physics Department, University of Wisconsin–Madison, Madison, WI 53705, USA.Background and Aims: In ultrasound strain imaging, tissue displacements along the insonification(axial) direction are often measured to assess “relative stiffness”, while the displacements perpendicular(lateral) to the ultrasound beam, necessary for accurate motion tracking, are typically discarded becauseof their poor accuracy. However, for many more advanced elasticity imaging applications such asmodulus inversion, temperature imaging through measurements of thermal expansion and shear strainimaging, all components of the displacement vector become essential. Furthermore, the efficacy of theseadvanced elasticity imaging techniques are largely dependent on the quality of both axial and lateraldisplacement estimates. Our objective of this study is to improve the speckle tracking accuracy for bothaxial and lateral directions using conventional ultrasound echo data acquired with standard clinicalultrasound equipment and with freehand scanning.Methods: The proposed coupled speckle tracking technique involves three steps: (a) estimating the initialdisplacement and strain using a regularized speckle tracking method [1]; (b) shifting and stretching thepost–deformation kernel locally using sample–level displacement and axial strain estimates assuminglocal tissue incompressibility; and (c) performing coupled sub–sample estimation to obtain high qualityaxial and lateral displacements. In the first step, a regularized speckle tracking algorithm [1] is used tosignificantly reduce the occurrence of large tracking errors due to "false correlation peaks" that are alsoknown as "peak hopping" errors [2]. The second step uses the information of "sample–level"displacements and estimated axial strains of Step 1 to locally compensate for apparent motion and,further, for deformations both corresponding to the search kernel on the target radiofrequency (RF)frame. In this step, we explicitly assume that the object being imaged is incompressible under the planestress condition. In the third step, based on the linear system theory of medical ultrasound [3], we fit iso–contours/surfaces (2D/3D) of the estimated correlation functions to ideal ellipses and ellipsoids to obtaintheir centers (i.e. the true correlation peaks in sub–sample accuracy).Results: Computer simulation results show that the method greatly reduces the standard deviations oftracking errors. For high strain cases, such reductions are up to a factor of 2 and 10 under 5% of uni–axial compressions for lateral and axial displacements, respectively. From in vivo breast lesion datainvestigated, we found high quality lateral displacements and shear strains can be estimated for largeaccumulative compressions (up to 15% frame–average strain).Conclusions: A novel coupled speckle tracking algorithm along with its theoretical basis is presented.Overall, our initial results demonstrated that this conceptually and computationally simple method couldbe used to improve displacements for ultrasound–based quasi–static elasticity imaging with currentclinical equipment. In the near future, we plan to further investigate the use of this novel speckle trackingalgorithm in conjunction with more advanced elasticity imaging techniques such as nonlinear modulusinversion [4].Acknowledgements: This study was supported in part by NIH grants R21CA133488 and R01CA140271.References:[1] J. Jiang and T. Hall: A Generalized Speckle Tracking Algorithm for Ultrasonic Strain Imaging using DynamicProgramming. Ultrasound in Medicine and Biology, Vol. 35, pp. 1863–1879, 2009.[2] W.F. Walker and G.E. Trahey: Fundamental Limit on Delay Estimation using Partially Correlated SpeckleSignals. IEEE Transactions on Ultrasonics, Ferroelectrics, and Frequency Control, Vol. 42, pp. 301–308, 1995.[3] J. Meunier and M. Bertrand: Ultrasonic Texture Motion Analysis: Theory and Simulation. IEEE Transactions onMedical Imaging, Vol. 14, pp. 293–300, 1995.[4] A.A. Oberai et al.: Linear and Nonlinear Elasticity Imaging of Soft Tissue In–Vivo: Demonstration of Feasibility.Physics in Medicine and Biology, Vol. 54, pp. 1191–1207.74indicates Presenter
Session CVE: Cardiovascular ElasticityMonday, October 18 8:00A – 10:00A019 A MODEL–BASED APPROACH TO INTRAVASCULAR ULTRASOUND ELASTOGRAPHY.Michael S. Richards 1 , Marvin M. Doyley 1 .1 Electrical and Computer Engineering Department, University of Rochester,Rochester, NY, USA.Background: Cardiovascular disease and, in particular atherosclerosis, is the cause of approximately1 in 3 deaths in the United States [1]. The study of arterial plaque mechanics is essential to the detectionand monitoring of vulnerable plaque. Intravascular ultrasound (IVUS) is a common diagnostic tool usedin the monitoring of the disease and IVUS elastography is method in development for studying plaquemechanics [2].Aims: Our work aims to develop and characterize a minimally constrained, inverse reconstructionalgorithm to quantify the shear modulus () of arterial tissue imaged with IVUS. Unlike previoustreatments, our algorithm uses a total variation regularization penalty rather than parametric lumping toensure the problem is well posed.Methods: We conducted simulation and phantom studies to evaluate the performance of ourmodel-based inversion technique. We obtained multiple displacement estimates for various appliedpressures that were used simultaneously as input to the image reconstruction algorithm. The inversealgorithm seeks to find a shear modulus distribution that yields predicted displacement fields, under theappropriate boundary conditions, that match the measured fields [3].Results: Reconstruction results show good agreement with true shear modulus distributions (up to amultiplicative constant). Figure 1 shows an example finite element model simulation in which a softplaque (=5 kPa) is present in a hard background (=15 kPa) with a harder cap at the lumen boundary(=20 kPa). Figure 2 shows the reconstruction result when only the radial displacement component of the“measured” field is used in the reconstruction. Figure 3 shows the improvement in the reconstructionwhen the angular (lateral) displacement estimates are also used in the reconstruction.mm (kPa)mmFigure 1: Shear modulus ()distribution in forwardsimulation.mmFigure 2: Reconstructed modulusdistribution using onlyradial displacementinformation.mmFigure 3: Reconstructed modulususing both radial andlateral displacementcomponents.Conclusions: The feasibility of a minimally constrained reconstruction algorithm is shown with a highdegree of accuracy. Results show that, if available, reconstructions are improved with lateraldisplacement information.Acknowledgements: This work is funded by the National Heart and Lungs Research grant R01 HL088523.References:[1] D. Lloyd–Jones, R. Adams, M. Carnethon et al.: Heart Disease and Stroke Statistics – 2009 Update: A Reportfrom the American Heart Association Statistics Committee and Stroke Statistics Subcommittee. Circulation,Vol. 119, No. 3, pp. e21–181, Jan 27, 2009.[2] C.L. de Korte and A.F. van der Steen: Intravascular Ultrasound Elastography: An Overview. Ultrasonics, Vol. 40,No. 1–8, pp. 859–65, May, 2002.[3] M.S. Richards, P.E. Barbone, and A.A. Oberai: Quantitative Three–Dimensional Elasticity Imaging fromQuasi–Static Deformation: A Phantom Study. Phys Med Biol, Vol. 54, No. 3, pp. 757–79, Feb 7, 2009.indicates Presenter75
020 RF–BASED 2D STRAIN IMAGING IN THE NORMAL AND DISEASED ABDOMINAL AORTA.RGP Lopata 1,2 , HHG Hansen 3 , GW Schurink 4 , CL de Korte 3 , EMH Bosboom 1,2 , FN van de Vosse 1,2 .1 Eindhoven University of Technology, Eindhoven, The NETHERLANDS; 2 Maastricht UniversityMedical Center, Maastricht, The NETHERLANDS; 3 Radboud University Nijmegen Medical Center,Nijmegen, The NETHERLANDS; 4 General Surgery Department, Maastricht University MedicalCenter, Maastricht, The NETHERLANDS.Background: An abdominal aortic aneurysm (AAA) is a local dilatation of the aorta. In general, patientswith an AAA are asymptomatic, but AAA rupture leads to death in most cases. CT and MR scans can beused to estimate growth and to perform wall stress analysis using Finite Element Modeling. Ultrasound isused to estimate AAA diameter and growth. Vascular elastography might provide insight in the straindistribution over the aortic wall [1] and its mechanical properties and give indications for rupture risk.Aims: The aim of this study was to determine the feasibility of mechanical characterization of the vessel wallby performing 2D radio frequency (RF) based strain imaging on both healthy and diseased human aortas.Methods: RF data were acquired from five healthy volunteers’ aortas and one patient’s aorta diagnosedwith AAA. The healthy aortas were imaged in both transverse and longitudinal planes with an EsaoteMyLab 70 ultrasound system equipped with an RF–interface and a linear array probe (center frequency(f c ) = 7MHz, sampling frequency (f s ) = 50MHz). To allow sufficient penetration, the AAA was imaged with acurved array transducer (f c = 3.5MHz). Data were acquired during a fixed period of 6s at a moderateframe rate (f r ) of 20–25Hz. For four subsequent heartbeats, an iterative RF–based strain algorithm wasused with a resolution of 200m axial x 1 RF-line to estimate the 2D displacement field [2]. A total of140–160 images was analyzed for each subject. In the transverse images, ellipses ranging from thelumen/aorta boundary to the outer aorta interface were defined and tracked over the cardiac cycle,resulting in the radial (R) and circumferential (C) displacements. In the longitudinal view, a square regionaligned with the vessel orientation was tracked, yielding the radial and longitudinal (L) strains. The strainwas calculated using a 5 x 11 2D least squares strain estimator (LSQSE).Results: Results for the healthy volunteers showed a peak cumulative systolic strain over aninter–quartile range of 5.0 – 13.5% (R), 7.2 – 9.1% (C) and 0.1 – 6.5% (L) in the upper wall. The straincurves were reproducible for consecutive cardiac cycles. The use of ellipsoids resulted in a directprojection of the axial and lateral displacements in the radial and circumferential directions. In the AAApatient, strain was measured in the wall with the aneurism and thrombus. Results showed a relativelylow peak cumulative strain of 0.6 – 1.0% (R) and 0.4 – 2.4% (C) in the wall with the aneurism and0.9 – 1.5% (R) and 3.3 – 4.3% (C) in the thrombus.(a)(c)(b)Figure 1: Radial (a) and circumferential (b) strain in atransverse ultrasound image of the aorta duringthe cardiac cycle and corresponding strain curves.Conclusions: RF–based 2D strain imaging of the normal and diseased aorta is feasible. A large group ofAAA patients will be examined to investigate the reproducibility and sensitivity of the method.Improvement of transverse image quality is required to enhance strain estimation precision. Consideringthe complex geometry of the aneurysms, extension of the technique to 3D is recommended.References:[1] Fromageau J, et al.: Non–Invasive Vascular Ultrasound Elastography Applied to the Characterization ofExperimental Aneurysms and Follow–Up after Endovascular Repair. Phys Med Biol, 53, pp. 6475–6490, 2008.[2] Lopata RGP, et al.: Methodical Study on the Measurement of Strain in Deforming Structures with Large Shearingand Rotational Movement using RF–Based 1D and 2D Strain Estimation. IEEE UFFC, 57(4), pp. 855–865, <strong>2010</strong>.76indicates Presenter
021 4D CARDIAC STRAIN IMAGING USING RF–DATA IN YOUNG CHILDREN.RGP Lopata 1,2 , MM Nillesen 3 , JM Thijssen 3 , L Kapusta 3 , CL de Korte 3 .1 Eindhoven University of Technology, Eindhoven, The NETHERLANDS; 2 Maastricht UniversityMedical Center, Maastricht, The NETHERLANDS; 3 Radboud University Nijmegen Medical Center,Nijmegen, The NETHERLANDS.Background: Congenital heart diseases, such as valvular aortic stenosis, may result in severehypertrophy and fibrosis of the heart. Quantification of tissue contractility is required to monitor theprogression of such disease. In recent years, 3D (+t) strain imaging techniques have been applied toechocardiographic data to assess 3D strain. Several studies on speckle tracking [1,2] and imageregistration [3] have been reported, but only few groups attempt raw ultrasound radiofrequency (RF)based strain imaging.Aims: In this study, a 2D (+t) RF–based strain estimation method [4,5], was extended to 3D and appliedto 3D (+t) RF data acquired in young children.Methods: Eight young, healthy children were imaged (age 6 – 14 years). RF data were acquired with aPhilips iE33 3D ultrasound system, equipped with a pediatric X7 probe. ECG–gated acquisition was used toobtain full volume 3D RF data of the left ventricle over one cardiac cycle at a relatively low frame rate of38–51Hz. An iterative, ‘free–shape’ 3D displacement estimation algorithm was used to estimate the axial,lateral and elevational displacements simultaneously (resolution of 0.5mm by 1.25ºx1.25º). The heart musclewas segmented by drawing ellipses manually in several short–axis and long–axis views and fitting a 3Dellipsoid. The points on this 3D ellipsoid were tracked in time using the 3D displacement fields, therebyprojecting the axial, lateral and elevational displacements in the radial (R), longitudinal (L) and circumferential(C) directions. Strains were calculated by applying a 5x11x11 3D LSQSE in the RLC directions.Results: Preliminary results revealed the applicability of the 3D strain estimation technique on full volume3D RF data. The technique enabled 3D strain images of all three strain components. The average strains forall children in the lateral wall were R = 32 13% (infero–lateral) and R = 41 15% (antero–lateral),C = -11 4% (antero–lateral) and C = -9 2% (infero–lateral), L = -17 6% (antero–lateral) and L = -14 5%(infero–lateral). In the septum, strains were found to be R = 16 14% (antero–septal) and R = 13 9%(infero–septal), C = -11 4% (antero–septal) and -17 1% (infero–septal) and L = -16 3% (antero–septal)and L = -13 3% (infero–septal). Strains in the anterior and inferior wall seemed underestimated. In theseregions, the direction of the ultrasound beam is parallel to the myocardial wall. This results in a lowerimage quality. Besides, in these regions, the radial strain contains mostly lateral displacement and straininformation, which is of lower quality due to the lack of phase information and resolution. Unfortunately,the field of view and image quality were not always sufficient to image the entire left ventricle.Conclusions: RF–based 3D strain imaging can be used to estimate 3D strain within the left ventricularwall. The combination of RF–based strain imaging and segmentation [6] might result in a fully automatedtechnique, revealing both geometry and function.Acknowledgements: The support of the Dutch Technology Foundation (STW) and Philips Medical Systems.References:[1] Chen X, Xie H, Erkamp R, et al.: 3–D Correlation–Based Speckle Tracking. Ultrason Imag, 27, pp. 21–36, 2005.[2] Crosby J, Amundsen BH, Hergum T, Remme EW, Langeland S, Torp H: 3–D Speckle Tracking for Assessment ofRegional Left Ventricular Function. Ultrasound Med Biol, 35, pp. 458–471, 2009.[3] Elen A, Choi HF, Loeckx D, et al.: Three–Dimensional Cardiac Strain Estimation using Spatio–Temporal ElasticRegistration of Ultrasound Images: A Feasibility Study. IEEE Trans Med Imag, 27, pp. 1580–1591, 2008.[4] Lopata RGP, Nillesen MM, Gerrits IH, Thijssen JM, Kapusta L, de Korte CL: 4D Cardiac Strain Imaging: Methodsand Initial Results. IEEE International Ultrasonics Symposium, New York, NY, USA, pp. 872–875, 2007.[5] Lopata RGP, Hansen HHG, Nillesen MM, Thijssen JM, de Korte CL: Methodical Study on the Measurement ofStrain in Deforming Structures with Large Shearing and Rotational Movement using RF–Based 1D and 2D StrainEstimation. IEEE Ultrasonics, Ferro–Electrics & Frequency Control, 57(4), pp. 855–865, <strong>2010</strong>.[6] Nillesen MM, Lopata RGP, Gerrits IH, et al.: Segmentation of the Heart Muscle in 3–D PediatricEchocardiographic Images. Ultrasound Med Biol, 33, pp. 1453–1462, 2007.indicates Presenter77
003 SEGMENTAL DISPLACEMENT AND STRAIN ANALYSIS OF LEFT VENTRICULARDEFORMATIONS.Chi Ma 1 , Hao Chen 2 , Tomy Varghese 1 , P.S. Rahko 3 , A.F. Kelly 3 .1 Medical Physics, 3 Cardiovascular Medicine Section, University of Wisconsin–Madison, Madison,WI, USA; 2 Emory University, Atlanta, GA, USA.Background: Echocardiography is used routinely for assessing regional myocardial function. Clinicaldiagnosis based on visually assessed wall motion scoring and evaluation of wall thickening issemi–quantitative, image quality dependent and heavily weighted by operator experience. Tissue Dopplerhas also been utilized. However, due to limitations in Doppler–derived velocity and strain indices, therehas been renewed interest in using B–mode based strain and strain rate measurements. Cardiacelastography using [1-4] radiofrequency (RF) echo signals can provide more accurate two–dimensional(2D) strain information than B–mode image data, provided data are acquired at sufficient frame rates.Aims: To evaluate and compare B–mode and RF based speckle tracking for cardiac elastography usingcardiac segmental analysis.Methods: Cardiac ultrasound RF data along the parasternal short–axis views were acquired from7 healthy volunteers from 20–30 years of age using GE Vivid 7 System with a 2.5 MHz phased arraytransducer under an approved Institutional review board protocol. A multilevel hybrid 2D strain imagingalgorithm for sector/phased array [5] was used for displacement and strain estimation for both RF andB–mode data sets. Displacement and strain analysis was performed using both regional and globalanalysis based on 6 segments within the short–axis view as illustrated in Figure 1. The estimated localdisplacement and strains were averaged within each segment over the cardiac cycle. Global displacementand strain were computed over all six segments. Finally, the mean displacement and strain along withthe standard error (error bars) were plotted and compared over the cardiac cycle.Results: Plots of the mean axial displacement and strain in segment 1 along with error bars are shown inFigures 2 and 3, respectively. Both plots indicate the significant under estimation of displacement andstrain obtained using B–mode instead of RF speckle tracking. Error bars denote the standard error andindicate the variability in the estimates over segment 1. Note the similar pattern of the displacement andstrain over 4 cardiac cycles. Similar results are obtained over all the segments and over differentvolunteers. Speckle tracking using RF data is also more sensitive as shown in Figures 2 and 3.Conclusions: Preliminary results demonstrate the ability to compare different processing techniquesusing segmental and global analysis for the displacement and strain distributions over the cardiac cycle.These results demonstrate the potential of comparing normal values generated over the cardiac cycle onvolunteers to data acquired on patients with coronary artery disease or cardiomyopathy to determinestrain features for identifying pathological changes.Acknowledgements: This work was supported by NIH grants 5R21EB010098 and R01CA112192.References:[1] E. Konofagou, J. D’Hooge, J. Ophir: Ultrasound Med Biol, Vol. 27, No. 4, pp. 475–82, 2002.[2] T. Varghese, JA Zagzebski, PS. Rahko, CS Breburda: Ultrason Imaging, 25(1), pp. 1–16, 2003.[3] S. Langeland, J. D'hooge, T. Claessens, et al.: IEEE Trans Ultrason Ferroel Freq Cont, 51(11), pp. 1537–46, 2004.[4] RG. Lopata, MM. Nillesen, CN. Verrijp, et al.: Phys Med Biol, Vol. 55, No. 4, pp. 963–79, <strong>2010</strong>.[5] H. Chen and T. Varghese: Med. Phys., Vol. 36, No. 6, pp. 2098–2106, 2009.Figure 1: Segmental analysis of theleft ventricular wallFigure 2: Mean displacementfor segment 1Figure 3: Mean axial strainfor segment 178indicates Presenter
022 METHOD FOR MINIMIZING THE EFFECT OF CATHETER ECCENTRICITY ININTRAVASCULAR ULTRASOUND ELASTOGRAPHY.Shayin Jing 1 , Michael S. Richards 1 , Marvin M. Doyley 1 .1 Electrical and Computer Engineering Department, University of Rochester, Rochester, NY, USA.Background: Each year, over 750,000 Americans experience an acute coronary syndrome or suddencardiac death when a life–threatening atherosclerotic plaque ruptures in the later stages of coronaryatherosclerosis [1]. To determine the propensity of atherosclerotic plaque rupture, we need to know themechanical properties of the atherosclerotic plaque. One method that intravascular ultrasound (IVUS)elastography visualizes the radial strain is by performing cross–correlation analysis on radio frequency(RF) echo frames obtained at different intraluminal pressures. Although radial strain correlates well withthe intrinsic tissue, artifacts will occur when the vessel and catheter coordinate systems are misaligned.Aims: The goal of this presentation is to describe a mapping method that we have developed for reducingthe effect of catheter eccentricity [2].Methods: In this work, we modeled the catheter eccentricity problem as a simple translation between twopolar coordinate systems. Note that by knowing the radial and circumferential displacement, we canderive a closed form expression that can be used to map the displacement fields measured in onecoordinate system (i.e., the catheter) to the other coordinate system (i.e., the vessel coordinate system). Todemonstrate the algorithm, we conducted simulation studies with the displacement field obtained fromdifferent eccentric locations.Results: Figure 1 shows radial strain elastograms obtained when the catheter was at different locationsin an elastically homogeneous vessel, before and after coordinate systems were realigned. Strain artifactsare apparent in the elastograms computed in the catheter coordinate system, which was minimized bymapping the displacement field to the vessel coordinate system before computing radial strain. Figure 2shows radial strain elastograms obtained for different IVUS catheter locations in an elasticallyinhomogeneous vessel model. Again, artifacts incurred when radial strain was computed in the cathetercoordinate system; however, we circumvented this problem by computing strain in the vessel coordinatesystem.Figure 1: (a) radial strain of an elasticallyhomogeneous vessel observed from thevessel coordinate system; (b) strainelastogram calculated from measureddisplacement field with catheter 3mm offcenter; (c) strain elastogram calculated fromcorrect displacement field. (a) (b) (c)Figure 2: (a) radial strain of an elasticallyinhomogeneous vessel with respect to thevessel center; (b) strain elastogramcalculated from measured displacementfield with catheter 3mm off center; (c) strainelastogram calculated from correctdisplacement field. (a) (b) (c)Conclusions: We can reduce artifacts incurred from catheter eccentricity by mapping radialdisplacements measured in the catheter coordinate system to the vessel coordinate system usingknowledge of radial and circumferential displacement obtained from a non–rigid image registrationmethod.Acknowledgements: Work is funded in part by the National Heart and Lungs Research Grant R01 HL088523.References:[1] Howard M. Loree, Roger D. Kamm, et al.: Effects of Fibrous Cap Thickness on Peak Circumferential Stress inModel Atherosclerotic Vessels. Circulation Research, 71, pp. 850–858, 1992.[2] Chris L. de Korte, E. Ignacio Cespedes, et al.: Influence of Catheter Position on Estimated Strain in IntravascularElastography. IEEE UFFC, 46, pp. 616–625, 1999.indicates Presenter79
023 PLAQUE VISUALIZATION WITH A COMBINED B–MODE/ARFI/DOPPLER REAL–TIME IMAGINGSYSTEM: TEMPORAL AND SPATIAL STABILITY.Joshua R. Doherty 1 , Douglas M. Dumont 1 , Jeremy J. Dahl 1 , Jason D. Allen 1 , Gregg E. Trahey 1 .1 Duke University, Durham, NC, USA.Background: Acoustic radiation force impulse (ARFI) imaging has shown to be useful in non–invasivelycharacterizing the mechanical properties of vascular tissue [1]. To that end, it has been hypothesized thatradiation force can be used in vivo to detect carotid artery plaques and, more importantly, differentiatebetween hard and soft regions of plaque tissue. Shown to play an important role in the onset of ischemicevents, the identification of more vulnerable, soft lipid filled plaques compared to harder, calcified plaqueregions would help clinicians better diagnose a patient’s risk of stroke [2]. In order to assess the clinicalviability of ARFI methods in characterizing carotid plaques, it is necessary to establish the temporal andspatial stability of plaque visualization using such methods.Aims: To investigate the temporal and spatial stability of ARFI imaging in the visualization of in vivoplaques by developing a real–time combined B–mode/ARFI/Doppler imaging system that producestemporally and spatially co–registered depictions of cardiovascular elasticity with blood flow.Methods: A novel sequence was developed to acquire multiple frames of co–registered B–mode, ARFI andDoppler data. Implemented on a conventional Siemens ultrasound scanner (Issaquah, WA), the carotidarteries of normal and atherosclerotic subjects with moderate (50–69%) stenosis were scanned. CombinedB–mode/ARFI/Doppler In–phase Quadrature demodulated radiofrequency data were collected acrossseveral heartbeats and at various angles. To assess temporal stability, the consistency of ARFIdisplacements from beat–to–beat as well as across the cardiac cycle was investigated. Plaque visualizationand artifacts within the field of view were evaluated as a function of transducer location and angle toassess spatial stability.Results: A real–time imaging system capable of capturing B–mode/ARFI/Doppler in a single frame at a rateof 40 ms/frame was developed for visualizing vascular tissue in vivo (Figure 1). Temporal sequences ofvascular ARFI images showed excellent correspondence with B–mode and Doppler depictions. The measuredARFI displacements of vascular tissue were temporally stable but dependent upon transducer location.Conclusions: We have developed a B–mode/ARFI/Doppler imaging system capable of rendering real–timeimages of carotid artery plaques in vivo. Investigations of the temporal and spatial stability of ARFImeasurements suggest that the ability of ARFI imaging to characterize mechanical properties of plaque(i.e. distinguish hard vs. soft plaque regions) is a function of transducer location and angle. As such, withthe ability to measure ARFI displacements throughout the cardiac cycle, over several heartbeats and atmultiple locations or angles, we believe the identification of potentially vulnerable lipid cores in plaquetissue is improved using this real–time diagnostic tool.Acknowledgements: This work is supported by NIH Grants R01–HL075485.References:[1] Dahl, J.J, Dumont, D.M., Allen, J.D. Miller, E.M., and Trahey, G.E.: Acoustic Radiation Force Impulse Imagingfor Noninvasive Characterization of Carotid Artery Atherosclerotic Plaques: A Feasibility Study. Ultrasound inMed. Biol., Vol. 35:5, pp. 707–716, May 2009.[2] Redgrave, J.N., Lovett, J.K., Gallagher, P.J. and Rothwell, P.M.: Histological Assessment of 526 SymptomaticCarotid Plaques in Relation to the Nature and Timing of Ischemic Symptoms: The Oxford Plaque Study.Circulation, Vol. 113:19, pp. 2320–2328, May 2006.(a)(b)Figure 1: Captured single frame image,showing co-registered B–mode with(a) color Doppler (cm/s) and (b)ARFI displacement (μm) taken froma sequence acquired at a triplexframe rate = 40ms/frame of acarotid artery (lower) and jugularvein (upper) in a normal subject.80indicates Presenter
037 NON–INVASIVE MULTI–ANGLE STRAIN IMAGING IN PULSATING VESSELS.Hendrik HG Hansen 1 , Michiel Keijts 1,2 , Richard GP Lopata 3,4 , Tim Idzenga 1 , Chris L de Korte 1 .1 Clinical Physics Laboratory, Radboud University Nijmegen Medical Center, Nijmegen, TheNETHERLANDS; 2 Electrical Engineering Department, Eindhoven, Eindhoven University ofTechnology, The NETHERLANDS; 3 Biomedical Engineering Department, Maastricht University,Maastricht, The NETHERLANDS; 4 Biomedical Engineering Department, Eindhoven University ofTechnology, Eindhoven, The NETHERLANDS.Background: Radial and circumferential strain images of transverse cross–sections of vessels are scarcelyreported, mainly because it also requires a precise estimation of the lateral strain. Lateral strains aremore challenging to estimate due to the lower resolution and the lack of phase information. We haveshown recently [1] that projection of axial displacements acquired at multiple beam steering anglesenables a precise estimation of lateral, radial and circumferential strains. However, the method has onlybeen tested using quasi–static phantoms, thus interframe motion artifacts were not present.Aims: This study investigates the performance of the projection technique in recordings of a pulsatingphantom mimicking an atherosclerotic vessel and in acquisitions of carotid arteries in vivo.Methods: A two–layered phantom (see Figure 1) was constructed by freeze–thawing a 10% polyvinyl–alcoholsolution with 2% silica–carbon (SiC) particles. The outer layer was freeze–thawed four times, the softerinner layer (plaque) once. The phantom was placed in a water tank and connected to a pump thatprovided a pulsating (1Hz) water flow of 400ml/min resulting in a pressure wave between 2 and19mmHg. Radio frequency (RF) data of the phantom were recorded during 3 seconds using a modifiedMedison Accuvix V10 that sequentially stored data from beam steering angles of -26°, 0° and 26°. Thedata were acquired at a frame rate of 129Hz (43Hz/beam steered angle) using an L5–13 linear transducer(center frequency (f c ) = 8.5MHz, sampling frequency (f s ) = 61.6MHz). Displacements were iterativelycalculated using 2D cross–correlations. Next, radial and circumferential displacements were derived withprojection (multi–angle acquisition) and without projection (conventional 0° acquisition) [1]. Thecorresponding strains were derived using nine–point least squares strain estimators. Cumulative strainimages of the phantom with and without projection were constructed for a pressure increase of 15mmHgby cumulating subsequent strain images (pressure steps between images
045 INTRAVASCULAR ULTRASOUND ELASTOGRAPHY OF CORONARY ARTERIES: A PRE– ANDPOST–ATHERECTOMY STUDY.Younes Majdouline 1 , Yoshifumi Saijo 2 , François Destrempes 1 , Jacques Ohayon 3 , Guy Cloutier 1 .1 Laboratory of Biorheology and Medical Ultrasonics, University of Montréal Hospital ResearchCenter (CRCHUM), Montréal, Québec, CANADA; 2 Medical Engineering and CardiologyDepartment, Institute of Development, Aging and Cancer, Tohoku University, Aobaku, Sendai,JAPAN; 3 Laboratory TIMC–DynaCell, UJF, CNRS UMR 5525, In 3 S, Grenoble, FRANCE.Background: Pathological diagnosis of atherosclerotic coronary plaques aims to prevent thrombosisprone rupture of the artery wall, which can induce an acute ischemic syndrome. Elastography byintravascular ultrasound (IVUS) is a useful technique because plaque components such as lipid, fibrosisand calcification can be directly assessed by the difference in tissue deformations. In a recent preliminarystudy, we performed in vivo vascular elastography corroborated by histology [1]. A global image rotationcompensation improving the quality of elastograms was used.Aims: In this work, we evaluated the potential of IVUS elastography to investigate the difference inmechanical properties of the artery wall before and after catheter–based atherectomy.Methods: A robust algorithm known as the Lagrangian Speckle Model Estimator [2] was applied to in vivodata obtained from 11 arteries (different patients) before and after directional coronary atherectomy(DCA). Before elastogram calculation, the pre–processing included the detection of the vessel wall andglobal IVUS catheter rotation compensation [1,3]. Instantaneous strain histograms were plotted atpeak–flow (i.e., maximum wall compression). The peak–compression strain was estimated as the peak ofthe histogram (as in Figure 1), and this value was used for statistical analysis over the whole database.Results: Analyses revealed a significant difference in radial deformations between pre– andpost–atherectomy data. Peak–compression strains were higher in the artery before DCA (unpaired t–test,p < 0.003), which may be indicative of lipid pool and connective tissue removal during the intervention.Conclusions: This study showed that the peak–compression strain may be indicative of the presence ofsoft lipid pools in patients with unstable angina referred for intervention. The difference in elasticity ofthe arterial wall before and after DCA shows the potential of IVUS elastography to differentiatemechanical properties of the atherosclerotic plaque and, therefore, may also evaluate the risk of rupture.Acknowledgments: Financial support was obtained by a joint international initiative of NSERC Strategic grantprogram of Canada (#STPGP–381136–09) and ANR of France (MELANII project # 09–BLANC–0423).References:[1] Fromageau J., Saijo Y., Maurice R.L., Roy Cardinal M.H., Cloutier G.: IVUS Elastography of Complex HumanCoronary Plaques Treated by Directional Atherectomy: Technical Issues and Preliminary Clinical Results.2 nd MICCAI Workshop on Computer Vision for Intravascular and Intracardiac Imaging, pp. 88–95, 2008.[2] Maurice R.L., Ohayon J., Finet G., Cloutier G.: Adapting the Lagrangian Speckle Model Estimator forEndovascular Elastography: Theory and Validation with Simulated Radio–Frequency Data. J. Acoust. Soc. Am.,116 (2), pp. 1276–1286, 2004.[3] Roy Cardinal M.H., Meunier J., Soulez G., Maurice R.L., Therasse E., Cloutier G.: Intravascular UltrasoundImage Segmentation: A Three–Dimensional Fast–Marching Method Based on Gray Level Distributions. IEEETrans. Med. Imag., 25(5), pp. 590–601, 2006.Figure1: Example of a radial strainhistogram at peak compression.Pre–DCA (solid line)Post–DCA (dashed line)82indicates Presenter
Session MIP–2: Methods for Imaging Elastic Tissue Properties – IIMonday, October 18 10:30A – 12:00P043 QUANTIFYING THE IMPACT OF SHEAR WAVELENGTH ON SHEAR WAVE SPEED ESTIMATION.ML Palmeri 1 , NC Rouze 1 , MH Wang 1 , X Ding 1 , KR Nightingale 1 .1 Duke University, Durham, NC, USA.Background: The propagation speed of shear waves (c T ) resulting from focused, impulsive acousticradiation force excitations can be estimated in soft tissues to reconstruct the tissue’s shear stiffness (µ)using the relationship c T = sqrt(µ/ρ) under the assumption of constant density (ρ = 1.0g/cm 3 ) in a linear,elastic, isotropic solid. Using a priori information about the shear wave propagation direction relative tothe excitation beam, shear wave positions through time can be determined using dynamic displacementmetrics, such as time–to–peak (TTP) displacement [1] or correlation–based methods [2].Aims: The purpose of this work is to evaluate the impact that spatial shear wavelength has on theaccuracy and precision of shear wave speed (SWS) estimates.Methods: Finite element method (FEM) models were used to simulate the dynamic tissue responseassociated with impulsive (50–500µs), 3D axisymmetric Gaussian excitations with varying widths (0.25–1.0cm -6dB widths) in linear, isotropic, elastic media (µ = 0.3–8kPa). 0.3 x 0.3 x 0.3mm 3 elements wereused in a quarter–symmetry mesh solved with an explicit, time–domain solver (LS–DYNA, LivermoreSoftware Technology Corp., Livermore, CA). The excitations were extended to asymmetric Gaussians andcomplex 3D distributions associated with two commercial transducers; the Siemens CH4–1 (focus at49mm, 2.2MHz) and the VF10–5 (focus at 20mm, 6.7MHz). The impact of ultrasonic tracking, and morespecifically, displacement estimation bias and jitter, were evaluated using Field II [3] simulations with afixed 10kHz pulse repetition frequency. Experimental validation of the CH4–1 and VF10–5 results wereperformed using tissue–mimicking phantoms (Computerized Imaging Reference Systems, Norfolk, VA)with shear stiffnesses ranging from 1.4–16.0kPa. The Lateral TTP algorithm was used for the SWSreconstructions [1]. Spatial shear wavelengths were defined as the -6dB width from the peakdisplacement for the monophasic shear waves resulting from the impulsive excitations. Axial excitationgradients were considered negligible for the depth of analysis in this study (i.e., the focal depth).Results: TTP displacements were directly related to the excitation duration (Trad), excitation beamwidth(σ) and density (ρ) of the material, and inversely related to the shear stiffness (µ), following therelationship TTP = M(σ,ρ)/µ + Trad, where M(σ,ρ) is a proportionality constant. TTP displacements at thefocal point ranged from 0.8–3.9ms (µ = 8.0–0.3kPa, Trad = 50µs, σ = 1.0cm), demonstrating that for morecompliant media, the TTP responses were dominated by the mass of the excited material (M(σ,ρ)). Themeasured –6dB spatial shear wavelengths (λ T ) were directly related to the input -6dB excitationbeamwidth (σ) by the relation λ T = K σ, K = 1.0 ± 0.01; K was independent of µ and Trad.While the mean SWS estimates in different stiffness media were not significantly affected by λ T (p > 0.05),their standard deviations significantly decreased from ± 0.50kPa to ± 0.01kPa (i.e., improvement of 98%,p < 0.05) in a µ = 1kPa medium as σ increased from 0.25-1.0cm. These differences were statisticallyinsignificant (0.50–0.45kPa, p > 0.05) in the stiffer media (µ > 8kPa).Conclusions: Spatial shear wavelengths are independent of the excitation duration, but are directlymodulated by the 3D spatial extent of the excitation beam. Larger shear wavelengths provide greaterperiods to estimate TTP metrics in fixed PRF imaging configurations, reducing the variability of the shearwave speed estimates, particularly in softer media. Smaller shear wavelengths, however, areadvantageous in the context of using smaller reconstruction kernels to generate shear stiffness imageswith high spatial resolution. This study held the peak excitation amplitude constant; the effects ofchanging the resultant displacement magnitudes in response to varying the aperture sizes of lineararrays that would occur when experimentally modulating excitation beamwidths are being explored.Acknowledgements: This work was supported by NIH grants R01 EB002132 and R01 CA124824. We thank SiemensHealthcare, Ultrasound Business Unit, Mountain View, CA for their system support.References:[1] Palmeri ML, Wang MH, Dahl JJ, Frinkley KD, Nightingale KR: Quantifying Hepatic Shear Modulus In Vivo usingAcoustic Radiation Force. Ultrasound Med. Biol., 34(4), pp. 546–558, 2008.[2] McLaughlin J and Renzi D: Using Level Set Based Inversion of Arrival Times to Recover Shear Wave Speed inTransient Elastography and Supersonic Imaging. Inverse Problems, 22, pp. 707–725, 2006.[3] Jensen JA and Svendsen NB: Calculation of Pressure Fields from Arbitrarily Shaped, Apodized, and ExcitedUltrasound Transducers. IEEE Trans. Ultrason., Ferroelec., Freq. Contr., 39, pp. 262–267, 1992.indicates Presenter83
040 INTERNAL INDENTATION FOR DIRECT MODULUS ESTIMATIONJ Vappou 1 , E Konofagou 1 .1 Ultrasound and Elasticity Imaging Laboratory, Columbia University, New York, NY, USA.Background: Harmonic Motion Imaging (HMI) is a Focused–Ultrasound (FUS)–based method thatconsists of applying a low–frequency oscillatory force (typically 10–500Hz) using a FUS transducer andsimultaneously estimating the resulting displacements using an ultrasound imaging transducer [1]. Athigh acoustic intensity, HMI can be used for tumor ablation and monitoring of the displacements duringthe ablation process [2]. At low acoustic intensity, HMI can be used as an elasticity imaging methodwhere a sinusoidal force is applied and the resulting displacements are measured. A low–intensity HMI–based method has been previously proposed to estimate quantitatively viscoelastic properties of softtissues [3]. However, it is based on shear wave propagation and suffers from significant limitationscommonly encountered in shear wave–based methods, in particular, strong attenuation due to diffractionand inaccuracy in highly non–uniform media. In this study, we propose to use a novel approach wherethe highly localized nature of the applied force and the knowledge of the magnitude of this force are usedto regionally estimate the elasticity of the tested medium. Such a protocol has strong similarities withmechanical indentation, one significant difference being that HMI allows for internal, noninvasive testing.Aims: There are two aims in this study: 1) to develop a HMI–based method that allows quantitativemeasurement of local elasticity based on the principle of indentation and 2) to evaluate the accuracy ofthe method in a finite–element and phantom framework.Methods: An HMI–based experimental protocol was used, combining a FUS transducer (4.5MHz) thatgenerates an oscillatory force at the focus and an imaging transducer (phased array, 3.3MHz) with highlateral resolution and high frame rate (≈ 200–400Hz) obtained by reducing the sector size to a limited ROIaround the focal region. The axial displacement is estimated by cross–correlation within the whole image,during the application of the force. Spatial derivatives of the displacement are calculated offline. An HMImodulus (E HMI ) was defined based on the knowledge of both magnitude and distribution of the appliedforce and on the measured strains.Finite–Element Study: The problem was first simulated using the finite element (FE) method in order toevaluate its accuracy. For this purpose, 8 numerical phantoms were generated, the Young’s modulusvarying from 1kPa to 100kPa. The actual force measured experimentally was implemented within the FEmodel and E HMI was compared to the input Young’s modulus E.Phantom Study: E HMI measurements were performed on 6 polyacrylamide phantoms (concentrationsfrom 15–40%, f=10Hz) that were also tested by rheometry for validation purposes (dynamic shear tests,f= 1-10Hz, ε = 0.5%).Results: Excellent correlation was found between E HMI and the actual Young’s modulus E in the finiteelement study (r 2 = 0.995). The robustness of the proposed method was also demonstrated by showingthat boundary conditions, geometry, heterogeneity have a negligible effect on the measured E HMI . Thisnumerical study also shows that the proposed method has a resolution of about the lateral size of thefocus (approx. 1mm). Very good correlation (r 2 = 0.925) and reproducibility were found in thepolyacrylamide phantom study.Conclusions: The method proposed here has similarities with indentation techniques that areconventionally used for mechanical testing. Here, the indentation is internal thanks to the use of focusedultrasound, allowing us to perform in vivo, noninvasive internal measurements that are not feasible withmechanical indentation. The quantitative nature of the proposed method has been demonstrated in thisstudy through the measurement of E HMI in both simulations and experiments.Acknowledgements: The study was funded in part by NIH R21EB008521 and NIH R01 HL098830.References:[1] Maleke et al.: Ultrason. Imaging, Vol. 28, No. 3, pp. 144–158, 2006.[2] Maleke et al.: IEEE Trans. Biomed. Eng., Vol. 57, pp. 7–11, Jan. <strong>2010</strong>.[3] Vappou et al.: Phys. Med. Biol., Vol. 54, pp. 3579–3595, Mar. 2009.84indicates Presenter
050 SHEAR STRAIN ELASTOGRAPHY USING OPTICAL COHERENCE TOMOGRAPHY (OCT) AS AMEANS OF GENERATING CONTRAST.A Grimwood 1 , L Garcia 2 , JC Bamber 2 , J Holmes 3 , P Woolliams 4 , P Tomlins 4 , Q Pankhurst 1 .1 Royal Institution of Great Britain, London, England, UK; 2 Institute of Cancer Research, Sutton,Surrey, England, UK; 3 Michelson Diagnostics Ltd., Orpington, Kent, England, UK; 4 NationalPhysical Laboratory, Teddington, Middx, England, UK.Introduction: A technique using optical coherence tomography (OCT) to image total shear strain within asample is employed, generating useful contrast between regions of different Young’s Modulus.Experimental results and finite element simulations are presented for a phantom model of a surfacelesion comprising a silicone rubber test object with a well-bonded inclusion ~10 times stiffer than itssurroundings. Close agreement between simulated and experimental data is demonstrated.Background: Total shear strain elastograms have been produced for micron–scale displacements imagedusing OCT. The elastograms generate useful contrast between a stiff surface inclusion and surroundingtissue in phantom models. The phantom was actuated using a controlled, repeatable method comprisinga magnetizable implant and an external magnet. Elastograms obtained under repeatable conditions suchas these could potentially limit inter–observer variation in diagnoses from histopathology. They may alsoprove useful where evaluation of cancer relies on qualitative measures such as the ABCD rule(asymmetry, border, colour, diameter).Aims: Demonstration of a technique for imaging total shear strain in OCT is described. Useful contrast isderived from the shear strain elastograms. The experimental results are supported by finite elementsimulations. Finally, potential refinements and applications of the technique are discussed.Methods: A silicone rubber tissue phantom containing an embedded 0.79 mm magnetizable implant wasimaged under OCT. Using normalized cross–correlation, a displacement map was formed from B–scanstaken prior to and during actuation of the implant. The strain field generated by this localized, non–uniform stress was estimated from displacement data using a least–squares strain estimator. Total shearstrain elastograms were thus produced depicting an inclusion in the phantom ~10 times stiffer than itssurroundings (268.5 ± 31kPa and 36.7 ± 7kPa, respectively).Results: Total shear strain elastograms are shown in Figure 1. These depict the magnitude of total shearstrain in two phantoms: one with a stiff surface inclusion, the other without. The pictures inset arecomparable elastograms obtained from finite element simulations.(a)Figure 1: Elastograms depicting magnitude of shearstrain in experimental phantoms with:(a) no inclusion and (b) a stiff inclusion(upper centre). Insert images show (b)corresponding finite element elastograms.Color scale is absolute strain.Conclusions: Useful contrast is generated by the attenuation of shear strain through the stiff inclusion.Horizontal banding artifacts are visible; however, these could conceivably be mitigated in the futurethrough changes to image processing. Additionally, the method of actuation could be replaced by a lessinvasive technique in the future, such as surface indentation, to facilitate in–vivo sampling. OCT is a real–time imaging modality with a resolution of >10µm and a depth penetration in tissue of ~2mm, making itpotentially well–suited to elastographic measurements of small skin–surface lesions.Acknowledgements: Research funded by an EPSRC CASE Studentship with financial contribution from industrialsponsors Michelson Diagnostics Ltd. Support from NPL Biophotonics Dept. and ICR Elastogrpahy Team gratefullyacknowledged.indicates Presenter85
055 NUMERICAL EVALUATION OF CORRELATION BASED 3D SPECKLE TRACKING FORCARDIAC ULTRASOUND ELASTICITY IMAGING.S. Tripathy 1,2 , M. A. Simon 2 , K. Kim 1,2,3 .1 The Center for Ultrasound Molecular Imaging and Therapeutics, 2 Cardiovascular Institute,3 Bioengineering Department, University of Pittsburgh, Pittsburgh, PA, USA.Background: Noninvasive functional assessment of myocardium is critical for the diagnosis andprognosis of various cardiac and cardiovascular diseases such as myocardial infarction. Ultrasoundelasticity imaging (UEI) based on speckle tracking (ST) has been shown to be an effective tool forfunctional assessment of the myocardium with limitations [1,2]. The local elastic property changes of theinfarct area are reflected on the strain map. Due to complex geometry and contraction of a heart, 3D STis needed. Recently, correlation–based 3D ST was developed to reduce the large de–correlation due to out–of–plane motion of the tissue [3]. In this study, a two chamber finite element (FE) model is developed toevaluate and establish the efficacy of 3D UEI to identify the infarct area.Aims: (1) Develop a numerical myocardial infarct 3D UEI model based on FE simulations. (2) Identify theinfarct region from the strain map more accurately than 2D UEI.Methods: A two chamber cardiac FE model was developed. A cavity pressure driven quasi–staticdeformation problem was set up. The tissue was considered linearly elastic (Young’s modulus,E = 150kPa) and incompressible (Poisson’s ratio, μ = 0.495). Four–noded tetrahedral hybrid elementswith linear interpolation were used. A small spherical hard inclusion, E = 2MPa, was used to model theinfarct area as shown in Figure 1a. The full heart cycle was divided into 15 linear time–steps. A2D phased array centered at 2MHz with a band–width of 50% at 6dB was simulated to generate 3D USradio frequency (RF) data. Both 2D and 3D ST were performed on the US RF data.Results: Figure 1 plots the radial, circumferential and elevational displacements from FE simulation aswell as 2D and 3D ST estimates for a single elevational slice. A clear improvement (compared to the FEresults) is observed for the 3D ST maps. Figure 1 also compares all 6 components of the strain tensor forthe FE and the 3D ST estimates. Since the 2D UEI assumes in–plane strain, there are only 3 straincomponents. The infarct region as marked in the B–mode image (Figure 1a) can be clearly and moreaccurately identified using the 3D ST strain maps compared to 2D ST.Conclusions: Strong decorrelation in 2D ST due to out–of–plane motion in cardiac application can beaddressed by 3D ST. Since 3D ST considers the elevational plane motion as well, more accuratedisplacement and strain estimates are also obtained as observed in this numerical study. It was shownthat the 3D UEI is able to identify the infarct region more closely than 2D ST. From quantitative analysisof the results, the improvement was about 60–80% for some areas with large out–of–plane motions.Figure 1: Speckle tracking results for a two chamber model with a hard infarctregion. (a) B–mode image of a representative slice; (b) Comparison of2D and 3D displacements; (c) compares the derived strains.(c)(b)(a)Acknowledgements: The project was partly funded by Grant Number KL2 RR024154 from the National Center forResearch Resources (NCRR), a component of the National Institutes of Health (NIH) and NIH Roadmap for MedicalResearch, and its contents are solely the responsibility of the authors and do not necessarily represent the officialview of NCRR or NIH.References:[1] J. Ophir, et al.: Ultrasound Imaging, 13, pp. 111–134, 1991.[2] A. R. Skovoroda, et al.: IEEE UFFC, 41(3), pp. 302–313, 1994.[3] X. Chen, et al.: Ultrasonic Imaging, 27(1), pp. 21–36, 2005.86indicates Presenter
015 TRANSTHORACIC ACOUSTIC RADIATION FORCE IMPULSE IMAGING OF CARDIAC FUNCTION.David P. Bradway 1 , Stephen J. Hsu 2 , Patrick D. Wolf 1 , Gregg E. Trahey 1 .1 Duke University, Room 136 Hudson Hall, Box 90281, Durham, NC, 27708, USA; 2 SiemensHealthcare, Ultrasound Business Unit, 2<strong>2010</strong> SE 51st Street Issaquah, WA, 98029, USA.Background: The Acoustic Radiation Force Impulse (ARFI) imaging method was previously showncapable of visualizing myocardial stiffness in real–time [1]. Cyclic variation in ARFI–induceddisplacements reflected the changing mechanical properties of the heart through the heartbeat, matchingthe timing and behavior of cardiac strain rate and ECG [2].Aims: Apply transthoracic cardiac ARFI imaging methods in studies of left ventricular function in humansubjects and animal models. Evaluate available ultrasound probes for transthoracic cardiac use.Methods: Transthoracic ARFI imaging was used to examine function of the left ventricular free wall inhuman subjects and animal models at Duke University and Synecor, LLC. A Siemens ACUSON Antares TMultrasound scanner (Siemens Healthcare, Ultrasound Business Unit) that was modified for research wasused in these studies. For all studies, matched global ECG was acquired, and for the canine study shownin Figure 1, LV pressure and volume measurements were also acquired using a Millar catheter (MillarInstruments, INC). A Siemens VF10–5 transducer was used for the results shown here and for otherinitial feasibility studies. Other probes were tested under various imaging configurations.Results: Images of a canine LV free wall are shown in Figure 1. The traditional M–mode (Figure 1a)displays contraction and relaxation of the myocardial wall through the cardiac cycle. The LV wallthickening and relaxation are coincident with the QRS complex and T wave in the global ECG (Figure 1d).Figure 1b displays an M–mode ARFI image at the same time and location. A mask has been used to blankthe left ventricle and regions of tissue that were poorly tracked. Simultaneous pressure and volumemeasurements from a Millar catheter placed in the LV are shown in Figure 1e and f. ARFI–induceddisplacements (Figure 1c) fall with the onset of ventricular systole (Figure 1d), the corresponding rise inventricular pressure (Figure 1e), and drop in volume (Figure 1f). Displacements (Figure 1c) rise at theT wave (Figure 1d) through passive filling (Figure 1f) as the ventricular pressure drops (Figure 1e).Conclusions: Transthoracic cardiac ARFI imaging has been shown suitable for non–invasive evaluation ofLV function.Acknowledgements: This work has been supported by NSF Graduate Research Fellowship and NIH grant#5R37HL096023. We thank Siemens Healthcare Ultrasound Business Unit for technical and in-kind support.(a) (b) (c)(d) (e) (f)Figure 1: (a) Traditional M–mode image of LV free wall, (b) M–mode ARFI image, (c) average ARFI–induceddisplacement in ROI, (d) global ECG, (e) LV pressure, and (f) volume through a single cardiac cycle.The axial ROI is marked with white lines on (a) and (b). The ARFI–induced displacement (b) imageand (c) plot reflect cyclic activity in the LV free wall.References:[1] DP Bradway, SJ Hsu, BJ Fahey, JJ Dahl, T Nichols, GE Trahey: Transthoracic Cardiac ARFI: A Feasibility Study.Proc IEEE Ultrason Symp, pp. 448–451, 2007.[2] SJ Hsu, RR Bouchard, DM Dumont, CW Ong, PD Wolf, GE Trahey: Novel Acoustic Radiation Force ImpulseImaging Methods for Visualization of Rapidly Moving Tissue. Ultrason Imaging, 31(3), pp. 183–200, July, 2009.indicates Presenter87
064 EX VIVO FEASIBILITY OF HARMONIC MOTION IMAGING OF HUMAN BREAST TUMORS.Elisa E. Konofagou 1,2 , Caroline Maleke 1 .1 Ultrasound and Elasticity Imaging Laboratory, Biomedical Engineering Department, ColumbiaUniversity, New York, NY, USA; 2 Radiology Department, Columbia University, New York, NY, USA.Background: In this presentation, a feasibility study of Harmonic Motion Imaging (HMI) [1–3] for humantumor detection, localization and characterization ex vivo is presented. HMI is a technique that uses anamplitude–modulated (AM) focused beam to induce a localized vibration at the focus and thus map theunderlying mechanical properties of the vibrated tissue [4].Aims: The capability of HMI to differentiate between benign, malignant and normal breast tissues isexamined.Methods: Seventeen (n=17) post–surgical human breast specimens (5 benign (fibroadenomas), 9 malignant(4 invasive ductal carcinomas, 3 ductal carcinomas in situ and 2 invasive lobular carcinomas) and3 normal) were collected approximately 30 minutes after excision and prior to histopathology. Specimenswere imaged using sonography or mammography prior to HMI. The HMI system was used to generate anoscillatory radiation force using an AM (10–30Hz) force transducer (4.5MHz; Imasonic) and a pulse–echotransducer (7.5MHz; Panametrics) that acquired radiofrequency (RF) frames during application of theradiation force. For 2D HMI, the transducer assembly was moved in a 2D raster–scanning fashion at a stepsize equal to 1mm in the lateral and elevational directions using a computer–controlled positioner (VelmexInc., Bloomfield, NY, USA). The scan planes were adapted based on the specimen’s size. The acousticintensity (I sppa ) was equal to 31.4W/cm 2 with a duration of 0.2s at each point. In order to determine theoptimal AM frequency, a linear chirp test within the range of 10–30Hz was applied to investigate the optimalvibration frequency for the highest mechanical contrast between the tumor and the surrounding regions. A1D cross–correlation technique was applied on the acquired RF signals to estimate the resultingdisplacement.Results: HMI was capable of accurately detecting, mapping and localizing tumors of varying size (4x2to14x22mm 2 ) with excellent agreement with sonography and mammography findings. An unpairedStudent t–test with a 90% confidence interval was performed to determine whether different breastpathologies could be differentiated based on the HMI images. Normal breast tissues could bedifferentiated from both benign and malignant tumors at high statistical significance (p < 0.005). Thebenign tumors experienced a lower average displacement compared to the malignant masses but at lowerstatistical significance (p = 0.008). Thus, the HMI images could categorize different tumor types based ontheir relative stiffness. However, HMI could not differentiate between different malignant types (p>0.1).Conclusions: The results presented here show that HMI could detect, map, localize and characterizebreast tumors ex vivo. Normal, benign and malignant tumors could be accurately mapped anddifferentiated with HMI displacements lower in the benign relative to malignant tumors. HMI may thusserve as a reliable technique for noninvasive localization and characterization of breast tumors.Acknowledgements: This work was supported in part by the National Institutes of Health (1R21EB008521).References:[1] Maleke C., Pernot, M. and Konofagou E.E.: A Single–Element Focused Transducer Method for Harmonic MotionImaging. Ultrason. Imaging, Vol. 28, No. 3, pp. 144–158, 2006.[2] Maleke C. and Konofagou E.E.: Harmonic Motion Imaging for Focused Ultrasound (HMIFU): A Fully IntegratedTechnique for Sonication and Monitoring of Thermal Ablation in Tissues. Phys. Med. Biol., Vol. 53, No. 6,pp. 1773–1793, 2008.[3] Maleke C and Konofagou EE: In Vivo Feasibility of Real–Time Monitoring of Focused Ultrasound Surgery (FUS)using Harmonic Motion Imaging (HMI). IEEE Trans. Biomed. Eng., Vol. 57, pp. 7–11, <strong>2010</strong>.[4] Vappou J., Maleke, C. and Konofagou, E.E.: Quantitative Viscoelastic Parameters Measured by Harmonic MotionImaging. Phys. Med. Biol., 54(11), pp. 3579–94, 2009.88indicates Presenter
Session BTM: Biomechanical Tissue ModelingMonday, October 18 1:30P – 2:45P001 PARAMETRIC ANALYSIS OF AXIAL SHEAR STRAIN IMAGING ON ELLIPSOIDAL MASSES.Haiyan Xu 1,2 , Tomy Varghese 1,2 .1 Medical Physics Department, 2 Electrical and Computer Engineering Department, University ofWisconsin–Madison, Madison, WI 53705, USA.Background: Axial shear strain patterns and parametric analysis around circular inclusion/backgroundinterfaces was previously reported by Thittaikumar et al. [1]. Several investigators have alsodemonstrated the potential to utilize normalized axial shear strain area features for distinguishing benignfrom malignant breast tumors under in–vivo imaging conditions [2,3].Aims: Parametric evaluation of shear strain features generated using finite element analysis (FEA)software to examine feasibility of utilizing different axial shear strain features for differentiating benignfrom malignant tumors is evaluated for different mass shapes and asymmetric mass locations. Theimpact of parameters such as stiffness variations, tumor dimensions and shape, applied deformation andasymmetric location of masses is studied [1].Methods: Two–dimensional finite element simulations of both spherical [1] and ellipsoidal massesembedded within a uniform background were utilized for axial shear strain analysis. Different degrees ofbonding at the mass/background interface were characterized using friction coefficient values ranging from0.01 to 100 denoting loosely bonded to firmly bonded masses [1]. Axial shear strain images were estimatedfrom the gradient of the displacement with quasi–static deformation varied from 1% up to 10% of the modeldimensions. Other mechanical modeling aspects, such as stiffness ratios between the inclusion andbackground, mass dimensions and shape and positioning of the masses within the background were alsocontrolled to identify the contribution of each parameter to the shear strain patterns and correspondingimpact on breast lesion differentiation. Axial shear strain areas were normalized to the mass dimensions,percentage of applied deformation and the strain contrast to determine features that can be utilized todiscriminate between benign and malignant masses [1]. The normalized threshold percentage was alsovaried in order to determine optimal values for breast mass differentiation.Results: Our results indicate that the normalized axial shear strain area feature is significantly larger, whilethe normalized mean shear strain value is smaller for firmly bonded masses when compared to looselybonded ones [1-3]. Higher stiffness ratios (>1) between the inclusion and background improve thediscrimination. The differentiation performances are identical for different symmetric mass shapes as well asfor small applied deformations. However, larger applied deformations (>3%) reduce the discriminationperformance at lower values of the friction coefficients. Variations in the normalized shear strain areas andmean values were also observed for asymmetric positioning of ellipsoidal masses at lower friction coefficients.Conclusions: Finite element results demonstrate the feasibility of utilizing both the area and mean ofnormalized axial shear strain feature to differentiate benign from malignant masses based on theirbonding to background tissue. Potential sources of errors with the use of these features occur for looselybonded inclusions at larger applied deformations or for asymmetric masses (Figure 1).Figure 1: Plot showing the impact of varying the locationof asymmetry on the Normalized axial–shearstrain area between the loosely bonded ( ) andfirmly bonded ( ) ellipsoidal inclusions.Acknowledgements: This work is supported by Komen GrantBCTR0601153 and NIH–NCI grants 5R21CA140939–02 andR01CA112192–S103.1.40 20 40 60 80References:[1] Thitai Kumar, A., Krouskop, T.A. Garra, B.S. and Ophir, J.: Visualization of Bonding at an Inclusion Boundaryusing Axial Shear Strain Elastography: A Feasibility Study. Phys Med Biol, 52(9), p. 2615–2633, 2007.[2] Thitai Kumar, A., Mobbs, L., Kraemer–Chant, C., Garra, B., and Ophir, J.: Breast Tumor Classification using AxialShear Strain Elastography: A Feasibility Study. Phys Med Biol; 53(17), pp. 4809–4823, 2008.[3] Xu, H, Rao, M, Varghese, T, Sommer, A, Baker S, Hall TJ, Sisney G.A. Burnside, B.: Ultrasound Med Biol, (in press), <strong>2010</strong>.2.82.62.42.221.81.6Firmly Bonded BoundLoosely Bonded Boundindicates Presenter89
011 THE FINITE DIFFERENCE MODEL OF SHEAR WAVE PROPAGATION IN VISCOELASTICTISSUE.Gang Cheng 1 , Xiaodong Han 1 , Wei Tan 1 , Christopher R. Hazard 21 GE Global Research, Shanghai, Pudong District, CHINA; 2 GE Global Research, Niskayuna, NY, USA.Background: Shear modulus and viscosity are two parameters related to tissue health. In the past twodecades, researchers have used several different methods to measure the viscoelastic properties of tissue. Oneof the major approaches is quantitative shear wave elastography. This method estimates the shear modulusby pushing the tissue in order to generate a propagating shear wave and then detects the resultingdisplacements of the tissue as that shear wave travels. Several modalities (MRI [1], CT [2] or ultrasound [3])have been used to measure tissue deformation and to validate mechanical models of viscoelastic tissue.Aims: This research aims to set up a model based method to estimate tissue viscoelasticity based onshear wave propagation. A finite difference model (FDM) has been developed to simulate shear wavepropagation in a viscoelastic tissue after being pushed by an acoustic radiation force. The FDM modelcan be used by an inverse solver to estimate tissue viscoelasticity through iterative searching.Methods: An FDM of shear wave propagation in isotropic viscoelastic tissue was used to simulate theshear wave induced displacements in materials with varied viscoelastic parameters. The followingequations characterize the model of the shear wave propagation that we used:x 1 0 x 1 10 x E ij z 1 0 z 11 0 z , 2i 2 Pi,11xxz 00 xz 0 0 2 xzjj 2 Where, σ is stress vector, ε is strain vector, E is Young’s modulus, η is viscosity, ν is Poisson’s ratio, αi is theexternal acceleration, ρ is the material density and Pi is the acoustic radiation body force. In real worldapplication, there is also considerable background motion or drifting caused by the vibrations in theenvironment. We assume that the frequency of the drifting vibration is lower than the frequency of theshear wave displacement. A linear function can then be used to approximately fit the background drift [4].The FDM model has been implemented in Matlab. The model simulates the shear wave shape over time fora given acoustic pushing pulse. To validate the model, a modified GE LOGIQ9 ultrasound system generatesacoustic radiation force and detects the shear wave on customized phantoms. The output of the model iscompared with experimental data to evaluate the performance of the model.Results: Figure 1 shows that there is reasonable agreement between the shear wave simulation and themeasurement results at the two locations. The Young’s modulus used in the FDM was 19kPa and theviscosity was 3.8Pa s. The background drift was also incorporated into the model to allow for bettermatching of the results.3.533.53Liver dataOptimization result with background filter4 x 10-6 Time sequence at A point (prf)4 x 10⁻⁶ Time sequence at B point (prf)Displacement (m)2.521.512.521.51Figure 1: The result after iterativeoptimization0.50-0.50 5 10 15 200.50-0.50 5 10 15 20Conclusions: The FDM with incorporated background drifting can accurately represent the tissuedisplacements caused by the shear wave propagation after a radiation force push. Using this model,researchers can optimize the parameters of radiation force based systems and analyze the associated errors.References:[1] A. Manduca, T. E. Oliphant, M. A. Dresner, et al.: Medical Image Analysis, (4), pp. 237–254, 2001.[2] Shi Hongjian, Farag, AA.m Fabmi, Rachid, Chen Dongqing: IEEE Transactions on Biomedical Engineering, (3),pp. 978–984, 2008.[3] M.L. Palmeri, M.H. Wang, J.J. Dahl, K.D. Frinkley, K.R. Nightingale: Ultrasound in Medicine and Biology, (4),pp. 546–558, 2008.[4] K. Nightingale, D. Stutz, R Bentley, G Trahey: IEEE Ultrasonics Symposium Proc., pp. 525–528, 2002.90indicates Presenter
012 FINITE ELEMENT SIMULATION OF SHEAR WAVE PROPAGATION INDUCED BY A VCTEPROBE.Stéphane Audière 1,2 , Maurice Charbit 1 , Elsa Angelini 1 , Veronique Miette 2 , Jennifer Oudry 2 ,Laurent Sandrin 2 .1 Institut Telecom, Telecom ParisTech, CNRS LTCI, 46 rue Barrault, 75013, Paris, FRANCE;2 Echosens, Research and Development Department, 153 avenue d’Italie, 75013, Paris, FRANCE.Background: The Fibroscan® (Echosens, Paris, France) device based on vibration–controlled transientelastography (VCTE) is used to non–invasively assess liver stiffness correlated to the hepatic fibrosis.Stiffness is quantified by measuring the velocity of a low–frequency shear wave traveling through theliver, which is proportional to the Young’s modulus E. It has been demonstrated that E is highlycorrelated with liver fibrosis stage as assessed by liver biopsy.Aims: To study the emergence of two shear waves with different velocity detected with the Fibroscan® onin vivo liver cases; simulations with finite element models (FEM) on a 3D anatomical model of liver andribs can help understand this propagation pattern. Indeed, the shape and direction of the shear wavefront induced by the Fibroscan® probe in the liver are not entirely known.Methods: Liver elasticity measured by Fibroscan® ranges between 2–75kPa and corresponds to a shearwave velocity range of 0.8–5m/s. The shear wave is mechanically induced by the displacement of a pistoncontrolled with a single period 50Hz sinusoid pulse. We have considered a FEM approach to solve thegeneralized Maxwell viscoelastic model for propagation in the liver and an isotropic model with damping(loss factor or Rayleigh model) for propagation in a phantom. The first simulation step consisted ofvalidating the model parameterization for 2D simulations. We verified that the Young’s modulus injected inthe model generated the proper shear wave velocity [1]. An algorithm was then developed to derive Young’smodulus values from simulated strain rate images. The second step consisted of simulating an experimentsetup feasible with the Fibroscan® to compare results extracted from simulated and real strain–rateimages. A cylindrical copolymer–in–oil phantom was used to mimic liver tissues. The axisymmetricgeometry enabled the use of a 2D model. The last step consisted of simulating the shear wave generationand propagation induced by a piston hitting a 3D model: phantom or liver model, created from the surfacemesh models distributed by the IRCAD (Strasbourg, France). Simulation results presented in this work usethe COMSOL Multiphysics software tool to solve the partial differential equations associated with thetransient analysis with a FEM method. COMSOL Multiphysics running on desktop computational resourcesprovides sufficiently accurate results for wave propagation problems.Results: For the first step, simulation of shear wave propagation is validated with Young’s modulusmeasurement differences in agreement with the Fibroscan®’s accuracy. The viscoelastic model simulationreports a viscosity index that has little influence on the wave propagation, along depth and time. For thesecond step, preliminary results suggest that Rayleigh model is suitable to approach experimental results.For the last step, preliminary results are encouraging. Observations showed that the shear wave front isfirst spherical and then progressively deforms during propagation, according to the geometry of the liver.Conclusions: This study reveals encouraging results regarding the feasibility to use FEM simulations tounderstand the behavior of different tissue types and <strong>org</strong>ans for Fibroscan® scanning. 3D simulationsdesign will be improved using a complete thoracic and abdominal anatomy, to study potential sources ofaberrant propagation patterns and velocity measures.References:[1] Laurent Sandrin, et al.: The Role of the Coupling Term in Transient Elastography. J. Acoust. Soc. Am., 115, 73, 2004.Figure 1:Amplitude of the deformation at11mm depth: comparison betweensimulated data by FEM, the Green'sfunctions and experience.indicates Presenter91
080 EFFECT OF BOUNDARY CONDITIONS ON THE PERFORMANCE OF POROELASTOGRAPHYTECHNIQUES IN COMPLEX SIMULATED MEDIA.Anuj Chaudhry 1 , Ginu Unnikrishnan 2 , JN Reddy 2 , Raffaella Righetti 1 .1 Electrical and Computer Engineering 2 Mechanical Engineering Departments, Texas A&MUniversity, College Station, TX, USA.Background: Many biological tissues behave as spatially and temporally complex composite materialsdue to their high fluid content. Pathological conditions and related therapies may significantly alter fluidtransport mechanisms in tissues. Poroelastography is a modality for imaging the temporal behavior oftissues that can be modeled as poroelastic media, under sustained loading [1]. While several types ofporoelastographic images may be used to depict the temporal behavior of a tissue, internal and externalboundary conditions may affect the resulting temporal strain distributions and have importantimplications on the quality of the resulting poroelastographic images.Aims: In this study, we assess the performance of poroelastography techniques for imaging the behaviorof non–homogeneous poroelastic media under two different loading conditions: stress relaxation (materialis subjected to a constant strain) and creep (material is subjected to a constant stress).Methods: A simulation study was carried out using in–house FE poroelastic simulation software [2]combined with ultrasound simulation routines. Two types of complex media were simulated: a cubical2–layer medium and a cubical medium containing a cylindrical inclusion. Different permeability(1.9510 -14 ÷1.9510 -6 m 4 /Ns), Young’s modulus (1.74÷1.7410kPa) and Poisson’s ratio contrasts(0.05÷0.45) between the underlying matrixes of the background and the target were considered. Theperformance of poroelastography techniques (both axial strain and effective Poisson’s ratio) wasquantified in terms of contrast–to–noise ratio (CNR), contrast transfer efficiency and sensitivity.Results: The results of this study show that, in general, image quality of both axial strain and effectivePoisson’s ratio poroelastograms is a complex function of time, which depends on the geometry of themedium and the contrast between the material properties of the background and the material properties ofthe target. According to our results, the boundary conditions affect the performance of poroelastographicimages both of axial strain and effective Poisson’s ratio poroelastograms. Figure 1a shows elastographicCNR as a function of time for a simulated medium containing a cylindrical inclusion having differentpermeability properties with respect to the background (but the same elastic modulus and Poisson’s ratio)subjected to two different loading conditions. Figure 1b shows a set of temporal axial strain elastogramscorresponding to the stress relaxation (top) and the creep (bottom) cases shown in Figure 1a.Conclusions: The results of this study suggest that internal and external boundary conditions may havea significant impact on the performance of poroelastography techniques. Experiments are currentlyundergoing to corroborate these simulation findings.Acknowledgements: This work is supported by Texas Engineering Experiment Station and Texas A&M University,College Station, TX.References:[1] Righetti R, Ophir J, Krouskop TA.: A Method for Generating Permeability Elastograms and Poisson’s RatioTime–Constant Elastograms. Ultras. Med. Biol., vol. 31(6), pp. 803–816, 2005.[2] Unnikrishnan, GU, Unnikrishnan, VU, Reddy, JN: Tissue–Fluid Interface Analysis Using Biphasic Finite ElementMethod. Comp. Meth. Biomech. Biomed. Eng., Vol. 12(2), pp. 165–172, 2009.Figure 1: (a) (b)92indicates Presenter
093 FEM SIMULATION OF HARMONIC TISSUE EXCITATION FOR PROSTATE ELASTOGRAPHY.O Goksel 1 , S E Salcudean 1 .1 University of British Columbia, Vancouver, BC, CANADA.Background: Prostate elastography can provide valuable information for diagnosis and treatmentplanning of prostate cancer. Both transrectal excitation [1] and abdominal excitation [2] have been usedto generate mechanical waves in the prostate. Recently, transperineal excitation during magneticresonance elastography [3] has also been used. Optimizing the location and frequency of mechanicalexcitation for prostate elastography will help improve imaging quality and patient comfort.Aims: To compare the effectiveness of producing waves in the prostate using transperineal andtransrectal excitation.Methods: An anatomical model of the prostate region was obtained by meshing the contours, segmentedfrom MR images, using Computer Graphics Algorithms (CGAL) software. This model includes the pubicbone, the prostate and part of the bladder. Harmonic excitations were modeled by vibrating a mesh nodeon the skin for transperineal excitation and vibrating the mesh nodes within the model of a transrectalultrasound probe for transrectal excitation (Figure 1). The finite element method (FEM) was used withlinear–elasticity and linear–geometry assumptions. Dynamic steady–state solutions within the region ofinterest were obtained using Ansys©. The tissue mechanical properties for the prostate and thesurrounding tissue were set according to [2], with the Poisson’s ratio set to 0.499. Tissue viscosity wasmodeled using Rayleigh damping model with a structural damping coefficient of 10 -4 . The surface of thepubic bone is used as a zero displacement boundary condition. Sinusoidal excitations were applied in0.5Hz increments from 5 to 100Hz, a typical range for dynamic elastography, at an amplitude of 1mm fortransperineal compression and 0.2mm for transrectal antero–posterior compression. Wave penetrationinto different sections of the prostate was studied by observing wave amplitudes at three mesh nodes,located at the apex, the mid–gland and the base of the prostate, as seen in Figure 2.Results: Wave propagation degrades with increased frequency of excitation as expected. Resonances observedat lower frequencies are the result of standing waves due to the higher wave penetration. Amplitudedistributions along transverse and sagittal prostate cross–sections (Figure 3) are shown at two typical excitationfrequencies for each method: 45Hz for MR elastography [3] and 5Hz for TRUS vibro–elastography (Figure 4).Conclusions: The present simulation framework for dynamic prostate elastography can be used to studyand later optimize elastography imaging. More sophisticated models with a larger anatomical extent andnon–linear elasticity formulation will increase the realism of the simulation, enabling a comparison andvalidation of these simulations. Our results simply estimate the wave distribution patterns for differentexcitations. In the future, inverse problem algorithms will be evaluated based on such simulations.(a)(b)(a) TransverseFigure 1: Our prostate region model.Figure 2:Oscillation amplitudes at theapex, mid–gland and base for (a)transperineal and (b) transrectalexcitation.(b) SagittalFigure 3:Two meshcross–sectionsas a referencefor Figure 4.References:[1] SE Salcudean, D French, S Bachmann, R Zahiri-Azar, X Wen, and WJ Morris: Viscoelasticity Modelling of theProstate Region Using Vibro–Elastography. MICCAI, pp. 389-396, 2006.[2] J Kemper, R Sinkus, J Lorenzen, C Nolte–Ernsting, A Stork, and G Adam: MR Elastography of the Prostate:Initial In–Vivo Application. Fortschr Röntgenstr, 176, pp. 1094–1099, 2004.[3] RS Sahebjavaher, R Sinkus, SE Salcudean: Transperineal Prostate MRE at 3T. Proc ITEC, p. 33, <strong>2010</strong>.(a)(b)[mm]Figure 4:Demonstrates amplitudes for (a)transperineal excitation, 45Hz,and (b) transrectal excitation, 5Hz.indicates Presenter93
Session FIP: Forward and Inverse ProblemsMonday, October 18 2:45P – 3:30P084 ALGORITHMS FOR QUANTIATIVE NONLINEAR ELASTICITY IMAGING IN THREEDIMENSIONS.S Goenezen 1 , J–F Dord 1 , PE Barbone 2 , AA Oberai 1 .1 Rensselaer Polytechnic Institute, Troy, NY, USA; 2 Boston University, Boston, MA, USA.Background: Linear elastic properties are useful in that they may be used to distinguish different tissuetypes. However, confining elasticity imaging to linear material properties limits its ability in classifying tissuetypes. For example, stress–strain curves from experimental compression tests in ex–vivo breast tissuesamples indicate that at small strains both benign and malignant tumors tend to have a higher elasticmodulus when compared with surrounding tissue [1]. However, with increasing strain (15%), benign breasttumors stiffen less than malignant breast tumors. This mechanical behavior can be captured with a nonlinearmaterial parameter within an appropriate constitutive model, and images of this parameter may be used toimprove breast cancer diagnosis. Recently we have developed an algorithm (assuming incompressible planestress hypothesis) that accomplishes this by imaging the linear and nonlinear elastic parameters of tissueusing quasi–static displacement data measured at two different levels of overall strain [2].Aims: In quantitative elasticity images, the absolute values of the elastic parameters are obtained (asopposed to values relative to a reference region). Quantitative images are useful as they allow thepossibility of monitoring the progression of a disease or a treatment plan and for inter–patientcomparisons. Our goal is to develop an algorithm for generating quantitative linear and nonlinearelasticity images in three dimensions for incompressible materials. We accomplish this by extending ouralgorithms to three dimensions and by incorporating force measurements.Methods: We solve the inverse problem of determining the linear and nonlinear elastic propertydistribution iteratively. We utilize a quasi–Newton method to minimize the difference between predictedand measured displacement fields as well as the difference between measured and predicted force. Theoverall computational cost of this algorithm is significantly reduced by employing the adjoint method anda novel material property continuation strategy. We model tissue as an incompressible isotropichyperelastic solid. We present a new strain energy density function that has an exponential stress–strainresponse. In order to handle the incompressibility constraint, we augment the finite element formulationwith a stabilizing term that prevents the appearance of the spurious pressure modes and theaccompanying displacement locking observed in standard finite element schemes [3].Results: We validate our inverse problem solution strategy with noisy, synthetic displacement data,obtained by solving forward problems for a given material parameter distribution. We assess the robustnessand the accuracy of the algorithm for different noise levels (white Gaussian). Figure 1 shows the shearmodulus reconstruction at zero strain (a) and the nonlinear parameter reconstruction at large strain (b)computed for synthetic data with 3% white Gaussian noise. The exact inclusion to background ratio forboth material parameters is 5:1. The shear modulus here is known only up to a multiplicative factor.Conclusions: We have developed a robust, accurate andefficient approach for solving the inverse nonlinear elasticityproblem in three dimensions. In order to generate quantitativeimages, we have included force data in our inversion strategy.The key ingredients of our approach are an adjoint basedgradient calculation, a material continuation strategy and astabilized finite element method that avoids the pitfallassociated with the incompressibility constraint.Figure 1: (a)Acknowledgements: We acknowledge the support of the NIH through grants R21CA133488 and R01CA140271.References:[1] O'Hagan, JJ and Samani, A: Measurements of the Hyperelastic Properties of 44 Pathological Ex Vivo BreastTissue Samples. Physics in Medicine and Biology, 54, pp. 2557–2569, 2009.[2] NH Gokhale, PE Barbone and AA Oberai: Solution of the Nonlinear Elasticity Imaging Inverse Problem: TheCompressible Case. Inverse Problems, 24 045010, 2008.[3] Klaas O, Maniatty A and Shephard MS: A Stabilized Mixed Finite Element Method for Finite Elasticity:Formulation for Linear Displacement and Pressure Interpolation. Computer Methods in Applied Mechanics andEngineering, 180 (1–2), pp. 65–79, 1999.(b)94indicates Presenter
085 A DIRECT ALGORITHM FOR TIME–HARMONIC ELASTICITY IMAGING WITH MULTIPLESOURCES.Yixiao Zhang 1 , Assad A. Oberai 1 , Paul E. Barbone 2 , Isaac Harari 3 .1 Rensselaer Polytechnic Institute, Troy, NY, USA; 2 Boston University, Boston, MA, USA; 3 Tel AvivUniversity, Ramat Aviv, ISRAEL.Background: In dynamic elasticity imaging, the response of tissue to a time–dependent excitation ismeasured and utilized to determine the spatial distribution of its viscoelastic parameters by solving aninverse problem. Several methods have been developed to solve this problem. These include the algebraicinversion method, where the solution is reduced to solving an algebraic problem, methods based on thetime of arrival of a front and those based on interpreting the wave equation as a partial differentialequation (PDE) for the shear modulus (see [1,2] for a review).Aims: Our long-term goal is to develop an accurate, robust and fast method for determining theviscoelastic properties of tissue. Here we consider the model problem of the time–harmonic wave equationand develop and test a method for determining the real and imaginary components of the shear modulus.In particular, this method accounts for multiple measurements and uses these to overcome practicalissues, such as noise and data limitations from experimental restrictions.Methods: As a starting point, we consider the Adjoint–Weighted equations (AWE) for the inverse heatconduction problem. A finite element implementation of these equations is stable and accurate [3].Further, it accounts for multiple measurements in a straightforward manner. For the time–harmonicwave equation, we develop the complex counterpart of this formulation. To improve the contrast of shearmodulus in normal and abnormal tissues in the presence of noise, we append to it the total variationdiminishing (TVD) regularization that penalizes jumps in the solution without penalizing their steepness.This is particularly useful in recovering localized regions of increased stiffness. We test the method usingsynthetic displacement fields produced by solving the forward problem. We also test the method onultrasound measured experimental data involving a tissue–mimicking phantom.Results: Applying the method to a single measured displacement field yields poor recovery. Small errorsin boundary conditions tend to be amplified and propagated into the domain. Using multiplemeasurements ameliorates this issue somewhat. Adding TVD regularization further improves thereconstructions by preserving the edges of inclusion. With this method, we can successfully detect theabnormal region of different shear modulus from the background.(a) (b) (c)Figure 1: Shear modulus reconstructions using (a) CAWE with single measurement (b) CAWE withmultiple measurements and (c) Regularized CAWE with multiple measurements.Conclusions: We have developed and implemented an accurate, robust and fast algorithm fordetermining the spatial distribution of the viscoelastic properties of tissue. This method relies on solvingthe time–harmonic wave equation for the complex shear modulus and utilizes a stable finite elementmethod to do so. It utilizes multiple measurements for better estimates of material properties. Theextension of this method for the time–harmonic viscoelastic equations is underway.Acknowledgements: This work has been supported by the NIH through the grant NIH RO1 AG029804. The authorsthank J. R. McLaughlin and A. M. Maniatty at Rensselaer Polytechnic Institute for helpful discussions and Kevin J.Parker’s team at the University of Rochester for tissue–mimicking phantom data.References:[1] Greenleaf, J.F., Fatemi, M. and Insana, M.: Selected Methods for Imaging Elastic Properties of Biological Tissues.Annual Review of Biomedical Engineering, 5 (1), pp. 57–78, 2003.[2] Barbone, P.E. and Oberai, A.A.: Review of the Mathematical and Computational Foundations of BiomechanicalImaging, chapter in Computational Modeling in Biomechanics. Springer Netherlands, pp. 375–408, <strong>2010</strong>.[3] Barbone P.E., Oberai A.A., and Harari I.: Adjoint–Weighted Variational Formulation for Direct Solution of InverseHeat Conduction Problem. Inverse Problems, 23, pp. 2325–2342, 2007.indicates Presenter95
094 MESH ADAPTATION FOR IMPROVING INVERSE–PROBLEM RECONSTRUCTION.O Goksel 1 , H Eskandari 1 , S E Salcudean 1 .1 University of British Columbia, Vancouver, BC, CANADA.Background: The use of the finite element method (FEM) to model deformation for a known elasticitydistribution is often called the forward problem (FP), while recovering such elasticity parameters fromobserved displacements is referred to as the inverse problem (IP) [1]. Various approaches were proposedin the literature for the estimation of viscoelastic tissue parameters from static or dynamic observations.However, the spatial resolution of such recovery is limited by the resolution of the FEM mesh employed.Furthermore, due to the high computational cost, only a limited number of nodes can be used in the IP.Aims: To improve the effective resolution of the IP by adapting meshes to the observed displacements.This generates problem–specific meshes that fit the geometry even at a coarse mesh resolution.Methods: This work presents a simulation study of the effect of the FEM mesh on the IP of elasticity. Forthe simulations, a 10x10cm 2 phantom with a 4x4cm 2 inclusion was meshed using 6–node triangularelements. The Young’s modulus of the inclusion and the substrate were 20kPa and 10kPa, respectively. Thebottom of the phantom was fixed. A sinusoidal axial excitation was applied to the top of the phantom,which was free to slide laterally. The displacements at multiple frequencies (10,20,…,50Hz) were simulatedusing the FEM on a fine mesh, seen in Figure 1a. The observed displacements were then used to estimatethe underlying Young’s modulus (E) distribution [1]. A known density of 1g/cm 3 and zero damping wereassumed. A technique for adapting meshes to given spatial functions (e.g., strain images) was presented in[2], where vertex positions and their triangulation are optimized such that the difference between an imageand its mesh–discretized approximation is minimized. This yields meshes that tend to naturally align theelement faces to the image gradients. In this work, this mesh adaptation technique is applied to the meshesfor the IP in order to improve elasticity reconstruction. For this purpose, axial strain images, which aresimulated using a quasi–static compression in the FP, are used. The mesh adaptation aims to minimize thevariance of the axial strain within each mesh element, aligning the mesh with the underlying elasticitydistribution and, hence, improving the corresponding IP reconstruction.Results: Using meshes that accurately delineate the inclusion, a high–quality reconstruction was possible(for example, see Figure 1b). However, the unknown E distribution is not necessarily delineated well by anyarbitrary mesh (Figure 1c,g,k), which can yield inaccurate reconstructions (Figure 1d,h,l). When thesemeshes are aligned to an axial strain image of the phantom using [2], resulting in the meshes shown inFigure 1e,i,m, the corresponding elasticity reconstructions using the IP improve drastically (Figure 1f,j,n).An enhanced reconstruction contrast is observed, in particular at the axial boundaries that were resolvedgiven only the axial strain image for mesh adaptation.Conclusions: The FEM IP can recover the viscoelastic parameters, but it is limited by the discretizationprovided by the mesh. Axial strain images are used in this work to condition the meshes for the IP. Otherdisplacement–derived information can also be used to further improve meshes used in the IP.References:[1] H Eskandari, SE Salcudean, R Rohling, and J Ohayon: Viscoelastic Characterization of Soft Tissue from DynamicFinite Element Models. Physics in Medicine and Biology, 53(22), pp. 6569–6590, 2008.[2] O Goksel, SE Salcudean: Image–Based Variational Meshing. IEEE Transactions in Medical Imaging (in press).(a) (c) (e) (g) (i) (k) (m)Pa(b) (d) (f) (h) (j) (l) (n)Figure 1: (a) A fine mesh for simulating the FP and (b) a successful Young’s modulus reconstruction using the IP witha coarse, inclusion–compliant mesh. (c,g,k) Three other coarser meshes that are not aligned with theinclusion and (d,h,l) their corresponding IPs. (e,i,m) The same three meshes now adapted to the axial strainimage, which is here computed from the FP and (f,j,n) the corresponding improved IP reconstructions.96indicates Presenter
Session CAA–2: Clinical and Animal Applications – IIMonday, October 18 4:00P – 5:30P038 ULTRASOUND ELASTICITY IMAGING IN THE DETECTION OF INTESTINAL FIBROSIS ANDEDEMA/INFLAMMATION IN RATS AND HUMANS WITH CROHN’S DISEASE.J.M. Rubin 1 , R.W. Stidham 2 , P.D.R. Higgins 2 , J. Xu 3 , L.A. Johnson 2 , M. Zhang 1 , D. Moons 4 ,B. McKenna 4 , K. Kim 3,5,6 .1 Radiology Department, 2 Internal Medicine Department, 4 Pathology Department, University ofMichigan, Ann Arbor, MI 48109, USA; 3 University of Pittsburgh Cardiovascular Institute,5 Bioengineering Department, 6 The Center for Ultrasound Molecular Imaging and Therapeutics,University of Pittsburgh, Pittsburgh, PA 15261, USA.Background: Intestinal fibrosis and edema in Crohn’s disease result from cycles of inflammation andhealing and are rarely identified prior to onset of clinical symptoms. Inflammation and fibrosis can bevery difficult to distinguish in vivo. They often occur together, but they are treated very differently:inflammation with powerful anti–inflammatory agents; fibrosis with surgery. Hence, methods fordistinguishing intestinal fibrosis and inflammation are needed. Ultrasound elasticity imaging (UEI) hasbeen proposed as a potential means of making this distinction [1]. Our previous work has shown that UEIcan differentiate fibrotic from normal intestine in rodents using a 2,4,6 trinitrobenzenesulfonic acid(TNBS) enema model that correlates with histopathology in resected intestine from Crohn’s patients [1].Aims: To determine if UEI can differentiate acutely inflamed from chronically fibrotic bowel in our ratmodel. In addition, to demonstrate that UEI can differentiate between normal and fibrotic bowel inhuman Crohn’s patients.Methods: Female Lewis rats were exposed to TNBS enemas for 48 hours (acute inflammation, N=5) orweekly x 6 weeks (chronic fibrosis, N=5) vs. phosphate–buffered saline (PBS) enemas for 6 weeks (normalcontrols, N=3). UEI was performed shortly before intestinal harvest. Ultrasound radiofrequency (rf) datawere acquired during controlled deformation of each rat’s abdomen using an L10–5 transducer on aZonare Z–1 scanner (Zonare Ultrasound, Mountain View, CA 94043). Strain estimates were obtainedusing a 2D correlation–based phase–sensitive speckle tracking algorithm. To account for differences indeforming force, all strain measurements were normalized to the average strain in normal untreatedbowel in each image. Resected bowel segments were evaluated with histopathology, real–time polymerazechain reaction and Western blot for evidence of inflammation and fibrosis. In addition, we studied4 human subjects with known Crohn’s disease within a week prior of surgical resection of involved bowel.The project was approved by the University of Michigan Institutional Review Board, and informed consentwas obtained from each subject or his/her parents. A prior computed tomogram or magnetic resonancescan identified the involved loops of bowel in advance of the UEI study. Again, using a Zonare Z–1, rf datawere collected during freehand deformations of the abnormal loops along with normal adjacent loops. Thetransducer used depended on the patient’s body habitus. Normalized strain images were then producedin the manner described above. After resection of the bowel, a Young’s modulus estimation wasperformed using a piston elastometer (Artann Laboratories, Inc., Lambertville, NJ 08530).Results: In the rat model, UEI demonstrated significantly different normalized strains in fibrotic bowel(0.43 ± 0.09, p
068 CONTRAST DIFFERENCES IN ULTRASOUND B–MODE AND STRAIN IMAGES OF BRAINTUMORS – PRELIMINARY RESULTSTormod Selbekk 1,2 , Reidar Brekken 1,2 , Ole Solheim 2,3 , Geirmund Unsgaard 2,3 .1 SINTEF, Trondheim, NORWAY; 2 The Norwegian University of Science and Technology,Trondheim, NORWAY; 3 St. Olav Hospital, Trondheim University Hospital, Trondheim, NORWAY.Background: Ultrasound is used in brain tumor surgery for anatomical orientation and resection control.Several groups have reported the use of ultrasound strain imaging techniques for imaging brain tumors[1–3]. These initial reports suggest that the elastograms can be used for intraoperative imaging of braintumors and may serve as a useful adjunct to conventional B–mode images. However, differences in imagecontrast between strain images and conventional ultrasound have not been previously investigated.Aims: The study aims to investigate differences in image contrast between ultrasound B–mode and strainimages of brain tumors with well–defined borders (meningiomas/metastases) and diffuse infiltratingtumors (low–grade gliomas, WHO grade I, II).Methods: Ultrasound data have been acquired during surgery of 12 patients with brain tumorsdiagnosed as meningiomas or metastases (N=4) or as low–grade astrocytomas (N=8). The data wereacquired with a Vingmed System 5 scanner (GE Vingmed, Horten, Norway) using a flat linear 10MHztransducer, with the probe held motionless on dura during acquisition. Strain images were generated bya previously published method [4] enabling imaging of strain induced by arterial pulsation. At a userselected depth, the average intensity and strain magnitude (window size approx. 1x1 mm) were calculatedand displayed for the whole image width for a selected image frame. The maximum and minimum levelsclosest to the ultrasound visible tumor border were registered and used for calculation of contrastbetween normal tissue and tumor tissue for the two image modalities. Contrast is being defined as thedifference in amplitude level between the two areas divided by the sum of the amplitude levels. Thepaired–samples T–test were used for statistical analyses.Results: Image contrast for regions in tumor tissue and normal tissue were calculated for both B–modeultrasound and ultrasound strain images (Figure 1). There are no significant differences in contrastbetween B–mode and strain for meningiomas and metastases, i.e. tumors with well–defined borders(P=0.29). For low–grade astrocytomas, which are diffuse infiltrating tumors, the contrast in the strainimages is significantly higher than the contrast in B–mode images (P
072 DOUBLE PUSH ARF ASSESSMENT OF MUSCULAR MECHANICAL PROPERTIES IN A DOGMODEL OF DMD WITH MYOSTATIN VARIATION.Mallory R. Scola 1 , Joe N. Kornegay 1 , and Caterina M. Gallippi 1 .1 The University of North Carolina at Chapel Hill, Chapel Hill, NC, USA.Background: Duchenne muscular dystrophy (DMD) is an X–linked recessive disorder that is caused by amutation in the gene for dystrophin leading to a loss of the dystrophin protein from the muscle cellmembrane. Muscle inflammation, necrosis and fibrosis occur as a result of the dystrophin deficiencyleading to severe and progressive loss of muscle mass and function. The golden retriever musculardystrophy (GRMD) model has a naturally–occurring dystrophin gene mutation and progressivephenotypic features analogous to those seen in DMD. Myostatin, a member of the TGF-β family, is anegative regulator of muscle growth. It has been proposed that reduction or elimination of myostatincould promote muscle growth and indirectly compensate for muscle degradation in DMD.Aims: This work investigates the use of Double Push ARF for delineating differences in musclecomposition caused by a variation in the myostatin gene in the context of a dog model of DMD.Methods: Imaging was performed in vivo, in planes transverse (Tr) and parallel (Par) to muscle fibers, onthe rectus femoris (RF) and cranial sartorius (CS) muscles of three golden retriever–whippet crosslittermates with the following genotypes: (1) GRMD normal/myostatin normal (control),(2) GRMD/myostatin heterozygote null (Mstn+/-), and (3) GRMD/myostatin normal (Mstn+/+). ARFimaging was performed using a modified Siemens SONOLINE Antares imaging system and a VF7–3transducer (Siemens Medical Solutions USA, Inc. Ultrasound Division). A double excitation (DP ARF)method was employed; with two 300 cycle impulses administered in the same ROE separated by 0.8msand followed by 4:1 parallel receive tracking [1]. Displacements were compared by calculating marginalpeak displacements (MPD), given by %MPD = [PD1 – (PD2 – D)]/PD1 where PD1 is the peak displacementachieved by the first push, PD2 is the peak displacement achieved by the second push, and D is thedisplacement at the time of the second push.Results: The RF muscle of the control (Tr: 0.82%± 0.10, Par: 0.84%±0.19) experienced higher MPDs thanboth the GRMD/Mstn+/+ (Tr: 0.74% ± 0.12, Par: 0.81%±0.12; p
069 BREAST ELASTOGRAPHY: EXPERIENCE OF 800 CASES.E Fleury 1 .1 CTC Genese Medicina Diagnóstica, São Paulo/SP, BRAZIL.Background: Elastography is a noninvasive tool for assessing the rigidity of the lesion, assuming thatmalignant lesions are more rigid than benign ones [1]. However, it is observed in clinical practice thatbreast elastography reproduces faithfully the pattern of stiffness of the lesion shown by histology. That is,mucinous and papillary carcinomas tend be displayed as softer on elastography, while schirrouscarcinomas tend to be displayed as hard.Aims: To correlate elastographic studies of breast lesions with the histological results.Methods: This study compares findings by elastography with results of 834 percutaneous biopsies of breastlesions from 01/01/2009 to 01/01/<strong>2010</strong>. The elastographic studies were performed using a Sonix SP(Ultrasonix Medical Corporation, Vancouver, Canada) ultrasound system with a 5–14 MHz multifrequencylinear probe. For the elastography study, special software was used for the Ultrasonix system, version 2.6.The elastographic classification used a four–point scale according to the color variation during compressionand after decompression of the ROI. A score of 1 was assigned to lesions presenting the same color spectrumof the peripheral breast tissue. A score of 2 was assigned to lesions that after decompression presentedvariation to lighter strains of more than 50% of the mass area when compared to the image acquired duringcompression. A score of 3 was assigned to lesions presenting color variation of less than 50% of the lesionarea (between 10 and 50%) after decompression. Finally, a score of 4 was assigned to the lesions presentingno relevant color variation during compression and after decompression of the parenchyma, appearing blue inboth images. Scores 1, 2 and 3 were considered negative and score 4 positive. The lesions were dividedaccording to their histology, as benign or malignant lesions. The malignant lesions were subdivided into soft(i.e. mucinous and papillary carcinomas) and hard (i.e. schirrous carcinoma) [2,3].Results: The sensitivity, specificity and diagnostic accuracy of elastography were respectively 85.3, 94.0and 92.1 (151 true positive, 621 true negative, 40 false positive and 26 false negative). Of the 834 breastlesions, 657 (78.8%) were benign lesions and 177 (21.2%) were malignant. Of the 177 malignant lesions, 26(14.7%) were included in the subgroup of soft lesions (false negative: 8 scored as 2 and 18 as 3). The other151 were included in the subgroup of hard lesions (true positive). When applied to malignant lesions, theChi–squared test with type 2x2 contingency tables to determine association between histopathologic resultsand elastographic scores revealed an association among results with a p–value of less than 0.001. For thiscalculation, scores of 2 and 3 were considered soft (false negative results) and a score of 4 (true positiveresults) as hard, while subgroup 1 lesions were hard and subgroup 2 lesions soft. The false–negative resultswere shown to be more strongly influenced by histological type of lesion than by size or patient age.Conclusions: This study demonstrates that there is strict correspondence of histological types of breastlesions with the elastographic study.Figure 1: Score 2 lesion onelastography, with soft color onMORE than 50% of the lesion.Figure 2: Score 3 lesion onelastography, with soft color onLESS than 50% of the lesion.Histology: phylloid tumor.Figure 3: Score 4 lesion on elastography, withhard color on all the lesion.Histology: invasive ductal carcinoma(schirrous carcinoma).Histology: typical fibroadenoma.References:[1] EFC Fleury, D Roveda Jr., JC Fleury, MCA Queiroz, S Piato: Elastrography: Theory into Clinical Practice. BreastJ, 15(5), p. 546, Sept 2009.[2] EFC Fleury, JC Fleury, S Piato, D Roveda Jr.: New Elastographic Classification of Breast Lesions During andafter Compression. Diagn Interv Radiol, 15(2), pp. 96–103, Jun 2009.[3] EFC Fleury, JC Fleury, VM Oliveira, JF Rinaldi, D Roveda Jr.: Proposal for the Systematization of the ElastographicStudy of Mammary Lesions through Ultrasound Scan. Rev Assoc Med Bras, 55(2), pp. 192–6, Mar 2009.[4] EFC Fleury, JF Rinaldi, S Piato, JC Fleury, D Roveda Jr.: Appearance of Breast Masses on Sonoelastographywith Special Focus on the Diagnosis of Fibroadenomas. Eur Radiol, 19(6), pp. 1337–46, Jun 2009.100indicates Presenter
026 DOES THE ELASTOGRAPHY/B–MODE LENGTH RATIO PREDICT BREAST CANCER TUMORGRADE?Richard G. Barr 1 , Joseph R. Grajo 2 , Cynthia Peterson 1 .1 Southwoods Radiology Consultants, 250 DeBartolo Place, Youngstown, OH, USA; 2 University ofSouth Florida, 12901 Bruce B Downs Blvd, MDC 41, Tampa, FL, USA.Background: The length of breast cancers appears larger on ultrasound elastography than on B–modeimaging with length change ratios of 1.0 to 3.5 [1,2]. We observed that the ratio appeared to correlatewith aggressiveness of the tumor.Aims: To determine if the length change ratio of breast cancers on ultrasound elastography correspondsto tumor grade.Methods: Elastography (E) was performed on 134 patients undergoing breast biopsy. Compressionelastography was performed using a 10 or 13 MHz probe of a Siemens Antares ultrasound machine.Biopsies were performed with a 14 gauge biopsy needle. In patients with a pre–malignant or malignantdiagnosis, the pathology reports were reviewed for staging. If the tumor was excised, the grading was basedon the surgical specimen. In order to calculate an E/B ratio, the largest dimension of a lesion wasmeasured on the sonogram and mirrored on the elastogram automatically by the US system at the time ofclinical examination. The mean E/B–mode ratio of the tumor was calculated for each pathology, categorizedby biopsy or surgery. The E/B–mode ratio of the tumor was compared to Scharf–Bloom–Richardson (SBR)grade and intraductal carcinoma grade using Pearson correlation coefficient.Results: The average patient age was 63.69 years (range 36–95). Mean E/B–mode ratios were calculatedfor this single–reader study. Ratios varied with pathology: 1.168 with low grade (SD 0.188), DCIS 1.344(SD 0.353), IDC 1.460 (SD 0.40), lobular 1.506 (SD 0.482) (Table 1). The E/B–mode ratio as compared tothe tumor grade in IDC using one–tailed Pearson correlation coefficient (p
101 AXIAL–SHEAR STRAIN ELASTOGRAPHY FOR BREAST LESION CLASSIFICATION: INITIALRESULTS FROM RETROSPECTIVE IN VIVO DATA.Arun K. Thittai 1 , Jose–Miguel Yamal 2 , Louise M. Mobbs 3 , Christina M. Kraemer–Chant 3 ,Srinivasa Chekuri 1 , Brian S. Garra 3 and Jonathan Ophir 1 .1 Diagnostic and Interventional Imaging Department, The University of Texas Medical School,Houston, TX, USA; 2 Biostatistics Division, The University of Texas School of Public Health,Houston, TX, USA; 3 Radiology Department, Fletcher Allen Health Care, Burlington, VT, USA.Background: The image depicting the axial–shear strain has been referred to as axial–shear strainelastogram (ASSE) [1]. The normalized axial–shear strain area (NASSA) near the inclusion/backgroundboundary has been shown as a feature that can identify the boundary bonding conditions [1]. Resultsfrom the initial feasibility study that evaluated the potential of this feature to differentiate betweenfibroadenomas and malignant tumors in the breast were encouraging [2]. However, the initial feasibilitystudy was restricted to a limited number of in vivo cases without a detailed statistical analysis.Aims: The aim of this work was to investigate the potential of NASSA feature for breast lesionclassification into fibroadenomas and cancers. This retrospective study consisted of previously acquireddata from sonographic in vivo cases, with biopsy results as the reference standard.Methods: We used previously acquired in vivo digital radiofrequency (RF) data of breast lesions that wereoriginally acquired for evaluating standard axial elastograms. This retrospective study had an IRBapproval from University of Texas Health Science Center–Houston. A total of 33 biopsy–proven malignanttumors and 30 fibroadenoma cases were included in the study that involved 3 observers blinded to theBIRADS ® ultrasound scores. The observers outlined the lesions on the sonograms. The ASSE wasautomatically segmented and color overlaid on the sonogram, and the NASSA feature from ASSE wascomputed semi–automatically (see Figure 1). Receiver operating characteristic (ROC) curves were thengenerated, and the area under the curve (AUC) was calculated for each observer and compared. A logisticregression classifier was built to compare the improvement in the AUC when using BIRADS plus ASSEscores as opposed to BIRADS scores alone.Results: BIRADS score ROC had an AUC of 0.88 (95% CI = 0.81 – 0.96). In comparison, the average ofthe AUC for all the three observers using ASSE feature alone was 0.85. However, the AUC increased to0.96 (average of 3 observers) when BIRADS score and ASSE feature were combined (see Figure 3). Thecorresponding scatter plot of NASSA vs. BIRADS score is shown in Figure 2.Conclusions: The results demonstrate that ASSE has the potential to improve the standard BIRADS–based breast lesion classification of fibroadenoma and malignant tumors.Acknowledgements: Data used in this study were acquired previously for projects supported by NIH Program Projectgrants P01–CA64597 and P01–EB02105–13. The current work was supported by NIH grant R21–CA135580. Theauthors would also like to thank the observers Elaine Khalil, MD, Karen Ophir, BS, RDMS and Rhoda Reading, BS,RDMS, RVT, RT, who volunteered their time to participate in the study.References:[1] Thitai Kumar A, Krouskop TA, Garra BS and Ophir J: Visualization of Bonding at an Inclusion Boundary usingAxial-Shear Strain Elastography: A Feasibility Study. Phys. Med and Biol., 52, pp. 2615–2633, 2007.[2] Thitai Kumar A, Mobbs LM, Kraemer–Chant CM, Garra BS and Ophir J. Breast Tumor Classification using AxialShear Strain Elastography: A Feasibility Study. Phys. Med. Biol., 53, pp. 4809–4823, 2008.(a)(b)Figure 1:Examples showing the axial–shear strainregion of interest as a color–overlay on topof corresponding sonogram of (a)fibroadenoma and (b) cancer. Notice thatthe axial–shear strain area (outlined forconvenience) due to the cancer were bulkiercompared to the slim ones due to thefibroadenoma.Figure 2:Scatter plot of BIRADS vs. Figure 3: ROC Curves of theNASSA scores. Note thatlogistic regressionthe combination of bothmodel scores, usingaxes gives better separationpredictors NASSA +of fibroadenoma (o) andBIRADS for the threecancer (x) compared to anyobservers, comparedone axis.to BIRADS alone.102indicates Presenter
Session CAA–3: Clinical and Animal Applications – IIITuesday, October 19 8:00A – 9:00A063 BREAST FAT: SHEAR-WAVE ELASTICITY MEASUREMENTS.D Cosgrove 1 , R Hooley 2 , E Mendelson 3 , L Barke 4 , A Cossi 5 , B Cavanaugh 6 , L Larsen 7 .1 Imperial College, Hammersmith Hospital, London, England, UK; 2 Yale Medical Center, Yale, CT,USA; 3 Northwestern Medical Center, Chicago, IL, USA; 4 Sally Jobe Breast Center, Denver, CO,USA; 5 Boston Medical Center, Boston, MA, USA; 6 Thomas Jefferson University, Philadelphia, PA;USA, 7 University of Southern California, Los Angeles, CA, USA.Background: The fatty tissue of the breast is commonly used as a reference for assessing relative strain,but its normal variation has not been documented.Aims: To measure the elasticity of breast fat using shear wave elastography (SWE) in women of differentages.Methods: SWE was performed on 1000 women in the multicenter BE1 study of breast masses;measurements of the subcutaneous fat adjacent to the lesion in kPa were made using SWE on aprototype of the Aixplorer system (Supersonic Imagine, Aix–en–Provence, France). The values werecompared with the patients’ age and with the type of pathology (benign or malignant).Results: The mean age of the patients was 52.1 (SD ±14.8, range 21.2–95.3). The mean elasticity valuewas 14.0kPa (SD ±10.3, range 0.03–122.7). The mean values ranked against the patients’ age by decadewere: 20–30: 11.6; 30–40: 12.1; 40–50: 14; 50–60: 14.3; 60–70: 15.5; 70–80: 14.2; >80: 17kPa. Fat in thepatients with benign masses had a mean elasticity of 13.1kPa while in the malignant group, the meanvalue was 15.6kPa.Conclusions: This is the first quantitative assessment of the stiffness of breast fatty tissue. The elasticityvaried little with age or pathology, supporting the use of fat stiffness as a comparator.Acknowledgements: The BE1 Collaborative Group study was sponsored by Supersonic Imagine and comprisedcenters in the USA and Europe. Their support and participation is gratefully acknowledged.References:[1] Tanter M, Bercoff J, Athanasiou A, Deffieux T, Gennisson JL, Montaldo G, Muller M, Tardivon A and Fink M:Quantitative Assessment of Breast Lesion Viscoelasticity: Initial Clinical Results using Supersonic ShearImaging. Ultrasound Med Biol, 34(9), pp. 1373–86, 2008.Figure 1: Scatterplot of mean SWE values of breastfat in kPa versus patient age.indicates Presenter103
106 STRAIN ESTIMATION USING KALMAN FILTER: SIMULATION AND CLINICAL RESULTS FORMONITORING ABLATIVE THERAPY.H Rivaz 1 , U Hamper 2 , M Choti 2 , GD Hager 1 , EM Boctor 1 .1 Johns Hopkins University, Baltimore, MD, USA; 2 Johns Hopkins Medical Institutes, Baltimore,MD, USA.Introduction: In this abstract, we first introduce a method to calculate strain images from displacementimages using Kalman filter. We show the results of the method on simulated data. We also show theresults of the analytic minimization (AM) method (another work submitted to this conference) with theKalman filtering strain estimation on ablation monitoring in patient trials. The strain estimationtechnique along with the radiofrequency (RF) data of the patient trials can be downloaded fromhttp://www.cs.jhu.edu/~rivaz/UltrasoundElastography/.Aims: (1) Develop a method for strain estimation from displacement which reduces the noise and retainsthe sharp boundaries. (2) Use elastography in clinical trials of monitoring ablative therapy of liver cancer.Methods: Strain estimation requires spatial derivation of the displacement field. Since differentiationamplifies the signal noise, least squares regression techniques are commonly used to obtain the strainfield. Adjacent A–lines are usually processed independently in strain calculation. However, the strainvalue of each pixel is not independent from the strain value of its neighboring pixels. The only exceptionis the boundary of two tissue types with different mechanical properties where the strain field isdiscontinuous. We use the prior of piecewise strain continuity via a Kalman filter to improve the quality ofstrain estimation. Let zi,j be the noisy strain estimate (obtained by least squares regression of thedisplacement image). Let the ground truth strain value be i,j. Let ri,j be the Gaussian process noise and si,jbe the Gaussian measurement noise to be removed. We have i,j = i,j-1 + ri,j (model) and zi,j = i,j + si,j(measurement) [1]. Let (note the super minus) and be respectively a priori and a posteriori strainestimates at step j, and let their variances be respectively p - and p. The time update equations will be [1]andwhere σ 2 r is the variance of the process noise r. The measurement updateequations will beandwhere σ 2 r is the variance of the measurement noise s [1,2].Results: Simulation results are shown in Figure 1. Results of 1 patient trial (out of 7) are shown in Figure 2.Conclusions: The proposed strain estimation technique produces smooth images that preservesharpness across boundaries. The strain estimation method works in real time.References:[1] G. Welch and G. Bishop: An Introduction to the Kalman Filter. UNC TR 95–041, pp. 1–16, 1995.[2] Rivaz H, Boctor E, Choti M, Hager G: Real–Time Regularized Elastography. IEEE Trans. Med. Imaging (in press).(a) Ground Truth Strain (b) Strain without KF (c) Strain with KF (d) Strain Estimate (e) Strain EstimatesFigure 1: Simulation results. KF refers to Kalman filter. The ground truth (a) is not known. In (b), the strainestimate z is obtained by linear regression (i.e. least squares differentiation). In (c), noisy estimates ofimage (b) are used to generate a smooth strain image.(a) B–Mode Patient 1 (b) Axial Strain (c) Lateral Displacement (d) CT Patient 1Figure 2: First patient trial of monitoring RF ablation using ultrasound elastography. The delineated lesion in theintra–operative strain image corresponds to the CT image which is obtained two weeks after the surgery.104indicates Presenter
070 PROSTATE ELASTOGRAPHY: INITIAL EXPERIENCE AND CLINICAL PERSPECTIVE.E Fleury 1 .1 CTC Genese Medicina Diagnóstica, São Paulo/SP, BRAZIL.Background: The diagnosis of prostate cancer is challenging when a patient has an increase in PSA [1].Currently, the option is in these cases for diagnosis is the sextant biopsy of the prostate and, in cases ofre–biopsy, the saturation biopsy. However, in our practice, we have not found significant variation in thediagnosis of cancer by increasing the number of cores per biopsy. As prostate cancer usually does notpresent as a true mass on ultrasound, we believe that it may be difficult to introduce the elastography asan auxiliary tool in the clinical diagnosis. Currently, it seems there is no consensus on the usefulness ofelastography as an auxiliary method to ultrasound for diagnosis of prostate cancer [2].Aims: To demonstrate the initial results of prostate elastography and its clinical applicability.Methods: This study compares 2 groups: Group 1 (25 patients) without elastographic study and Group 2(25 patients) with elastographic study in the period from 01/07/2009 to 01/01/<strong>2010</strong>. All patients hadtransrectal sextant biopsies (12 samples). The elastographic studies were performed using a Sonix SP(Ultrasonix Medical Corporation, Vancouver, Canada) US system with a 5–9 MHz multifrequencyendocavitary probe. For the elastography study, special software was used for the Ultrasonix system,version 3.0.2 (Beta1), upgraded to the commercial version 2.6. We used a two point score forelastographic classification, where 1 corresponds to soft lesions and 2 to rigid lesions based on colorvariation. The lesions were divided according to their histology as benign or malignant [3,4].Results: Results showed 16 (32%) malignant lesions: 8 malignant lesions in Group 1 (1 appeared as amass on B–mode) and 8 malignant lesions in Group 2 (2 appeared as a mass on B–mode). Of themalignant lesions seen on the elastographic study, 2 appear as a hard mass, 1 as diffuse hard tissue onthe right lobe and the other 5 as false negative results. All false positive results corresponded to areas ofgreater rigidity in the peripheral zone of prostate, the location where the cancers usually appear.Adenomatous masses and cysts (7 lesions) were correctly classified as soft. There was no statisticallysignificant difference between the two groups in the diagnosis of prostate cancer (p
087 PROSTATE MECHANICAL IMAGING: CLINICAL RESULTS.V Egorov 1 , N Sarvazyan 1 , RE Weiss 2 , M Ankem 2 , JW Slaton 3 , LA Mynderse 4 , PR Sieber 5 , MD Efros 6 ,M Patel 1 , AP Sarvazyan 1 .1 Artann Laboratories, 1459 Lower Ferry Rd, Trenton, NJ 08618, USA; 2 The Division of Urology,Robert Wood Johnson Medical School/University of Medicine and Dentistry of New Jersey, NewBrunswick, NJ 08901, USA; 3 Minneapolis VA Medical Center, One Veterans Dr, Minneapolis, MN55417, USA; 4 Department of Urology, Mayo Clinic, Rochester, MN 55905, USA; 5 UrologicalAssociates of Lancaster, 2106 Harrisburg Pike, Lancaster, PA 17601, USA; 6 Accumed ResearchAssociates, 1305 Franklin Avenue, Garden City, NY 11530, USA.Background: Mechanical imaging [1] yields tissue elasticity map and provides quantitativecharacterization of a detected pathology. The changes in surface stress patterns as a function of appliedload provide information about the elastic composition and geometry of the underlying tissue structures[2]. In an earlier clinical study with 168 patients, we have evaluated the PMI capability in prostatevisualization and assessment of prostate size and nodularity. In 84% of the cases, the PMI device wasable to reconstruct 2D/3D images of the prostate [3].Aims: The objective of this study was the clinical assessment of the imaging capability, evaluation ofsafety and ease of use of novel Prostate Mechanical Imager (PMI) in multi–site clinical study.Methods: The PMI shown in Figure 1 is anelectronic palpation device that includes a probewith two pressure sensor arrays, motion trackingsystem and an electronic unit providing dataacquisition from the pressure sensors andcommunication with a touch–screen computer. Itvisualizes real time 2D pressure patterns from theprostate surface and provides integration of thepressure patterns into 3D prostate elasticity image(Figure 2). This clinical study was performed at fiveclinical sites where the PMI device was used by fiveurologists. The study population included adultmales with digital rectal examination (DRE) detectedabnormalities and scheduled TRUS–guided biopsyor prostatectomy.Results: There were 56 patients with the averageage of 65, ranging from 43–80 years, and with theaverage PSA score of 4.7, ranging from 0.25–16.2.Based on the independent readers’ review of thePMI images, the PMI provided prostate image in 55of the 56 examined patients, and, for all of thosecases, the PMI visualized the prostate abnormality.There was agreement between DRE and PMI inFigure 1: Prostate MechanicalImager.Blue Surface Level: 15kPaGreen Surface Level: 30kPaRed Surface Level: 45kPaFigure 2: PMI 2D and 3D ElasticityImages of the Prostate.determinations regarding the presence of an abnormality in 89% of the studied cases. No safety concernsor side effects associated with the PMI examination procedure were found in any of the five sites. Allparticipating investigators rated the PMI as reasonably easy to use.Conclusions: This multi–site clinical study has demonstrated the capability of this novel PMI techniqueto produce elasticity images of prostate in 98% of examined patients. The PMI has demonstrated th ecapability to be used as an aid in visualizing and documenting abnormalities of the prostate that wereinitially identified by DRE.Acknowledgements: The work was supported by the National Cancer Institute, grant R44CA082620.References:[1] A Sarvazyan:. Mechanical Imaging: A New Technology for Medical Diagnostics. Int. J. Med. Inf., 49, pp. 195–216, 1998.[2] V Egorov, S Ayrapetyan, A Sarvazyan: Prostate Mechanical Imaging: 3–D Image Composition and FeatureCalculations. IEEE Trans. Medical Imaging, 25(10), pp. 1329–1340, 2006.[3] R Weiss, V Egorov, S Ayrapetyan, N Sarvazyan, A Sarvazyan: Prostate Mechanical Imaging: A New Method ForProstate Assessment. Urology, 71(3), pp. 425–429, 2008.106indicates Presenter
Session MIP–3: Methods for Imaging Elastic Tissue Properties – IIITuesday, October 19 9:00A – 10:15A056 DETECTION OF LAYERS OF ALIGNED COLLAGEN IN HUMAN CERVICAL TISSUE USINGULTRASOUND.Lisa M. Reusch 1 , Janelle Anderson 1 , Lindsey Carlson 1 , Carolyn Pehlke 2 , Mark A. Kliewer 3 ,Josephine Harter 4 , Jeremy J. Dahl 5 , Mark L. Palmeri 5 , Kevin Eliceiri 2 , Helen Feltovich 1,6 , Timothy J. Hall 1 .1 Medical Physics, 2 Laboratory for Optical and Computational Instrumentation, 3 Radiology,4 Pathology Departments, University of Wisconsin–Madison, Madison WI, USA; 5 BiomedicalEngineering, Duke University, Durham, NC, USA; 6 Maternal Fetal Medicine, IntermountainHealthcare, Park City, UT, USA.Background: Spontaneous preterm birth rates have not changed in a century despite extensive research [1].Collagen alignment in the cervix contributes to cervical strength and undergoes rearrangement long before grosschanges (shortening, softening) can be seen, thus understanding cervical microstructure is paramount tounderstanding cervical dysfunction [2,3]. A quantitative assessment of these changes in women has been challengingdue to a lack of noninvasive technology sophisticated enough to interrogate the microstructure of the cervix.Aims: Our goal is to develop quantitative ultrasound techniques to reliably assess collagen alignment, asshown in Figure 1. We acquired quantitative ultrasound (QUS) and acoustic radiation force impulse(ARFI) data from human cervical tissue to measure backscatter properties and shear sound speeds. Wecorroborated our ultrasound findings with multiphoton optical microscopy and curvelet transformanalysis (CTA) to quantify the collagen alignment.Methods: Hysterectomy specimens were scanned with a Siemens Acuson S2000 ultrasound machineusing a prototype intracavity transducer (Siemens Medical Solutions USA, Malvern, PA, USA). Radiofrequency (RF) data were acquired with the endocervical canal parallel to the transducer face. Transmitand receive angles were changed through electronic control to assess anisotropic acoustic propagation.ARFI measurements were collected at steering angles of 0º, ±20º and ±40º, and displacements wereestimated using a cross–correlation method. Shear sound speeds are estimated from the time–to–peakvalues. Backscattered data were collected for steering angles between +40º. Power spectra were computedfor each angle in selected regions of interest. Data from a phantom with spherical scatterers were usedfor system calibration. Lastly, the tissue was sectioned with a vibrotome for second harmonic generation(SHG) imaging. Semi–automatic stitching of the images created a comprehensive image. Distinct collagenlayers were delineated both with visual inspection and with CTA.Results: For positive steering angles, power spectra of the backscattered RF signals from the cervix werehigher at normal incidence (beams perpendicular to tissue) than beams steered to large angles.Backscattered power from both the control phantom and cervix decreased with increasing steering angle.The difference in power was larger from the cervix, which is consistent with scattering from an alignedstructure (e.g. collagen). At negative steering angles, the power spectra are similar to that at normalincidence. We attribute this to an aligned structure, which is angled with respect to the transducer.Additionally, both ARFI imaging and shear wave measurements show clear evidence of layers of differingalignment consistent with the backscatter results. SHG and CTA identified regions of interest consistentwith both visual assessment of collagen alignment and ultrasound results.Conclusions: We show QUS and ARFI results that are consistent with CTA of SHG images of the cervix.Ongoing studies aim to quantify collagen alignment as it changes throughout pregnancy as earlydetection of microstructural changes may open pathways to novel interventions for preterm delivery.Acknowledgements: NIH R21HD061896.References:[1] C. Y. Spong: Obstetrics and Gynecology, Vol. 110, pp. 405–415, 2007.[2] D. Parry: Biophys Chem, Vol. 29, pp. 195–209, 1988.[3] M. Mahendroo, et al.: Mol Endocrinol, Vol. 13, pp. 981–992, 1999.Figure 1: We detect the alignment of collagen within layers in this SHG image of cervix using ultrasound. The cervicalcanal is on the right and the ectocervix (outer edge) is on the left.indicates Presenter107
060 ELASTICITY RECONSTRUCTION WITH DUAL TRANSDUCER MOTION TRACKING.JM Abeysekera 1 , A Baghani 1 , H Eskandari 1 , R Rohling 1 .1 University of British Columbia, Vancouver, BC, CANADA.Background: High quality motion estimation is critical to the inverse problem of solving for tissueelasticity. It is desirable to obtain motion estimates in more than one dimension to reduce the amount ofassumptions needed to solve the inversion problem. Motion estimation in ultrasound is highly accuratealong the beam axis; however, estimation accuracy suffers in other directions due to an order ofmagnitude difference in the sample spacing. Orienting two transducers orthogonally and into the samescan plane (dual transducer method) has been proposed for providing improved 2D motion estimates byusing the estimate along the beam axis of each transducer [1]. While improved motion estimation hasbeen demonstrated, the impact of the technique for reconstructing elasticity has not yet been explored.Aims: In this work, elasticity images are obtained from motion tracking estimates using the dualtransducer technique.Methods: We created a model of a 3D block (5x5x5cm 3 ) with a spherical inclusion (1cm diameter) andused ANSYS FEA software to determine the displacement field for a 100Hz harmonic excitation. Thedisplacements were applied to randomly distributed scatterers (40 per mm 3 ) at eight evenly spaced timesteps covering one period of excitation. Radiofrequency (RF) data were acquired using Field II© with asimulated linear array transducer (L14–5, f = 7.2MHz, pitch = 0.3048mm). Three motion estimationtechniques were applied to evaluate the performance of the proposed technique; 2D tracking, 2D trackingwith angular compounding and 2D tracking with dual transducers.Results: Multiple reconstruction approaches were applied to solve for elasticity values. Inversion usingdynamic finite elements accurately found the location of the inclusion for both the FEA and dual transducermotions, but not for 2D tracking and 2D tracking with angular compounding (Figure 1b–e). Comparing theFEA and dual transducer results shows CNR e values of 60.1dB and 51.2dB, respectively. Another techniquebased on the equations of motion and using FIR filters to reconstruct elasticity was able to more accuratelysolve Young’s modulus values; however it contained significantly more artifacts, obscuring the inclusion. Forthe FIR filter method, the CNR e values for the FEA, 2D tracking, angular compounding, dual transducermotion data were found to be 9.73dB, 4.59dB, 19.96dB and 32.69dB, respectively.Conclusions: Quantitative estimation of Young’s modulus values using dual transducer motionestimation has been studied in this work. The proposed method shows promise for accuratelyreconstructing elasticity values using different inversion techniques.(a) (b) (c) (d) (e)(f) (g) (h) (i)Figure 1: The true (a) Young’s modulus distribution (kPa) and the reconstructed distributions using finite elements(b–e) and FIR filters (f–i). The columns represent reconstruction from different motion data: (left–to–right)ANSYS FEA, 2D tracking, angular compounding and dual transducer. The true location of the inclusionboundary is shown in white.Acknowledgements: This research was supported by NSERC.References:[1] Abeysekera JM, Rohling R: Improved 2D Motion Tracking for Elastography using Dual Transducers. Proc. of 8thITEC, p. 77, 2009.108indicates Presenter
066 FREQUENCY DOMAIN EXTRACTION OF VISCOELASTIC PROPERTIES USING ACOUSTICRADIATION FORCE.Samuel M. Frew 1 , Ali Baghani 1 , Hani Eskandari 1 , Reza Zahiri Azar 1 , Septimiu E. Salcudean 1 .1 University of British Columbia, Vancouver, BC, CANADA.Background: The acoustic radiation force (ARF) of focused ultrasound provides a way of displacing aviscoelastic medium at internal, localized positions. Together with the ability of ultrasound to monitor thedisplacement, it gives a method for recovering the local viscoelastic parameters. This has application inthe diagnosis of various medical conditions, including cancers and <strong>org</strong>an fibrosis.Aims: This work aims to demonstrate the feasibility of a new frequency–domain method to recover theelasticity, viscosity, and power–law parameters of gelatin media from ARF-induced displacements.Methods: The parameter inversion approach uses a force–displacement transfer function obtained fromthe relaxation response of the medium to an ARF push. Relaxation of axial displacement is monitored atthe focal depth of the push. Assuming the relaxation corresponds to the negative step response of a linearsystem, a frequency–domain transfer function is computed. In this study, a parametric mass–spring–damper model is fitted to the transfer function over a range of frequencies with the goal of obtaining arelative elasticity and frequency–dependent relative viscosity. We expect the frequency dependency to bedue to a reported power–law relationship, η = ηcω n , where η is viscosity, ηc is the consistency index, ω isangular frequency and n is the flow index [1]. A SonixMDP ultrasound platform (Ultrasonix Medical Corp.,Richmond, Canada) was used to apply an ARF sequence to three homogenous phantoms (A, B and C)with different gelatin concentrations (1.5, 2.0 and 2.5wt%, respectively). The sequence consisted of a 5mspushing period followed by a 30ms relaxation–tracking period. The sequence was repeated five times toanalyze the consistency of the results. For each phantom, the relative elasticity was extracted from thelow frequency asymptote of the transfer function and compared with values predicted by an empiricalformula in the literature relating elasticity to gelatin concentration [2]. Relative viscosity and the flowindex were obtained using the transfer function and the proposed models.Results: The results are depicted in Figure 1. The transfer functions and the derived parameters wereconsistent over repeated experiments. The relative elasticity values increased with gelatin concentration,and closely matched predicted results (Figure 1c), with a maximum error of 2.9%. The relative viscosityvalues were consistent over the five sequences at frequencies from approximately 100–300Hz. Overallvalues increased with gelatin concentration. The elasticity has a greater dependency than viscosity ongelatin concentration, as expected for the low gelatin concentrations used here [1]. For all phantoms,relative viscosity decreased with frequency over 100–300Hz, as expected from the reported power–lawrelationship (Figure 1d). Fitting the power–law to the averaged experimental data over 100–300Hz gaveflow indices of -0.36, -0.11 and -0.20 for phantoms A, B and C, respectively.8000Hz32(a) A (b) (c) (d)60-0.2B300Hz1.5C240-0.4-0.6120A1A-0.80.50100HzBB-1CC-20000 0.01 0.02 0.030 0.5 1 1.5A B C0 100 200 300 400Time (s)RePhantomFrequency (Hz)Displacement (µm)Figure 1:Conclusions: The extracted relative elasticity values gave a close match to empirical predictions. The relativeviscosity values were consistent over multiple trials and showed the expected decrease with frequency due tothe power–law. Both result sets exhibit good contrast between phantoms. The results show the feasibility ofthis frequency–domain method of recovering viscoelastic parameters from an ARF–generated tissue responseand indicate it has potential for tissue classification applications. Further work is required to apply themethod to more complex phantoms and assess its limitations.Acknowledgements: This work was funded by NSERC.ImResults for phantoms A–C over the five sequence repetitions: (a) relaxation responses; (b) Nyquist plots of the transferfunctions, with each normalized by the absolute value of the 100Hz component; (c) relative elasticity, with empiricallypredicted values indicated by the black marked lines; (d) relative viscosity versus frequency.References:[1] H. Eskandari, S.E. Salcudean, and R. Rohling: Viscoelastic Parameter Estimation Based on Spectral Analysis,”IEEE Trans. Ultrason., Ferroelect., Freq. Contr., Vol. 55, No. 7, pp. 1611–1625, July 2008.[2] T.J. Hall, M. Bilgen, M.F. Insana and T.A. Krouskop: Phantom Materials for Elastography. IEEE Trans. Ultrason.,Ferroelect., Freq. Contr., Vol. 44, No.6, pp. 1355–1365, November 1997.Relative ElasticityRelative Viscosityindicates Presenter109
073 CORTICAL ELASTICITY MEASUREMENT DURING ULTRASOUND–GUIDED KIDNEY BIOPSY:AN EX–VIVO STUDY.Grant H. Kruger 1,2 , Jonathan M. Rubin 3,4 , Dae Woo Park 3,5 , Ashish Hinger 3 , James Hamilton 6 ,Paul Gottschalk 6 and William F. Weitzel 3 .1 Mechanical Engineering, 2 Anesthesiology, 3 Internal Medicine, 4 Radiology, and 5 BiomedicalEngineering Departments, University of Michigan, Ann Arbor, Michigan, USA; 6 Epsilon Imaging,Inc., Ann Arbor, Michigan, USA.Background: Percutaneous biopsy is performed in many areas of medicine, including kidney and liverdiseases, to obtain important diagnostic information that would otherwise not be available. An estimated50,000 renal biopsies are performed annually in the United States alone, of which 1–2% result in seriouscomplications. Ultrasound imaging is commonly used to guide this procedure. We describe a method andresults to non–invasively determine tissue shear modulus by measuring the propagation velocity of ashear wave (S–wave) induced through tissue excitation by the biopsy needle. Shear modulus may also bedetermined using acoustic radiation force imaging (ARFI) methods. However, this information is alreadyaccessible at the time of biopsy since the needle induces an S–wave, which can be monitored usingtraditional ultrasound hardware. The biopsy induced S–wave amplitude may also be several orders ofmagnitude greater than ARFI, thereby improving signal–to–noise ratio. Thus, in addition to the histologysample, clinicians may gather diagnostic information from tissue surrounding the biopsy site.Aims: Determine the shear modulus of renal cortical tissue by measuring the propagation velocity of abiopsy needle initiated S–wave using ultrasound imaging.Methods: High frame rate ultrasound imaging (>200 Hz) of bovine kidney during biopsy was performedusing a 128 element 7 MHz linear array. The 2s recording buffer was manually frozen immediately afterthe biopsy device was fired. Regions of interest (ROIs) were placed at known locations along the S–wavepath. A correlation–based, phase–sensitive speckle–tracking algorithm automatically measured tissuedisplacement perpendicular (along the ultrasound beam) to the direction of S–wave propagation at theseROIs. The location of the peak cross–correlation between the ROI signals provided a measure of thepropagation delay, and, hence, the wave velocity could be determined. Tissue specimens(3mm dia. x 5mm) were tested on a micro–elastometer to compare to the ultrasound results.Results: Figure 2 shows a) B–mode image including ROIs (biopsy needle entry vertical on right side ofimage) and b) instantaneous longitudinal tissue velocity image corresponding to B–model image(lighter/red indicate higher velocities away from the transducer). The S–wave propagation is from right toleft. Figure 2(c) shows the temporal plot of tissue velocity recorded at the ROIs. A velocity of 2.19 m/s wasmeasured with a standard deviation of ±0.39m/s as the ROIs were moved over the scan area. Assuming atissue density of 1g/cm 3 , these velocities relate to a shear modulus of 15 ± 6kPa. We are currentlyvalidating these results using a micro–elastometer.Conclusions: Encouraging results supporting the feasibility of in–vivo renal cortical elasticitymeasurements using ultrasound scans taken during biopsy were obtained. Additionally, the ground workfor future experiments was developed to assess the accuracy of this method. The technique offers thepotential for additional diagnostic information of a larger volume of kidney tissue than the histologicalsample without significant hardware or procedural modifications.Acknowledgements: Epsilon Imaging (Ann Arbor, MI, USA) for the use of their ultrasound machine and analysissoftware, as well as Artann Laboratories, Inc. (Lambertville, NJ, USA) for the use of their micro–elastometer. Thiswork was supported in part by NIH grant DK 62848.Figure 1 Figure 2110indicates Presenter
078 HIGH FRAME RATE 2D WAVE IMAGING ON CONVENTIONAL ULTRASOUND USING SECTORSUBDIVISION, DELAY COMPENSATION, AND ANGULAR COMPOUNDING.R. Zahiri Azar 1,2 , A. Baghani 2 , S.E. Sacludean 2 , R. Rohling 2 .1 Ultrasonix Medical Corporation, Richmond, CANADA; 2 University of British Columbia,Vancouver, CANADA.Background: High frame rate motion estimation has proven to be critical for studying the propagation ofmechanical waves in tissue [1]. Conventional ultrasound systems are based on line by line acquisition ofthe echo signals, introducing a fundamental trade off between the acquisition rate and the number ofscan lines in the imaging plane. With a trade off of long acquisition time or additional hardware overhead,techniques such as synchronization [2,3], multi–line acquisition [4] and ultrafast imaging [1] have beenused to increase the imaging frame rate.Aim: To develop a system based on conventional ultrasound that images both axial and lateralcomponents of periodic tissue motion at high frame rate (>1000Hz) in a short acquisition time (
Session MPT–2: Mechanical Properties of Tissues – IITuesday, October 19 10:45A – 12:00P098 IN VIVO FREQUENCY DEPENDENT SHEAR VISCOELASTIC PROPERTIES OF THE BRAININ NORMAL PRESSURE HYDROCEPHALUS.K Lin 1 , JR McLaughlin 1 , KJ Streitberger 2 , E Weiner 2 , J Hoffmann 2,3 , FB Freimann 4 , D Klatt 2 ,J Braun 2 , C Sprung 4 , R Klingebiel 2,5 , I Sack 2 .1 Rensselaer Polytechnic Institute, Troy, NY, USA; 2 University Medicine Berlin, Berlin, GERMANY;3 University of California San Francisco, San Francisco, CA, USA; 4 University Berlin, Berlin,GERMANY; 5 Neuroradiology and Radiology Insitute, Klinik im Park, Zürich, Switzerland.Background: Normal Pressure Hydrocephalus (NPH) is a neurological disorder characterized by the abnormalenlargement of ventricles with a triad of clinical symptoms including gait disorder, dementia and urinaryincontinence. Current treatment options including shunt operations can lead to a transient improvement ofthe clinical symptoms by draining cerebrospinal fluid (CSF) from the brain. However, a reduction or even acomplete recovery of the ventricular size is often not achieved [1]. To understand the underlying mechanismthat transmits relatively small CSF pressure peaks into a significant, irreversible ventricular enlargement, it isvital to obtain accurate estimation of altered biomechanical tissue properties of brain.Aims: The goal here is to investigate the frequency dependence of the shear viscoelastic properties of thebrain for NPH patients and healthy volunteers by using an enhanced magnetic resonance elastography(MRE) technique with multifrequency vibrations [2]. We aim to: (1) recover frequency dependent complexshear moduli of brain parenchyma; (2) provide accurate estimation of the shear viscoelasticity by derivingtwo phenomenological constants, α and µ, from a fractional element model; (3) establish a consistentpattern of the viscoelastic shear moduli between healthy persons and patients in the periventricularregion and the rest of brain parenchyma.Methods: Twenty NPH patients and twenty–-five healthy volunteers with comparable age and gendercharacteristics were included in the study. Measurements were performed on a standard 1.5T clinicalMRI scanner (Sonata, Siemens, Erlangen, Germany). Mechanical vibrations were induced into the headby a custom–made head cradle connected via carbon–fiber piston to a remote vibration of 25, 37.5, 50and 62.5Hz. Single out of image plane phase difference data acquisition was performed by a single–shotecho–planar motion encoding imaging sequence and the frequency dependent complex shear modulus isreconstructed from the phase difference data using the linear algebraic inversion together with a twodimensional L 1 phase unwrapping algorithm [3]. The two parameters, α and µ, from the fractional elementmodel are then determined by a least square fit over the averaged value of the estimates of the frequencydependent complex shear modulus. The periventricular area was segmented from the brain parenchymaby a filter of 6 pixels around the ventricles, and the averaged value of complex shear modulus iscomputed and compared inside and outside the periventricular area.Results: Significant decrease of cerebral viscoelasticity is observed by a reduction of α and µ in patients withNPH compared to healthy volunteers. All measured complex shear moduli were significantly decreased inpatients by both real and imaginary parts. Also, there is a consistent increase of moduli with the increase offrequencies, and shear viscoelasticity is lower in the periventricular area than the rest of brain parenchyma.Conclusions: Our study is the first to assess alternations of viscoelastic properties of brain tissue inNPH. Our reconstructions of complex shear moduli and viscoelastic parameters from the fraction elementmodel clearly show that NPH is associated with a decrease in elasticity and thus an increase of braintissue compliance. Multifrequency MRE is able to reveal details about the micro–mechanical connectivityof biological tissue in addition to stiffness estimation. Further studies are required to translate theseinitial findings into a valid model of the mechanism of disease progression in NPH.Acknowledgements: We acknowledge NIH, ONR and German Research Foundation (Sa/901–3) for partial support ofthis work. This work was performed at the Inverse Problem Center at Rensselaer Polytechnic Institute and UniversityMedicine Berlin, Campus Charité Mitte.References:[1] C Sprung, C Miethke, HG Schlosser, M Brock: The Enigma of Underdrainage in Shunting with HhydrostaticValves and Possible Solutions. Acta Neurochir Supple 95, pp. 229–235, 2005.[2] D Klatt, et al.: Noninvasive Assessment of the Rheological Behavior of Human Internal Organs using MultifrequencyMR Elastography: A Study of Brain and Liver Viscoelasticity. Phys Med Biol, 52, pp. 7281–7294, 2007.[3] K Lin, J McLaughlin, A Thomas, K Parker, B Castaneda and D Rubens: Two–Dimensional Shear Wave Speed andCrawling Wave Speed Recoveries from In Vitro Prostate Data. JASA (submitted), <strong>2010</strong>.112indicates Presenter
047 A NOVEL INSTRUMENT FOR THE VISCOELASTIC SPECTROSCOPY OF BIOMATERIALS ANDTISSUE MIMICKING MATERIALS FROM 10 TO 1000 HZ.Cédric Schmitt 1 , Anis Hadj Henni 1 , Marie–Élise Tremblay 2 , Mélina Hamdine 2 ,Marie–Claude Heuzey 2 , Pierre J. Carreau 2 , Guy Cloutier 1 .1 Laboratory of Biorheology and Medical Ultrasonics, University of Montréal Hospital ResearchCenter (CRCHUM), Montréal, Québec, CANADA; 2 Center for Applied Research on Polymers andComposites, École Polytechnique, Montréal, Québec, CANADA.Background: Materials mimicking biological tissue mechanical properties are intensively used to validateand improve emerging multimodality imaging techniques, which couple anatomical information (MRI,ultrasound, etc.) with elastic or viscoelastic mapping (i.e., quasi–static and dynamic elastography). Mostof the proposed elastography methods apply a dynamic stress to the probed medium at frequenciestypically up to 1500 Hz. However, commercial rheological instruments dedicated to measuringmechanical parameters are limited to frequencies below 200 Hz. Thus, there is a need for instrumentsallowing viscoelasticity measurement in a broad–band frequency range to evaluate the sensitivity androbustness of elastography imaging techniques.Aim: Our objective was, on one hand, to introduce a novel instrument, Rheospectris, capable ofmeasuring the complex shear modulus of biomaterials and soft tissue materials from 10 to 1000 Hz, and,on the other hand, to validate the new instrument by comparison with a commercial rheometer.Methods: The basic principle of Rheospectris (Rheolution Inc., QC, Canada) consists of applying atransient vibration to a material sample contained in a cylindrical tube and in measuring its dynamicalresponse. The spectral material viscoelasticity (G’ and G”) is then determined from the measured samplevibrations. For validation purposes, we characterized the complex shear modulus of silicon rubber andPVA cryogel using rheometry with a Physica MCR 501 instrument (Anton Paar GmbH, Austria), between0.1 Hz and 100 Hz and with the new Rheospectris device from 10 Hz to 1000 Hz. Statistical analyses ofvariance (ANOVA) were performed on storage (G’) and loss (G”) moduli obtained with both instruments inthe common frequency range from 10 Hz to 100 Hz.Results: As seen in Figure 1, G’ values, obtained with both instruments, are in very good agreement withinthe 10–100 Hz common frequency range (silicon: p = 0.399, PVA cryogel: p = 0.880) whereas pooreragreement was found for G” (silicon: p < 0.001, PVA cryogel: p = 0.304). G’ and G” evolution given byRheospectris over two frequency decades exhibit a stronger material viscoelastic dispersion for silicon samplescompared to PVA cryogel samples. This frequency dependence, not always clearly visible from standardrheometry data (e.g., low–frequency rheometry data shown on Figure 1b), needs to be taken into considerationto understand the shear wave velocity evolution as a function of frequency in dynamic elastographytechniques. Similar results as shown in Figure 1 were obtained for PVC and chitosane (not shown).Figure 1: Storage (G’) and loss (G”) modulias a function of frequency for (a)silicon and (b) PVA cryogelsamples measured using astandard rheometer and with theRheospectris instrument.See: www.rheolution.comG’, G’’ (Pa)(a)5000040000300002000010000G’ G’’Rheometer (n = 4)Rheospectris (n = 5)00.1 1 10 100 100000.1 1 10 100 1000(a)Frequency (Hz)(b)Frequency (Hz)Conclusions: Rheospectris is a valuable instrument for viscoelastic characterization of a wide variety oftissue mimicking materials and biomaterials currently used in elastography imaging studies. TheRheospectris instrument, contrary to rheometry devices due to technological limitations, has access towideband complex shear moduli commonly explored in dynamic elastography.Acknowledgment: Funding was received by a grant from the Canadian Institutes of Health Research (#MOP–84358).G’, G’’ (Pa)(b)12000100008000600040002000G’ G’’Rheometer (n = 5)Rheospectris (n = 5)indicates Presenter113
067 FURTHER CHARACTERISATION OF CHANGES IN AXIAL STRAIN ELASTOGRAMS DUE TOTHE PRESENCE OF SLIPPERY TUMOR BOUNDARIES. PART I: SIMULATION STUDY.Leo Garcia 1 , Jérémie Fromageau 1 , Jeffrey C. Bamber 1 , Chris Uff 1 .1 Joint Department of Physics, Institute of Cancer Research, 15 Cotswold Road, Sutton, Surrey,SM2 5NG, England, UK.Background: Whether a tumor is firmly attached to, or free to slip against, surrounding tissue can affectits appearance in axial and axial shear elastograms [1–4]. For example, mobile tumors are surrounded bya halo of slip–induced high strain, show changes in strain contrast with their shape and orientation [5,6]and have characteristic distributions of shear strain [7]. Exploiting these differences could aid diagnosisbecause some benign tumors, such as fibroadenoma in the breast, are loosely bonded and slip uponpalpation. Real time detection and characterization of slippery boundaries may also aid tumor resection,where knowledge of potential planes of cleavage is useful.Aims: We wish to further understand the effect of lesion mobility on elastograms. Here, we considerchanges in axial strain only, for the case of a symmetrical model undergoing uniaxial compression,studied by characterizing changes in tumor contrast transfer efficiency (CTE) and strain contrast betweenthe slip–induced strain contrast, both as a function of Young’s modulus contrast.Methods: Finite element analysis (FEA) was used to simulate two plane–strain tumor models, one that isequivalent to a cylindrical inclusion bonded to its surroundings and another that is free to slip with nofriction. CTE values were calculated using element-based strain directly from FEA, so as to exclude slip–induced strain at the boundary. CTE is defined as the ratio (in decibels) of the mean lesion to backgroundstrain contrast to the equivalent lesion to background Young's modulus contrast [8]. Strain was alsocalculated by applying a gradient estimator to nodal displacements to obtain a more “realistic” elastogramwith a strain halo around the mobile lesion. Mean strain values within an annulus centered on theinclusion boundary, of width equal to half the strain estimator length, were used to estimate annuluscontrast, defined as (εannulus–εbackground)/ε background , where ε is mean absolute axial strain. We hypothesizethat high positive contrast between this annulus region and the background indicates lesion mobility.Results: Figure 1 shows CTE curves obtained from element–based strain for the two model types. Theslip model has positive CTE for the case where the inclusion and the background moduli are equal,indicating image tumor contrast in the absence of stiffness contrast. In general, as described previously,mobile inclusions appear stiffer than their adhered equivalents. Note that there is a point where the“slippery” curve crosses CTE = 0 dB, i.e. where the strain contrast closely matches the Young’s moduluscontrast. Figure 2 shows the variation in boundary annulus contrast with inclusion stiffness. For the slipmodel, annulus contrast is always positive and greater than the adhered case. It increases with inclusionmodulus and remains approximately constant with applied strain (not shown here).Conclusions: The presence of a slippery tumor boundary introduces two mechanisms for generatingstrain contrast that are additional to that due to any modulus contrast: slip–induced strain at theinclusion boundary and deformation strain within the inclusion. Experimental study of these phenomenais presented in an accompanying abstract.Acknowledgements: This work was supportedby the Engineering and Physical SciencesResearch Council, UK.References:[1] Maciejko et al.: Proc. of ITEC, p. 91, 2003.[2] Krouskop et al.: Proc. of ITEC p. 120, 2004.[3] Konofagou et al.: Ultrasonics, 38,pp. 400–404; 2000.[4] Garcia et al.: Proc. IEEE UltrasonicsSymposium, <strong>2010</strong>.[5] Thitai Kumar, Ophir: Ultrasound Med.and Biol., 33(9), pp. 1463–1467, 2007.[6] Galaz et al.: Proc. of ITEC, p. 99, 2009.[7] Thitai Kumar et al.: Physics Med. and Biol.,52, pp. 2615–2633, 2007.[8] Ponnekanti et al.: Ultrasound Med. and Biol.,21(4), pp. 533–543, 1995.Figure 1: Contrast transfer efficiencycurves for adhered andmobile inclusions.Figure 2: Variations in boundaryannulus contrast withincreasing inclusionYoung’s modulus.114indicates Presenter
081 FURTHER CHARACTERISATION OF CHANGES IN AXIAL STRAIN ELASTOGRAMS DUE TO THEPRESENCE OF SLIPPERY TUMOR BOUNDARIES. PART II: EXPERIMENTAL VERIFICATION.Chris Uff 1 , Leo Garcia 1 , Jérémie Fromageau 1 , Jeffrey C. Bamber 1 .1 Joint Department of Physics, Institute of Cancer Research, 15 Cotswold Road, Sutton, Surrey,SM2 5NG, England, UK.Background: Tumor mobility has implications in both diagnosis (as in breast cancer) and in surgicalplanning (as in neurosurgery). It has been established in Finite Element Analysis (FEA) models that aslippery boundary can affect the appearance of both normal axial strain [1] and axial shear strain [2]elastograms, but experimental data are lacking. We have presented FEA of axial strain data for slipperyvs. adhered inclusions in a companion paper and here we present the experimental results.Aims: Experimental verification of FEA studies as a precursor to translation into clinical practice.Methods: Cuboidal gelatine phantoms with a cylindrical inclusion of differing gelatine concentrations (byweight) were manufactured, and the Young’s modulus (YM) derived from stress–strain curves measured on anInstron mechanical testing device (Table 1). Bonded and slippery (water lubricated) inclusions were made foreach YM contrast (C Y ). Ultrasound elastography data were acquired with a DIASUS scanner (Dynamic ImagingLtd, UK) and a 6–12MHz linear array transducer within a mechanical 3D probe, in conjunction with Stradwin3.8 (Cambridge University, UK) ultrasound elastography acquisition software. The transducer was connectedto an Instron compression device. 1N pre–compression was applied to ensure good acoustic contact, followedby incremental compressions of 0.5% strain to generate 10 single–step elastograms. The mean strain valueswere calculated over regions of interest (ROI) within the inclusion (a circular ROI) and the background (anannular ROI) and the halo of high strain at the boundary of the slippery inclusions (an annular ROI). CTEwas calculated as η=|C strain (dB)|-|C Y (dB)|[3].Results: Our slippery phantoms did not exhibit uniform slip over the whole compression cycle: thepre–compression invariably started slip, but halo contrast, inclusion strain and background strain variedlocally as the compression increased, consistent with adherence occurring at points on the inclusionboundary (Figure 1). CTE curves (Figure 2), which are regarded as preliminary at present, agree in somerespects with FEA studies in that the slip curve lies (on average) below the adhered curve for softinclusions (indicating false stiffness), crosses it to become positive at zero YM contrast and stays above itfor hard inclusions (also indicating false stiffness). For both types of stiff inclusion the loss of CTE withincreasing modulus contrast was greater than expected, which currently remains unexplained.% GelBackground% GelInclusionYM Contrast(dB)8 14 4.278 12 2.688 10 1.0814 14 014 12 -1.5914 10 -3.1914 8 -4.29Table 1: Young’s modulus of gelatineFigure 1: Halo contrast vs straindemonstrating slip–stickbehaviour.Conclusions: The stiffening effect of a slippery boundary on both soft and hard inclusions has beenobserved in a phantom experiment. The difference demonstrated is, however, less than that shown byFEA, and, if these results are correct, in the clinical setting, this phenomenon is unlikely to contribute toerroneous interpretation of axial strain contrast with respect to stiffness contrast. Localized adherence onthe other hand produces changes in halo, lesion and background strain patterns that may be clinicallyhelpful. Future work may be directed towards development of phantoms that exhibit more uniform slip.Acknowledgements: Work supported by the Engineering and Physical Sciences Research Council, UK.References:[1] Thitai Kumar and Ophir: Ultrasound Med. and Biol., 33(9), pp. 1463–1467, 2007.[2] Thitai Kumar et al.: Physics Med. and Biol., 52, pp. 2615–2633, 2007.[3] Ponnekanti et al.: Ultrasound Med. and Biol., 21(4), pp. 533–543, 1995.CTE (dB)0-5 -3 -1 1 3 5-2AdheredSlip-4True (YM) Contrast (dB)Figure 2: CTE curves for adhered andslippery inclusions.indicates Presenter115
082 MEASURING THE YOUNG’S MODULUS OF HUMAN BRAIN IN VIVO WITH REAL TIME SHEARWAVE ELASTOGRAPHY.Chris Uff 1 , Jeffrey C. Bamber 1 , Neil L Dorward 2 .1 Joint Department of Physics, Institute of Cancer Research, 15 Cotswold Road, Sutton, Surrey,SM2 5NG, London, England, UK; 2 Neurosurgery Department, Royal Free Hospital, Pond St,London, NW3 2NQ, England, UK.Background: The human brain is <strong>org</strong>anised into cortex and subcortical areas. The cortex comprises a1–2mm layer of grey matter (cell bodies) with underlying white matter (axons). The subcortical areas alsohave grey and white matter, the grey matter <strong>org</strong>anised into large nuclei and the white matter tracts highlycompacted. Previous attempts to measure the Young’s modulus (YM) of human brain have resulted invalues differing by more than a factor of ten (3–35kPa) [1], with a predominance of cadaver studies usinga variety of methods. The few studies that differentiate between grey and white matter used subcorticalregions of interest (ROIs) and found white matter to have a higher YM than grey. Shear wave elastographyallows real time YM measurement in vivo with small ROIs.Aims: To measure YM of human brain in vivo to differentiate cortical grey and white matter.Methods: 4 patients were scanned during surgery to resect brain tumors. During the scans, areas of normalbrain adjacent to the pathological areas were scanned with a SuperSonic Imagine Aixplorer scanner usingthe shear wave elastography (SWE) function. Measurements of YM were made in ROIs identified as grey andwhite matter from the B–mode sonograms using the Aixplorer’s Q-box function (Figure 1).Results: The mean Young’s modulus of cortical grey matter was 31.2kPa compared to 16.3kPa for white matter(Figure 2). Identification of the different regions of the cortex was possible in high resolution sonograms.Figure 1:B–mode scan of normal brain with cortical grey ()and white (+) matter ROIs selected.4035302520151050Grey WhiteFigure 2: Grey and White matterYM measurementsConclusions: In contrast to previous studies, we found grey matter to be stiffer than white matter. Thedifferences between the structure of the cortex compared to the sub–cortical regions may explain thisdifference. It is now becoming apparent that YM varies significantly between different types of tissue indifferent areas of the brain; selection of appropriately small ROIs is necessary. YM anisotropy in whitematter has recently been demonstrated in vivo in the rat [2], and future work may be directed towardsdeveloping methods of ultrasonic imaging of white matter tracts for neurosurgical intra–operative guidance.Acknowledgements: The Aixplorer scanner was kindly loaned to the group by SuperSonic Imagine UK Ltd. Thiswork was supported by the Engineering and Physical Sciences Research Council, UK. Ethical approvalwas obtained from the The National Hospital for Neurology and Neurosurgery & Institute of NeurologyJoint Regional Ethics Committee (Ref: 08/H0716/92). Research and development (R&D) approval andsponsorship were obtained from the Royal Free Hospital Clinical R&D Department (Ref 7745).References:[1] Kruse S, Rose G: Magnetic Resonance Elastography of the Brain. Neuroimage, 39, pp. 231–237, 2008.[2] Macé E, Cohen I: 3D In Vivo Brain Elasticity Mapping in Small Animals using Ultrasound. IEEE InternationalUltrasonics Symposium <strong>Proceedings</strong>, pp. 471–474, 2009.E (kPa)116indicates Presenter
Session MIP–4: Methods for Imaging Elastic Tissue Properties – IVTuesday, October 19 1:30P – 3:30P095 CAN MRI ACCURATELY MEASURE TRANSIENT DISPLACEMENT WAVEFORMS?A COMPARISON WITH ULTRAFAST ULTRASOUND IMAGING.Rémi Souchon 1 , Jean–Luc Gennisson 2 , Mickaël Tanter 2 , Jean–Yves Chapelon 1 , Olivier Rouvière 1,3 .1 INSERM, U556, Lyon, FRANCE; 2 Institut Langevin–Ondes et Images, ESPCI ParisTech, CNRSUMR7587, INSERM U979, Paris, FRANCE; 3 Hospices Civils de Lyon, Lyon, FRANCE.Background: Magnetic resonance acoustic radiation force imaging (MR–ARFI) [1] measures the peakdisplacement induced by an ultrasound pulse. The technique is based on the assumption that the focusis stationary during the encoding gradients. However, this hypothesis may or may not be valid dependingon the time needed to reach equilibrium. A measurement of the displacement waveforms [2] mayovercome this limitation. However, the ability of motion–sensitive MR sequences to accurately measuresuch waveforms remains to be established.Aims: To compare transient displacement waveforms measured with MRI and those measured with anultrafast ultrasound scanner.Methods: Transient displacements were induced in liver samples ex vivo using the radiation force of afocused ultrasound transducer (2.4MHz, f#1.3, push duration 2ms), and the waveforms were measuredusing a motion–sensitive MR sequence [2]. The push experiment was repeated and monitored using anultrafast ultrasound scanner (Aixplorer, Supersonic Imagine, France). The peak amplitude and the timeconstants of the displacement waveforms were compared.Results: Figures 1, 2 and 3 respectively show the displacement waveforms for ultrafast ultrasound, MRIprocessed by deconvolution, and MRI processed with a model-based (minimization) approach.Quantitative measurements are summarized in Table 1.401Displacement (µm)30<strong>2010</strong>Displacement (normalized)0.5000 5 10 15 20 25Time (ms)Figure 1: Displacement (Ultrafast US)Displacement (normalized)10.80.60.40.200 5 10 15 20 25Time (ms)Figure 3: Displacement (MRI + model)-0.50 5 10 15 20 25Time (ms)Figure 2: Displacement (MRI + deconvolution)Time constantPeakof decaydisplacement (µm)(ms)Ultrafast US(N=1)33 – 38 5.7 – 6.7MRI + Deconvolution(N=3)26 – 40 2.6 – 3.2MRI + Model(N=3)31 – 47 8.8 – 10.2Table 1: Summary of measurements (min–max)Conclusions: Reasonable agreement was found between both modalities. However quantitativemeasurement of relaxation times appears challenging in MRI.References:[1] McDannold N, Maier SE: Magnetic Resonance Acoustic Radiation Force Imaging. Med Phys, 35(8),pp. 3748–3758, 2008.[2] Souchon R et al.: Estimation of Displacement Waveforms with Transient MR Elastography. Proc 8 th ITEC, 2009.indicates Presenter117
079 A GPU–BASED–TIME CONSTANT ESTIMATOR FOR REAL–TIME ELASTOGRAPHY APPLICATIONS.Sanjay P. Nair 1 , Xu Yang 1 , Thomas A. Krouskop 2 , Raffaella Righetti 1 .1 Electrical and Computer Engineering Department, Texas A&M University, College Station, TX,USA; 2 National Institute for Human Performance, Houston, TX, USA.Background: New elastographic techniques such as poroelastography and viscoelasticity imaging aim atimaging the temporal mechanical behavior of tissues [1]. These techniques usually involve the use ofcurve fitting methods as applied to noisy strain data to estimate new elastographic parameters [2]. As oftoday, however, current elastographic implementations of these novel imaging methods are generally tooslow and not optimized for clinical applications. Additionally, image quality performance of these newelastographic imaging techniques is still largely unknown.Aims: The purpose of this study is to propose a new elastographic time constant (TC) estimator, whichallows simultaneously imaging multiple TC elastographic parameters in real–time and with high accuracyand sensitivity.Methods: We implemented a well studied algorithm that, to our knowledge, is new to elastographic TCestimation, which is based on the use of the Least Square Error (LSE) curve–fitting method and theLevenberg–Marquardt (LM) optimization rule as applied to noisy elastographic data. The LM algorithm is anoptimization technique which is perfectly suited for solving LSE problems [3]. The algorithm is executed ona massively parallel General Purpose Graphics Processing Unit (GPGPU) to achieve real–time performance.The performance of the new estimator is analyzed using simulations and quantified in terms of accuracy,precision, sensitivity, signal–to–noise ratio (SNR) and speed. Experiments are performed as a proof ofprinciple of the technical applicability of the new estimator to real experimental data.Results: Figure 1a and b show an experimental axial strain TC elastogram and an axial strainequilibrium point elastogram, respectively, obtained from a block of tofu using the new elastographicGPGPU–TC estimator. These elastograms were obtained at a final image calculation rate of 7.8 frames/s,with an improvement in computational speed up to 400 times with respect to the CPU version of thesame algorithm. This estimator was also found to be up to three orders of magnitude faster thancommercially available MATLAB functions [4] and previously proposed elastographic TC algorithms [1,2].Figure 1c shows the accuracy [4] of the algorithm with respect to the true TC and equilibrium strain.Conclusions: The results of this study demonstrate that the elastographic estimator described in thispresentation can produce time constant estimates in real–time and with high accuracy (>99%) andsensitivity (< 5s). The availability of this GPU–based LM–LSE TC estimator has the potential to enablereal–time monitoring of the temporal behavior of complex poroelastic tissues using ultrasound elastography.Acknowledgements: This work is supported by Texas Engineering Experiment Station and Texas A&M University, CollegeStation, TX. The authors would like to acknowledge Gautham Nair’s assistance throughout the course of this study.References:[1] Righetti R, Ophir J, Krouskop TA: A Method for Generating Permeability Elastograms and Poisson’s RatioTime–Constant Elastograms. Ultras. Med. Biol., Vol. 31(6), pp. 803–816, 2005.[2] Berry GP, Bamber JC, Armstrong CG, Miller NR, Barbone PE: Towards an Acoustic Model–Based PoroelasticImaging Method: I. Theoretical Foundation. Ultras. Med. Biol., vol. 32(4): 547–567, 2006.[3] Ranganathan A. The Levenberg–Marquardt Algorithm. 8th June 2004.http://www.scribd.com/doc/10093320/Levenberg–Marquardt–Algorithm.[4] Nair, Sanjay: Performance Analysis of a New Ultrasound Axial Strain Time Constant Estimation. MS thesisTexas A&M University, <strong>2010</strong>. Print.Figure 1:(a) (b) (c)118indicates Presenter
058 SYNTHESIS AND ANALYSIS OF CRAWLING WAVES GENERATED FROM RADIATION FORCE.Zaegyoo Hah 1 , Christopher R. Hazard 2 , Deborah J. Rubens 3 , Kevin J. Parker 1 .1 Electrical and Computer Engineering Department, 3 Imaging Science Department, University ofRochester, Rochester, NY, 14627, USA; 2 GE Global Research, One Research Circle, Niskayuna,NY, 12309, USA.Background: Conventional crawling waves (CR waves) are formed by the interference pattern of twocontinuous sinusoidal excitations with small frequency differences. CR waves have advantages of easyimaging using conventional color Doppler scanning and well–posed estimation of local elastic propertiesof tissues and lesions [1,2]. However, with radiation force from the ultrasound beam acting as theexcitation source, the resulting vibration will be more pulsatile in time and space. A synthesis scheme isapplied to create the sinusoidal interference and, therefore, CR waves [3] over a range of frequencies.Aims: This presentation demonstrates the methods to generate CR waves with radiation force fromultrasonic beams and shows results of CR waves synthesized from the measurement of phantoms.Methods: A GE Logiq 9 ultrasound system was modified to collect the data required to generate thesynthetic arc wave displacement time histories. A special research scan sequence format was developed.Complex baseband demodulated data (IQ) were stored for offline processing. The sampling rate of the IQdata was 10 MHz. The duty cycle of the overall scan sequence was maintained at less than 0.5% to avoidthermal limits of the components. IQ data were processed to extract displacements shown in Figure 1.The displacements were further processed to generate CR waves. One such frame is shown in Figure 2.Two types of phantoms were made and scanned with the modified Logiq 9 system: a gelatin phantom withan inclusion, and a fatty phantom with 30–50% oil. The displacement data for each of the phantom wereused to generate CR waves and further analyzed to estimate local shear speed.Results: The Crawling Wave data are analyzed to estimate the shear wave velocity of the medium. Both ahomogeneous medium and a medium with an inclusion are covered. The background medium is designedto have a shear velocity of 2–3 m/s while the inclusion has higher velocity of 4–5 m/s.Conclusions: It is confirmed that the CR waves with displacements below 10 microns can be generatedwith radiation force induced by ultrasound beam. Also, the analysis of the data shows the validity of themethods in detecting the elastic properties of the tissue.Acknowledgements: This study was partly supported by NIH grant 5 ROI AG016317 and NIH grant 5 RO1AG29804.References:[1] Zhe Wu, Kenneth Hoyt, Deborah J. Rubens, Kevin J. Parker: Sonoelastographic Imaging of Interference Patternsfor Estimation of Shear Velocity Distribution in Biomaterials. Journal of the Acoustical Society of America,Vol. 120, No. 1, pp. 535–545, July 2006.[2] Kenneth Hoyt, Kevin J. Parker, and Deborah J. Rubens: Real–Time Shear Velocity Imaging UsingSonoelastographic Techniques. Ultrasound in Medicine and Biology, Vol. 33, No. 7, pp. 1086–1087, 2007.[3] Zaegyoo Hah, Young Thung Cho, Chris Hazard, Kevin Parker, Deborah Rubens: Crawling Waves from RadiationForce Excitation. Ultrasonic Imaging, special issue in honor of Dr. Wagner, in press.Figure 1: A frame of displacementsmeasured with Logiq 9 system. (a)from left push, (b) from right push.Figure 2: A frame of CR wavesynthesized from left andright displacement data.indicates Presenter119
065 A SIMULATION FRAMEWORK FOR HARMONIC MOTION IMAGING FOR FOCUSEDULTRASOUND (HMIFU) WITH EX VIVO VALIDATION.Gary Y. Hou 1 , Jianwen Luo 1 , Caroline Maleke 1 , Jonathan Vappou 1 , Elisa E. Konofagou 1,2 .1 Department of Biomedical Engineering, 2 Department of Radiology, Columbia University, NewYork, NY, USA.Background: HMIFU is a recently developed high–intensity focused ultrasound (HIFU) therapymonitoring method with feasibilities demonstrated in vitro and in vivo [1,2]. Its principle is based onHarmonic Motion Imaging (HMI) [3], an oscillatory radiation force technique for imaging tissuemechanical properties during application of an amplitude modulated (AM) therapeutic beam used byHIFU. In this work, a theoretical framework of HMIFU is presented, comprising a customized nonlinearwave propagation model, a finite–element (FE) analysis module, and an image–formation model.Aims: 1) Assessment of the fundamental capabilities of HMIFU in lesion localization and quantificationand 2) validation of the simulation findings ex vivo.Methods: The same HMI and HMIFU parameters (I spta, HMI = 231W/cm 2 , I spta, HMIFU = 942W/cm 2 ) as in theaforementioned experimental studies were used, i.e., 4.68MHz HIFU frequency and an AM frequency of25Hz. A HIFU–simulator [4] was modified to simulate HMIFU pressure and thermal lesion maps within a30 x 9mm 2 target. Both fields were used as inputs into the 3D FE solver (COMSOL Multiphysics TM ,Burlington, MA) to compute the displacement in a linear elastic, lesion–embedded simulated phantom withthe lesion Young's modulus varying between 30, 60 and 90kPa in a background of 10kPa. Theradiofrequency (RF) signals were simulated in MATLAB using a linear convolutional model (f center = 7.5MHz,f sample = 80MHz) and then used to estimate the HMI displacements using 1D cross–correlation. Using thesame parameters as in the simulations, HIFU experiments were performed on three ex vivo canine liverspecimens with 10s, 20s, and 30s heating durations.Results: Good agreement was found between the simulated (2.86, 5.93 and 17.5mm 2 ) and experimental(2.83, 6.75 and 17.9mm 2 ) HMIFU lesion sizes as well as focal depths of 4.8–5.2cm, 4.6–5cm, and 4.4–5.1cmin the 10s, 20s and 30s cases, respectively. For a Young's modulus ratio of 3, 6, and 9, the FE andestimated lesion–to–background HMI displacement ratios were equal to 2.42, 3.93, and 5.41, and 1.89,3.54, and 5.04, respectively. In experiments, the HMI displacement followed a similar trend of 1.82, 3.25,and 4.20 at 10s, 20s, and 30s heating, respectively.Conclusions: The capability for lesion characterization and quantification based on the underlying tissuemechanical properties using HMIFU was assessed using a theoretical framework, which comprised aHIFU simulator, a FE mechanical model and an image formation model. Good agreement in both lesionsize and focal depth was found between the actual and estimated HMI lesion maps in both simulationsand experiments. In conclusion, the reliability of the HMIFU system for lesion detection, localization andquantification using the parameters previously studied was demonstrated.Acknowledgements: The presented work is supported by the National Institutes of Health (NIH R21EB008521). Theauthors wish to thank Joshua Soneson, Ph.D. at US Food and Drug Administration for providing the source codes ofthe HIFU Simulator Ver. 1.0.References:[1] Maleke C. and Konofagou E.E.: Harmonic Motion Imaging for Focused Ultrasound (HMIFU): A Fully IntegratedTechnique for Sonication and Monitoring of Thermal Ablation in Tissues. Phys. Med. Biol., Vol. 53, No. 6,pp. 1773–1793, 2008.[2] Maleke C and Konofagou EE: In Vivo Feasibility of Real–Time Monitoring of Focused Ultrasound Surgery (FUS)using Harmonic Motion Imaging (HMI). IEEE Trans. Biomed. Eng., Vol. 57, pp. 7–11, <strong>2010</strong>.[3] Maleke C., Pernot, M. and Konofagou E.E.: A Single–Element Focused Transducer Method for Harmonic MotionImaging. Ultrason. Imaging, Vol. 28, No. 3, pp. 144–158, 2006.[4] Soneson J.: A User–Friendly Software Package for HIFU Simulation. 8th International Symposium onTherapeutic Ultrasound. AIP Conference <strong>Proceedings</strong>, Vol. 1113, pp.165–169, 2009.120indicates Presenter
083 IDENTIFICATION OF NON–LINEAR MATERIAL ELASTIC PROPERTIES OF TISSUEPHANTOMS USING A REGULARIZED INVERSION METHOD.JF Dord 1 , S Goenezen 1 , AA Oberai 1 , PE Barbone 2 , TJ Hall 3 , J Jiang 3 .1 Rensselaer Polytechnic Institute, 110 8 th Street, Troy, NY, 12180, USA; 2 Boston University, 110Cummington Street, Boston, MA, 02215, USA; 3 Medical Physics Department, 1111 Highland Ave.,University of Wisconsin–Madison, Madison, WI, USA.Background: Quasistatic ultrasound elastography provides a noninvasive means to measure thedisplacement fields within deforming tissues, in vivo [1]. The measured displacement fields may then beused in an iterative inversion procedure to recover the mechanical properties of the ensonified tissues [2].This procedure has been repeatedly demonstrated to recover and quantify linear elastic contrast. Recentstudies [3] regarding the mechanical properties of tumors show that benign and malignant tissues exhibitstrong non–linear behaviors, thus providing an opportunity to evaluate elastic parameters beside linearelastic modulus.Aims: Our aim is to develop and test methodologies to reconstruct, pointwise within a region of interest,both the linear elastic shear modulus and the non–linear parameters for a model describing themechanical behavior of ensonified tissues and tissue mimicking phantoms.Methods: A finite element code that includes material and geometric nonlinearity was written andcoupled with an optimization program. By matching observed to predicted displacement fields, theparameters defining the mechanical behavior of the tissues can be recovered using a quasi–Newtonalgorithm. This method allowed us to recover both the relative linear elastic modulus and the non–linearparameter defining the tissue’s behavior. The noise and the imperfections in the displacement fields werehandled by a regularization approach. The inverse processing requires several modeling choices that weevaluated. These included boundary conditions defining the predicted displacement, the form of theregularization function and regularization parameter, and its interaction with the optimization method.These choices were evaluated with both simulated data and phantom data. Displacement data from atissue–mimicking phantom with well–characterized linear and non–linear elastic properties wasconstructed. It was imaged under continued compression up to strains of roughly 20%. Here a series offour different targets were investigated.Figure 1: Modulus and non–linear parameterfields of a non–linear tissue phantomusing displacements associated with4 compression levels.Results and Conclusions: Linear elastic reconstructions are very stable geometrically and quantitatively.The reconstructed relative linear elastic shear modulus is sensitive to even low levels (1%) of prestrain.The non–linear elastic parameter is more sensitive to noise than the linear elastic stiffness, and errors inthe linear modulus reconstruction pollute the non–linear reconstructions. Future work includesextensions to 3D, incorporating pressure and/or force data, and testing on clinical data.Acknowledgements: We acknowledge the support of NIH Grants R21CA133488 and R01CA140271.References:[1] J. Jiang and T.J. Hall: A Generalized Speckle Tracking Algorithm for Ultrasonic Strain Imaging Using DynamicProgramming. Ultrasound in Medicine and Biology, 35(11), pp. 1863–1879, 2009.[2] A. Oberai et al.: Linear and Nonlinear Elasticity Imaging of Soft Tissue In Vivo: Demonstration of Feasibility.Physics in Medicine and Biology, 54, pp. 1191–1207, 2009.[3] J.J. O'Hagan, A. Samani: Measurement of the Hyperelastic Properties of 44 Pathological Ex Vivo Breast TissueSamples. Physics in Medicine and Biology, 54, pp. 2557–2569, 2009.indicates Presenter121
088 IMPROVING CRAWLING WAVE DETECTION OF PROSTATE CANCER: PRELIMINARY INVITRO RESULTS.L An 1 , Z Hah 1 , Y Cho 1 , B Mills 1 , S Mao 1 , L Baxter 2 , L Kushner 2 , J Yao 2 , J Joseph 2 , DJ Rubens 2 ,J Strang 2 , KJ Parker 1 .1 University of Rochester, Rochester, NY, USA; 2 University of Rochester Medical Center, Rochester, NY, USA.Background: The crawling wave (CrW) technique [1] for local tissue shear velocity estimation wasrecently introduced into the sonoelastographic field. It has been applied to depict the elastic properties ofbiological tissues including radiofrequency ablated hepatic lesions in vitro [2], human skeletal muscle invitro [3] and excised human prostate [4].Aims: The objective of this study is to establish a protocol based on CrW sonoelastography to detectprostate cancer.Methods: The whole prostate gland was obtained after radical prostatectomy and embedded in a 10.5%gelatin mold. Two vibration sources were positioned at each side of the mold with an ultrasoundtransducer scanning from the top of the cross–section under observation. The gland was imaged at threepositions (apex, mid–gland and base) at three vibration frequencies (100, 120 and 140 Hz) with a smallfrequency offset between the sources. The average shear velocity estimation over three frequencies wasobtained by globally selecting and averaging the highest 90% of the data ranked by correlation coefficient.The tumor regions were then segmented using a semi–automatic region–growing segmentation technique.The sites for the three cross–sections were marked, and the corresponding histological slices wereobtained, which provided the ground truth of cancer distribution.Results: Preliminary results from one cross–section are shown in Figure 1. Separation of the shearvelocity values of the cancerous tissue and the normal tissue is indicated. The segmentation of thecancerous region was in approximately the same position as the outline of the tumor on the histologicalslice. The shear wave velocities of cancerous and non–cancerous tissues were 3.71±0.20 m/s and2.38±0.24 m/s, respectively. The elastic contrast was 1.56, similar to the ratio found in prostate cancerby mechanical testing [5].Conclusions: These preliminary results suggested the ability of the shear velocity estimator todistinguish prostate cancer from normal tissue and that the approach based on CrW sonoelastographycan be adapted to detect prostate cancer.Acknowledgements: This study was partly supported by NIH Grants 5 RO1 AG016317 and 5 RO1 AG29804.References:[1] Zhe Wu et al.: Sonoelastographic Imaging of Interference Patterns for Estimation of Shear Velocity Distribution inBiomaterials. JASA, 120(1), pp. 535–545, 2006.[2] Kenneth Hoyt et al.: Two–Dimensional Sonoelastographic Shear Velocity Imaging. UMB, 34(2), pp. 276–288, 2008.[3] Kenneth Hoyt et al.: Muscle Tissue Characterization Using Quantitative Sonoelastography: Preliminary Results.<strong>Proceedings</strong> of the IEEE Ultrasonics Symposium, pp. 365–368, 2007.[4] B Castañeda et al.: Prostate Cancer Detection Using Crawling Wave Sonoelastography. SPIE, 7265, 726513, 2009.[5] Man Zhang et al.: Congruence of Imaging Estimator and Mechanical Measurements of Viscoelastic Properties ofSoft Tissues. UMB, 33, pp. 1617–1631, 2007.Figure 1: (a) B–mode (b) shear wave velocityand (c) histological images of across–section of a human prostategland. (b) shows a region withelevated shear wave velocity to theposterior–right of the cross–sectionwhich corresponds to a cancerousregion in (c) (black outlines indicatecancer and blue outlines indicateBPH in the histological slice).Cancer (arrow in b and c) is notseen on the gray scale (a).Depth (cm)Shear Velocity02460 1 2 30Width (cm)(a) (b) (c)54321122indicates Presenter
102 VISUALIZATION OF HIFU–INDUCED LESION BOUNDARIES BY AXIAL–SHEAR STRAINELASTOGRAPHY.Arun K. Thittai 1 , Belfor Galaz 1 and Jonathan Ophir 1 .1 Diagnostic and Interventional Imaging Department, The University of Texas Medical School,Houston, TX, USA.Background: High intensity focused ultrasound (HIFU) has become a promising noninvasive technique tothermally ablate tumors lying deep in tissue. However, the extent of the thermal damage (referred to as alesion) is difficult to quantify with current B–mode imaging techniques [1]. The desire to have a unified systemfor HIFU treatment and real time lesion visualization has fueled research on several ultrasound basedmethodologies [1]. Among them, elastography was proposed as method utilizing the fact that the HIFU lesionis stiffer than surrounding tissue [2]. Although regular axial strain elastography has shown promise in HIFUlesion core visualization, there still is a need to reliably identify the lesion boundaries. Recently, axial–shearstrain elastography has been introduced as a method to visualize the boundaries of breast lesions [3]. Wehypothesize that this method may also be useful in reliable HIFU lesion boundary visualization.Aims: The aim of this study was to investigate the feasibility of reliably visualizing HIFU lesionboundaries using axial–shear strain elastograms (ASSE).Methods: HIFU–induced lesion cases used in the present work were selected from data acquired in aprevious study [2]. The samples consisted of excised canine livers with thermal lesions produced byMR–compatible HIFU system (GE Medical System, Milwaukee, WI). After thermal exposure, the sampleswere cast in a gelatin block for elastographic experiments performed using Diasonics Spectra II (Santa Clara,CA) Ultrasound scanner. In the present work, the radiofrequency (RF) data obtained earlier were reprocessedusing a multilevel coarse–to–fine 2D block–matching algorithm. The Axial Strain and Axial–Shear StrainElastograms (ASE and ASSE, respectively) were generated using a least squares strain estimator (LSQE) witha kernel size of ~4mm and staggered–strain estimation, respectively [3]. For each of the single lesion sample,the lesion boundaries were determined independently from the ASE and ASSE at various isointensity contourthresholds (from -2dB to -6dB), and the area of the enclosed lesion was computed. For samples with multiplelesions, the resulting ASSE was analyzed for identifying any unique axial–shear strain zones of interest.Results: These results show that estimation of lesion area using ASSE is less sensitive to isointensitythreshold selection, making this method more robust compared to ASE–based method. The ASE andASSE, along with segmented boundary at -2dB and -6dB contour threshold, from an example HIFU lesioncase is shown in Figure 1. A plot of the lesion size at other thresholds is provided in Figure 2. ASSE froma multiple lesion sample is shown in Figure 3. Observe that ASSE enables high–contrast visualization of a“thin” untreated region between the two lesions.Conclusions: The results demonstrate that it is feasible to reliably visualize HIFU lesion boundariesusing ASSE. Further, ASSE can visualize the presence of very thin untreated regions between multiplefully treated HIFU lesions.Acknowledgements: Data used in this study were acquired previously for projects supported by NIH Program Project grantsP01–CA64597 and P01–EB02105–13. The current work was supported by NIH grant R21–CA135580. The authors would like tothank the authors of the previous study [2] who acquired and archived the data that is used in the present study.References:[1] Zheng X, Vaezy S: An Acoustic Backscatter–Based Method for Localization of Lesions Induced By High–IntensityFocused Ultrasound. Ultras. Med Biol, 36(4), pp. 610–22, <strong>2010</strong>.[2] Righetti R, Kallel F, Stafford RJ, Price RE, Krouskop TA, Hazle JD and Ophir J: Elastographic Characterization ofHIFU–Induced Lesions in Canine Livers. Ultras. Med Biol, 25(7), pp. 1099–1113, 1999.[3] Thitai Kumar A, Krouskop TA, Garra BS and Ophir J: Visualization of Bonding at an Inclusion Boundary usingAxial–Shear Strain Elastography: A Feasibility Study. Phys Med Biol, 52, pp. 2615–33, 2007.(a) (b) (c)(a)(b)Figure 1: (a) ASE, (b) ASSE and (c) sonogram of a HIFU–induced lesion. The isointensity contour lines areoverlaid on the elastograms for the threshold values; -2dB (-) and -6dB (--).Figure 2: The HIFU–induced lesionarea estimate from ASE ()and from ASSE ().Figure 3: ASE (a) and ASSE (b) of a pairof adjacent HIFU lesions.Observe the presence of high–contrast axial–shear strainzones exactly at the boundarybetween the two lesions.indicates Presenter123
108 EFFECT OF LOW–FREQUENCY ULTRASOUND MODULATION ON THE ACOUSTIC RADIATIONFORCE IN FLUIDS AND SOFT TISSUES.Egor V. Dontsov 1 , Bojan B. Guzina 1 .1 Civil Engineering Department, University of Minnesota, 500 Pillsbury Drive SE, Minneapolis, MN55455, USA.Background: Since the nineteenth century, the propagation of high–intensity, time–harmonic soundwaves in a fluid has been known to give rise to aperiodic motion [1]. For small Mach numbers, theproblem for the mean acoustic quantities can be formulated in terms of time–averaged balance equations,featuring an effective body–force term, the so–called acoustic radiation force (ARF) [2]. Such apparentbody force stems from the averaging of quadratic terms in the balance of linear momentum andrepresents the influence of high–intensity sound in the averaged equations.Aims: The purpose of this study is to investigate the generation of the ARF in soft tissues in situations whenthe amplitude of high–intensity sound field (MHz) is modulated using frequencies (kHz) that are, relative tothe frequency of sound, on the order of the Mach number (10-3). This configuration, which is frequentlydeployed by emerging biomedical imaging technologies [3,4], turns out to be unresponsive to the usual(small–Mach–number) asymptotic simplification via the concept of the ARF owing to the fact that the meanacoustic fields, computed as averages over the period of sound vibrations, retain the rapid oscillationfeatures of the latter.Methods: To deal with the problem, an asymptotic treatment is pursued via a scaling approach that splitsthe temporal variable into “fast” and “slow” time, permitting one to track the contribution of (time–harmonic)sound and its modulation separately in the solution.Results: With the use of time–splitting method, the second–order asymptotic solution, written in terms of the“fast” time averages of acoustic fields, is shown to: 1) be free of rapid oscillations and 2) permit compactformulation in terms of initial–boundary value problem featuring the ARF that, for the first time, rigorouslycaptures the effect of sound modulation. Recognizing the differences between the Eulerian and Lagrangianmean motion, the formulation is developed for both types of averages. To both expose the essence of themethod and cater for practical applications, the analysis is presented for two canonical configurations: (1) theplane wave case where the soft tissue is approximated by a Newtonian fluid and (2) the quasi–plane wave (i.e.narrow ultrasound beam) case, where the response of a tissue is modeled by a nonlinear thermo–viscoelasticmodel. The results show that the induced mean motion is, for the plane–wave problem, of oscillatory ratherthan streaming nature, and that it varies at a rate commensurate with that of the prescribed modulationenvelope. On developing a finite difference solution to the original nonlinear plane wave problem, it is furthershown that the featured “fast” time average can be computed as a double “ordinary” time average of thesimulated nonlinear response. The proposed framework of analysis is illustrated by the analytical solution fora sinusoidal modulation envelope with quiescent past, which both exposes the limitations of earlier treatmentsand highlights the generation of an ARF in a lossless fluid when a modulated, high–intensity sound field ispropagated through it. In the second example, dealing with a narrow ultrasound beam, the analyticaltreatment for sinusoidal modulation envelope similarly demonstrates the effectiveness of the proposed scalingscheme toward computing the induced ARF and associated shear–wave motion in a soft tissue.Conclusions: The study establishes a rigorous treatment of the ARF in situations when the amplitude ofthe ultrasound is modulated with the frequencies that are, relative to the frequency of sound, on the orderof the Mach number. The proposed approach, which uses a time–splitting method to deal with themodulated ultrasound problem, is verified through a comparison with a finite–difference solution for theplane–wave problem.Acknowledgements: The support provided by the Minnesota Partnership for Biotechnology and Medical Genomicsduring a portion of this study is kindly acknowledged.References:[1] L. Rayleigh, On the Circulation of Air Observed in Kundt’s Tubes, and on Some Allied Acoustical Problems. Phil.Trans. Roy. Soc. Lond., 175, pp. 1–21, 1884.[2] O. Rudenko and S. Soluyan: Theoretical Foundations of Nonlinear Acoustics. Plenum, New York, 1977.[3] A.P. Sarvazyan, O.V. Rudenko, S.D. Swanson, J.B. Fowlkes and S.Y. Emelianov: Shear wave Elasticity Imaging: ANew Ultrasonic Technology of Medical Diagnostics. Ultrasound Med. Biol., 24(9), pp. 1419–1435, 1998.[4] B.B Guzina, K. Tuleubekov, D. Liu and E. Ebbini: Viscoelastic Characterization of Thin Tissues using AcousticRadiation Force and Model–Based Inversion. Phys. Med. Biol., 54, pp. 4089–4112, 2009.124indicates Presenter
Session SIP–2: Signal and Image Processing – IITuesday, October 19 4:00P – 5:30P086 GPU UTILIZATION FOR FAST 3D MOTION TRACKING ALGORITHMS.Ted G. Fisher 1 , Timothy J. Hall 1 .1 School of Medicine and Public Health, University of Wisconsin–Madison, Madison, WI, USA.Background: 2D real time motion tracking algorithms have been implemented on commercial ultrasoundscanners [1]. 3D motion tracking has also been demonstrated [2], but the methods employed have notresulted in real time volume tracking.Aims: To create a fast 3D motion tracking algorithm with dense displacement estimates for real timemotion tracking of 3D radiofrequency (RF) data.Methods: Using CUDA (Nvidia, Santa Clara, CA, USA), we are able access the memory and computingpower of the CUDA–enabled GPU. With this, we are able to run thousands of threads executingconcurrently in order to do massively parallel computations. Motion tracking is accomplished in threesteps. The initial step creates a cost function that uses the normalized cross–correlation as well as a motioncontinuity constraint as in [3]. The cost function is minimized, and the best path is determined from theViterbi algorithm. Displacement estimates are found for a grid of 16 lateral by 32 axial data points from anoriginal RF size of 256 lateral by 1024 axial points. The 16 lines are independent of each other, and a blockof threads is assigned to each line. Within each block, a thread is assigned to a different displacement state.A search region of 8 lateral by 32 axial points is used for a total of 256 states. Each thread calculates thecost to be in its particular state, and that cost is made accessible to the other threads in the block throughshared memory. In the second step, these coarsely gridded displacements are then utilized as the initialestimates for a finer motion tracking method. Sum squared difference (SSD) is used as a similarity measurein this second step. Using overlapping kernels and a rolling window technique, threads calculate differentparts of the SSD kernels and communicate these partial calculations to other threads through sharedmemory much like in [3]. The result is a very dense displacement field that has nominally the samedimensions as the original RF data (except for the edges where we run out of data). By using the estimateddisplacements obtained from the Viterbi algorithm, we are able to drastically shrink our search region (andtherefore the number of computations) to ±2 axial, ±1 lateral, and ±1 elevation samples for this second stepof tracking which avoids peak hopping artifacts in the final displacement field. In the third step, motion istracked in the adjacent plane of RF data using a quality guided method. The densely populateddisplacement estimates are broken into a 16 by 32 grid. The displacement (lateral and axial) that had thelowest SSD (highest quality) is then used as the initial estimate for the displacement in the adjacent plane.The second and third steps are then used for the remaining planes in the volume. The displacement data,already on the GPU, can be directly visualized by mapping to an OpenGL buffer.Results: Using a GTX 480 GPU, it takes, on average, 53ms to find the best path with the Viterbi algorithmon a 16 x 32 grid of axial and lateral displacements. Subsequent tracking and visualization on a 1024 x 256x 64 (axial, lateral and elevation, respectively) volume of simulated RF data under a 3% uni–axialdeformation is accomplished at 67fps or 17.5Mpixels/s. When tracking motion from a single inclusionphantom, we found that using a ±3–sample axial search was necessary to track motion, suggesting that alarger initial grid may be required for tracking. With this larger search region, the frame rate is 50fps.Conclusions: Desktop based 3D GPU motion tracking can be performed at fast rates. These algorithmscan be further optimized for improved efficiency. Current limitations include the necessity of someparameters to be multiples of 2.Acknowledgements: We gratefully acknowledge the support from NIH grants T32–009206 and R21CA133488.References:[1] Zhu Y, Hall TJ: A Modified Block Matching Method for Real–Time Freehand Strain Imaging. Ultrasonic Imaging,24, pp. 161–76, 2002.[2] Fisher TG, Hall TJ, Panda S, Richards MS, Barbone PE, Jiang J, Resnick J, Barnes S: Volumetric ElasticityImaging with a 2-D CMUT Array. Ultrasound in Medicine and Biology, 36, pp. 978–90, <strong>2010</strong>.[3] Jiang J, Hall TJ: A Generalized Speckle Tracking Algorithm for Ultrasonic Strain Imaging using DynamicProgramming. Ultrasound in Medicine and Biology, 35, pp. 1863–79, 2009.[3] Gallup D, Frahm J–M, Stam, J: Real–Time Local Stereo using CUDA. <strong>Proceedings</strong> of Nvidia GPU TechnologyConference Research Summit, 2009.indicates Presenter125
017 SUBSAMPLE DISPLACEMENT INTERPOLATION USING WINDOWED–SINC RECONSTRUCTIONWITH NUMERICAL OPTIMIZATION.Matthew M. McCormick 1 , Tomy Varghese 1 .1 Medical Physics, University of Wisconsin–Madison, 1111 Highland Ave, Madison, WI, USA.Background: Subsample interpolation of the similarity metric is key to strain estimation accuracy inultrasound elastography. The local maximum must be found precisely or quantization errors willdominate with discrete signals. Cespedes et al. [1] examined sub–sampling strategies including cosineand parabolic interpolation, which are still commonly utilized today, along with windowed–sincreconstruction methods. Windowed–sinc interpolation delivered better performance because it does notsuffer from bias artifacts.Aims: We expand on the approach proposed by Cespedes et al. [1] by examining two–dimensionalwindowed–sinc interpolation. Cespedes et al. [1] suggested the use of a binary search algorithm to findthe peak with logarithmic convergence. We examine multi–dimensional numerical optimizationtechniques for making the algorithm computationally feasible. Axial and lateral displacements areestimated, but only axial displacements are used to calculate the SNRe.Methods: The strain signal–to–noise ratio (SNRe) is quantified after applying normalized cross–correlationblock–matching with parabolic interpolation, cosine interpolation or windowed–sinc interpolation withnumerical optimization. A Welch window is applied for sinc interpolation. A uniform tissue–mimickingultrasound phantom with fully developed speckle is compressed to 1% strain and imaged with theSiemens S2000 VF9–4 transducer. Statistics on the axial strain are determined with n=14 samples of thescattering pre– and post–deformation echo signals. Optimization with the Nelder–Mead simplex (amoeba)algorithm is compared with a regular–step gradient descent approach. The number of samples in the sincwindow was the same in all directions.Results: Figure 1 demonstrates that windowed–sinc reconstruction performs better than parabolic orcosine interpolation as expected. Figure 2 shows that a sinc window length beyond 9 displacementsamples (2.0 axial center frequency wavelengths) does not yield statistically significant improvement inSNRe for this data. The Nelder–Mead method is more efficient than gradient based algorithms because itavoids direct computation of the cost function’s derivative, which must be determined numerically ateach iteration. The mean and standard deviation of the mean optimization times for the amoeba andgradient descent methods are 234±19 µs and 707±59 µs respectively with p
090 ULTRASOUND ELASTICITY IMAGING USING THE CURL OF THE DISPLACEMENT.Ali Baghani 1 , Reza Zahiri Azar 1 , Septimiu E. Salcudean 1 , Robert Rohling 1 .1 University of British Columbia, Vancouver, BC, CANADA.Background: When tissue is excited, both shear and dilatational waves propagate inside it. Most dynamicelastography methods track the shear waves to measure tissue elasticity. However, the dilatationalcomponent of the displacement can introduce bias and artifacts in the estimated elasticities [1]. Takingthe curl of the displacement suppresses the dilatational component, and leaves the purely shearcomponent of the displacement. The use of the curl of the displacement in elastography has lead to moreaccurate elasticity estimation in magnetic resonance elastography (MRE) [2].Aims: To develop an ultrasound elastography system capable of using the curl of the displacement toestimate the tissue elasticity.Methods: To maintain the acquisition time at a minimum, only the elevational component of the curl ωzwas estimated. The component ωz depends only on the axial uy and lateral ux components of thedisplacement and satisfies a shear wave equation with density ρ and the shear modulus μ:u u22 2 2x yz ; z 22 2 2 zyxt xyzThe axial and lateral components of the displacement were estimated by angularly compounding themotion vectors acquired with different beam directions. To be able to estimate the variation in the z–direction, a 3D probe was used (4DL14–5/38, Ultrasonix Co, Richmond, BC, Canada). Our previouslydeveloped high frame rate system [3,4] was extended to acquire in–phase axial and lateral displacementsover a volume of interest. Direct inversion was used to estimate the shear modulus. Custom code wasdeveloped to implement the system on a Sonix RP machine (Ultrasonix Co, Richmond, BC, Canada). Thesystem was used to image a commercial elasticity phantom (Model 049, CIRS Inc., Norfolk, VA, USA)which has spherical soft and hard inclusions of different radii and elasticity values. The elasticity of thebackground material is reported to be 29 kPa.Results: Figure 1 shows the elastograms obtained for one of the hard inclusions, 1a–1d, and one of thesoft inclusions, 1e–1h. As can be seen, the system can recover both inclusions with reasonable contrast.Conclusions: The curl–based inversion techniques can be used in the context of ultrasoundelastography. We have shown that with proper sequencing, a conventional ultrasound system is capableof acquiring data suitable for computing the curl of the displacement. Consistent results have beenobtained on a commercial elasticity phantom. Studying the performance of the method on real tissue datais the next step in the future of this research.Acknowledgements: This research was supported by Natural Sciences and Engineering Research Council (NSERC).References:[1] A. Baghani, S.E. Salcudean, R. Rohling: Theoretical Limitations of the Elastic Wave Equation Inversion for TissueElastography. J. Acoust. Soc. Am., 126(3), pp. 1541–51, 2009.[2] R Sinkus, et al.: Viscoelastic Shear Properties of In Vivo Breast Lesions Measured by MR Elastography. MagneticResonance Imaging, 23, pp. 159–165, 2005.[3] A. Baghani, et al.: A High Frame Rate Ultrasound System for the Study of Tissue Motions. IEEE UFFC, in press.[4] R. Zahiri–Azar, A. Baghani, S.E. Salcudean, R. Rohling: 2D High Frame Rate Dynamic Elastography using DelayCompensated and Angularly Compounded Motion Vectors: Preliminary Results. IEEE UFFC, in press.(a) (b) (c) (d)(e) (f) (g) (h)Figure 1: Elastograms of different cross sections of (a–d) a hard 54 kPa inclusion, (e–h) a soft 7 kPa inclusion.indicates Presenter127
041 DISPLACEMENT ESTIMATION OF THE CAROTID ARTERY USING SYNTHETIC APERTUREIMAGING.S. Korukonda 1,2 , M. M. Doyley 1,2 .1 Electrical and Computer Engineering Department, 2 Rochester Centre for Biomedical Ultrasound,University of Rochester, Rochester, NY, 14627 USA.Background and Aims: Plaques can be classified as being either stable or unstable based on theirmechanical properties. Ultrasound elastography [1] can provide relative estimates of shear moduluswithin the carotid artery based on strain elastograms. We report the results of our studies to assess theutility of synthetic aperture (SA) method for elastographic imaging of the carotid artery.Methods: We constructed a mechanical model of a cross–section of a carotid artery (outer and inner radiiof 4mm and 1.5mm, respectively) containing a soft plaque. The simulated artery contained three regions,as illustrated in Figure 1: a normal vessel wall, a lipid pool and a thin fibrous cap. We assigned a Young’smodulus value of 1000kPa, 25kPa, and 1250kPa to the normal vessel wall, the lipid pool and the fibrouscap, respectively. Additionally, all regions were assumed to be nearly incompressible (i.e., we assigned aPoisson’s ratio of 0.495 to all regions). We computed the internal tissue displacements by solving theforward elasticity problem using a commercially available finite element code, Abacus/CAE TM with anintraluminal pressure difference of 5mmHg. We generated synthetic aperture scans with a 128 elementlinear array (centre frequency 5MHz and sampled at 40MHz) simulated using Field II [2]. Wereconstructed SA images by numerically adding coherent wave fronts at each location within the image.We estimated the internal tissue displacements by performing cross–correlation analysis on thesimulated radiofrequency (RF) echo frames obtained at different intraluminal pressures. To assess theperformance of the proposed method under realistic experimental conditions, we conducted experimentson elastographically homogeneous and inhomogeneous gelatin–based vessel phantoms. All echo imagingwas performed using a SONIX RP ultrasonic imaging system (Ultrasonix, Richmond, BC, Canada) thatwas equipped with L14–5/38 128 element linear transducer array, and the vessel was pressured using asimple water column system.Results: It apparent from the simulation results (i.e., Figure 2) that cross–correlation analysis ofsynthetic aperture data provides good estimates of both the axial and lateral displacements within thesimulated carotid artery. We obtained over a 3x reduction in the RMS error when compared to lateralestimates obtained from conventional linear array simulation data. We made similar observations in ourexperimental studies with synthetic aperture data.Conclusions: Synthetic aperture imaging is a promising technique to produce high–resolutionelastograms of the carotid. As the carotid is a surface vessel, it does not suffer from the depth ofpenetration and low SNR issues that SA imaging is susceptible to. As part of future work, we willimplement this acquisition in real time without incurring motion artifacts.(a) (b) (c) (d)Figure 1: Stiffness model ofthe carotid arterywith a soft plaque.Figure 2: Displacement estimates from simulation (in mm): Axial (a) True,(b) Estimated; Lateral (c) True, (d) Estimated.References:[1] J. Fromageau, et al.: Noninvasive Vascular Ultrasound Elastography Applied to the Characterization ofExperimental Aneurysms and Follow–Up after Endovascular Repair. Phys Med Biol, Vol. 53, No, 22, Nov 2008.[2] J.A. Jensen, et al.: Calculation of Pressure Fields from Arbitrarily Shaped, Apodized and Excited UltrasoundTransducers. IEEE Trans on Ultrasonics Ferroelectrics and Frequency Control, Vol. 39, No. 2, Mar 1992.128indicates Presenter
105 ROBUST REAL TIME REGULARIZED ULTRASOUND ELASTOGRAPHY.H Rivaz 1 , EM Boctor 1 , GD Hager 1 .1 Johns Hopkins University, Baltimore, MD, USA.Introduction: Displacement estimation is an essential step for ultrasound elastography. This abstractproposes a new robust technique for motion estimation.Background: Global and local decorrelation between the pre– and post–compression ultrasound imagescompromises the quality of the elasticity images. The main sources of global decorrelation in freehandpalpation elastography are change of speckle appearance due to scatterer motion and out–of–planemotion due to the probe. Examples of local decorrelation are: (1) a decrease in the ultrasonic signal–to–noise ratio with depth; (2) low correlation close to arteries due to complex motion and inside blood vesselsdue to blood motion; (3) extremely low correlation in lesions that contain liquid due to the incoherentfluid motion; and (4) out–of–plane motion of movable structures within the image.Aims: This abstract introduces a novel real time elastography technique based on analytic minimization(AM) of a regularized cost function. The cost function incorporates similarity of radiofrequency (RF) dataintensity and displacement continuity, making the AM methods robust to small decorrelations presentthroughout the image. The method produces dense 2D (i.e. axial and lateral) strain images where the sizeof the strain image is the same as the size of the RF data. We also exploit techniques from robuststatistics to make the methods resistant to large local decorrelations. Simulation and phantomexperiments show that the method generates strain images with high SNR, CNR and resolution forstrains as high as 10% and run in real time. An implementation of the 2D AM method as well as phantomand clinical RF data can be downloaded from http://www.cs.jhu.edu/~rivaz/UltrasoundElastography/.Methods: Dynamic Programming (DP) [2] is first used to find the 2D displacement map of an RF line [2].The displacement is then used as an initial estimate for optimization of the cost function C(a1 … am) = CD+ CR where a1 … am are the axial displacements of samples 1..m for the entire RF data (i.e. thedisplacement of all the samples in an RF–line is calculated simultaneously), CD and CR are respectivelythe data term and the regularization term. Details of CD and CR can be found in [3]. Using first orderTaylor expansion, C can be made quadratic with respect to a. Therefore, a can be simply found bycalculating the partial derivative of C with respect to a and setting it to zero. This results in a sparselinear system that can be solved in real time.Results: Field II and ABAQUS (Providence, RI) software are used for ultrasound simulation and for finiteelement simulation. Many scatterers are distributed in a volume, and an ultrasound image is created byconvolving all scatterers with the point spread function of the ultrasound and adding the results usingsuperposition. The phantom is then meshed and compressed using finite element simulation, giving the3D displacement of each node of the mesh. The displacement and strain fields are then calculated usingthe AM method and are compared with the ground truth. The unitless metric signal–to–noise ratio (SNR)and contrast–to–noise ratio (CNR) are also calculated to evaluate the performance of the method.Phantom experiments are also performed using a Siemens Antares system. Figure 1 shows the results.References:[1] Ophir J, Alam S, Garra B, Kallel F, Konofagou E, Krouskop T, Varghese T: Elastography: Ultrasonic Estimationand Imaging of the Elastic Properties of Tissues. Journal of Engineering in Medicine, pp. 203–233, 1999.[2] Rivaz H, Boctor E, Foroughi P, Zellars R, Fichtinger G, Hager G: Ultrasound Elastography: A DynamicProgramming Approach. IEEE Trans. Medical Imaging, pp 1373–1377, 2008.[3] Rivaz H, Boctor E, Choti M, Hager G: Real–Time Regularized Elastography. IEEE Trans. Med. Imaging (in press).Acknowledgements: H. Rivaz is funded by a DoD Predoctoral award and by a fellowship from the Link Foundation.(a) Simulation Phantom (b) Finite Element Mesh (c) Finite Element Strain (d) CNR (e) Axial Strain (f) Lateral Displacement (mm) (g) Lateral StrainFigure 1: (a) to (d) show the simulation results; (e) to (g) show the experimental results on a tissue–mimicking breast phantom.indicates Presenter129
010 A METHOD FOR AUTOMATIC PROSTATE SEGMENTATION USING COMBINED ULTRASOUNDB–MODE AND ELASTOGRAPHY IMAGES.S. Sara Mahdavi 1 , Mehdi Moradi 1 , William J. Morris 2 , Septimiu E. Salcudean 1 .1 Electrical and Computer Engineering Department, University of British Columbia, Vancouver, BC,CANADA; 2 Vancouver Cancer Center, British Columbia Cancer Agency, Vancouver, BC, CANADA.Background: The reliable segmentation of the prostate gland is an important step in prostateinterventions. Manual segmentation is time consuming and is highly user dependent due to the lowsignal to noise ratio of ultrasound images. An automatic segmentation algorithm would save time,eliminate user variability and be usable for intra–operative image guidance for procedures such asbrachytherapy. Although various 2D and some 3D prostate segmentation methods have been proposed inthe literature, there are remaining challenges such as user initialization and limited accuracy, especiallyat the base and apex, where prostate visibility in B–mode images can be very poor. It is known that theprostate is stiffer than the tissue around it.Aims: To develop an automatic prostate segmentation method that makes use of elastography images.Methods: We acquired B–mode and elastography images from patients undergoing low dose ratebrachytherapy. Radio frequency (RF) data and B–mode images were simultaneously collected intra–operativelyusing the system and processing method described in [1] to obtain transverse elastography images. An ActiveShape Model (ASM) [2] is used to parameterize the surface shape. A training set is constructed usingmanually delineated prostate boundary points from which the modes of variation of the prostate shape areextracted. The ASM deformation is driven by a gray level similarity measure and by a novel edge continuitymeasure from both B–mode and elastography images. The gray level similarity is the similarity between theedge intensity profiles of edge points with that of equivalent edge points in the training set. Its value is affectedby image noise. The edge continuity measure reduces the effect of noise or speckle by giving a higher score toa detected edge which extends within a neighborhood. This method was used to automate our B–modesemi–automatic 3D segmentation algorithm [3] by replacing the manual initialization.Results: The mean absolute distance between automatic and manual contours of 107 images from7 patients is 3.4±1.8mm when gray level similarity in elastography images is used. This reduces to2.6±0.9mm, when elastography gray level similarity plus B–mode and elastography edge continuity isused (Figure 1a). The segmentation duration is 17.9±12.2s, and there was no manual intervention. Forthe 3D segmentation example (Figure 1b) a volume error (volume of non–overlapping region betweenmanual and automatic prostate surfaces, divided by the sum of volumes) of 7.2% is acquired.Conclusions: We outlined a novel, fast and automatic 2D method of prostate segmentation thatcombines ultrasound elastography with B–mode images. Compared to manual contours the error is low,and results show that this method is very promising for automatic 3D segmentation of the prostate.Acknowledgements: This project was funded by NSERC Canada (Discovery Grant and Postdoctoral Fellowship).Data collection was funded by NIH grant R21 CA120232–01.References:[1] Mahdavi, SS, Moradi, M, Wen, X, Morris, WJ, Salcudean, SE: Vibro–Elastography for Visualization of the ProstateRegion: Method Evaluation. MICCAI LNCS 5792(Pt2), pp. 339–347, 2009.[2] Cootes, T, et al: Active Shape Models-Their Training and Application. Comput. Vis. Image Underst., 61, pp. 38–59,1995.[3] Mahdavi, SS, Morris, WJ, Spadinger, I, Chng, N, Goksel, O, Salcudean, SE: 3D Prostate Segmentation inUltrasound Images Based on Tapered and Deformed Ellipsoids. MICCAI LNCS 5792(Pt 2), pp. 960-967, 2009.(a) (i) (ii) (b)Figure 1: (a) An example of 2D segmentation using elastography gray level similarity only (yellow dashed)vs. elastography gray level similarity plus B–mode and elastography edge continuity (red bold)shown in both B–mode (i) and elastography (ii) images (manual contour in blue/white dotted).(b) Automatic (blue) vs. manual (from B–mode) (red) 3D surface of the prostate.130indicates Presenter
Snowbird Village Map131
132Cliff Lodge Conference Center Floor Plan
Please Fill Out Both SidesConference Evaluation and QuestionnaireOVERALL CONFERENCEPoor Mid ExcellentOverall Conference Evaluation 1 2 3 4 5General comments:SCIENTIFIC PROGRAMPoor Mid ExcellentQuality of the Presentations 1 2 3 4 5Relevance of Presentations to the Conference’s Theme 1 2 3 4 5Time Allotted for Presentations 1 2 3 4 5Time Allotted for Discussion 1 2 3 4 5Poster Session 1 2 3 4 5Tutorials 1 2 3 4 5Equipment Exhibit 1 2 3 4 5Student Participation 1 2 3 4 5Additional comments:CONFERENCE MATERIALSPoor Mid ExcellentPrinted <strong>Proceedings</strong> Book 1 2 3 4 5CD <strong>Proceedings</strong> 1 2 3 4 5Other Registration Materials 1 2 3 4 5Additional comments:CONFERENCE FACILITIES & SOCIAL PROGRAMPoor Mid ExcellentLecture Hall 1 2 3 4 5Registration Desk 1 2 3 4 5Meals: Dining facilities 1 2 3 4 5Conference Breakfasts and Lunches 1 2 3 4 5Conference Dinner and Concert 1 2 3 4 5Coffee Breaks 1 2 3 4 5Opening Dinner Reception 1 2 3 4 5Closing Pizza Party 1 2 3 4 5Audio–Visual: Screen Visibility 1 2 3 4 5Sound Level 1 2 3 4 5Presentation Transition 1 2 3 4 5Wireless Internet Connectivity: 1 2 3 4 5Additional comments:133
Please Fill Out Both SidesConference Evaluation and QuestionnaireVENUE AND HOTELPoor Mid ExcellentVenue – Snowbird, Utah and Environs 1 2 3 4 5Would you return to this city? Yes Perhaps NoArea Attractions 1 2 3 4 5Hotel: Overall 1 2 3 4 5Reservations 1 2 3 4 5Transportation and Accessibility 1 2 3 4 5Reception and Check–In 1 2 3 4 5Accommodations 1 2 3 4 5Facilities 1 2 3 4 5Parking 1 2 3 4 5Would you return to this hotel? Yes Perhaps NoAdditional comments:CONFERENCE ADMINISTRATIONPoor Mid ExcellentWebsite 1 2 3 4 5Registration off–site 1 2 3 4 5Registration on–site 1 2 3 4 5Administrative staff 1 2 3 4 5Correspondence 1 2 3 4 5Additional comments:GENERAL INFORMATIONI am a Returning Delegate Yes NoI plan to attend the next conference Yes Perhaps Noand present a paper(s) / poster(s) Yes Perhaps NoOther(s) from my lab would attend the next conference Yes Perhaps Noand he/she / they would present a paper(s) / poster(s) Yes Perhaps NoHow did you learn of this conference? (Check all that apply) Email Announcement Internet Website Other ColleagueTutorial Topic Suggestions for next year:Additional Comments:If you would be willing to host the Conference in your city, please give your name to the Conference Staff.Questions or comments are welcome at any time at Thank You!134