Discrete Math Chapter 14 Descriptive Statistics 14.2 Exercise 1 ...
Discrete Math Chapter 14 Descriptive Statistics 14.2 Exercise 1 ...
Discrete Math Chapter 14 Descriptive Statistics 14.2 Exercise 1 ...

You also want an ePaper? Increase the reach of your titles
YUMPU automatically turns print PDFs into web optimized ePapers that Google loves.
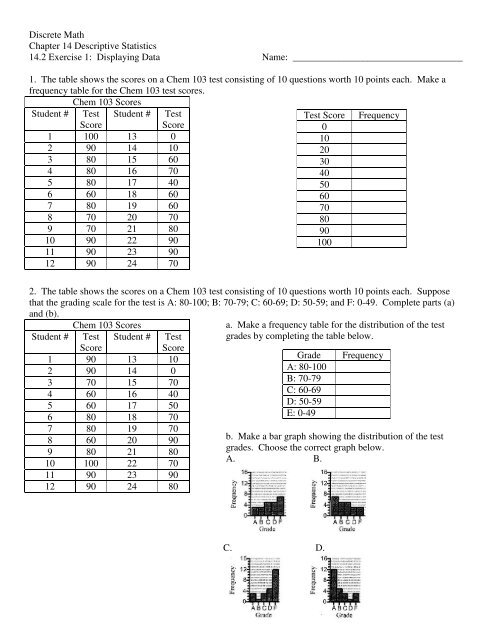
<strong>Discrete</strong> <strong>Math</strong><strong>Chapter</strong> <strong>14</strong> <strong>Descriptive</strong> <strong>Statistics</strong><strong>14</strong>.2 <strong>Exercise</strong> 1: Displaying Data Name: ___________________________________1. The table shows the scores on a Chem 103 test consisting of 10 questions worth 10 points each. Make afrequency table for the Chem 103 test scores.Chem 103 ScoresStudent # Test Student # TestTest Score FrequencyScoreScore01 100 13 0102 90 <strong>14</strong> 10203 80 15 60304 80 16 70405 80 17 40506 60 18 60607 80 19 60708 70 20 70809 70 21 809010 90 22 9010011 90 23 9012 90 24 702. The table shows the scores on a Chem 103 test consisting of 10 questions worth 10 points each. Supposethat the grading scale for the test is A: 80-100; B: 70-79; C: 60-69; D: 50-59; and F: 0-49. Complete parts (a)and (b).Chem 103 ScoresStudent # TestScoreStudent #1 90 13 102 90 <strong>14</strong> 03 70 15 704 60 16 405 60 17 506 80 18 707 80 19 708 60 20 909 80 21 8010 100 22 7011 90 23 9012 90 24 80TestScorea. Make a frequency table for the distribution of the testgrades by completing the table below.GradeA: 80-100B: 70-79C: 60-69D: 50-59E: 0-49Frequencyb. Make a bar graph showing the distribution of the testgrades. Choose the correct graph below.A. B.C. D.
3. Use the data in the grade-distribution table below to construct a pie chart showing the distribution of gradetypes in a class.Grade A B C D FChoose the correct pie chart.Frequency 3 7 11 2 <strong>14</strong>. The bar graph describes the scores of a group of students on a 10-point math quiz. Complete parts (a)through (c) to the right.a. How many students took the math quiz?b. What percentage of the students scored 2 points?c. If a grade of 6 or more was needed to pass the quiz, what percentage of thestudents passed?5. Use the pie chart to complete parts (a) through (c).a. Is cause of death a quantitative or qualitative variable?b. Based on the data provided in the pie chart, estimate thenumber of 18- to 22-year-olds who died in the populationstudied due to an accident. (Round to the nearest wholenumber)c. Estimate the size of the central angle of the slicerepresenting the category “Other”. (Round to the nearest degree)6. The pie chart represents the breakdown of the $2.9 trillion federal budget of a country’s last fiscal year.Note: $1 trillion = $1,000 billion. Use the pie chart tocomplete parts (a) and (b).a. Estimate how much money the federal government spenton last year’s defense. (Round to the nearest billion)b. Calculate the size of the central angle for each slice of thepie chart. (Round to the nearest degree)CategoryCentral AngleDefenseSocial SecurityMedicare and MedicaidInterest on the public debtOther