The Incidence and Prevalence of Spinal Cord Injury in Canada
The Incidence and Prevalence of Spinal Cord Injury in Canada
The Incidence and Prevalence of Spinal Cord Injury in Canada

Create successful ePaper yourself
Turn your PDF publications into a flip-book with our unique Google optimized e-Paper software.
<strong>The</strong> <strong>Incidence</strong> <strong>and</strong> <strong>Prevalence</strong> <strong>of</strong><strong>Sp<strong>in</strong>al</strong> <strong>Cord</strong> <strong>Injury</strong> <strong>in</strong> <strong>Canada</strong>Overview <strong>and</strong> estimates based on current evidenceA jo<strong>in</strong>t publication <strong>of</strong><strong>and</strong>URBAN FUTURESS t r a t e g i c R e s e a r c h t o M a n a g e C h a n g e
<strong>The</strong> <strong>Incidence</strong> <strong>and</strong> <strong>Prevalence</strong> <strong>of</strong><strong>Sp<strong>in</strong>al</strong> <strong>Cord</strong> <strong>Injury</strong> <strong>in</strong> <strong>Canada</strong>Overview <strong>and</strong> estimates based on current evidenceProject Co-ord<strong>in</strong>ator:Angela Farry, Rick Hansen InstituteReport Authors:Angela Farry, Rick Hansen InstituteDavid Baxter, Urban Futures InstituteProject Contributors:<strong>The</strong> authors wish to thank all <strong>of</strong> those who generously shared their knowledge <strong>of</strong>,<strong>and</strong> <strong>in</strong>sights <strong>in</strong>to, the many dimensions <strong>of</strong> sp<strong>in</strong>al cord <strong>in</strong>jury <strong>in</strong> <strong>Canada</strong>, <strong>in</strong>clud<strong>in</strong>g:David Cassidy, PhD, DrMedSc;Marcel Dvorak, MD;Michael Fehl<strong>in</strong>gs, MD, PhD;Matthew F<strong>in</strong>gas, MSc;Hans Krueger, PhD;Vanessa Noonan, PhD;Anoushka S<strong>in</strong>gh, PhD; <strong>and</strong>Lesley Soril, MScHav<strong>in</strong>g acknowledged these valuable contributors,the authors rema<strong>in</strong> fully <strong>and</strong> solely responsiblefor the report <strong>and</strong> its contents.Please address comments <strong>and</strong> correspondence concern<strong>in</strong>g this report to<strong>in</strong>fo@rickhansen<strong>in</strong>stitute.org, with “<strong>Incidence</strong> <strong>and</strong> <strong>Prevalence</strong> Report” <strong>in</strong> the subject l<strong>in</strong>e.December 2010This report may be reproduced <strong>in</strong> whole or <strong>in</strong> part with appropriate acknowledgement <strong>of</strong> the source.
URBAN FUTURESS t r a t e g i c R e s e a r c h t o M a n a g e C h a n g eTable <strong>of</strong> ContentsExecutive SummaryiiiI. Term<strong>in</strong>ology 1II. Relevance <strong>of</strong> Measur<strong>in</strong>g the <strong>Incidence</strong> <strong>and</strong> <strong>Prevalence</strong> <strong>of</strong> SCI 4III. <strong>The</strong> Current State <strong>of</strong> Knowledge Concern<strong>in</strong>g the <strong>Incidence</strong> <strong>and</strong> 6A. Summary <strong>of</strong> Articles <strong>and</strong> Implied Canadian <strong>Prevalence</strong> 6B. Implications for Measurement <strong>in</strong> <strong>Canada</strong> 10IV. Estimates <strong>of</strong> <strong>Incidence</strong> <strong>and</strong> <strong>Prevalence</strong> Based on Best-Available Evidence 12A. Estimate <strong>of</strong> Initial <strong>and</strong> Discharge <strong>Incidence</strong> 12B. Estimate <strong>of</strong> <strong>Prevalence</strong> 17V. Conclusions <strong>and</strong> Next Steps 22A. Summary 22B. Next Steps 23Appendix I: Summaries <strong>of</strong> Reviewed Articles Concern<strong>in</strong>g SCI 26Appendix II: Comparison <strong>of</strong> ICD Codes Used In SCI Research 35Appendix III: Prelim<strong>in</strong>ary Estimates <strong>of</strong> <strong>Prevalence</strong> <strong>of</strong> <strong>Sp<strong>in</strong>al</strong> <strong>Cord</strong> <strong>Injury</strong> <strong>in</strong> <strong>Canada</strong>Us<strong>in</strong>g Published <strong>Incidence</strong> Rates 39Appendix IV: Age specific estimates <strong>of</strong> <strong>in</strong>cidence <strong>and</strong> prevalence <strong>of</strong> sp<strong>in</strong>al cord <strong>in</strong>jury<strong>in</strong> <strong>Canada</strong>, 2010 44Appendix V: Projection <strong>of</strong> <strong>in</strong>cidence <strong>and</strong> prevalence <strong>of</strong> sp<strong>in</strong>al cord <strong>in</strong>jury <strong>in</strong> <strong>Canada</strong>,2010 to 2030 46References 48<strong>The</strong> <strong>Incidence</strong> <strong>and</strong> <strong>Prevalence</strong> <strong>of</strong> <strong>Sp<strong>in</strong>al</strong> <strong>Cord</strong> <strong>Injury</strong> <strong>in</strong> <strong>Canada</strong>Page iDecember 2010
URBAN FUTURESS t r a t e g i c R e s e a r c h t o M a n a g e C h a n g eThis page <strong>in</strong>tentionally left blank.<strong>The</strong> <strong>Incidence</strong> <strong>and</strong> <strong>Prevalence</strong> <strong>of</strong> <strong>Sp<strong>in</strong>al</strong> <strong>Cord</strong> <strong>Injury</strong> <strong>in</strong> <strong>Canada</strong>Page iiDecember 2010
URBAN FUTURESS t r a t e g i c R e s e a r c h t o M a n a g e C h a n g eExecutive SummaryThis report was prepared to provide a review <strong>of</strong> the current measures <strong>of</strong> the <strong>in</strong>cidence <strong>and</strong> prevalence<strong>of</strong> sp<strong>in</strong>al cord <strong>in</strong>jury (SCI) <strong>in</strong> <strong>Canada</strong>. It is to be considered with<strong>in</strong> the context <strong>of</strong> a strategic discussionconcern<strong>in</strong>g the need for, <strong>and</strong> direction <strong>of</strong>, further formal research <strong>in</strong>to the extent <strong>of</strong> sp<strong>in</strong>al cord <strong>in</strong>jury<strong>in</strong> the country. <strong>The</strong> report commences with consideration <strong>of</strong> def<strong>in</strong>itions relat<strong>in</strong>g to sp<strong>in</strong>al cord <strong>in</strong>jury,followed by a review <strong>of</strong> methodology used <strong>in</strong> the measurement <strong>of</strong> its <strong>in</strong>cidence (annual number <strong>of</strong> newcases) <strong>and</strong> prevalence (total number <strong>of</strong> people liv<strong>in</strong>g with SCI, the cumulative net result <strong>of</strong> past SCI),<strong>and</strong> <strong>of</strong> the major Canadian publications, <strong>and</strong> selected <strong>in</strong>ternational ones, that are concerned with thismeasurement. On this basis, estimates <strong>of</strong> the current levels <strong>of</strong> <strong>in</strong>cidence <strong>and</strong> prevalence <strong>of</strong> sp<strong>in</strong>al cord<strong>in</strong>jury <strong>in</strong> <strong>Canada</strong> are presented, before conclud<strong>in</strong>g with recommendations concern<strong>in</strong>g these estimates <strong>and</strong>possible directions for further research.<strong>The</strong> terms <strong>of</strong> reference for this research were to produce estimates <strong>of</strong> the <strong>in</strong>cidence <strong>and</strong> prevalence <strong>of</strong>sp<strong>in</strong>al cord <strong>in</strong>jury <strong>in</strong> <strong>Canada</strong> based on currently published evidence. It is important to note that no suchmeasures currently exist: very little has been published about the extent <strong>of</strong> sp<strong>in</strong>al cord <strong>in</strong>jury <strong>in</strong> <strong>Canada</strong>,<strong>and</strong> what has is limited to the <strong>in</strong>cidence <strong>of</strong> traumatic sp<strong>in</strong>al cord <strong>in</strong>jury, with the literature silent on itsprevalence, <strong>and</strong> most strik<strong>in</strong>gly, on both the <strong>in</strong>cidence <strong>and</strong> prevalence <strong>of</strong> non-traumatic sp<strong>in</strong>al cord <strong>in</strong>jury.<strong>The</strong> absence <strong>of</strong> estimates <strong>of</strong> <strong>in</strong>cidence <strong>and</strong> prevalence is <strong>of</strong> significant concern, as it limits a wide range <strong>of</strong>research <strong>and</strong> policy, rang<strong>in</strong>g from the determ<strong>in</strong>ation <strong>of</strong> the most effective prevention strategies throughthe delivery <strong>of</strong> health <strong>and</strong> medical care to the consideration <strong>of</strong> the f<strong>in</strong>ancial impact <strong>of</strong> SCI <strong>and</strong> fund<strong>in</strong>g <strong>of</strong>prevention <strong>and</strong> care programmes.Given the <strong>in</strong>formation provided <strong>in</strong> the reviewed publications, <strong>and</strong> data on the current <strong>and</strong> historicaldemography <strong>of</strong> <strong>Canada</strong>, the report presents three dist<strong>in</strong>ct measures concern<strong>in</strong>g the current extent <strong>of</strong> SCI.<strong>The</strong> first is an estimate <strong>of</strong> the <strong>in</strong>itial <strong>in</strong>cidence <strong>of</strong> SCI, which <strong>in</strong>cludes all new occurrences <strong>of</strong> SCI dur<strong>in</strong>g ayear, <strong>in</strong>clud<strong>in</strong>g persons dy<strong>in</strong>g <strong>of</strong> sp<strong>in</strong>al cord <strong>in</strong>jury before reach<strong>in</strong>g hospital, those dy<strong>in</strong>g before hospitaldischarge, <strong>and</strong> those discharged from hospital: this is estimated to be 4,259 new cases per year <strong>of</strong> SCI <strong>in</strong><strong>Canada</strong> today. Of this total, an estimated 42 percent (1,785 cases) are the result <strong>of</strong> traumatic sp<strong>in</strong>al cord<strong>in</strong>jury <strong>and</strong> 58 percent are from non-traumatic causes. <strong>The</strong> second measure <strong>of</strong> the extent <strong>of</strong> SCI is thedischarge <strong>in</strong>cidence <strong>of</strong> SCI, or the total number <strong>of</strong> people discharged from hospital after a sp<strong>in</strong>al cord<strong>in</strong>jury each year: this is estimated to currently be 3,675 persons, 1,389 as a result <strong>of</strong> traumatic causes <strong>and</strong>2,286 from non-traumatic causes. <strong>The</strong> third measure <strong>of</strong> the extent <strong>of</strong> SCI is its overall prevalence, or thetotal number <strong>of</strong> people who have <strong>in</strong>curred a sp<strong>in</strong>al cord <strong>in</strong>jury <strong>and</strong> who are currently liv<strong>in</strong>g <strong>in</strong> <strong>Canada</strong>: it isestimated that there are currently 85,556 persons liv<strong>in</strong>g with sp<strong>in</strong>al cord <strong>in</strong>jury <strong>in</strong> <strong>Canada</strong>. Of this total, 51percent (43,974 people) were the result <strong>of</strong> traumatic, <strong>and</strong> 49 percent from non-traumatic causes.<strong>The</strong>se aggregate estimates are built up from s<strong>in</strong>gle year <strong>of</strong> age <strong>and</strong> sex specific estimates <strong>of</strong> <strong>in</strong>itial <strong>and</strong>discharge <strong>in</strong>cidence <strong>and</strong> prevalence for both traumatic <strong>and</strong> non-traumatic sp<strong>in</strong>al cord <strong>in</strong>jury at both thetetraplegic <strong>and</strong> paraplegic levels <strong>of</strong> <strong>in</strong>jury. <strong>The</strong>se detailed estimates are summarized by major age groupson the follow<strong>in</strong>g table <strong>and</strong> by five year age groups <strong>in</strong> Appendix IV <strong>of</strong> this report.<strong>The</strong> <strong>Incidence</strong> <strong>and</strong> <strong>Prevalence</strong> <strong>of</strong> <strong>Sp<strong>in</strong>al</strong> <strong>Cord</strong> <strong>Injury</strong> <strong>in</strong> <strong>Canada</strong>Page iiiDecember 2010
URBAN FUTURESS t r a t e g i c R e s e a r c h t o M a n a g e C h a n g eTable 1Estimated Extent <strong>of</strong> <strong>Sp<strong>in</strong>al</strong> <strong>Cord</strong> <strong>Injury</strong> <strong>in</strong> <strong>Canada</strong>, 2010<strong>Incidence</strong><strong>Prevalence</strong>AgeTraumatic Non-traumatic Traumatic Non-traumaticInitial Discharge Initial Discharge Paraplegia Tetraplegia Paraplegia Tetraplegia0-19 243 189 53 49 459 601 181 8020-39 646 502 285 263 3,923 5,134 2,114 94140-59 501 390 757 700 7,782 10,154 8,598 3,81860-79 290 226 974 900 5,502 7,048 12,214 5,35480+ 105 82 405 374 1,567 1,805 5,904 2,377Total 1,785 1,389 2,474 2,286 19,232 24,742 29,011 12,570Acknowledgment that these estimates are based on the best currently available evidence also requiresacknowledgement that this evidence is far from the best that there could be, particularly with respect tonon-traumatic sp<strong>in</strong>al cord <strong>in</strong>jury. As the terms <strong>of</strong> reference for this research required the preparation <strong>of</strong>these estimates, use <strong>of</strong> the available evidence <strong>in</strong> turn required the development <strong>and</strong> documentation <strong>of</strong>a number <strong>of</strong> assumptions; <strong>in</strong> these cases, the assumptions were <strong>in</strong>tentionally conservative. This meansthat the estimates <strong>of</strong> <strong>in</strong>cidence <strong>and</strong> prevalence may be biased downward, particularly <strong>in</strong> the case <strong>of</strong> nontraumaticsp<strong>in</strong>al cord <strong>in</strong>jury, from the actual levels that prevail <strong>in</strong> <strong>Canada</strong>.This work should be viewed as the start<strong>in</strong>g po<strong>in</strong>t <strong>in</strong> the development <strong>of</strong> robust evidence based <strong>and</strong>documented measurements <strong>of</strong> the <strong>in</strong>cidence <strong>and</strong> prevalence <strong>of</strong> sp<strong>in</strong>al cord <strong>in</strong>jury <strong>in</strong> <strong>Canada</strong>. Furtherdirect primary research <strong>in</strong> <strong>Canada</strong> will both <strong>in</strong>crease the precision <strong>of</strong> the estimates presented here <strong>and</strong>,more fundamentally, <strong>in</strong>crease our knowledge about the extent <strong>and</strong> characteristics <strong>of</strong> the population liv<strong>in</strong>gwith sp<strong>in</strong>al cord <strong>in</strong>jury. Of particular importance will be research on non-traumatic sp<strong>in</strong>al cord <strong>in</strong>jury<strong>and</strong> on the survivorship <strong>of</strong> persons liv<strong>in</strong>g with sp<strong>in</strong>al cord <strong>in</strong>jury, as the unique characteristics <strong>of</strong> <strong>Canada</strong>’spopulation, geography <strong>and</strong> health care system suggest that these may be different from other countries.Given the importance <strong>of</strong> cont<strong>in</strong>u<strong>in</strong>g to exp<strong>and</strong> our knowledge about sp<strong>in</strong>al cord <strong>in</strong>jury, this report closeswith a discussion <strong>of</strong> the some <strong>of</strong> the avenues further research may follow.<strong>The</strong> <strong>Incidence</strong> <strong>and</strong> <strong>Prevalence</strong> <strong>of</strong> <strong>Sp<strong>in</strong>al</strong> <strong>Cord</strong> <strong>Injury</strong> <strong>in</strong> <strong>Canada</strong>Page ivDecember 2010
URBAN FUTURESS t r a t e g i c R e s e a r c h t o M a n a g e C h a n g e<strong>The</strong> <strong>Incidence</strong> <strong>and</strong> <strong>Prevalence</strong> <strong>of</strong> <strong>Sp<strong>in</strong>al</strong> <strong>Cord</strong> <strong>Injury</strong> <strong>in</strong> <strong>Canada</strong>Overview <strong>and</strong> estimates based on current evidenceI. Term<strong>in</strong>ologyA. Overview <strong>of</strong> <strong>Sp<strong>in</strong>al</strong> <strong>Cord</strong> <strong>Injury</strong> (SCI)<strong>The</strong> sp<strong>in</strong>al cord is the major bundle <strong>of</strong> nerves connected to the bra<strong>in</strong> that extends down the sp<strong>in</strong>al canalformed by the vertebrae <strong>of</strong> the sp<strong>in</strong>al column. When damage occurs to the sp<strong>in</strong>al cord, sensory <strong>in</strong>put,movement <strong>of</strong> certa<strong>in</strong> parts <strong>of</strong> the body, <strong>and</strong> <strong>in</strong>voluntary functions such as breath<strong>in</strong>g can be lost or greatlyimpacted. When temporary or permanent impairment occurs due to damage to the sp<strong>in</strong>al cord, it isclassified as a sp<strong>in</strong>al cord <strong>in</strong>jury (Blackwell, 2001).<strong>The</strong>re are two general classes <strong>of</strong> SCI:Traumatic SCI (tSCI) occurs when an external physical impact, such as that result<strong>in</strong>g from a motorvehicle accident, a fall, or from violence, damages the sp<strong>in</strong>al cord. Hagen et al, 2009 def<strong>in</strong>edtraumatic SCI as an acute, traumatic lesion <strong>of</strong> the sp<strong>in</strong>al cord with vary<strong>in</strong>g degrees <strong>of</strong> motor <strong>and</strong>/or sensory deficit or paralysis. In this def<strong>in</strong>ition, <strong>in</strong>juries <strong>of</strong> the cauda equ<strong>in</strong>a, the most caudalpart <strong>of</strong> the sp<strong>in</strong>al cord, were <strong>in</strong>cluded. Accord<strong>in</strong>g to the American Board <strong>of</strong> Physical Medic<strong>in</strong>e<strong>and</strong> Rehabilitation Exam<strong>in</strong>ation Outl<strong>in</strong>e for <strong>Sp<strong>in</strong>al</strong> <strong>Cord</strong> <strong>Injury</strong> Medic<strong>in</strong>e, traumatic SCI <strong>in</strong>cludesfractures, dislocations <strong>and</strong> contusions <strong>of</strong> the vertebral column (Kirshblum et al, 2002).Non-traumatic SCI (ntSCI) occurs when a health condition, such as disease, <strong>in</strong>fection, or a tumourdamages the sp<strong>in</strong>al cord; that is, when damage is done to the sp<strong>in</strong>al cord by means other thanan external physical force. <strong>The</strong> causal factors <strong>in</strong>volved <strong>in</strong> non-traumatic SCI <strong>in</strong>clude motor neurondiseases, spondylotic myelopathies, <strong>in</strong>fectious <strong>and</strong> <strong>in</strong>flammatory diseases, neoplastic diseases,vascular diseases, toxic <strong>and</strong> metabolic conditions, <strong>and</strong> congenital <strong>and</strong> developmental disorders(Kirshblum et al, 2002).<strong>The</strong> consequence <strong>of</strong> SCI is generally classified as either:Tetraplegia (or quadriplegia) which <strong>in</strong>volves impairment <strong>of</strong> function <strong>in</strong> the arms as well as <strong>in</strong>the trunk (the body exclud<strong>in</strong>g the head <strong>and</strong> limbs), legs <strong>and</strong> pelvic organs but does not <strong>in</strong>cludebrachial plexus lesions or <strong>in</strong>jury to peripheral nerves outside neural canal; orParaplegia, which <strong>in</strong>volves impairment <strong>of</strong> the trunk, legs <strong>and</strong> pelvic organs, but with arm functionnot impaired; cauda equ<strong>in</strong>a <strong>and</strong> conus medullaris <strong>in</strong>juries are <strong>in</strong>cluded but lumbosacral plexuslesions or <strong>in</strong>jury to peripheral nerves outside neural canal are excluded (International St<strong>and</strong>ardsfor Neurological Classification <strong>of</strong> <strong>Sp<strong>in</strong>al</strong> <strong>Cord</strong> <strong>Injury</strong>, ISNCSCI).Classification <strong>of</strong> SCI <strong>in</strong>to traumatic <strong>and</strong> non-traumatic <strong>and</strong> by the severity <strong>of</strong> the <strong>in</strong>jury are particularlyimportant for the treatment, recovery <strong>and</strong> rehabilitation <strong>of</strong> the patient. When a SCI occurs, there canbe complete or <strong>in</strong>complete lesion(s) <strong>of</strong> the sp<strong>in</strong>al cord, which, <strong>in</strong> turn, alters whether there is partial ortotal motor <strong>and</strong>/or sensory deficit. <strong>The</strong> neurological extent <strong>of</strong> the <strong>in</strong>jury, or how much motor or sensoryfunction is left <strong>in</strong>tact after the SCI, is measured by a neurological exam<strong>in</strong>ation specified by ISNCSCI. Thisexam<strong>in</strong>ation determ<strong>in</strong>es the level <strong>of</strong> impairment <strong>of</strong> the patient, reported with an American <strong>Sp<strong>in</strong>al</strong> <strong>Injury</strong>Association (ASIA) Impairment Scale grade.<strong>The</strong> <strong>Incidence</strong> <strong>and</strong> <strong>Prevalence</strong> <strong>of</strong> <strong>Sp<strong>in</strong>al</strong> <strong>Cord</strong> <strong>Injury</strong> <strong>in</strong> <strong>Canada</strong>Page 1December 2010
URBAN FUTURESS t r a t e g i c R e s e a r c h t o M a n a g e C h a n g e<strong>The</strong> st<strong>and</strong>ard approach to the identification <strong>of</strong> SCI occurs with<strong>in</strong> the hospital context, where hospitalrecord coders assign the relevant International Classification <strong>of</strong> Diseases (ICD) codes to patients. <strong>The</strong> ICDdiagnosis codes <strong>in</strong> themselves <strong>in</strong>dicate the level <strong>and</strong> severity <strong>of</strong> SCI but not the etiology, morphology, orexact location <strong>of</strong> SCI, <strong>and</strong> hence are necessary but not sufficient for the measurement <strong>of</strong> SCI. In orderto determ<strong>in</strong>e the causal mechanism, details <strong>of</strong> SCI, <strong>and</strong> extent <strong>of</strong> impairment that results, it is necessaryto additionally obta<strong>in</strong> ICD External Cause <strong>of</strong> <strong>Injury</strong> Code (E-codes) for causation <strong>in</strong> tSCI, exist<strong>in</strong>g healthconditions <strong>in</strong> cases <strong>of</strong> ntSCI, <strong>and</strong> ISNCSCI results for research purposes.B. <strong>Incidence</strong> <strong>and</strong> <strong>Prevalence</strong><strong>The</strong> <strong>in</strong>cidence <strong>of</strong> SCI is def<strong>in</strong>ed as the number <strong>of</strong> new cases that occur each year (generally reported asa number <strong>of</strong> new SCI cases per million population per year); its prevalence is def<strong>in</strong>ed as the number <strong>of</strong>persons with SCI who are alive at a po<strong>in</strong>t <strong>in</strong> time, the cumulative result <strong>of</strong> past <strong>in</strong>cidence <strong>of</strong> SCI net <strong>of</strong>mortality <strong>and</strong> potential cures measured as a number per million population (L<strong>in</strong>, 2003).<strong>The</strong> hospital based process for the identification <strong>of</strong> SCI imposes significant limitations on the measurement<strong>of</strong> its <strong>in</strong>cidence <strong>and</strong> prevalence, for while the assignment <strong>of</strong> ICD codes rout<strong>in</strong>ely occurs, the adm<strong>in</strong>istration<strong>of</strong> ISNCSCI tests on SCI patients is not entirely <strong>in</strong>clusive (<strong>of</strong>tentimes non-traumatic SCI patients are notadm<strong>in</strong>istered the ISNCSCI), <strong>and</strong> ISNCSCI results are not rout<strong>in</strong>ely well reported. Another concern is theaccuracy <strong>of</strong> the translation <strong>of</strong> diagnosis from a cl<strong>in</strong>ician’s exam<strong>in</strong>ation to the most appropriate ICD codeby hospital record coders. Although there is general agreement with<strong>in</strong> the medical community on thedef<strong>in</strong>ition <strong>of</strong> tSCI, there is no specified st<strong>and</strong>ard <strong>of</strong> ICD codes that are to be <strong>in</strong>cluded. Further, there isno consensus, general or specific, on what constitutes ntSCI cases or which ICD codes apply. <strong>The</strong>re is nost<strong>and</strong>ard report<strong>in</strong>g <strong>of</strong> people liv<strong>in</strong>g with SCI, either with<strong>in</strong> or outside the hospital context, <strong>and</strong> hence bothprocedures <strong>and</strong> codes must be developed <strong>in</strong> order to ensure effective <strong>and</strong> comparable measurement <strong>of</strong>this population group. In this context, a number <strong>of</strong> recent studies have called for a st<strong>and</strong>ard def<strong>in</strong>ition fortraumatic <strong>and</strong> non-traumatic SCI <strong>and</strong> a uniform data collection methodology (Ackery et al, 2004; New &Sundararajan, 2008; Wyndaele & Wyndaele, 2006).<strong>The</strong> absence <strong>of</strong> rout<strong>in</strong>e report<strong>in</strong>g has meant that measurement <strong>of</strong> <strong>in</strong>cidence <strong>and</strong> prevalence has occurredon a project by project basis, lead<strong>in</strong>g to research us<strong>in</strong>g a wide range <strong>of</strong> measures <strong>and</strong> methodologies, <strong>and</strong>hence a wide range <strong>of</strong> estimated levels. <strong>The</strong> resultant f<strong>in</strong>d<strong>in</strong>gs are quite localized, as the research showsthat SCI is not only age specific (with the highest rates for traumatic SCI found <strong>in</strong> the young adult stage<strong>of</strong> the life cycle <strong>and</strong> non-traumatic SCI demonstrat<strong>in</strong>g a steadily <strong>in</strong>creas<strong>in</strong>g <strong>in</strong>cidence rate with <strong>in</strong>creas<strong>in</strong>gage), but also specific to the economic, social, <strong>and</strong> cultural structure <strong>of</strong> communities. This means thatcomparison <strong>of</strong> overall <strong>in</strong>cidence <strong>and</strong> prevalence levels must acknowledge not only different behaviouralpatterns with respect to SCI but also different underly<strong>in</strong>g demographic <strong>and</strong> community factors.As the general review <strong>of</strong> major published articles summarized <strong>in</strong> Section III <strong>of</strong> the body <strong>of</strong> this report (basedon the more detailed review <strong>in</strong> Appendix I ‘Summary <strong>of</strong> Major Articles Concern<strong>in</strong>g SCI’) shows, a number<strong>of</strong> researchers have provided significant <strong>in</strong>sights <strong>in</strong>to the measurement <strong>of</strong> <strong>in</strong>cidence <strong>and</strong> prevalence, butthe results fall with<strong>in</strong> a wide range. <strong>The</strong>re have been two general methodological approaches used <strong>in</strong>published research. <strong>The</strong> first approach, most commonly used <strong>in</strong> studies <strong>of</strong> SCI <strong>in</strong>cidence, has been a casebasedapproach, us<strong>in</strong>g reported ICD codes to identify cases <strong>of</strong> SCI from databases such as the NationalTrauma Registry (NTR) or Discharge Abstract Database (DAD) <strong>and</strong> <strong>in</strong> some cases supplement<strong>in</strong>g f<strong>in</strong>d<strong>in</strong>gsby review<strong>in</strong>g hospital charts. On the basis <strong>of</strong> this measurement <strong>of</strong> annual <strong>in</strong>cidence, population agecompositions <strong>and</strong> life expectancies are then used to estimate prevalence.In us<strong>in</strong>g this approach to estimate prevalence, it is necessary to consider historical changes <strong>in</strong> <strong>in</strong>cidence<strong>and</strong> duration (life expectancy <strong>of</strong> those with SCI), <strong>in</strong> the age-specific pattern <strong>of</strong> <strong>in</strong>cidence, <strong>and</strong> the underly<strong>in</strong>g<strong>The</strong> <strong>Incidence</strong> <strong>and</strong> <strong>Prevalence</strong> <strong>of</strong> <strong>Sp<strong>in</strong>al</strong> <strong>Cord</strong> <strong>Injury</strong> <strong>in</strong> <strong>Canada</strong>Page 2December 2010
URBAN FUTURESS t r a t e g i c R e s e a r c h t o M a n a g e C h a n g edemography. It is also important to consider the stage <strong>in</strong> the medical process that measurement occurs,as some <strong>in</strong>cidence studies focus on <strong>in</strong>itial <strong>in</strong>cidence which <strong>in</strong>cludes SCI that results <strong>in</strong> death before <strong>and</strong>dur<strong>in</strong>g hospitalization. While this metric is an important consideration <strong>in</strong> the context <strong>of</strong> prevention, whenus<strong>in</strong>g <strong>in</strong>cidence to estimate prevalence, it is appropriate to <strong>in</strong>clude only those persons who survive toreach hospital discharge.<strong>The</strong> second approach is to measure both <strong>in</strong>cidence <strong>and</strong> prevalence through a survey <strong>of</strong> the generalpopulation by us<strong>in</strong>g st<strong>and</strong>ard sampl<strong>in</strong>g <strong>and</strong> survey techniques. This approach provides a directmeasurement, <strong>and</strong> can measure traumatic <strong>and</strong> non-traumatic <strong>in</strong>jury by level <strong>of</strong> <strong>in</strong>jury. It has a number<strong>of</strong> limitations, rang<strong>in</strong>g from self-report<strong>in</strong>g bias to the problems <strong>of</strong> obta<strong>in</strong><strong>in</strong>g a statistically representativenumber <strong>of</strong> respondents, particularly when any degree <strong>of</strong> cross-tabulation is to be pursued.As the follow<strong>in</strong>g Section II discusses, accurate <strong>and</strong> st<strong>and</strong>ardized measurement <strong>of</strong> the <strong>in</strong>cidence <strong>and</strong>prevalence <strong>of</strong> SCI is essential to evaluation <strong>and</strong> improvement <strong>of</strong> programs relat<strong>in</strong>g to the prevention <strong>and</strong>treatment <strong>of</strong> SCI. Such measurement does not currently occur, with exist<strong>in</strong>g studies, while valuable <strong>in</strong>their own right, us<strong>in</strong>g different def<strong>in</strong>itions <strong>and</strong> measures <strong>of</strong> both <strong>in</strong>cidence <strong>and</strong> prevalence.<strong>The</strong> <strong>Incidence</strong> <strong>and</strong> <strong>Prevalence</strong> <strong>of</strong> <strong>Sp<strong>in</strong>al</strong> <strong>Cord</strong> <strong>Injury</strong> <strong>in</strong> <strong>Canada</strong>Page 3December 2010
URBAN FUTURESS t r a t e g i c R e s e a r c h t o M a n a g e C h a n g eII. Relevance <strong>of</strong> Measur<strong>in</strong>g the <strong>Incidence</strong> <strong>and</strong> <strong>Prevalence</strong> <strong>of</strong> SCI<strong>The</strong>re are pr<strong>of</strong>ound reasons for hav<strong>in</strong>g good measures <strong>of</strong> the <strong>in</strong>cidence <strong>and</strong> prevalence <strong>of</strong> sp<strong>in</strong>al cord<strong>in</strong>jury by cause, severity, age group, <strong>and</strong> geographical location. <strong>The</strong>se reasons range from determ<strong>in</strong><strong>in</strong>g themost effective prevention strategies, through the delivery <strong>of</strong> services <strong>and</strong> treatment across the cont<strong>in</strong>uum<strong>of</strong> care, to consideration <strong>of</strong> the f<strong>in</strong>ancial impact <strong>of</strong> SCI <strong>and</strong> fund<strong>in</strong>g <strong>of</strong> prevention <strong>and</strong> care programmes.In this section, a brief review <strong>of</strong> importance <strong>of</strong> these measurements from an <strong>in</strong>stitutional perspective ispresented.A. <strong>The</strong> Rick Hansen InstituteEffective measurement <strong>of</strong> the <strong>in</strong>cidence, number, <strong>and</strong> characteristics <strong>of</strong> people liv<strong>in</strong>g with SCI isfundamental to a range <strong>of</strong> <strong>in</strong>terests at the Rick Hansen Institute (RHI). In the context <strong>of</strong> its objective to<strong>in</strong>crease the <strong>in</strong>dependence <strong>and</strong> improve the quality <strong>of</strong> life <strong>of</strong> people liv<strong>in</strong>g with SCI, the RHI must knowboth the scale <strong>and</strong> the scope <strong>of</strong> SCI <strong>in</strong> <strong>Canada</strong> <strong>in</strong> order to ensure that it is reach<strong>in</strong>g this community; t<strong>of</strong>acilitate discovery, development <strong>and</strong> implementation <strong>of</strong> relevant solutions to improve their quality <strong>of</strong> life;<strong>and</strong> to compare the impact or success <strong>of</strong> such <strong>in</strong>terventions <strong>and</strong> <strong>in</strong>novations.In addition to this core focus on people liv<strong>in</strong>g with SCI, the RHI must also know the extent <strong>of</strong> SCI <strong>in</strong> orderto broaden public knowledge <strong>of</strong> SCI, to encourage the implementation <strong>of</strong> the most effective preventionprogrammes, <strong>and</strong> to <strong>in</strong>crease public support for the Institute <strong>and</strong> for the fund<strong>in</strong>g <strong>of</strong> its activities. Inthe very specific context <strong>of</strong> fund<strong>in</strong>g for the RHI, it is important to note that Health <strong>Canada</strong>, the federaldepartment responsible for help<strong>in</strong>g Canadians ma<strong>in</strong>ta<strong>in</strong> <strong>and</strong> improve their health, provides primaryfund<strong>in</strong>g for RHI, with secondary fund<strong>in</strong>g supplied by the Western Economic Diversification (WED) <strong>and</strong>from other prov<strong>in</strong>cial governments. To susta<strong>in</strong> <strong>and</strong> obta<strong>in</strong> further fund<strong>in</strong>g from these constituencies,<strong>and</strong> to support <strong>and</strong> evaluate research currently underway, a basel<strong>in</strong>e <strong>of</strong> <strong>in</strong>formation on <strong>in</strong>cidence <strong>and</strong>prevalence will assist to both measure performance value <strong>and</strong> to document progress <strong>and</strong> accountability.While a separate <strong>in</strong>terest <strong>in</strong> its own right, there are strong connections between the measurement <strong>in</strong>terest<strong>and</strong> the Rick Hansen <strong>Sp<strong>in</strong>al</strong> <strong>Cord</strong> <strong>Injury</strong> Registry (RHSCIR, rickhansenregistry.org). <strong>The</strong> objectives <strong>of</strong> thisregistry are to create a digital connection <strong>and</strong> meet<strong>in</strong>g place for people liv<strong>in</strong>g with SCI, as well as forresearchers, cl<strong>in</strong>icians, <strong>and</strong> health care pr<strong>of</strong>essionals. <strong>The</strong> Registry will <strong>in</strong>clude <strong>in</strong>formation on those liv<strong>in</strong>gwith tSCI, <strong>in</strong>clud<strong>in</strong>g new <strong>in</strong>cidences, <strong>and</strong> cl<strong>in</strong>ical, social, geographic, <strong>and</strong> demographic characteristics. Itwill facilitate the monitor<strong>in</strong>g <strong>of</strong> specific outcome measures <strong>and</strong> will aid <strong>in</strong> the discovery, validation <strong>and</strong>translation <strong>of</strong> relevant treatments <strong>and</strong> practices that will <strong>in</strong>crease <strong>in</strong>dependence <strong>and</strong> improve quality <strong>of</strong>life for people liv<strong>in</strong>g with SCI. It will provide access for people with tSCI to new <strong>and</strong> reliable <strong>in</strong>formationabout SCI <strong>and</strong> cl<strong>in</strong>ical, rehabilitation, <strong>and</strong> community options.In order to ensure that the Registry is reach<strong>in</strong>g the communities <strong>of</strong> <strong>in</strong>terest, it will be essential to know theprevalence <strong>of</strong> SCI <strong>in</strong> <strong>Canada</strong>, by both geography <strong>and</strong> demography. As the registry develops, it will providea valuable calibration <strong>of</strong> the estimates <strong>of</strong> <strong>in</strong>cidence <strong>and</strong> prevalence calculated us<strong>in</strong>g non-registry methods.B. <strong>The</strong> Researcher CommunityTo conduct cl<strong>in</strong>ical trials <strong>and</strong> studies, researchers must ensure that the participants are representative<strong>of</strong> both the scale <strong>and</strong> characteristics <strong>of</strong> SCI, which <strong>in</strong> turn necessitates knowledge <strong>of</strong> the <strong>in</strong>cidence <strong>and</strong>prevalence <strong>of</strong> SCI. <strong>The</strong>se research activities are diverse <strong>in</strong> nature, <strong>in</strong>clud<strong>in</strong>g prevention, acute post-<strong>in</strong>jurycare, tim<strong>in</strong>g <strong>and</strong> type <strong>of</strong> <strong>in</strong>tervention, rehabilitation, need, <strong>and</strong> outcome trials <strong>and</strong> studies. <strong>The</strong> moreresearchers underst<strong>and</strong> about the epidemiology <strong>of</strong> SCI, such as the specific type <strong>of</strong> SCI or level <strong>of</strong> <strong>in</strong>jury,the more applicable <strong>and</strong> valuable this <strong>in</strong>formation becomes. Furthermore, this knowledge aids <strong>in</strong> the<strong>The</strong> <strong>Incidence</strong> <strong>and</strong> <strong>Prevalence</strong> <strong>of</strong> <strong>Sp<strong>in</strong>al</strong> <strong>Cord</strong> <strong>Injury</strong> <strong>in</strong> <strong>Canada</strong>Page 4December 2010
URBAN FUTURESS t r a t e g i c R e s e a r c h t o M a n a g e C h a n g everification <strong>of</strong> value <strong>of</strong> treatments by allow<strong>in</strong>g the researchers to estimate the number <strong>of</strong> people whowould benefit from new therapeutic strategies. Allocation <strong>of</strong> fund<strong>in</strong>g <strong>and</strong> resources to identify thosestrategies that would be most beneficial is essential for mov<strong>in</strong>g forward <strong>in</strong> SCI research.<strong>The</strong> <strong>in</strong>cidence <strong>and</strong> prevalence knowledge is also fundamental <strong>in</strong> the determ<strong>in</strong>ation <strong>of</strong> the strategic focuson different populations at risk or liv<strong>in</strong>g with SCI, <strong>and</strong> <strong>in</strong> the comparisons <strong>of</strong> SCI epidemiology with othernations which may identify potential issues, such as an unusually high national or regional SCI <strong>in</strong>cidencerate <strong>in</strong> the Canadian context.C. <strong>The</strong> Canadian Public<strong>The</strong> consequences <strong>of</strong> SCI are overwhelm<strong>in</strong>gly borne by persons liv<strong>in</strong>g with SCI <strong>and</strong> their family <strong>and</strong> friends,<strong>and</strong> hence they, <strong>and</strong> the rest <strong>of</strong> the public, have pr<strong>of</strong>ound <strong>in</strong>terest <strong>in</strong> the prevention <strong>of</strong>, <strong>and</strong> care for,sp<strong>in</strong>al cord <strong>in</strong>jury. Prevention is the foundation <strong>of</strong> health policy: effective prevention strategies can beimplemented only with an underst<strong>and</strong><strong>in</strong>g <strong>of</strong> the extent <strong>and</strong> socio-demographic characteristics <strong>of</strong> the<strong>in</strong>cidence <strong>of</strong> SCI, an underst<strong>and</strong><strong>in</strong>g that must be shared by researchers <strong>and</strong> the Canadian public as a whole.Underst<strong>and</strong><strong>in</strong>g the extent <strong>of</strong> SCI is also fundamental to the evaluation <strong>of</strong> the wider consequences <strong>of</strong> SCIthat are the foundation <strong>of</strong> public efforts to provide facilities, services, <strong>and</strong> care that <strong>in</strong>crease <strong>in</strong>dependence<strong>and</strong> improve the quality <strong>of</strong> life <strong>of</strong> people liv<strong>in</strong>g with SCI.It is essential to demonstrate to the Canadian public the full cost <strong>of</strong> SCI, to both <strong>in</strong>dividuals <strong>and</strong>communities, <strong>and</strong> to demonstrate the benefits <strong>of</strong> programs that will either reduce <strong>in</strong>cidence or improvethe lives <strong>of</strong> those with SCI so that the wider public will give their support, both <strong>in</strong> spirit <strong>and</strong> <strong>in</strong> fund<strong>in</strong>g, <strong>of</strong>these programmes. <strong>The</strong> foundation for both <strong>of</strong> these efforts is an effective measurement <strong>of</strong> the <strong>in</strong>cidence<strong>and</strong> prevalence <strong>of</strong> SCI <strong>in</strong> <strong>Canada</strong>.<strong>The</strong> <strong>Incidence</strong> <strong>and</strong> <strong>Prevalence</strong> <strong>of</strong> <strong>Sp<strong>in</strong>al</strong> <strong>Cord</strong> <strong>Injury</strong> <strong>in</strong> <strong>Canada</strong>Page 5December 2010
URBAN FUTURESS t r a t e g i c R e s e a r c h t o M a n a g e C h a n g eIII. <strong>The</strong> Current State <strong>of</strong> Knowledge Concern<strong>in</strong>g the <strong>Incidence</strong> <strong>and</strong><strong>Prevalence</strong> <strong>of</strong> SCI <strong>in</strong> <strong>Canada</strong>PubMed Central <strong>Canada</strong> (an onl<strong>in</strong>e digital archive <strong>of</strong> full-text, peer-reviewed Canadian research publications<strong>in</strong> health <strong>and</strong> life sciences, pubmedcentralcanada.ca) was searched for studies, <strong>and</strong> reviews <strong>of</strong> studies, <strong>of</strong>the <strong>in</strong>cidence <strong>and</strong> prevalence <strong>of</strong> SCI published over the past decade, with a focus on studies conducted<strong>in</strong> <strong>Canada</strong> <strong>and</strong> that specifically gave an <strong>in</strong>cidence rate <strong>of</strong> SCI. Four Canadian studies were found, whichform the basis <strong>of</strong> the literature review presented here. Two studies from Australia relat<strong>in</strong>g to ntSCI werealso <strong>in</strong>cluded. F<strong>in</strong>ally, two other studies were <strong>in</strong>cluded: a literature review <strong>of</strong> all published literature thatrelated to <strong>in</strong>cidence to provide the global context <strong>and</strong> a recently published U.S. prevalence <strong>of</strong> paralysissurvey <strong>in</strong>itiated by the Christopher & Dana Reeve Foundation (not <strong>in</strong>dexed <strong>in</strong> PUBMED).Appendix I to this Report, ‘Summary <strong>of</strong> Major Articles Concern<strong>in</strong>g SCI’, presents a summary <strong>of</strong> these articleshighlight<strong>in</strong>g the f<strong>in</strong>d<strong>in</strong>gs relevant to the measurement <strong>of</strong> <strong>in</strong>cidence <strong>and</strong> prevalence. A number <strong>of</strong> generalobservations may be made concern<strong>in</strong>g these publications. First, each uses a different methodology <strong>and</strong>different def<strong>in</strong>ition <strong>of</strong> SCI. Even those studies which use ICD codes to identify the potential <strong>in</strong>cidence <strong>of</strong>sp<strong>in</strong>al cord <strong>in</strong>jury rely on different sets <strong>of</strong> codes, as is <strong>in</strong>dicated <strong>in</strong> the “Comparison <strong>of</strong> ICD Codes Used<strong>in</strong> SCI Research” presented <strong>in</strong> Appendix II. Second, given the small sample sizes <strong>in</strong> each study, varianceshould be anticipated between measured <strong>and</strong> actual levels. Third, <strong>and</strong> more significantly, researchershave raised a significant concern about under-report<strong>in</strong>g <strong>of</strong> non-catastrophic <strong>in</strong>jury for both traumatic <strong>and</strong>non-traumatic SCI.To the extent that these publications present estimates for <strong>in</strong>cidence or prevalence, the correspond<strong>in</strong>grates were tabulated <strong>and</strong> then applied to the appropriate demographic variable for the Canadianpopulation to demonstrate what the <strong>in</strong>cidence <strong>and</strong> prevalence <strong>of</strong> SCI <strong>in</strong> <strong>Canada</strong> would be should theresearch be directly applicable <strong>in</strong> the Canadian context. In the follow<strong>in</strong>g section, the contents <strong>of</strong> thesethree Appendices are summarized (Section III. A.) <strong>and</strong> then conclusions with respect to the calculations<strong>of</strong> <strong>in</strong>cidence <strong>and</strong> prevalence are presented (Section III. B.). <strong>The</strong> details <strong>of</strong> these calculations are presented<strong>in</strong> Appendix III, ‘Prelim<strong>in</strong>ary Estimates <strong>of</strong> <strong>Prevalence</strong> <strong>of</strong> <strong>Sp<strong>in</strong>al</strong> <strong>Cord</strong> <strong>Injury</strong> <strong>in</strong> <strong>Canada</strong> Us<strong>in</strong>g Published<strong>Incidence</strong> Rates’. In each case, <strong>in</strong>cidence rates are number <strong>of</strong> new cases <strong>of</strong> SCI per million populationfor 2010 <strong>and</strong> prevalence rates are number <strong>of</strong> people liv<strong>in</strong>g with SCI per million population <strong>in</strong> 2010, with<strong>in</strong>cidence def<strong>in</strong>ed as the number <strong>of</strong> new cases <strong>in</strong> a year <strong>and</strong> prevalence as the total number <strong>of</strong> peopleliv<strong>in</strong>g with sp<strong>in</strong>al cord <strong>in</strong>jury dur<strong>in</strong>g the year.A. Summary <strong>of</strong> Articles <strong>and</strong> Implied Canadian <strong>Prevalence</strong>1. Couris et al, 2010 (<strong>Canada</strong>)Gender-specific <strong>in</strong>cidence rate <strong>of</strong> tSCI: 36.3 (male) <strong>and</strong> 12.1 (female).Implied tSCI prevalence <strong>in</strong> <strong>Canada</strong>: 18,438 (male), 6,378 (female); 24,816 total.Data source - identified 936 <strong>in</strong>cident tSCI cases <strong>in</strong> southern Ontario by ICD codes from hospital DischargeAbstract Database (DAD). DAD collects <strong>in</strong>formation on admission, transfers <strong>and</strong> deaths <strong>of</strong> <strong>in</strong>-patients,hence this rate would <strong>in</strong>clude deaths dur<strong>in</strong>g hospitalization but not before admission. Excluded casesunder the age <strong>of</strong> 18 years. Sensitivity <strong>and</strong> specificity <strong>of</strong> identification <strong>of</strong> tSCI was not evaluated. Traumapatients for whom the SCI diagnosis is delayed or missed would not be counted.<strong>The</strong> <strong>Incidence</strong> <strong>and</strong> <strong>Prevalence</strong> <strong>of</strong> <strong>Sp<strong>in</strong>al</strong> <strong>Cord</strong> <strong>Injury</strong> <strong>in</strong> <strong>Canada</strong>Page 6December 2010
URBAN FUTURESS t r a t e g i c R e s e a r c h t o M a n a g e C h a n g e2. Pickett et al, 2006 (<strong>Canada</strong>)Age specific <strong>in</strong>cidence rates for tSCI: 0-14 years, 3.37; 15-64 years, 41.79; 65 plus, 50.87.Implied tSCI prevalence <strong>in</strong> <strong>Canada</strong>: 42,939 cases.Data source - Identified 151 tSCI cases <strong>in</strong> south-western Ontario by ICD codes <strong>of</strong> medical records database.Does not specify whether data <strong>in</strong>clude cases <strong>of</strong> death before hospital discharge. Collection bias: no use <strong>of</strong>a trauma registry, did not <strong>in</strong>clude multiple sources <strong>of</strong> data.3. Dryden et al, 2003 (<strong>Canada</strong>)Gender-specific <strong>in</strong>cidence rates <strong>of</strong> tSCI: detailed for ten-year age groups (see Appendix III.A.4).Implied tSCI prevalence <strong>in</strong> <strong>Canada</strong>: 49,982 (male), 18,934 (female); 68,916 (total).Data source - Identified 450 tSCI cases <strong>in</strong> Alberta by ICD codes from the Alberta Trauma Registry <strong>and</strong>Office <strong>of</strong> the Medical Exam<strong>in</strong>er with subsequent review <strong>of</strong> charts from the Alberta M<strong>in</strong>istry <strong>of</strong> Health<strong>and</strong> Wellness. Included deaths before hospitalization <strong>and</strong> discharge, hence <strong>in</strong>itial <strong>in</strong>cidence rates. Validitytest <strong>of</strong> approach <strong>and</strong> <strong>in</strong>clusion criteria resulted <strong>in</strong> positive predictive value <strong>of</strong> 94.4% <strong>and</strong> a sensitivity <strong>of</strong>100%. Rapidly resolv<strong>in</strong>g neurological deficits would have been missed as well as pre-hospital deaths that<strong>in</strong>cluded multiple severe <strong>in</strong>juries.4. Guilcher et al, 2010 (<strong>Canada</strong>)No <strong>in</strong>cidence or prevalence rates reported. Presents a comparison <strong>of</strong> selected characteristics <strong>of</strong> ntSCI<strong>and</strong> tSCI rehabilitation patients aged 18-plus <strong>in</strong> the prov<strong>in</strong>ce <strong>of</strong> Ontario. Initial admission for <strong>in</strong>patientrehabilitation was 1,623 ntSCI <strong>and</strong> 842 tSCI: the exclusion criteria reduced the sample to 1,002 ntSCI cases<strong>and</strong> 560 tSCI cases, a 38 percent <strong>and</strong> 33 percent reduction, respectively.In consider<strong>in</strong>g Guilcher et al, 2010, the authors <strong>of</strong> this report noted that the use <strong>of</strong> rehabilitation cl<strong>in</strong>icsas a sett<strong>in</strong>g for research on SCI potentially <strong>in</strong>troduces limitations to the identification <strong>of</strong> the relative<strong>in</strong>cidence <strong>of</strong> ntSCI as compared to tSCI. In discussions conducted with sp<strong>in</strong>al cord <strong>in</strong>jury researchersdur<strong>in</strong>g the preparation <strong>of</strong> this report, it was occasionally remarked that <strong>in</strong>dividuals with ntSCI may notbe as likely to be referred to rehabilitation cl<strong>in</strong>ics as those with tSCI. This anecdotal evidence suggeststhat the population with sp<strong>in</strong>al cord <strong>in</strong>jury <strong>in</strong> rehabilitation is not necessarily the total population withsp<strong>in</strong>al cord <strong>in</strong>jury as younger <strong>and</strong> middle aged persons with catastrophic tSCI are perhaps more likely tobe referred to rehabilitation than the elderly, those with non-catastrophic <strong>in</strong>jury, <strong>and</strong> those with ntSCI.A number <strong>of</strong> reasons for this were suggested, rang<strong>in</strong>g from complications due to the causal disease ormedical condition to a perception that, given their generally older age, <strong>in</strong>dividuals with ntSCI may nothave as strong a commitment to rehabilitation as younger <strong>in</strong>dividuals with tSCI. At this juncture there areno data to corroborate these anecdotal comments, which are raised here only by way <strong>of</strong> establish<strong>in</strong>g acontext for the use <strong>of</strong> relative magnitude estimates derived from the rehabilitation context.5. New et al, 2010 (Australia)No <strong>in</strong>cidence rates reported. A ratio <strong>of</strong> 1,361 to 2,241 <strong>of</strong> traumatic to non-traumatic SCI rehab casespresented. <strong>The</strong> sampl<strong>in</strong>g base was persons <strong>in</strong> rehabilitation programmes <strong>in</strong> Australia.<strong>The</strong> <strong>Incidence</strong> <strong>and</strong> <strong>Prevalence</strong> <strong>of</strong> <strong>Sp<strong>in</strong>al</strong> <strong>Cord</strong> <strong>Injury</strong> <strong>in</strong> <strong>Canada</strong>Page 7December 2010
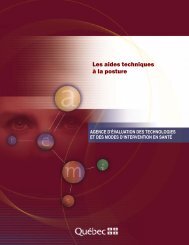
6. New & Sundararajan, 2008 (Australia)URBAN FUTURESS t r a t e g i c R e s e a r c h t o M a n a g e C h a n g eGender-specific <strong>in</strong>cidence rates <strong>of</strong> ntSCI <strong>in</strong> Australian context: adults 15 years <strong>and</strong> older, 30.5 (male)<strong>and</strong> 22.9 (female); 0-14 years: 0.7 for both genders. Implied ntSCI prevalence <strong>in</strong> <strong>Canada</strong> us<strong>in</strong>g theserates: 17,045 (male), 13,216 (female); 30,261 (total). <strong>Incidence</strong> rates for ntSCI from a review <strong>of</strong> selected<strong>in</strong>ternational publications: a range from 5.1 to 80 cases per million population per year. Implied ntSCIprevalence <strong>in</strong> <strong>Canada</strong> us<strong>in</strong>g these rates: a range from 6,883 to 107,967 casesData source for Australian study: identified 631 ntSCI cases <strong>in</strong> Australia by ICD codes from a state-widehospital discharge database; reviewed eleven publications from eight countries. Victorian AdmittedEpisodes Dataset (for Australian data) <strong>in</strong>cludes cases on every admitted episode <strong>of</strong> care occurr<strong>in</strong>g <strong>in</strong>Victorian acute hospitals. Publication does not specify if it <strong>in</strong>cludes deaths before hospital discharge.Excluded congenital, motor neurone disease, multiple sclerosis <strong>and</strong> cases under 15 years <strong>of</strong> age.Identification <strong>of</strong> ntSCI may have not been totally <strong>in</strong>clusive <strong>and</strong> cod<strong>in</strong>g guidel<strong>in</strong>es used <strong>in</strong> this study may notbe applicable to other countries.7. Wyndaele & Wyndaele, 2006 (Belgium – worldwide literature review)<strong>Incidence</strong> rates for SCI (cause <strong>and</strong> <strong>in</strong>cidence measure unspecified): Range 10.4 - 83.0.Implied prevalence <strong>in</strong> <strong>Canada</strong>: from 13,334 to 106,416 cases <strong>of</strong> SCI.This study also presented results from two post-1985 studies <strong>of</strong> prevalence <strong>of</strong> SCI <strong>in</strong> North America,cit<strong>in</strong>g estimates for SCI (unspecified as to type) <strong>of</strong> 681 <strong>and</strong> 755 cases per million. Apply<strong>in</strong>g these rates to<strong>Canada</strong>’s current demography results <strong>in</strong> 22,976 <strong>and</strong> 25,473 cases <strong>of</strong> unspecified SCI.Data Source - Review <strong>of</strong> exist<strong>in</strong>g literature on SCI <strong>in</strong>cidence, prevalence <strong>and</strong> epidemiology. No specification<strong>of</strong> each study’s <strong>in</strong>clusion <strong>and</strong> exclusion criteria or whether the studies were on traumatic or non-traumaticSCI. Demography <strong>and</strong> economy <strong>of</strong> regions <strong>of</strong> study <strong>of</strong>ten different than that <strong>of</strong> <strong>Canada</strong>.8. Cahill et al, 2008 (Christopher & Dana Reeve Foundation Paralysis Study, USA)<strong>Prevalence</strong> (Percent <strong>of</strong> population with paralysis due to SCI): 0.4%.Implied SCI prevalence <strong>in</strong> <strong>Canada</strong>: 134,959 cases.Data source: Telephone survey <strong>of</strong> households <strong>in</strong> the United States. Self-reported <strong>in</strong>cidence <strong>and</strong> prevalencewithout cl<strong>in</strong>ical data. Results were generalized to the population <strong>of</strong> the United States although onlyhouseholds with listed telephone numbers were surveyed. Survey response management implicitlydirected non-traumatic cases away from sp<strong>in</strong>al cord <strong>in</strong>jury category. No cl<strong>in</strong>ical verification that sp<strong>in</strong>alcord <strong>in</strong>jury was cause <strong>of</strong> paralysis (def<strong>in</strong>ed as difficulty mov<strong>in</strong>g arms or legs).Conclusions<strong>The</strong> implied <strong>in</strong>cidence <strong>and</strong> prevalence rates for the 2010 Canadian population based on these studies isan estimated annual <strong>in</strong>cidence (Figure 1) <strong>of</strong> tSCI from 351 to 2,800 cases <strong>and</strong> <strong>of</strong> ntSCI from 172 to 2,699cases; an implied prevalence (Figure 2) <strong>of</strong> tSCI from 13,334 to 106,416 <strong>and</strong> <strong>of</strong> ntSCI from 6,883 to 107,967.This implies a range <strong>of</strong> prevalence <strong>of</strong> 360 percent (from 20,217 to 214,383) <strong>of</strong> SCI <strong>in</strong> <strong>Canada</strong>. Note thatthere is no cluster<strong>in</strong>g pattern with<strong>in</strong> these ranges for either <strong>in</strong>cidence or prevalence.<strong>The</strong> <strong>Incidence</strong> <strong>and</strong> <strong>Prevalence</strong> <strong>of</strong> <strong>Sp<strong>in</strong>al</strong> <strong>Cord</strong> <strong>Injury</strong> <strong>in</strong> <strong>Canada</strong>Page 8December 2010
URBAN FUTURESS t r a t e g i c R e s e a r c h t o M a n a g e C h a n g eFigure 13,000Implied Annual <strong>Incidence</strong> <strong>of</strong> SCI <strong>in</strong> <strong>Canada</strong>2,6992,8002,5002,000<strong>Incidence</strong> StudyRange Lower LimitRange Upper Limit1,5001,0001,4911,237No. <strong>of</strong> cases50062075335117200Couris1et al ,2 3 4 5 6Dryden New & Sundararajan, Pickett et al , Wyndaele & Wyndaele,Study 2010et al , 2003 2008 (non-traumatic SCI) 20062006Figure 2150,000Implied Annual <strong>Prevalence</strong> <strong>of</strong> SCI <strong>in</strong> <strong>Canada</strong>125,000134,959107,967 106,416100,00075,000<strong>Prevalence</strong> StudyRange Lower LimitRange Upper Limit50,00059,628No. <strong>of</strong> cases42,93925,00030,26124,81613,3346,88300 1 2 3 4 5 6 7Cahill et al, Couris et al , Dryden New & Sundararajan, Pickett Wyndaele &Study 20082010 et al , 2003 2008 (ntSCI) et al , 2006 Wyndaele, 2006<strong>The</strong> wide ranges <strong>of</strong> implied <strong>in</strong>cidence <strong>and</strong> prevalence are the results <strong>of</strong> the differences <strong>in</strong> def<strong>in</strong>itions,<strong>in</strong>clusions, <strong>and</strong> methodology used <strong>in</strong> the published research, as well as <strong>of</strong> underly<strong>in</strong>g demographic <strong>and</strong>community characteristics. <strong>The</strong> reality that published research generates such ranges <strong>and</strong> differenceswhen applied to <strong>Canada</strong> means that there is not an exist<strong>in</strong>g measure or estimate <strong>of</strong> either the <strong>in</strong>cidenceor prevalence <strong>of</strong> sp<strong>in</strong>al cord <strong>in</strong>jury <strong>in</strong> <strong>Canada</strong> that will meet the needs <strong>of</strong> the Rick Hansen Institute,researchers, or the public <strong>and</strong> its agencies.<strong>The</strong> <strong>Incidence</strong> <strong>and</strong> <strong>Prevalence</strong> <strong>of</strong> <strong>Sp<strong>in</strong>al</strong> <strong>Cord</strong> <strong>Injury</strong> <strong>in</strong> <strong>Canada</strong>Page 9December 2010
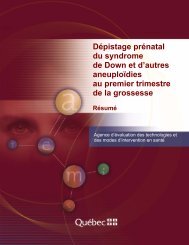
B. Implications for Measurement <strong>in</strong> <strong>Canada</strong>URBAN FUTURESS t r a t e g i c R e s e a r c h t o M a n a g e C h a n g eA number <strong>of</strong> important elements <strong>of</strong> SCI that will <strong>in</strong>fluence the effective measurement <strong>of</strong> <strong>in</strong>cidence <strong>and</strong>prevalence are discussed <strong>in</strong> these published articles:1. <strong>The</strong> <strong>in</strong>cidence <strong>of</strong> SCI is age specific<strong>The</strong> distribution <strong>of</strong> tSCI age specific <strong>in</strong>itial <strong>in</strong>cidence rates (Figure 3, derived from Dryden, 2003) is bimodal,demonstrat<strong>in</strong>g a peak <strong>in</strong> the adolescent <strong>and</strong> younger adult stage <strong>of</strong> the life cycle primarily as a result <strong>of</strong>motor vehicle <strong>and</strong> sport<strong>in</strong>g accidents <strong>and</strong> violence. A second peak <strong>in</strong> the older adult stage (70 years <strong>and</strong>older) is also seen, primarily as a result <strong>of</strong> falls (Pickett et al, 2006; Dryden et al, 2003). Age specific ntSCI<strong>in</strong>itial <strong>in</strong>cidence rates (Figure 4, derived from New & Sundararajan, 2008) <strong>in</strong>crease steadily with age (New& Sundararajan, 2008). <strong>The</strong> mean age <strong>of</strong> <strong>in</strong>cidence <strong>of</strong> ntSCI is significantly higher than that <strong>of</strong> tSCI (New etal, 2010; Guilcher et al, 2010).<strong>The</strong> lifecycle pattern <strong>of</strong> the <strong>in</strong>cidence <strong>of</strong> SCI has significant measurement implications, as it will be essentialto use age-specific rates to separate the effects <strong>of</strong> demographic differences <strong>in</strong> underly<strong>in</strong>g populationsfrom those <strong>of</strong> <strong>in</strong>cidence patterns. It will also have significant implications for both prevention <strong>and</strong>treatment policy, as the ag<strong>in</strong>g <strong>of</strong> <strong>Canada</strong>’s population will shift the <strong>in</strong>cidence population <strong>in</strong>to the olderage groups. Further, the age-specific nature <strong>of</strong> <strong>in</strong>cidence will affect both the extent <strong>and</strong> the composition<strong>of</strong> prevalence. Recent studies have shown an <strong>in</strong>crease <strong>in</strong> the age at <strong>in</strong>jury <strong>and</strong> shifts <strong>in</strong> the mechanism <strong>of</strong><strong>in</strong>jury. Generally, the shift may be represented as be<strong>in</strong>g from young males <strong>in</strong>jured <strong>in</strong> MVA to older peoplefall<strong>in</strong>g (Couris et al, 2010; Pickett et al, 2006), a change that will have significant impacts on the extent <strong>of</strong>SCI, on the characteristics <strong>of</strong> persons liv<strong>in</strong>g with SCI <strong>and</strong> on the entire cl<strong>in</strong>ical care pathway <strong>in</strong> the futuregiven the ag<strong>in</strong>g <strong>of</strong> the Canadian population that will occur <strong>in</strong> the com<strong>in</strong>g decades.Figure 3Initial <strong>Incidence</strong> <strong>of</strong> tSCI by Age <strong>and</strong> Sex (based on Dryden 2003)125100Male75Total<strong>Incidence</strong> Rate (cases per million population)502500-4Age5-910-1415-1920-2425-2930-3435-3940-4445-4950-5455-5960-6465-6970-7475-79Female80-8485-8990+<strong>The</strong> <strong>Incidence</strong> <strong>and</strong> <strong>Prevalence</strong> <strong>of</strong> <strong>Sp<strong>in</strong>al</strong> <strong>Cord</strong> <strong>Injury</strong> <strong>in</strong> <strong>Canada</strong>Page 10December 2010
URBAN FUTURESS t r a t e g i c R e s e a r c h t o M a n a g e C h a n g eFigure 4Initial <strong>Incidence</strong> <strong>of</strong> ntSCI by Age <strong>and</strong> Sex (based on New, 2008)125Male100Total75Female50<strong>Incidence</strong> Rate250Age15-24 25-34 35-44 45-54 55-64 65-74 75-84 85+2. SCI is gender-specificIn all age groups, for both ntSCI <strong>and</strong> tSCI, males are at a higher risk <strong>of</strong> SCI than females (Couris et al,2010; Dryden et al, 2003; Pickett et al, 2006; New et al, 2010; New & Sundararajan, 2008; Wyndaele &Wyndaele, 2006; Guilcher et al, 2010). <strong>The</strong> greatest difference <strong>in</strong> tSCI occurs <strong>in</strong> the 20 -24 <strong>and</strong> 25-29 agegroups, where the <strong>in</strong>itial <strong>in</strong>cidence rates for males is 140 cases per million population compared to 40 permillion for females. <strong>The</strong> greatest difference for ntSCI <strong>in</strong>itial <strong>in</strong>cidence rates occurs <strong>in</strong> the 85+ age groupwhere the <strong>in</strong>cidence rate for males is 127 cases per million population compared to 70 cases per millionpopulation for females. Hav<strong>in</strong>g noted this, it is important to also note that the differences <strong>in</strong> age-specific<strong>in</strong>cidence rates are much greater for tSCI than for ntSCI. Overall, the average male rate for tSCI is 65 casesper million population compared to a rate <strong>of</strong> 24 for females (Dryden et al, 2003); the respective rates forntSCI are only 30 <strong>and</strong> 22 (New & Sundararajan, 2008).3. SCI is geography specific<strong>The</strong> etiology <strong>of</strong> SCI differs between regions <strong>and</strong> countries. For example, although the lead<strong>in</strong>g cause <strong>of</strong> tSCI<strong>in</strong> many countries is motor vehicle accidents, <strong>in</strong> others it is not. For example, <strong>in</strong> Bangladesh the lead<strong>in</strong>gcause <strong>of</strong> tSCI is work-related falls, primarily from trees or while carry<strong>in</strong>g a heavy load on the head, while<strong>in</strong> South Africa it is violence. As further examples <strong>of</strong> geographical differences, mean age <strong>of</strong> <strong>in</strong>jury, male t<strong>of</strong>emale ratios, <strong>and</strong> secondary complications show much different trends <strong>in</strong> low average <strong>in</strong>come countriesthan they do <strong>in</strong> higher <strong>in</strong>come countries (Ackery et al, 2004); rural areas have a higher <strong>in</strong>cidence rate<strong>of</strong> tSCI than urban areas (Dryden et al, 2003); <strong>and</strong> to the extent that workplace <strong>in</strong>juries lead to SCI, thedifferences <strong>in</strong> regions’ employment structures will lead to different <strong>in</strong>cidence rates. In this ve<strong>in</strong>, militaryservice (<strong>and</strong> particularly combat service) carries with it a significant risk <strong>of</strong> SCI <strong>and</strong> hence differences <strong>in</strong>the relative level <strong>of</strong> military engagement will generate differences <strong>in</strong> <strong>in</strong>cidence <strong>of</strong> SCI between countries.While there is scant evidence on ntSCI, differences <strong>in</strong> underly<strong>in</strong>g disease exposures <strong>and</strong> pre-conditionsfor ntSCI will generate differences <strong>in</strong> SCI prevalence <strong>and</strong> <strong>in</strong>cidence between countries. F<strong>in</strong>ally, the generallevel <strong>of</strong> health care <strong>and</strong> life expectancy <strong>in</strong> a region will <strong>in</strong> turn affect the rate <strong>of</strong> survival <strong>of</strong> those with SCI,<strong>and</strong> hence its prevalence.<strong>The</strong> <strong>Incidence</strong> <strong>and</strong> <strong>Prevalence</strong> <strong>of</strong> <strong>Sp<strong>in</strong>al</strong> <strong>Cord</strong> <strong>Injury</strong> <strong>in</strong> <strong>Canada</strong>Page 11December 2010
URBAN FUTURESS t r a t e g i c R e s e a r c h t o M a n a g e C h a n g eIV. Estimates <strong>of</strong> <strong>Incidence</strong> <strong>and</strong> <strong>Prevalence</strong> Based on Best-AvailableEvidence<strong>The</strong> ideal measure <strong>of</strong> <strong>in</strong>cidence <strong>and</strong> prevalence <strong>of</strong> SCI would provide details on age, sex, cause, severity,mobility limitation, region <strong>of</strong> occurrence, <strong>and</strong> place <strong>of</strong> residence. As the previous section showed, thisideal has not yet been atta<strong>in</strong>ed <strong>in</strong> <strong>Canada</strong>; <strong>in</strong> fact, there is not a documented evidenced based estimate <strong>of</strong>either <strong>in</strong>cidence or prevalence for use <strong>in</strong> research or policy development.While this ideal will only be found through future completion <strong>of</strong> comprehensive studies that use st<strong>and</strong>arddef<strong>in</strong>itions accepted by the research community, it is possible to use the exist<strong>in</strong>g studies to demonstratehow the ideal measures might be applied <strong>and</strong> to document an evidence-based estimate <strong>of</strong> <strong>in</strong>cidence<strong>and</strong> prevalence us<strong>in</strong>g what is currently known about them. This is done <strong>in</strong> this section, which comb<strong>in</strong>esthe best available current evidence on the <strong>in</strong>cidence <strong>of</strong> SCI with current estimates <strong>of</strong> the age <strong>and</strong> gendercomposition <strong>of</strong> <strong>Canada</strong>’s population to generate such estimates <strong>of</strong> <strong>in</strong>cidence <strong>and</strong> prevalence <strong>of</strong> SCI for<strong>Canada</strong> <strong>in</strong> 2010.A. Estimate <strong>of</strong> Initial <strong>and</strong> Discharge <strong>Incidence</strong><strong>The</strong> evidence from Dryden et al, 2003 was used as the basis for the estimation <strong>of</strong> the current <strong>in</strong>cidence <strong>of</strong>tSCI as it is the Canadian study with the most complete case ascerta<strong>in</strong>ment. <strong>The</strong> study compared multiplesources <strong>of</strong> data <strong>and</strong> checked that missed <strong>and</strong> duplicate cases were m<strong>in</strong>imized. <strong>The</strong> study also gave genderspecific<strong>in</strong>itial <strong>in</strong>cidence rates for ten year age groups, which is an important factor <strong>in</strong> both determ<strong>in</strong><strong>in</strong>g<strong>in</strong>cidence <strong>and</strong> <strong>in</strong> estimat<strong>in</strong>g prevalence. <strong>The</strong> overall <strong>in</strong>cidence values found <strong>in</strong> this study were also nearthe middle <strong>of</strong> the range <strong>of</strong> implied <strong>in</strong>cidence rates articulated us<strong>in</strong>g published rates <strong>in</strong> other studies <strong>and</strong>Canadian demographic variables.It must be noted that there is no great virtue per se <strong>in</strong> us<strong>in</strong>g a mid-range value, for if the highest valuereflects the most complete <strong>in</strong>formation, it should be used. In this case, however, the high range valuescame from omnibus studies which <strong>in</strong>cluded regions with greatly differ<strong>in</strong>g demographics <strong>and</strong> etiologies,<strong>and</strong> with noted limitations <strong>in</strong> data collection methodology. For these reasons, these rates were not seen asthe most appropriate for use <strong>in</strong> this context. Furthermore, the use <strong>of</strong> a mid-range value does reduce therisk <strong>of</strong> a perception that estimate <strong>of</strong> <strong>in</strong>cidence <strong>and</strong> prevalence are <strong>in</strong>tentionally based on outlier values.<strong>The</strong> tSCI data from Dryden et al, 2003 were vetted with those from Couris et al, 2010 (although this is themost recently published study <strong>and</strong> calculated <strong>in</strong>cidence on the biggest sample size, the study <strong>in</strong>cludedonly patients that were 18 years or older, which is a significant limitation as many tSCIs occur before theage <strong>of</strong> 18) <strong>and</strong> from Pickett et al, 2006 (which was also considered as it gave age-specific <strong>in</strong>cidence rates,but only <strong>in</strong> three age groups <strong>and</strong> which considered only one database without search<strong>in</strong>g a trauma registryto f<strong>in</strong>d missed cases).In us<strong>in</strong>g rates generated for Alberta to estimate <strong>in</strong>cidence at the national level, it is important to commenton differences between the prov<strong>in</strong>ce <strong>and</strong> the national average. Demographically, Alberta is younger (witha median age <strong>of</strong> 35.6 years compared to the national average <strong>of</strong> 39.5) <strong>and</strong> has a greater percentage <strong>of</strong>males (51.1 percent compared to 49.6 percent), someth<strong>in</strong>g that, all other th<strong>in</strong>gs equal, would result <strong>in</strong> agreater number <strong>of</strong> new tSCI cases each year. However, the use <strong>of</strong> age <strong>and</strong> gender specific <strong>in</strong>cidence rateseffectively st<strong>and</strong>ardizes for differences <strong>in</strong> underly<strong>in</strong>g demography, shift<strong>in</strong>g the focus to the behaviouralpatterns that might result <strong>in</strong> differences <strong>in</strong> age-specific rates between Alberta <strong>and</strong> the rest <strong>of</strong> <strong>Canada</strong>.While this may be fruitful ground for further research, the data that are currently available suggest thatsuch differences may not be as great as might be anticipated, as Alberta is both as urban (with 82 percent <strong>of</strong>the population liv<strong>in</strong>g <strong>in</strong> urban areas compared to the national average <strong>of</strong> 80 percent) <strong>and</strong> as metropolitan<strong>The</strong> <strong>Incidence</strong> <strong>and</strong> <strong>Prevalence</strong> <strong>of</strong> <strong>Sp<strong>in</strong>al</strong> <strong>Cord</strong> <strong>Injury</strong> <strong>in</strong> <strong>Canada</strong>Page 12December 2010
URBAN FUTURESS t r a t e g i c R e s e a r c h t o M a n a g e C h a n g e(with 72 percent <strong>of</strong> its population <strong>in</strong> census metropolitan areas compared to a national average <strong>of</strong> 68percent) compared to <strong>Canada</strong> as a whole. On this basis, for the purposes <strong>of</strong> produc<strong>in</strong>g a estimate <strong>of</strong> SCIus<strong>in</strong>g best currently available data, the evidence from Dryden et al, 2003 is an appropriate start<strong>in</strong>g po<strong>in</strong>t.<strong>The</strong> process between this start<strong>in</strong>g po<strong>in</strong>t <strong>and</strong> the f<strong>in</strong>al estimates <strong>of</strong> <strong>in</strong>cidence <strong>of</strong> both tSCI <strong>and</strong> ntSCI byseverity <strong>in</strong>volves a number <strong>of</strong> steps. <strong>The</strong>se steps are described <strong>in</strong> the follow<strong>in</strong>g paragraphs, <strong>and</strong> areoutl<strong>in</strong>ed <strong>in</strong> the follow<strong>in</strong>g flow chart (Figure 5). While the calculations are performed at the s<strong>in</strong>gle years <strong>of</strong>age level, the results are given <strong>in</strong> aggregate <strong>in</strong> this section <strong>and</strong> by 5 year age groups <strong>in</strong> Appendix IV, ‘AgeSpecific Estimates <strong>of</strong> <strong>Incidence</strong> <strong>and</strong> <strong>Prevalence</strong> <strong>of</strong> SCI <strong>in</strong> <strong>Canada</strong>’.Figure 5Initial tSCI<strong>Incidence</strong> RatesInitial tSCI <strong>Incidence</strong>Population 1,785Deaths beforeAdmission 15.8%Deaths dur<strong>in</strong>gHospitalization7.7%tSCIDischarge RatestSCI HospitalDischargePopulation 1,389ParaplegiaLife Expectancy &Mortality CalculationRatio <strong>of</strong> ntSCI to tSCI1.6SCI <strong>Prevalence</strong>85,556Initial ntSCI <strong>Incidence</strong>Population 2,474ntSCI HospitalDischargePopulation 2,286TetraplegiaLife Expectancy &Mortality CalculationInitial ntSCI<strong>Incidence</strong> RatesOther FactorsReduc<strong>in</strong>gDischarge Rate7%Deaths with<strong>in</strong>One Year <strong>of</strong>Diagnosis 0.6%ntSCIDischarge RatesStart<strong>in</strong>g with the ten-year-age-group- <strong>and</strong> sex-specific <strong>in</strong>itial tSCI <strong>in</strong>cidence rates from Dryden et al, 2003,<strong>and</strong> us<strong>in</strong>g the age group rate as the rate for each age with<strong>in</strong> <strong>in</strong> it, an estimate <strong>of</strong> 2010 <strong>in</strong>itial <strong>in</strong>cidence<strong>of</strong> tSCI <strong>in</strong> <strong>Canada</strong> was calculated by multiply<strong>in</strong>g the age- <strong>and</strong> sex-specific rate by the estimated number<strong>of</strong> people <strong>of</strong> each age for both sexes <strong>in</strong> <strong>Canada</strong> provided by the Urban Futures Institute. [See http://www.urbanfutures.com/reports/Report%2074.pdf for details <strong>of</strong> the demographic data base used forthis report.] As the tSCI <strong>in</strong>cidence rates published <strong>in</strong> Dryden et al, 2003, <strong>in</strong>clude deaths before hospitaladmission <strong>and</strong> before hospitalization discharge after <strong>in</strong>jury, the result is an estimate <strong>of</strong> the 2010 <strong>in</strong>itial<strong>in</strong>cidence <strong>of</strong> tSCI <strong>of</strong> 1,785 cases.In addition to this estimate <strong>of</strong> <strong>in</strong>itial <strong>in</strong>cidence, another objective <strong>of</strong> this research project was to producean estimate <strong>of</strong> prevalence, <strong>and</strong> hence it is necessary next to estimate the discharge <strong>in</strong>cidence rate (the<strong>in</strong>itial <strong>in</strong>cidence net <strong>of</strong> deaths occurr<strong>in</strong>g before reach<strong>in</strong>g hospital <strong>and</strong> <strong>in</strong> hospital after <strong>in</strong>itial <strong>in</strong>cidence).Accord<strong>in</strong>g to Dryden et al, 2003, 15.8 percent <strong>of</strong> people who <strong>in</strong>itially suffered tSCI died before hospitaladmission <strong>and</strong> a further 7.7 percent died <strong>in</strong> hospital before discharge. <strong>The</strong> total case fatality rate beforedischarge was 22.2 percent, imply<strong>in</strong>g a 77.8 percent survival rate. This survival rate was applied to theestimated <strong>in</strong>itial <strong>in</strong>cidence <strong>in</strong> each age group to calculate a hospital tSCI discharge population <strong>of</strong> 1,389new cases <strong>of</strong> tSCI <strong>in</strong> 2010 .From the discharge population, age specific tSCI hospital discharge rates were calculated us<strong>in</strong>g the 2010estimated Canadian population. Figure 6 shows the 2010 age specific <strong>in</strong>cidence for tSCI at both the<strong>The</strong> <strong>Incidence</strong> <strong>and</strong> <strong>Prevalence</strong> <strong>of</strong> <strong>Sp<strong>in</strong>al</strong> <strong>Cord</strong> <strong>Injury</strong> <strong>in</strong> <strong>Canada</strong>Page 13December 2010
URBAN FUTURESS t r a t e g i c R e s e a r c h t o M a n a g e C h a n g e<strong>in</strong>cidence <strong>and</strong> discharge levels that resulted from this calculation process. This figure shows the peak<strong>in</strong> <strong>in</strong>cidence <strong>in</strong> the 15 to 29 age group, the results <strong>of</strong> the high <strong>in</strong>cidence rates <strong>in</strong> the age group; as well itshows another, smaller peak <strong>in</strong> the 70 to 84 age group, aga<strong>in</strong> driven by the relative high <strong>in</strong>cidence ratesfor tSCI <strong>in</strong> the older population. Interest<strong>in</strong>gly, there is a third peak between these two, fall<strong>in</strong>g <strong>in</strong> the 40 to54 age groups: as the graph <strong>of</strong> the age distribution <strong>of</strong> the population <strong>of</strong> <strong>Canada</strong> that is also shown on thisfigure <strong>in</strong>dicates, this third local peak is the result <strong>of</strong> the baby boom bulge <strong>in</strong> the population pr<strong>of</strong>ile <strong>in</strong> thisage group <strong>in</strong> spite <strong>of</strong> its relatively low <strong>in</strong>cidence rates.Figure 6Estimated Age-Specific Initial & Discharge tSCI <strong>Incidence</strong>, <strong>Canada</strong>, 20102503,000,000200Age Pr<strong>of</strong>ile <strong>of</strong> 2010 Canadian Population2,500,000150InitialDischarge2,000,0001,500,0001001,000,000Annual cases500500,0000Population0-4Age5-910-1415-1920-2425-2930-3435-3940-4445-4950-5455-5960-6465-6970-7475-7980-8485-8990+<strong>The</strong> next step <strong>in</strong> the calculation process was to estimate the <strong>in</strong>cidence <strong>of</strong> ntSCI. In this context evidencefrom New & Sundararajan, 2008, New et al, 2010; <strong>and</strong> Guilcher et all, 2009, was used. <strong>The</strong> evidencefrom New & Sundararajan 2008 provided measures <strong>of</strong> age- <strong>and</strong> sex-specific non-traumatic SCI <strong>in</strong>cidence<strong>in</strong> a rehabilitation sett<strong>in</strong>g: these rates were used for the age-specific <strong>in</strong>cidence pattern for <strong>Canada</strong>. <strong>The</strong>other two studies were used to estimate the magnitude <strong>of</strong> ntSCI relative to tSCI <strong>in</strong> <strong>Canada</strong>. New et al2010 provides a ratio <strong>of</strong> ntSCI to tSCI <strong>of</strong> 2,241 to 1,361 <strong>in</strong> the rehabilitation context <strong>in</strong> Australia, whichimplies a relative magnitude for discharge <strong>in</strong>cidence <strong>of</strong> ntSCI that is 1.65 times that <strong>of</strong> tSCI. As noted <strong>in</strong> thepublication, these data are drawn from all patients with a primary diagnosis <strong>of</strong> SCI, <strong>and</strong> hence this ratio isderived from the entire <strong>in</strong>cidence population.Guilcher et al 2010 provides a ratio <strong>of</strong> ntSCI to tSCI <strong>of</strong> 1.8 (1,002 cases to 560 cases) for the adult (18-plus)population <strong>in</strong> Ontario. As SCI is significantly age-related, it is necessary to adjust this ratio to <strong>in</strong>clude theyounger population. Us<strong>in</strong>g the age specific propensities for tSCI from Dryden et al 2003 as applied to the2010 Canadian population <strong>in</strong>dicates that, <strong>in</strong> addition to the 560 cases <strong>in</strong>volv<strong>in</strong>g the 18-plus population, itwould be reasonable to anticipate an additional 89 cases <strong>of</strong> tSCI <strong>in</strong> the under-18 population, for a total <strong>of</strong>649 tSCI cases. Similarly, us<strong>in</strong>g the age-specific propensities for ntSCI derived from New & Sundararajan,2008 as applied to the Canadian population, suggests that, <strong>in</strong> addition to the 1,002 cases <strong>of</strong> ntSCI <strong>in</strong>volv<strong>in</strong>gthe 18-plus population, it would be reasonable to anticipate an additional 22 cases <strong>of</strong> ntSCI <strong>in</strong> the under-18population, for a total <strong>of</strong> 1,024 tSCI cases. <strong>The</strong>se exp<strong>and</strong>ed figures imply a ratio <strong>of</strong> ntSCI to tSCI <strong>of</strong> 1.58(1,024 cases to 649 cases). [See Appendix IV <strong>of</strong> this report for the estimated 2010 age specific <strong>in</strong>cidenceused to scale the 18-plus population values from Guilcher et al, 2010 to the entire population.]<strong>The</strong> <strong>Incidence</strong> <strong>and</strong> <strong>Prevalence</strong> <strong>of</strong> <strong>Sp<strong>in</strong>al</strong> <strong>Cord</strong> <strong>Injury</strong> <strong>in</strong> <strong>Canada</strong>Page 14December 2010
URBAN FUTURESS t r a t e g i c R e s e a r c h t o M a n a g e C h a n g eThis value is not materially different from the 1.65 scalar derived from New et al, 2010; as the 1.65 valuewas directly obta<strong>in</strong>ed from data, rather than requir<strong>in</strong>g additional adjustment, it was selected as thescalar used to estimate the magnitude <strong>of</strong> ntSCI <strong>in</strong> <strong>Canada</strong>. When applied to the estimated 1,389 personsdischarged with tSCI based on Dryden et al, 2003, the result is an estimate <strong>of</strong> an <strong>in</strong>cidence <strong>of</strong> 2,286 newcases <strong>of</strong> ntSCI <strong>in</strong> <strong>Canada</strong> <strong>in</strong> 2010. Please note that if the 1.58 scalar was used (based on adjustments toGuilcher et al, 2010) the magnitude <strong>of</strong> discharge ntSCI estimated would be 2,192, only four percent lowerthan the 2,286 used here.In order to estimate the age specific pattern <strong>of</strong> ntSCI discharge <strong>in</strong>cidence (an essential component isestimat<strong>in</strong>g prevalence), the age specific ntSCI rates from New & Sundararajan, 2008 were re-based so thatwhen they were applied to the 2010 population <strong>of</strong> <strong>Canada</strong> by age group the result was the estimate <strong>of</strong>2,286 discharge cases with ntSCI derived from Dryden et al, 2003 <strong>and</strong> New et al, 2010. <strong>The</strong> result was a set<strong>of</strong> estimated age specific ntSCI discharge <strong>in</strong>cidence rates that correspond to the tSCI discharge <strong>in</strong>cidencerates derived from Dryden et al, 2003.<strong>The</strong> f<strong>in</strong>al step <strong>in</strong> the ntSCI <strong>in</strong>cidence calculations was to calculate <strong>in</strong>itial <strong>in</strong>cidence rates from this dischargelevel. It is at this juncture that once aga<strong>in</strong> the dearth <strong>of</strong> research on ntSCI presents significant limitationsto satisfy<strong>in</strong>g the terms <strong>of</strong> reference for this report, which is to provide measures <strong>of</strong> the <strong>in</strong>cidence <strong>and</strong>prevalence <strong>of</strong> SCI <strong>in</strong> <strong>Canada</strong>. <strong>The</strong> issue at h<strong>and</strong> is that while the consequences <strong>of</strong> SCI are essentially thesame for tSCI <strong>and</strong> ntSCI, the paths followed to arrive at these consequences are remarkably different. Inthe case <strong>of</strong> tSCI there is clearly an <strong>in</strong>itial <strong>in</strong>cident —a car accident, a fall, a sport<strong>in</strong>g <strong>in</strong>jury—that permitsmeasurement <strong>of</strong> <strong>in</strong>itial <strong>in</strong>cidence, with subsequent mortality lead<strong>in</strong>g to a lower discharge <strong>in</strong>cidence. <strong>The</strong>identification <strong>of</strong> <strong>in</strong>itial <strong>in</strong>cidence <strong>in</strong> the context <strong>of</strong> tSCI is <strong>of</strong> significant concern, as prevention measuresmust be both targeted <strong>and</strong> evaluated at this po<strong>in</strong>t.In the context <strong>of</strong> non-traumatic sp<strong>in</strong>al cord <strong>in</strong>jury, the concept <strong>of</strong> <strong>in</strong>itial <strong>in</strong>cidence is much different, as ntSCIis largely seen as be<strong>in</strong>g a consequence <strong>of</strong> some other medical condition or disease. As such, prevention<strong>and</strong> measurement have a much different mean<strong>in</strong>g <strong>in</strong> the context <strong>of</strong> ntSCI, fall<strong>in</strong>g perhaps more <strong>in</strong> therealm <strong>of</strong> the measurement <strong>of</strong> the degree to which diagnosis <strong>of</strong>, <strong>and</strong> treatment for, SCI occurs with<strong>in</strong> thecontext <strong>of</strong> these other diseases. Certa<strong>in</strong>ly from a policy perspective, the discharge <strong>in</strong>cidence (the annualnumber <strong>of</strong> new persons with ntSCI who survive <strong>in</strong>itial hospitalization) <strong>and</strong> the prevalence <strong>of</strong> ntSCI (thenumber <strong>of</strong> persons with ntSCI liv<strong>in</strong>g <strong>in</strong> our communities) are the most important figures. Nonetheless, itrema<strong>in</strong>s important to acknowledge that these numbers do not <strong>in</strong>clude all <strong>of</strong> those who suffer ntSCI, <strong>and</strong>that there is a larger number, one that has implications for the cont<strong>in</strong>uum <strong>of</strong> care for both patients <strong>and</strong>service providers, than is <strong>in</strong>dicated by the discharge <strong>in</strong>cidence measures. <strong>The</strong> fact that we may not everbe able to answer the question <strong>of</strong> how many people annually suffer from ntSCI does not preclude theimportance <strong>of</strong> ask<strong>in</strong>g it, as ask<strong>in</strong>g it will change how we look at ntSCI, <strong>and</strong> specifically how we look at ntSCI<strong>in</strong> the contexts <strong>of</strong> diagnosis, rehabilitation, <strong>and</strong> most importantly, care.<strong>The</strong>re is no direct research that provides any <strong>in</strong>sight <strong>in</strong>to the relationship between the total number <strong>of</strong>annual occurrences <strong>of</strong> ntSCI <strong>and</strong> the number <strong>of</strong> people recorded <strong>in</strong> the discharge population. Catz et al,2002 <strong>in</strong>dicates 0.6 percent <strong>of</strong> those diagnosed with ntSCI die with<strong>in</strong> one year <strong>of</strong> diagnosis, a value that isused <strong>in</strong> this report. Additionally, Guilcher et al, 2010, <strong>in</strong>dicate that out <strong>of</strong> the <strong>in</strong>itial admission for <strong>in</strong>patientrehabilitation <strong>of</strong> 1,623 ntSCI cases, 38 percent were excluded <strong>and</strong> out <strong>of</strong> 842 cases <strong>of</strong> tSCI, 33 percent wereexcluded. As the exclusion criteria <strong>in</strong>cluded <strong>in</strong>-hospital mortality, <strong>in</strong>dex discharge after the end <strong>of</strong> studydate, <strong>and</strong> death with<strong>in</strong> one year after discharge, it is possible to hypothesize that the ratio between <strong>in</strong>itial<strong>and</strong> discharge <strong>in</strong>cidence for both ntSCI <strong>and</strong> tSCI are <strong>of</strong> the same order <strong>of</strong> magnitude. However, discussions<strong>of</strong> these relative magnitudes conducted dur<strong>in</strong>g the preparation <strong>of</strong> this report <strong>in</strong>dicated a general themethat the gap between <strong>in</strong>itial <strong>and</strong> discharge <strong>in</strong>cidence for ntSCI, while positive, is not as large as the 23.5percent gap for tSCI. In order to reflect this narrative, a rate one-third <strong>of</strong> that for tSCI was used for ntSCI.<strong>The</strong> <strong>Incidence</strong> <strong>and</strong> <strong>Prevalence</strong> <strong>of</strong> <strong>Sp<strong>in</strong>al</strong> <strong>Cord</strong> <strong>Injury</strong> <strong>in</strong> <strong>Canada</strong>Page 15December 2010
URBAN FUTURESS t r a t e g i c R e s e a r c h t o M a n a g e C h a n g eIn do<strong>in</strong>g so, this is not to assert that this 7.6 percent gap is the correct value, but rather to state that if itis, the consequent ntSCI <strong>in</strong>itial <strong>in</strong>cidence rate can be estimated; it is to assert that specific research <strong>in</strong>tothe <strong>in</strong>cidence <strong>of</strong> ntSCI would be a valuable contribution to our underst<strong>and</strong><strong>in</strong>g <strong>of</strong> this, the most prevalentform <strong>of</strong> SCI <strong>in</strong> <strong>Canada</strong>.Apply<strong>in</strong>g this 7.6 percent marg<strong>in</strong> to the discharge <strong>in</strong>cidence number for ntSCI <strong>in</strong> each age group results <strong>in</strong>an estimate <strong>of</strong> <strong>in</strong>itial ntSCI <strong>in</strong>cidence (2,474 cases <strong>in</strong> 2010) which, when divided by the 2010 population<strong>of</strong> <strong>Canada</strong> by age group, gave an estimate <strong>of</strong> the 2010 <strong>in</strong>itial <strong>in</strong>cidence rated <strong>of</strong> ntSCI by age group. Figure7 shows the resultant estimates <strong>of</strong> the 2010 age specific <strong>in</strong>itial <strong>and</strong> discharge levels for ntSCI <strong>in</strong> <strong>Canada</strong>,which shows that the <strong>in</strong>cidence <strong>of</strong> ntSCI peaks <strong>in</strong> the older age groups, the result <strong>of</strong> the high <strong>in</strong>cidencerates <strong>in</strong> these older age groups <strong>of</strong>fsett<strong>in</strong>g the relatively small proportion <strong>of</strong> the population that is currently<strong>of</strong> these ages. Please note that us<strong>in</strong>g this approach for the calculation <strong>of</strong> <strong>in</strong>itial <strong>in</strong>cidence for ntSCI has noconsequence for the estimates <strong>of</strong> either its discharge <strong>in</strong>cidence or its prevalence.Figure 7Estimated Age-Specific Initial & Discharge ntSCI <strong>Incidence</strong>, <strong>Canada</strong>, 20103503,000,000300Age Pr<strong>of</strong>ile <strong>of</strong> 2010 Canadian PopulationInitial2,500,000250Discharge2,000,0002001501,500,0001001,000,000Annual cases500500,0000Population0-4Age5-910-1415-1920-2425-2930-3435-3940-4445-4950-5455-5960-6465-6970-7475-7980-8485-8990+To summarize, the process used to estimate <strong>in</strong>cidence <strong>and</strong> prevalence results <strong>in</strong> an estimated 2010 <strong>in</strong>itial<strong>in</strong>cidence <strong>of</strong> new sp<strong>in</strong>al cord <strong>in</strong>jury <strong>of</strong> 1,785 cases for tSCI <strong>and</strong> 2,474 cases for ntSCI (4,259 <strong>in</strong> total), <strong>and</strong> adischarge <strong>in</strong>cidence <strong>of</strong> 1,389 cases for tSCI <strong>and</strong> 2,286 cases for ntSCI (3,675 <strong>in</strong> total). <strong>The</strong>se estimates arebased on the follow<strong>in</strong>g assumptions:a) that Dryden et al, 2003 rates are representative <strong>of</strong> tSCI <strong>in</strong>itial <strong>in</strong>cidence by age <strong>in</strong> <strong>Canada</strong>;that the survivorship ratios between <strong>in</strong>itial <strong>and</strong> discharge <strong>in</strong>cidence for tSCI documented <strong>in</strong> Drydenet al, 2003 apply to all age groups;b) that the ratio <strong>of</strong> ntSCI to tSCI presented <strong>in</strong> New et al, 2010 prevails <strong>in</strong> <strong>Canada</strong>;c) that the assumed survivorship ratio between <strong>in</strong>itial <strong>and</strong> discharge <strong>in</strong>cidence for ntSCI is <strong>in</strong> theorder <strong>of</strong> 7.6 percent <strong>and</strong> that it applies for all age groups; <strong>and</strong>d) the general life cycle pattern <strong>of</strong> the <strong>in</strong>cidence <strong>of</strong> ntSCI presented <strong>in</strong> New & Sundararajan, 2008,also prevails <strong>in</strong> <strong>Canada</strong>.<strong>The</strong> <strong>Incidence</strong> <strong>and</strong> <strong>Prevalence</strong> <strong>of</strong> <strong>Sp<strong>in</strong>al</strong> <strong>Cord</strong> <strong>Injury</strong> <strong>in</strong> <strong>Canada</strong>Page 16December 2010
URBAN FUTURESS t r a t e g i c R e s e a r c h t o M a n a g e C h a n g eIn each case, it can be argued that the assumption may not be valid, <strong>and</strong> hence the estimates may notbe accurate. Unfortunately, there is no evidence available to prove or disprove validity – it is the absence<strong>of</strong> evidence that necessitates these assumptions. It is here suggested that, with respect to tSCI, Drydenet al, 2003 is sufficiently robust as to apply generally <strong>in</strong> <strong>Canada</strong>, with the consequences that differencesbetween estimates <strong>and</strong> what actually occurs would not be <strong>in</strong> terms <strong>of</strong> orders <strong>of</strong> magnitude. With respectto ntSCI, the issues <strong>of</strong> under report<strong>in</strong>g <strong>of</strong> ntSCI will have a greater impact on the estimate <strong>of</strong> ntSCI thanthe assumptions made here. Thus the estimated <strong>in</strong>cidence <strong>of</strong> tSCI is likely proximate to what a detailedmeasurement study would produce, while the estimated <strong>in</strong>cidence <strong>of</strong> ntSCI is likely below, <strong>and</strong> perhapswell below, what direct measurement would reveal.B. Estimate <strong>of</strong> <strong>Prevalence</strong><strong>The</strong> estimate <strong>of</strong> prevalence is based on the estimates <strong>of</strong> discharge <strong>in</strong>cidence, on the annual number <strong>of</strong>people by age group who are discharged from hospital with sp<strong>in</strong>al cord <strong>in</strong>jury. As there has never beena census <strong>of</strong> SCI prevalence <strong>in</strong> <strong>Canada</strong>, there is no base on which to develop a current estimate. It istherefore necessary to go as far back as possible <strong>in</strong> history <strong>and</strong> model prevalence forward us<strong>in</strong>g annualdischarge <strong>in</strong>cidence to populate the prevalence group. This demographic acknowledgement was done byus<strong>in</strong>g a database ma<strong>in</strong>ta<strong>in</strong>ed by Urban Futures which conta<strong>in</strong>s estimates <strong>of</strong> the Canadian population, <strong>and</strong><strong>of</strong> its death <strong>and</strong> birth rates, by s<strong>in</strong>gle years <strong>of</strong> age <strong>and</strong> sex, for each year from 1921 to 2010.<strong>The</strong> first step <strong>in</strong> the process <strong>of</strong> estimation <strong>of</strong> prevalence was to estimate historical annual discharge <strong>in</strong>cidenceby apply<strong>in</strong>g the age <strong>and</strong> sex specific discharge <strong>in</strong>cidence rates for tSCI <strong>and</strong> ntSCI discussed <strong>in</strong> the preced<strong>in</strong>gsection to the estimated population <strong>of</strong> <strong>Canada</strong> by age <strong>and</strong> sex each year for the 1921 to 2010 period. Thisannual <strong>in</strong>cidence was then disaggregated <strong>in</strong>to four groups: tSCI with paraplegia <strong>and</strong> tetraplegia (basedon a 43.3% <strong>and</strong> 56.7% split documented <strong>in</strong> Dryden et al, 2003) <strong>and</strong> ntSCI with paraplegia <strong>and</strong> tetraplegia(based on a 69.2% <strong>and</strong> 30.8% split documented <strong>in</strong> New et al, 2010). <strong>Prevalence</strong> for each <strong>of</strong> these fourgroups was estimated us<strong>in</strong>g the general methodology discussed <strong>in</strong> the follow<strong>in</strong>g paragraphs, with the onlydist<strong>in</strong>ction be<strong>in</strong>g the different age specific mortality rates applied to paraplegia <strong>and</strong> tetraplegia. Survivalrates after ntSCI <strong>and</strong> tSCI have been compared <strong>in</strong> the rehabilitation sett<strong>in</strong>g <strong>in</strong> Israel. <strong>The</strong>se studies reportthat survival rates between the two sub-types <strong>of</strong> SCI are similar. When controll<strong>in</strong>g for age at <strong>in</strong>jury, gender,<strong>in</strong>jury severity, <strong>and</strong> level <strong>of</strong> <strong>in</strong>jury, no differences were detected between the mortality risks <strong>of</strong> tSCI <strong>and</strong>ntSCI (Ronen et al, 2004)<strong>The</strong> second step was to account for prevalence by add<strong>in</strong>g the current year’s discharge <strong>in</strong>cidence to thesurvivors <strong>of</strong> the previous year’s prevalence. In the absence <strong>of</strong> a census <strong>of</strong> prevalence at any time <strong>in</strong> thepast, the 1921 discharge <strong>in</strong>cidence population was equated to that year’s prevalence, thereby form<strong>in</strong>g thestart<strong>in</strong>g population to which the subsequent year’s <strong>in</strong>cidence would be added. To determ<strong>in</strong>e the number<strong>of</strong> people who survived to 1922, the age <strong>and</strong> sex specific mortality rate for people liv<strong>in</strong>g with SCI wasestimated. This relied on us<strong>in</strong>g the average life expectancies <strong>of</strong> persons with SCI compared to that <strong>of</strong>persons <strong>of</strong> the same age not liv<strong>in</strong>g with SCI. <strong>The</strong>se data are published for the United States population byage group <strong>in</strong> the NSCISC Annual Statistical Report 2009 (values for these data <strong>in</strong> 5 year age groups werek<strong>in</strong>dly provided by Dr. H. Krueger by e-mail). Data are for five levels <strong>of</strong> sp<strong>in</strong>al cord <strong>in</strong>jury (motor functional,any level; paraplegia, tetraplegia C5-C8; tetraplegia C1-C4; ventilator dependent, any level); as <strong>in</strong>cidenceestimates prepared for this report are aggregates for paraplegia <strong>and</strong> tetraplegia, the life expectancy ratiosfor paraplegia <strong>and</strong> tetraplegia C5-C8 were used for purposes <strong>of</strong> prevalence calculations. Values <strong>of</strong> lifeexpectancies for people liv<strong>in</strong>g with paraplegia <strong>and</strong> tetraplegia were calculated as percentages <strong>of</strong> theaverage life expectancy for persons <strong>of</strong> each age, with the result smoothed to s<strong>in</strong>gle years <strong>of</strong> age us<strong>in</strong>g abest-fit polynomial equation (Figure 8).<strong>The</strong> <strong>Incidence</strong> <strong>and</strong> <strong>Prevalence</strong> <strong>of</strong> <strong>Sp<strong>in</strong>al</strong> <strong>Cord</strong> <strong>Injury</strong> <strong>in</strong> <strong>Canada</strong>Page 17December 2010
URBAN FUTURESS t r a t e g i c R e s e a r c h t o M a n a g e C h a n g eFigure 8Estimated Life Expectancy <strong>of</strong> Paraplegics & Tetraplegicsas a Percentage <strong>of</strong> Average Life Expectancy <strong>of</strong> Persons without SCI75%60%Paraplegic45%% <strong>of</strong> Avg Life Expectancy30%15%0%Tetraplegic0 5 10 15 20 25 30 35 40 45 50 55 60 65 70 75 80 85AgeAs population models use mortality rates rather than life expectancy, it was necessary to estimate theage specific mortality rate for a person with SCI relative to the average mortality rate for a person <strong>of</strong> thesame age without SCI. For example, if the life expectancy <strong>of</strong> a 40 year old with SCI was 70 percent <strong>of</strong> that<strong>of</strong> a person <strong>of</strong> the same age without SCI, then the mortality rates, both current <strong>and</strong> over the rest <strong>of</strong> theirlife, for persons with SCI who were 40 years <strong>of</strong> age must be above those <strong>of</strong> their peers who do not havesp<strong>in</strong>al cord <strong>in</strong>jury. As a wide range <strong>of</strong> different patterns <strong>of</strong> age specific mortality rates could generate a30 percent difference <strong>in</strong> life expectancy, <strong>and</strong> <strong>in</strong> the absence <strong>of</strong> any <strong>in</strong>formation as to the actual path <strong>of</strong>differences <strong>in</strong> age-specific mortality over the lifetime <strong>of</strong> these two peer groups, it was appropriate to takethe simplest approach, which was to scale age-specific mortality for persons with SCI up to match the agespecificdifferences <strong>in</strong> life expectancy. <strong>The</strong> same method was applied for each age group for each year <strong>in</strong>the 1921 to 2010 period: this implicitly assumes that the life expectancy for people with SCI <strong>in</strong>creased atthe same rate <strong>and</strong> followed the same pattern as life expectancy <strong>in</strong>creases for the population as a whole.After apply<strong>in</strong>g the mortality rates to the 1921 discharge <strong>in</strong>cidence population, the survivors were agedone year <strong>and</strong> the 1922 discharge <strong>in</strong>cident population was added to them to result <strong>in</strong> the 1922 prevalence.This calculation process was repeated each year up to 2010. Clearly, start<strong>in</strong>g with the equation <strong>of</strong> the1921 discharge <strong>in</strong>cidence population with 1921 prevalence underestimates that year’s prevalence;however, by cont<strong>in</strong>u<strong>in</strong>g to add the <strong>in</strong>cidence each year, <strong>and</strong> acknowledg<strong>in</strong>g ag<strong>in</strong>g <strong>and</strong> mortality <strong>in</strong> theprevalence group, over time this underestimate will be dim<strong>in</strong>ished. By 1961, for example, most <strong>of</strong> the1921 prevalence group would have left the population <strong>and</strong> hence the magnitude <strong>of</strong> the 1921 start<strong>in</strong>ggroup would have little impact on the estimated prevalence <strong>in</strong> 1961. <strong>The</strong> result <strong>of</strong> this calculation <strong>of</strong>prevalence is a consistent estimate <strong>of</strong> prevalence from 1961 to 2010.On the basis <strong>of</strong> this process, the total prevalence for people liv<strong>in</strong>g with SCI <strong>in</strong> <strong>Canada</strong> <strong>in</strong> 2010 is estimatedto be 85,556 persons (0.25 percent <strong>of</strong> the population). Of this total, 43,974 people (51 percent) wouldhave SCI as a result <strong>of</strong> traumatic causes <strong>and</strong> 41,581 (49 percent) as a result <strong>of</strong> non-traumatic causes. Anestimated 37,313 people would be liv<strong>in</strong>g with tetraplegia (44 percent) <strong>and</strong> 48,243 people (56 percent)liv<strong>in</strong>g with paraplegia. As Figure 9 shows, the prevalence <strong>of</strong> both tSCI <strong>and</strong> ntSCI is concentrated <strong>in</strong> the olderage groups, the result <strong>of</strong> both survivorship <strong>and</strong> the significant <strong>in</strong>cidence <strong>of</strong> SCI <strong>in</strong> the older population,both tSCI as a result <strong>of</strong> falls <strong>and</strong> ntSCI generally.<strong>The</strong> <strong>Incidence</strong> <strong>and</strong> <strong>Prevalence</strong> <strong>of</strong> <strong>Sp<strong>in</strong>al</strong> <strong>Cord</strong> <strong>Injury</strong> <strong>in</strong> <strong>Canada</strong>Page 18December 2010
URBAN FUTURESS t r a t e g i c R e s e a r c h t o M a n a g e C h a n g eFigure 9Estimated Age-Specific <strong>Prevalence</strong> <strong>of</strong> ntSCI <strong>and</strong> tSCI, <strong>Canada</strong>, 20106,0003,000,000Age Pr<strong>of</strong>ile <strong>of</strong> 2010 Canadian Population5,0002,500,0004,000tSCIntSCI2,000,0003,0001,500,0002,0001,000,000Annual cases1,0000500,0000Population0..4Age5..910..1415..1920..2425..2930..3435..3940..4445..4950..5455..5960..6465..6970..7475..7980..8485..8990+Figure 10 shows the estimated levels <strong>of</strong> discharge <strong>in</strong>cidence (right h<strong>and</strong> scale) <strong>and</strong> prevalence (left h<strong>and</strong>scale) <strong>in</strong> <strong>Canada</strong> over the 1961 to 2010 period, both l<strong>in</strong>es reflect<strong>in</strong>g the grow<strong>in</strong>g <strong>and</strong> ag<strong>in</strong>g <strong>of</strong> the Canadianpopulation <strong>and</strong> the <strong>in</strong>creases <strong>in</strong> life expectancies over the past half century. Over the past two decades,for example, annual discharge <strong>in</strong>cidence is estimated to have <strong>in</strong>creased by 41 percent, from 2,607 <strong>in</strong> 1990to 3,675 <strong>in</strong> 2010, <strong>and</strong> annual prevalence by 62 percent, from 52,759 <strong>in</strong> 1990 to 85,556 <strong>in</strong> 2010.Figure 10Estimated <strong>Incidence</strong> & <strong>Prevalence</strong> <strong>of</strong> SCI, <strong>Canada</strong>, 1961 to 2010100,00010,00080,00085,5568,000<strong>Prevalence</strong>60,000<strong>Prevalence</strong> (number <strong>of</strong> persons liv<strong>in</strong>g with SCI)40,0006,0004,0003,675<strong>Incidence</strong>20,000Discharge <strong>Incidence</strong> (number <strong>of</strong> new SCI cases annually)2,000001961196319651967196919711973197519771979198119831985198719891991199319951997199920012003200520072009While not with<strong>in</strong> the specific terms <strong>of</strong> reference for this report, the same methodology that was usedto produce the 2010 estimates can be used to project levels <strong>in</strong> the future given an age- <strong>and</strong> sex-specificprojection <strong>of</strong> <strong>Canada</strong>’s population. Such a projection may be useful for strategic purposes <strong>and</strong> hence ispresented <strong>in</strong> brief summary <strong>in</strong> Appendix V, ‘Projection <strong>of</strong> <strong>in</strong>cidence <strong>and</strong> prevalence <strong>of</strong> sp<strong>in</strong>al cord <strong>in</strong>jury <strong>in</strong><strong>Canada</strong>, 2010 to 2030’.<strong>The</strong> <strong>Incidence</strong> <strong>and</strong> <strong>Prevalence</strong> <strong>of</strong> <strong>Sp<strong>in</strong>al</strong> <strong>Cord</strong> <strong>Injury</strong> <strong>in</strong> <strong>Canada</strong>Page 19December 2010
URBAN FUTURESS t r a t e g i c R e s e a r c h t o M a n a g e C h a n g eTo summarize, us<strong>in</strong>g the best available evidence produces an estimated prevalence <strong>of</strong> 85,556 people liv<strong>in</strong>gwith sp<strong>in</strong>al cord <strong>in</strong>jury <strong>in</strong> <strong>Canada</strong> <strong>in</strong> 2010, with 43,974 people liv<strong>in</strong>g with SCI that resulted from traumaticcauses (19,232 with paraplegia <strong>and</strong> 24,742 with tetraplegia) <strong>and</strong> 41,582 with SCI that resulted from nontraumaticcauses (29,011 with paraplegia <strong>and</strong> 12,582 with tetraplegia). In addition to the assumptionsthat underlie the estimates <strong>of</strong> annual discharge <strong>in</strong>cidence rates used to calculate these estimates, they arealso based on the follow<strong>in</strong>g assumptions:a) that age-specific discharge <strong>in</strong>cidence rates have not changed significantly;b) that the ratio <strong>of</strong> life expectancy <strong>of</strong> persons with SCI to average life expectancies observed <strong>in</strong> theUnited States prevails <strong>in</strong> <strong>Canada</strong> for both tSCI <strong>and</strong> ntSCI; <strong>and</strong>c) that the ratio <strong>of</strong> life expectancy <strong>of</strong> persons with SCI to average life expectancies has generallyrema<strong>in</strong>ed constant <strong>and</strong> hence that the life expectancy <strong>of</strong> persons with SCI has <strong>in</strong>creased at therate <strong>of</strong> the overall average.<strong>The</strong> approach used here captures the changes <strong>in</strong> demography <strong>and</strong> life expectancy that have occurred <strong>in</strong><strong>Canada</strong> over the past decades; what it does not precisely capture are changes that are specific to SCI.While the methodology does assume constant <strong>in</strong>cidence rates over the entire historical period, giventhe shorter life expectancy <strong>of</strong> persons liv<strong>in</strong>g with SCI, compared to the overall average, effectively thispresumed constancy will be for the past twenty to thirty years, someth<strong>in</strong>g that will reduce its impact onthe estimate <strong>of</strong> prevalence. A similar situation will prevail with respect to the use <strong>of</strong> the constant ratio<strong>of</strong> life expectancies. Thus, only if significant change occurred over the past two to three decades woulduse <strong>of</strong> the 2010 rates for earlier period have a major impact on the prevalence measure. As with theestimation <strong>of</strong> <strong>in</strong>cidence, the major concern with the estimation <strong>of</strong> prevalence will lie with likely underreport<strong>in</strong>g<strong>of</strong> ntSCI.Without any published benchmarks, it is not possible to judge how closely these estimates <strong>of</strong> prevalencecorrespond to the actual number <strong>of</strong> people currently liv<strong>in</strong>g with sp<strong>in</strong>al cord <strong>in</strong>jury <strong>in</strong> <strong>Canada</strong>. Hav<strong>in</strong>gnoted this, they do fall with<strong>in</strong> the range <strong>in</strong>dicated by the simple scal<strong>in</strong>g <strong>of</strong> <strong>in</strong>cidence rates based on studiesconducted <strong>in</strong> <strong>Canada</strong> presented <strong>in</strong> Appendix III, <strong>and</strong> below the range <strong>of</strong> values based on studies conducted<strong>in</strong> the United States.It is appropriate that prevalence <strong>and</strong> <strong>in</strong>cidence rates, <strong>and</strong> specifically rates for tSCI, <strong>in</strong> <strong>Canada</strong> are <strong>in</strong>dicatedas be<strong>in</strong>g below those <strong>of</strong> United States, as the underly<strong>in</strong>g pattern <strong>and</strong> level <strong>of</strong> <strong>in</strong>jury <strong>in</strong> the United Statesis significantly different from that <strong>of</strong> <strong>Canada</strong>. As examples, Cahill et al, 2009 (recall that there is a biastowards tSCI <strong>in</strong> this research’s f<strong>in</strong>d<strong>in</strong>gs) found that:a) twenty-four percent <strong>of</strong> the persons liv<strong>in</strong>g with sp<strong>in</strong>al cord <strong>in</strong>jury <strong>in</strong> the United States statedthat a motor vehicle accident was the cause <strong>of</strong> their <strong>in</strong>jury; data from the US NCHS <strong>and</strong> Statistics<strong>Canada</strong> <strong>in</strong>dicate that age-specific motor vehicle mortality rates for young adult males <strong>in</strong> the UnitedStates are 75 percent higher than they are for their peers <strong>in</strong> <strong>Canada</strong>;b) victims <strong>of</strong> violence account for four percent <strong>of</strong> the people liv<strong>in</strong>g with sp<strong>in</strong>al cord <strong>in</strong>jury <strong>in</strong> theUnited States; US NCHS <strong>and</strong> Statistics <strong>Canada</strong> data <strong>in</strong>dicate the age-specific mortality rates as aresult <strong>of</strong> violence for young adult males <strong>in</strong> the United States are six times what they are for theirCanadian peers; <strong>and</strong><strong>The</strong> <strong>Incidence</strong> <strong>and</strong> <strong>Prevalence</strong> <strong>of</strong> <strong>Sp<strong>in</strong>al</strong> <strong>Cord</strong> <strong>Injury</strong> <strong>in</strong> <strong>Canada</strong>Page 20December 2010
URBAN FUTURESS t r a t e g i c R e s e a r c h t o M a n a g e C h a n g ec) six percent <strong>of</strong> the people liv<strong>in</strong>g with SCI <strong>in</strong> the United States were <strong>in</strong>jured dur<strong>in</strong>g military service;data published by the federal governments <strong>of</strong> the two countries <strong>in</strong>dicate that the active militaryforce <strong>of</strong> the United States represents a rate <strong>of</strong> 5 per 1000 population while <strong>Canada</strong>’s represents arate <strong>of</strong> 2 per 1000.To the extent that these differences correspond to differences <strong>in</strong> the <strong>in</strong>cidence rates for traumatic sp<strong>in</strong>alcord <strong>in</strong>jury, it is reasonable to anticipate that <strong>Canada</strong> would demonstrate correspond<strong>in</strong>g lower <strong>in</strong>cidence<strong>and</strong> hence prevalence rates. Thus, based on current evidence, the estimate <strong>of</strong> 85,556 people liv<strong>in</strong>g withSCI is an appropriate start<strong>in</strong>g po<strong>in</strong>t for both further research <strong>and</strong> policy.<strong>The</strong> <strong>Incidence</strong> <strong>and</strong> <strong>Prevalence</strong> <strong>of</strong> <strong>Sp<strong>in</strong>al</strong> <strong>Cord</strong> <strong>Injury</strong> <strong>in</strong> <strong>Canada</strong>Page 21December 2010
V. Conclusions <strong>and</strong> Next StepsA. SummaryURBAN FUTURESS t r a t e g i c R e s e a r c h t o M a n a g e C h a n g eThis report has reviewed the current evidence concerned with the <strong>in</strong>cidence <strong>and</strong> prevalence <strong>of</strong> sp<strong>in</strong>alcord <strong>in</strong>jury <strong>in</strong> <strong>Canada</strong>, commenc<strong>in</strong>g with def<strong>in</strong>itional considerations, followed by a review <strong>of</strong> methodology<strong>and</strong> <strong>of</strong> the major publications that have presented such measures. On the basis <strong>of</strong> this review, thereport presented evidence-based estimates <strong>of</strong> the current levels <strong>of</strong> <strong>in</strong>cidence <strong>and</strong> prevalence <strong>in</strong> <strong>Canada</strong>,<strong>in</strong>dicat<strong>in</strong>g a 2010 annual <strong>in</strong>itial <strong>in</strong>cidence <strong>of</strong> 4,259 cases <strong>of</strong> SCI (1,785 <strong>of</strong> tSCI <strong>and</strong> 2,474 <strong>of</strong> ntSCI), a discharge<strong>in</strong>cidence <strong>of</strong> 3,675 cases (1,388 <strong>of</strong> tSCI <strong>and</strong> 2,287 <strong>of</strong> ntSCI) <strong>and</strong> annual prevalence <strong>of</strong> 85,556 persons liv<strong>in</strong>gwith sp<strong>in</strong>al cord <strong>in</strong>jury (43,974 as a result <strong>of</strong> tSCI <strong>and</strong> 41,582 from ntSCI). For reference purposes, it issuggested that rounded values <strong>of</strong> 4,300 for <strong>in</strong>itial <strong>in</strong>cidence, 3,700 for annual discharge <strong>in</strong>cidence, <strong>and</strong>86,000 for prevalence be used.Both the data <strong>and</strong> the methodology used to produce these estimates have their limitations, as isacknowledged <strong>in</strong> the report. It is not <strong>in</strong>tended that these estimates be regarded as def<strong>in</strong>itive; their purposeis to say “here are estimates <strong>of</strong> <strong>in</strong>cidence <strong>and</strong> prevalence that are documented <strong>and</strong> supported by the bestavailable evidence” which can <strong>and</strong> should be revised to remove their acknowledged shortcom<strong>in</strong>gs whenresearch is done that improves the evidence that is currently available. Hav<strong>in</strong>g said this, these estimatesprovide a valid start<strong>in</strong>g po<strong>in</strong>t <strong>in</strong> the process <strong>of</strong> determ<strong>in</strong><strong>in</strong>g the precise level <strong>of</strong> the extent <strong>of</strong> sp<strong>in</strong>al cord<strong>in</strong>jury <strong>in</strong> <strong>Canada</strong>, <strong>and</strong> as a base for policy until further research has been completed.Before carry<strong>in</strong>g on with the research process, however, it is important for the sp<strong>in</strong>al cord research <strong>and</strong>policy community to decide whether there is an urgent need for dedicat<strong>in</strong>g significant research resourcesto ref<strong>in</strong><strong>in</strong>g these estimates. This context raises three questions, the answers to which will be essential todeterm<strong>in</strong><strong>in</strong>g the direction <strong>of</strong> further research. <strong>The</strong> first question is: “Do the evidence based estimates <strong>of</strong>annual <strong>in</strong>itial <strong>in</strong>cidence <strong>of</strong> 4,300 new cases <strong>of</strong> sp<strong>in</strong>al cord <strong>in</strong>jury <strong>and</strong> a current prevalence <strong>of</strong> 86,000 personsliv<strong>in</strong>g with sp<strong>in</strong>al cord <strong>in</strong>jury provide the RHI, researchers, <strong>and</strong> the community at large with sufficient<strong>in</strong>formation to meet their needs?” If the answer is “yes”, then research resources may be directed toother activities.However, if the answer to this question is “no”, then the other two questions must be addressed. <strong>The</strong>second question is: “Are the limitations perceived <strong>in</strong> these estimates merely technical <strong>and</strong> hence canbe sufficiently ref<strong>in</strong>ed without major research resources, or are they fundamental, <strong>and</strong> hence furthersignificant research is required?” <strong>The</strong> answer to this question will determ<strong>in</strong>e the magnitude <strong>of</strong> theadditional resources that will be required to ultimately get a “yes” as the answer for the first question.If more than simple ref<strong>in</strong>ements will be necessary to obta<strong>in</strong> an affirmative answer to question one, thenthe research focus must be clarified. <strong>The</strong> need for this clarification arises from the reality that the greatestlimitations on data <strong>and</strong> evidence are <strong>in</strong> the context <strong>of</strong> ntSCI. This is <strong>in</strong> part the result <strong>of</strong> the very limitedresearch that has been conducted on ntSCI, but it is also <strong>in</strong> part the result <strong>of</strong> an implicit ambivalence withrespect to the <strong>in</strong>clusion <strong>of</strong> ntSCI <strong>in</strong> SCI research. If further research on the measurement <strong>of</strong> the extent <strong>of</strong>SCI <strong>in</strong> <strong>Canada</strong> is to be pursued, it will also be necessary to answer the third question: “Is the research focusSCI <strong>and</strong> people liv<strong>in</strong>g with SCI regardless <strong>of</strong> cause, or is it a cause specific focus emphasiz<strong>in</strong>g tSCI?” If theanswer is that the focus is all SCI, then the next step <strong>in</strong> research would be a priority focus on ntSCI to br<strong>in</strong>gevidence <strong>in</strong> the Canadian context up to the same level as is available for tSCI. If the answer is a narrowerfocus, then a much different research path would be followed.<strong>The</strong> <strong>Incidence</strong> <strong>and</strong> <strong>Prevalence</strong> <strong>of</strong> <strong>Sp<strong>in</strong>al</strong> <strong>Cord</strong> <strong>Injury</strong> <strong>in</strong> <strong>Canada</strong>Page 22December 2010
URBAN FUTURESS t r a t e g i c R e s e a r c h t o M a n a g e C h a n g eB. Next StepsPresum<strong>in</strong>g that further research is deemed appropriate, there are a number <strong>of</strong> approaches <strong>and</strong> datasources <strong>in</strong> addition to those outl<strong>in</strong>ed <strong>in</strong> the literature review that might be considered. In the <strong>in</strong>terests <strong>of</strong><strong>in</strong>form<strong>in</strong>g the discussion <strong>of</strong> these paths, this report closes with a very brief overview <strong>of</strong> some <strong>of</strong> the datasets/sources that might be consulted.1. Def<strong>in</strong>itionFundamental to mov<strong>in</strong>g the research on the extent <strong>of</strong> SCI <strong>in</strong> <strong>Canada</strong> forward is agreement on def<strong>in</strong>itions,<strong>in</strong> the sense <strong>of</strong> establishment <strong>of</strong> a s<strong>in</strong>gle data-based def<strong>in</strong>ition <strong>of</strong> what constitutes both tSCI <strong>and</strong> ntSCI.Specifically, there must be an accepted st<strong>and</strong>ard list <strong>of</strong> ICD codes that identifies SCI <strong>and</strong> a medicaldef<strong>in</strong>ition for each code. With this list, <strong>in</strong>formation can be extracted from exist<strong>in</strong>g databases, such asa hospital discharge database or the National Trauma Registry, <strong>and</strong> comparable data can be gathered.Furthermore, st<strong>and</strong>ards must be articulated to guide hospital <strong>and</strong> medical cod<strong>in</strong>g that identifies SCI(particularly <strong>in</strong>clusion <strong>of</strong> cases <strong>of</strong> SCI with less severe impairment <strong>and</strong> with cases <strong>of</strong> ntSCI). A challengewill be measurement <strong>of</strong> SCI with temporary motor <strong>and</strong>/or sensory deficit. Note that <strong>in</strong> the articulation<strong>of</strong> these st<strong>and</strong>ards, consideration should be given to applicability <strong>in</strong> both the prevalence <strong>and</strong> <strong>in</strong>cidencecontexts.2. Measurement <strong>of</strong> <strong>Incidence</strong><strong>Incidence</strong> is best measured <strong>in</strong> a hospital context, as it is <strong>in</strong> this context that <strong>in</strong>itial diagnosis <strong>and</strong> treatmentare rout<strong>in</strong>ely performed. Presum<strong>in</strong>g the existence <strong>of</strong> the st<strong>and</strong>ard ICD-based def<strong>in</strong>ition <strong>of</strong> SCI, an accurateway <strong>of</strong> measur<strong>in</strong>g <strong>in</strong>cidence could be through report<strong>in</strong>g from hospital databases. For data on deathsbefore hospital admission, another approach would have to be considered, such as <strong>in</strong>vestigation <strong>of</strong> amedical exam<strong>in</strong>er’s database. However, the Pickett et al study discussed that this method may still presentan under-representation <strong>of</strong> the number <strong>of</strong> people with SCI that die before arrival to hospital.In the specific context <strong>of</strong> tSCI, the National Trauma Registry (NTR), which provides national statistics on<strong>in</strong>jury <strong>in</strong> <strong>Canada</strong>, reported by Canadian Institute for Health Information (CIHI) will prove useful. <strong>The</strong> data<strong>in</strong> the NTR comes from the Hospital Morbidity Database, with additional <strong>in</strong>put from prov<strong>in</strong>cial traumaregistries or trauma centres <strong>in</strong> <strong>Canada</strong>. <strong>The</strong> Hospital Morbidity Database provides hospital dischargestatistics as well as adm<strong>in</strong>istrative, cl<strong>in</strong>ical <strong>and</strong> demographic <strong>in</strong>formation on <strong>in</strong>patient events. <strong>The</strong> NTRcollects all hospital separations (discharges <strong>and</strong> deaths), hence when measur<strong>in</strong>g <strong>in</strong>cidence the <strong>in</strong>clusioncriteria must state clearly whether they <strong>in</strong>clude deaths or discharges alone.Currently, the NTR conta<strong>in</strong>s the M<strong>in</strong>imum Data Set (MDS) which <strong>in</strong>cludes demographic, diagnostic<strong>and</strong> procedural <strong>in</strong>formation on all admissions to acute care hospitals <strong>in</strong> <strong>Canada</strong> due to <strong>in</strong>jury, <strong>and</strong> theComprehensive Data Set which conta<strong>in</strong>s data on patients hospitalized with major trauma (<strong>Injury</strong> SeverityScore <strong>of</strong> 12 or greater). <strong>The</strong> Death Data Set (DDS), which is currently under development, will conta<strong>in</strong> dataon all deaths <strong>in</strong> <strong>Canada</strong> due to <strong>in</strong>jury (http://secure.cihi.ca/cihiweb). Data from the DDS will be beneficialto the SCI research community as it will allow the measurement <strong>of</strong> <strong>in</strong>cidence <strong>in</strong>clud<strong>in</strong>g deaths at the scene<strong>and</strong> before admission to hospital.<strong>Incidence</strong> <strong>of</strong> ntSCI is harder to measure <strong>in</strong> the hospital context as the onset <strong>of</strong> <strong>in</strong>jury may be muchearlier than when the patient is admitted <strong>in</strong>to a hospital for diagnosis. Studies <strong>in</strong> the past have publishedmeasures on <strong>in</strong>cidence based on data from rehabilitation centres (Cosar et al, 2010; New & Sundararajan,2008; Scivoletto et al, 2010; Guilcher et al, 2010), however there are a number <strong>of</strong> limitations with thismethod, as it equates <strong>in</strong>cidence <strong>of</strong> ntSCI with rehabilitation admission. It assumes that all patients witha confirmed ntSCI are referred to rehabilitation, which is untrue as ntSCI is more likely to occur to elderly<strong>The</strong> <strong>Incidence</strong> <strong>and</strong> <strong>Prevalence</strong> <strong>of</strong> <strong>Sp<strong>in</strong>al</strong> <strong>Cord</strong> <strong>Injury</strong> <strong>in</strong> <strong>Canada</strong>Page 23December 2010
URBAN FUTURESS t r a t e g i c R e s e a r c h t o M a n a g e C h a n g epersons (New et al, 2010) <strong>and</strong> as a result <strong>of</strong>ten not transferred to rehabilitation, hence under-estimat<strong>in</strong>gthe ntSCI population. It would be ideal to capture the ntSCI cases based on admission or discharge fromthe location <strong>of</strong> diagnosis.Alternatively, <strong>in</strong>formation from prov<strong>in</strong>cial Medical Services Plans (MSPs) may provide a source <strong>of</strong> data onthe <strong>in</strong>cidence <strong>of</strong> SCI for both ntSCI <strong>and</strong> tSCI. <strong>The</strong>se plans <strong>in</strong>sure medically required services provided byphysicians <strong>and</strong> supplementary health care practitioners, laboratory services, <strong>and</strong> diagnostic procedures.To the extent that these po<strong>in</strong>ts <strong>of</strong> contact between patients <strong>and</strong> the health care system are accuratelycoded <strong>in</strong> MSP account<strong>in</strong>g, it may be possible to tabulate data on the <strong>in</strong>cidence <strong>of</strong> both tSCI <strong>and</strong> ntSCI. Casereviews would be necessary <strong>in</strong> order to confirm etiology <strong>and</strong> level <strong>of</strong> impairment.3. Measurement <strong>of</strong> <strong>Prevalence</strong>Once discharged from hospital, people liv<strong>in</strong>g with sp<strong>in</strong>al cord <strong>in</strong>jury have very diffuse <strong>in</strong>teractions withthe health care <strong>and</strong> medical systems, someth<strong>in</strong>g that makes rout<strong>in</strong>e report<strong>in</strong>g <strong>of</strong> the prevalence <strong>of</strong> SCImuch more difficult. Follow<strong>in</strong>g from the previous section, one approach would be to acknowledge thecomprehensive <strong>and</strong> universal nature <strong>of</strong> the MSPs, <strong>and</strong> rely on their cod<strong>in</strong>g to identify the prevalence <strong>of</strong>SCI. <strong>The</strong> difficulty <strong>in</strong> this regard would be to discern from a specific treatment or prescription sufficient<strong>in</strong>formation to identify SCI. For example, while MSPs cover wheelchairs, it does not identify that SCI ispresent nor does it capture those people liv<strong>in</strong>g with SCI who do not use wheelchairs covered by the MSPs.<strong>The</strong> wide range <strong>of</strong> <strong>in</strong>teractions <strong>of</strong> people liv<strong>in</strong>g with SCI with the health care system, <strong>and</strong> the absence <strong>of</strong>rout<strong>in</strong>e report<strong>in</strong>g suggests that the best direct way to collect data for the measurement <strong>of</strong> prevalencewould be through the use <strong>of</strong> a survey procedure. One survey approach would be to rema<strong>in</strong> with<strong>in</strong> themedical context, <strong>and</strong> survey hospitals, cl<strong>in</strong>ics <strong>and</strong> physicians, on either a universal or r<strong>and</strong>om samplebasis, ask<strong>in</strong>g them to provide data on their <strong>in</strong>teractions with persons liv<strong>in</strong>g with sp<strong>in</strong>al cord <strong>in</strong>jury (if thisapproach was followed, care would have to be exercised to avoid double count<strong>in</strong>g). Alternatively, thesurvey could be directed to people liv<strong>in</strong>g with SCI <strong>and</strong> distributed by way <strong>of</strong> either hospitals, cl<strong>in</strong>ics <strong>and</strong>physicians, or by the prov<strong>in</strong>cial MSPs.Another approach is to directly survey the entire population much as the Cahill et al, 2008 recently didfor the United States population. This is the approach that Statistics <strong>Canada</strong> has historically used <strong>in</strong> itsParticipation <strong>and</strong> Activity Limitation Survey (PALS) which has been distributed to households <strong>in</strong> conjunctionwith the Census: there will be no PALS accompany<strong>in</strong>g the 2011 Census, <strong>and</strong> it will not be possible toadd questions to the voluntary survey <strong>of</strong> households that will replace the compulsory long form Censusquestionnaire.A specific SCI prevalence direct population survey may be conducted (either as a st<strong>and</strong>alone or as part <strong>of</strong>an omnibus survey), however such an approach may not be cost effective as one would have to contactroughly 400 households to identify one person liv<strong>in</strong>g with SCI. To facilitate collection <strong>of</strong> any significantdata, the sample size must be large <strong>and</strong> representative <strong>of</strong> the overall population: the required samplewould need to be even larger if any cross-tabulation <strong>of</strong> characteristics is to be pursued. <strong>The</strong> cost <strong>in</strong>volved<strong>in</strong> this type <strong>of</strong> survey would need to be carefully considered, given that the larger the sample population,the larger the cost <strong>of</strong> such a survey would be. <strong>The</strong> alternative <strong>of</strong> sampl<strong>in</strong>g voluntary participants can<strong>in</strong>troduce strong biases, as those who respond may have different characteristics, whether demographicor other, from those who do not. Another notable limitation <strong>of</strong> total population surveys is <strong>in</strong>accuracy dueto self-report<strong>in</strong>g <strong>of</strong> medical condition with no support<strong>in</strong>g cl<strong>in</strong>ical or medical <strong>in</strong>formation. F<strong>in</strong>ally, suchsurveys do not reach persons liv<strong>in</strong>g <strong>in</strong> <strong>in</strong>stitutions <strong>and</strong> collective dwell<strong>in</strong>gs.<strong>The</strong> <strong>Incidence</strong> <strong>and</strong> <strong>Prevalence</strong> <strong>of</strong> <strong>Sp<strong>in</strong>al</strong> <strong>Cord</strong> <strong>Injury</strong> <strong>in</strong> <strong>Canada</strong>Page 24December 2010
URBAN FUTURESS t r a t e g i c R e s e a r c h t o M a n a g e C h a n g eIf a direct population survey was to be conducted, it would perhaps be most cost effective to recognize theuniversal nature <strong>of</strong> <strong>Canada</strong>’s health care system by f<strong>in</strong>d<strong>in</strong>g a way to conduct a survey to identify peopleliv<strong>in</strong>g with sp<strong>in</strong>al cord <strong>in</strong>jury us<strong>in</strong>g the MSPs. To the extent that results <strong>of</strong> such a survey could be tiedto medical records, this could be a particularly attractive way to proceed. Similarly, the public goodwillheld by the RHI could be used to attract respondents to a population survey: for example, an on-l<strong>in</strong>esurvey document could be posted, supported by public service announcements that directed people tothe survey site. A RHI-centered survey vehicle could also support development <strong>of</strong> the Rick Hansen <strong>Sp<strong>in</strong>al</strong><strong>Cord</strong> <strong>Injury</strong> Registry, either by stream<strong>in</strong>g tSCI respondents to the Registry or by broaden<strong>in</strong>g its scope to<strong>in</strong>clude ntSCI.<strong>The</strong> <strong>Incidence</strong> <strong>and</strong> <strong>Prevalence</strong> <strong>of</strong> <strong>Sp<strong>in</strong>al</strong> <strong>Cord</strong> <strong>Injury</strong> <strong>in</strong> <strong>Canada</strong>Page 25December 2010
URBAN FUTURESS t r a t e g i c R e s e a r c h t o M a n a g e C h a n g eAppendix I: Summaries <strong>of</strong> Reviewed Articles Concern<strong>in</strong>g SCIAll <strong>in</strong>cidence rates <strong>in</strong> this Appendix are number <strong>of</strong> new cases per million population per year <strong>and</strong> prevalencerates are the number <strong>of</strong> people liv<strong>in</strong>g with SCI per million population at a po<strong>in</strong>t <strong>in</strong> time; <strong>in</strong>cidence is thenumber <strong>of</strong> new cases per year <strong>and</strong> prevalence is the number <strong>of</strong> people liv<strong>in</strong>g with SCI dur<strong>in</strong>g the year.1. Couris et al. Characteristics <strong>of</strong> adults with <strong>in</strong>cident traumatic sp<strong>in</strong>al cord <strong>in</strong>jury <strong>in</strong> Ontario,<strong>Canada</strong>, 2010Objective: To provide recent estimates <strong>of</strong> the <strong>in</strong>cidence <strong>of</strong> tSCI <strong>in</strong> adults liv<strong>in</strong>g <strong>in</strong> Ontario, <strong>Canada</strong> forthe fiscal years 2003/04-2006/07. Method: A cohort study. Two primary data sources were census dataprovided by Statistics <strong>Canada</strong> <strong>and</strong> the hospital Discharge Abstract Database (DAD) provided by the CanadianInstitute for Health Information. Results: Majority <strong>of</strong> SCI cases was male. Falls emerged as lead<strong>in</strong>g cause<strong>of</strong> tSCI <strong>in</strong> this study. Fall-<strong>in</strong>duced <strong>in</strong>jury <strong>in</strong>creases with age, while other causes <strong>of</strong> tSCI decrease with age.Incident cases had a mean age <strong>of</strong> 51.3 years.Def<strong>in</strong>ition <strong>of</strong> traumatic SCI:Inclusion: ICD-10-CA Codes (Cervical sp<strong>in</strong>al cord: S14.0, S14.10, S14.11, S14.12, S14.13, S14.18,S14.19; Thoracic sp<strong>in</strong>al cord: S24.0, S24.10, S24.11, S24.12, S24.13, S24.18, S24.19; Lumbarsp<strong>in</strong>al cord: S34.0, S34.10, S4.11, S34.12, S34.13, S34.18, S34.19; Other sp<strong>in</strong>al cord <strong>in</strong>jury: S34.30,S34.38, T06.0, T06.1) (obta<strong>in</strong>ed from Rick Hansen Foundation)Exclusion: Invalid value for gender, less than 18 years <strong>of</strong> age at time <strong>of</strong> admission, previous hospitalstay for SCI with<strong>in</strong> past year, SCI not most responsible diagnosis.Def<strong>in</strong>ition <strong>of</strong> non-traumatic SCI: N/A<strong>Incidence</strong> rates: Average age-st<strong>and</strong>ardized annual rate over 4-year period: 24 per million; In-hospitaldeaths were <strong>in</strong>cluded, but pre-hospital deaths were not, hence <strong>in</strong>cidence falls between <strong>in</strong>itial <strong>and</strong>discharge.Male-female ratio: 2.9:1<strong>Prevalence</strong> rates: N/A Life expectancy: N/AGender Specific tSCI <strong>Incidence</strong> Rates (per million population per year): Mean <strong>in</strong>cident rate: Total 24;Male 36.3; Female 12.1Cause <strong>of</strong> tSCI <strong>in</strong> Men & Women% Male % FemaleFalls 47.8 54.1MVC 23 28.5Struck by/aga<strong>in</strong>st an object 12.9 5.4Other 15.1 8.7<strong>The</strong> etiological differences found <strong>in</strong> this study differ from worldwide trends with respect to the causes<strong>of</strong> SCI, which generally f<strong>in</strong>d MVAs as the lead<strong>in</strong>g source <strong>of</strong> tSCI. This difference can be attributed to the<strong>in</strong>clusion <strong>and</strong> exclusion criteria that the study was conducted under, one <strong>of</strong> them be<strong>in</strong>g that any tSCIpatients under the age <strong>of</strong> 18 were excluded: as tSCI caused by MVA are highest <strong>in</strong> adolescents <strong>and</strong> youngadults, this might expla<strong>in</strong> the different causal pattern discovered. Another feasible explanation waschanges <strong>in</strong> seat belt legislation <strong>and</strong> motor vehicle licens<strong>in</strong>g regulations decreased the number <strong>of</strong> tSCIscaused by motor vehicle accidents <strong>in</strong> the locality <strong>of</strong> study.<strong>The</strong> <strong>Incidence</strong> <strong>and</strong> <strong>Prevalence</strong> <strong>of</strong> <strong>Sp<strong>in</strong>al</strong> <strong>Cord</strong> <strong>Injury</strong> <strong>in</strong> <strong>Canada</strong>Page 26December 2010
URBAN FUTURESS t r a t e g i c R e s e a r c h t o M a n a g e C h a n g e2. Dryden et al, 2003. <strong>The</strong> Epidemiology <strong>of</strong> Traumatic <strong>Sp<strong>in</strong>al</strong> <strong>Cord</strong> <strong>Injury</strong> <strong>in</strong> Alberta, <strong>Canada</strong>,2003Objective: To describe <strong>in</strong>cidence <strong>and</strong> pattern <strong>of</strong> tSCI <strong>in</strong> Alberta, <strong>Canada</strong> from 1 April 1997 to 31 March2000. Method: A population-based study. Data was gathered from: adm<strong>in</strong> data from the Alberta M<strong>in</strong>istry<strong>of</strong> Health <strong>and</strong> Wellness, records from the Alberta Trauma Registry, <strong>and</strong> death certificates from the Office <strong>of</strong>the Medical Exam<strong>in</strong>er. Results: <strong>Incidence</strong> rates for males were higher than for females for all age groups.MVC accounted for majority <strong>of</strong> <strong>in</strong>juries (highest rates <strong>in</strong> 15-29 years), falls next (highest rates <strong>in</strong> peopleolder than 60 years). Rural resident <strong>in</strong>cidence 2.5 times that <strong>of</strong> urban residents.Def<strong>in</strong>ition <strong>of</strong> traumatic SCI:Inclusion: ICD, 9 th revision, Cl<strong>in</strong>ical Modification diagnostic codes: 806.x (fracture <strong>of</strong> the vertebralcolumn with SCI) or 952.x (SCI without evidence <strong>of</strong> sp<strong>in</strong>al bone <strong>in</strong>jury). Injuries <strong>of</strong> cauda equ<strong>in</strong>awere <strong>in</strong>cluded. Cases were <strong>in</strong>cluded if they had an external cause <strong>of</strong> <strong>in</strong>jury code (E code) consistentwith tSCI, <strong>and</strong> were admitted for at least one day to a trauma centre <strong>in</strong> Alberta.Exclusion: Diagnosis <strong>of</strong> a “conversion” disorder (ICD-9-CM code 300.11), patients who susta<strong>in</strong>eda SCI as a result <strong>of</strong> medical/surgical complications ICD-9-CM codes 998.2 (accidental puncture orlaceration dur<strong>in</strong>g a procedure <strong>and</strong> E870.x-E879.x (misadventures to patients dur<strong>in</strong>g surgical <strong>and</strong>medical care).Def<strong>in</strong>ition <strong>of</strong> non-traumatic SCI: N/A<strong>Incidence</strong> rates: Mean <strong>in</strong>cidence rate 52.5; rates are <strong>in</strong>itial <strong>in</strong>cidence rates.tSCI <strong>Incidence</strong> RatesTotal Male FemaleMean <strong>Incidence</strong> rate 52.5 75.4 29.8Mean <strong>Incidence</strong> rateonly <strong>in</strong>clud<strong>in</strong>g thosewho survived tohospitalization44.3 64.9 23.8Male-female ratio: 2.5:1<strong>Prevalence</strong> rates: N/A Life expectancy: N/AUrban <strong>and</strong> Rural tSCI <strong>Incidence</strong> Rates:Urban <strong>and</strong> Rural tSCI <strong>Incidence</strong> RateUrban RuralMean <strong>Incidence</strong> Rate 32.0 72.6Gender Specific Peak <strong>Incidence</strong> Rates:Gender Specific Peak <strong>Incidence</strong> RatesMaleFemalePeak Age Groups 20-29 yrs 70+ yrs 15-19 yrs 70+ yrs<strong>Incidence</strong> Rates 138.0 98.9 65.3 58.7<strong>The</strong> <strong>Incidence</strong> <strong>and</strong> <strong>Prevalence</strong> <strong>of</strong> <strong>Sp<strong>in</strong>al</strong> <strong>Cord</strong> <strong>Injury</strong> <strong>in</strong> <strong>Canada</strong>Page 27December 2010
URBAN FUTURESS t r a t e g i c R e s e a r c h t o M a n a g e C h a n g eEtiology <strong>of</strong> tSCI <strong>in</strong> Alberta:tSCI <strong>Incidence</strong>:Etiology <strong>of</strong> tSCI <strong>in</strong> AlbertaEtiology% <strong>of</strong> TotalMVC 56.4Falls 19.1Sports & Recreation 11.3Struck by object/person 5.3Intentional (Assault/self-<strong>in</strong>flicted) 4.4Other/Unspecified 3.3tSCI <strong>Incidence</strong> RateAge Group Male Female0..4 3.8 1.95..14 22.0 14.415..19 91.0 62.520..29 132.1 38.330..39 71.8 33.540..49 91.0 19.150..59 71.8 15.360..69 57.4 24.970+ 94.7 56.23. Pickett GE et al. Epidemiology <strong>of</strong> Traumatic <strong>Sp<strong>in</strong>al</strong> <strong>Cord</strong> <strong>Injury</strong> <strong>in</strong> <strong>Canada</strong>, 2006Objective: To determ<strong>in</strong>e the <strong>in</strong>cidence, cl<strong>in</strong>ical features <strong>and</strong> treatment <strong>of</strong> tSCI with a particular <strong>in</strong>terest <strong>in</strong>def<strong>in</strong><strong>in</strong>g population at risk for <strong>in</strong>jury <strong>in</strong> south-western Ontario, <strong>Canada</strong> between Jan 1998 <strong>and</strong> Jun 2001.Method: A retrospective, descriptive study identified 151 cases def<strong>in</strong>ed by ICD-9 diagnostic codes after asearch <strong>of</strong> London Health Sciences Centre medical records database. Results: tSCI due to falls are <strong>in</strong>creas<strong>in</strong>g(Table 1.1), but lead<strong>in</strong>g cause <strong>of</strong> tSCIs are motor vehicle accidents (Table 1.2). Mean age <strong>of</strong> patients withtSCI is <strong>in</strong>creas<strong>in</strong>g (Table 1.3), as well as number <strong>of</strong> elderly with tSCI (Table 1.4), so focus <strong>of</strong> preventionprograms should also exp<strong>and</strong> to home safety <strong>and</strong> avoidance <strong>of</strong> falls.Def<strong>in</strong>ition <strong>of</strong> traumatic SCI:Inclusion: ICD-9, Cl<strong>in</strong>ical Modification diagnostic codes 952.x (SCI without evidence <strong>of</strong> sp<strong>in</strong>al bone<strong>in</strong>jury) <strong>and</strong> 806.x (fracture <strong>of</strong> vertebral column with SCI)Exclusion: sp<strong>in</strong>e fracture without SCI, SCI unrelated to trauma (tumour, vascular lesion, iatrogenic<strong>in</strong>jury), neurologic deficit cause by peripheral nerve lesion.Def<strong>in</strong>ition <strong>of</strong> non-traumatic SCI: N/A<strong>Incidence</strong> rates: 3.370 for ages 0-14 years; 41.79 for ages 15-64 years; 50.87 for ages 65 <strong>and</strong> olderMale-female ratio: 3:1; <strong>in</strong>cludes all hospital admissions as rates fall between <strong>in</strong>itial <strong>and</strong> discharge.<strong>Prevalence</strong> rates: N/A Life expectancy: N/AMortality <strong>in</strong> SCI Patients: Percent <strong>of</strong> patients – total 8%; 0-59 years <strong>of</strong> age 5%; 60 + years <strong>of</strong> age 18%Percentage <strong>of</strong> tSCI due to MVA <strong>and</strong> Falls <strong>in</strong> Various Years:Percentage <strong>of</strong> tSCI due to MVA & FallsStudy % <strong>of</strong> tSCI - MVA % <strong>of</strong> tSCI - FallsSekhon & Fehl<strong>in</strong>gs, 2001 40-50 20Pickett et al, 2003 43.2 42.8Pickett et al, 2006 35 31<strong>The</strong> <strong>Incidence</strong> <strong>and</strong> <strong>Prevalence</strong> <strong>of</strong> <strong>Sp<strong>in</strong>al</strong> <strong>Cord</strong> <strong>Injury</strong> <strong>in</strong> <strong>Canada</strong>Page 28December 2010
URBAN FUTURESS t r a t e g i c R e s e a r c h t o M a n a g e C h a n g eCauses <strong>of</strong> tSCI Accord<strong>in</strong>g to Gender: (Note that only 39 females were <strong>in</strong>cluded <strong>in</strong> the study compared to112 males.)Causes <strong>of</strong> tSCI by GenderLead<strong>in</strong>g causes <strong>of</strong> tSCI % <strong>of</strong> Total tSCI % <strong>of</strong> Males % <strong>of</strong> FemalesMotor Vehicle Accidents 35 28.6 53.8Falls 31 30.4 33.2Other Vehicles 12 15.2 2.6Sports/Recreation 9 11.6 2.6Work-related Accident 7 8 2.6Violence 5 5.4 2.6Suicide 1 0.8 2.6Mean Patient Age <strong>in</strong> Various Years:Mean Patient Age <strong>in</strong> Various YearsSourceMeanPatient AgeUS National SCI Database, 1973-79 28.6Major Trauma Outcome Study for US & <strong>Canada</strong>, 1982-89 33.5Sekhon et al, 2001 35.3Pickett et al, 2006 42Percentage <strong>of</strong> tSCI <strong>in</strong> Patients 60 Years or Older <strong>in</strong> Various Years: (Note that the 2003 study attributed itsresults to an <strong>in</strong>crease <strong>in</strong> elderly <strong>in</strong>cidence that was a recent phenomenon not captured <strong>in</strong> earlier reports.)Percentage <strong>of</strong> tSCI <strong>in</strong> Patients Aged 60+SourceObservationPeriod% <strong>of</strong> tSCI <strong>in</strong>Elderly (60+)Sekhon & Fehl<strong>in</strong>gs, 2001 1970s 4.7%Sekhon & Fehl<strong>in</strong>gs, 2001 2001 10.0%US National SCI Database 2000-2006 10.9%Pickett et al, 2003 2003 30.0%Annual <strong>Incidence</strong> <strong>of</strong> Acute Hospitalization for tSCI <strong>in</strong> Ontario:Annual <strong>Incidence</strong> <strong>of</strong> Acute Hospitalization for tSCI <strong>in</strong> OntarioSourceObservationPeriodEstimates<strong>of</strong> <strong>Incidence</strong>Botterell et al, 1975; Tator et al, 1993 1947-1981 13 - 16CIHI, 1996-1999 1996-1999 44 - 50Pickett et al, 2006 1997 21Pickett et al, 2006 2000 49<strong>The</strong> <strong>Incidence</strong> <strong>and</strong> <strong>Prevalence</strong> <strong>of</strong> <strong>Sp<strong>in</strong>al</strong> <strong>Cord</strong> <strong>Injury</strong> <strong>in</strong> <strong>Canada</strong>Page 29December 2010
URBAN FUTURESS t r a t e g i c R e s e a r c h t o M a n a g e C h a n g e4. Guilcher et al. Health care utilization <strong>in</strong> non-traumatic <strong>and</strong> traumatic sp<strong>in</strong>al cord <strong>in</strong>jury: apopulation-based study, 2010Objective: To compare the prevalence <strong>and</strong> impairment characteristics <strong>of</strong> ntSCI <strong>and</strong> tSCI patients admittedto <strong>in</strong>patient rehabilitation; to determ<strong>in</strong>e <strong>and</strong> compare the outpatient health care utilization patterns <strong>of</strong>patients with ntSCI <strong>and</strong> tSCI dur<strong>in</strong>g the first year after their <strong>in</strong>dex <strong>in</strong>patient rehabilitation admission; <strong>and</strong>to determ<strong>in</strong>e factors that are associated with outpatient health care utilizations <strong>in</strong> both ntSCI <strong>and</strong> tSCIpopulations. Method: Used a retrospective cohort design with adm<strong>in</strong>istrative data from the Institutefor Cl<strong>in</strong>ical Evaluative Sciences for the prov<strong>in</strong>ce <strong>of</strong> Ontario for the fiscal years April 2003 to June 2005for patients 18 years <strong>of</strong> age <strong>and</strong> older. Results: Initial admissions for <strong>in</strong>patient rehabilitation were 1,623ntSCI <strong>and</strong> 842 tSCI: the exclusion criteria (<strong>in</strong>-hospital mortality, <strong>in</strong>dex discharge after March 31 2006, <strong>and</strong>died with<strong>in</strong> one year after discharge) reduced the numbers to 1,002 ntSCI cases <strong>and</strong> 560 tSCI cases, a 38percent <strong>and</strong> 33 percent reduction respectively. In the context <strong>of</strong> the adult population <strong>in</strong> rehabilitationcl<strong>in</strong>ics the prevalence <strong>of</strong> ntSCI was 1.8 times that <strong>of</strong> tSCI. Individuals admitted to <strong>in</strong>patient rehabilitationfor ntSCI were older, more likely to be paraplegic, <strong>and</strong> have more co-morbidities than <strong>in</strong>dividuals with tSCI.Def<strong>in</strong>ition <strong>of</strong> traumatic SCI: From National Rehabilitation Report<strong>in</strong>g Systems Rehabilitation Client GroupCodes 04.2.Def<strong>in</strong>ition <strong>of</strong> non-traumatic SCI: From National Rehabilitation Report<strong>in</strong>g Systems Rehabilitation ClientGroup Codes 04.1.<strong>Incidence</strong> rates: N/AMale-female ratio: ntSCI 52.2% to 47.8%; tSCI: 75.4% to 24.6%<strong>Prevalence</strong> rates: N/A Life Expectancy: N/ADemographic Characteristics <strong>of</strong> tSCI <strong>and</strong> ntSCI:ntSCI & ntSCI by CharacteristicsntSCItSCIDemographicMale 523 (52.2%) 422 (75.4%)Female 479 (47.8%) 138 (24.6%)Total 1,002 560Median age 64 46Level <strong>of</strong> <strong>in</strong>juryParaplegia 396 (39.5%) 216 (38.6%)Tetraplegia 186 (18.6%) 264 (47.1%)Other 420 (41.9%) 80 (14.3%)LocationUrban 483 (86.3) 882 (88.0%)5. New & Sundararajan. <strong>Incidence</strong> <strong>of</strong> non-traumatic sp<strong>in</strong>al cord <strong>in</strong>jury <strong>in</strong> Victoria, Australia,2008Objective: To determ<strong>in</strong>e the <strong>in</strong>cidence <strong>of</strong> ntSCI <strong>in</strong> Victoria, Australia between 1 July 2000 <strong>and</strong> 30 June 2006.Method: Population-based study <strong>and</strong> literature review. Data extraction from a state-wide, populationbased,health-adm<strong>in</strong>istration database <strong>of</strong> hospital admissions. Medl<strong>in</strong>e <strong>and</strong> Embase databases weresearched with Ovid search eng<strong>in</strong>e. Results: <strong>Incidence</strong> <strong>of</strong> ntSCI was significantly greater than the reported<strong>in</strong>cidence for tSCI. Men had a higher <strong>in</strong>cidence <strong>of</strong> ntSCI compared to women.<strong>The</strong> <strong>Incidence</strong> <strong>and</strong> <strong>Prevalence</strong> <strong>of</strong> <strong>Sp<strong>in</strong>al</strong> <strong>Cord</strong> <strong>Injury</strong> <strong>in</strong> <strong>Canada</strong>Page 30December 2010
URBAN FUTURESS t r a t e g i c R e s e a r c h t o M a n a g e C h a n g eDef<strong>in</strong>ition <strong>of</strong> traumatic SCI: N/ADef<strong>in</strong>ition <strong>of</strong> non-traumatic SCI:Inclusion: A new onset <strong>of</strong> ntSCI or who developed ntSCI after hospitalization. ICD-10-AM codes:acute paraplegia (G8201, G8203, G8205, G8211, G8213, G8215, G8221, G8223, G8225); acutetetraplegia (G8231, G8233, G8235, G8241, G8243, G8245, G8251, G8253, G8255) or cauda equ<strong>in</strong>asyndrome (G834). Patients with cauda equ<strong>in</strong>a syndrome <strong>and</strong> C prefix (occurred dur<strong>in</strong>g course <strong>of</strong>hospitalization) were <strong>in</strong>cluded. If the P prefix (conditions were present on admission to hospital<strong>and</strong> underwent evaluation <strong>and</strong> treatment) was used, only those patients with the cauda equ<strong>in</strong>aSCI listed as the first <strong>of</strong> the present<strong>in</strong>g diagnoses were <strong>in</strong>cluded.Exclusion: For identified cases, if a previous admission that <strong>in</strong>cluded an SCI was found, thefollow<strong>in</strong>g cases were excluded: ICD-10-AM exclude codes 2000-2006: T91; 1998-2000: G82,G83, S140, S141, S240, S241, S340, S341, S343; ICD-9-AM exclude codes 1996-1998: 336, 340,341, 344, 440, 441, 806, 952, 953, 013.4, 013.5, 192.2, 192.3 198.3, 198.4, 225.3, 225.4, 324.1,721.1, 721.4, 722.7, 907.2, 907.3, 721.91). Patients with congenital conditions caus<strong>in</strong>g ntSCI, orpatients with motor neurone disease or multiple sclerosis were excluded. Non-Victorian residents<strong>and</strong> immigrants <strong>and</strong> residents mov<strong>in</strong>g from other states <strong>of</strong> Australia or overseas after ntSCI wereexcluded.<strong>Prevalence</strong> rates: N/A Life expectancy: N/A<strong>Incidence</strong> rates: In Victoria 11.9; <strong>in</strong> all <strong>of</strong> Australia 11.9; Average age-adjusted <strong>in</strong>cidence rate <strong>of</strong> ntSCI <strong>in</strong>Victoria: adults was 26.3; male 30.5; female 22.9; under age 15 0.7; as study <strong>in</strong>cluded hospital admissions,rates fall between <strong>in</strong>itial <strong>and</strong> discharge.ntSCI <strong>Incidence</strong> RatesAge group Male Female TotalIndexed to15-24 Total15-24 8.2 4 6.1 1.025-34 9.7 8.1 8.9 1.535-44 19.5 13.3 16.4 2.745-54 28.6 16.4 22.4 3.755-64 44.5 31.7 38.1 6.265-74 74.1 53.4 63.4 10.475-84 101.9 77.9 88 14.485+ 127.4 71.5 89.1 14.6ntSCI StudiesAuthor, year published Country Observation Period <strong>Incidence</strong> <strong>of</strong> ntSCIKurtzke, 1975 USA 1969-1972 80M<strong>in</strong>aire, 1978 France 1970-1975 6.6Murray, 1984 USA Not specified, 3 yrs 51.9Bier<strong>in</strong>g-Sorensen, 1990 Denmark 1975-1984 8.3Garcia-Reneses, 1991 Spa<strong>in</strong> 1984-1985 5.1Schonherr, 1996 Netherl<strong>and</strong>s 1982-1993 8.3Maharaj, 1996 Fiji 1985-1994 8.7Caldana, 1998 Italy 1994-1995 42.7New, 2006 Australia 2005 26New, Unpublished Australia (Victoria) 1995-1997 17New, Unpublished Australia 2005 19<strong>The</strong> <strong>Incidence</strong> <strong>and</strong> <strong>Prevalence</strong> <strong>of</strong> <strong>Sp<strong>in</strong>al</strong> <strong>Cord</strong> <strong>Injury</strong> <strong>in</strong> <strong>Canada</strong>Page 31December 2010
URBAN FUTURESS t r a t e g i c R e s e a r c h t o M a n a g e C h a n g e6. New et al. A population-based study compar<strong>in</strong>g traumatic sp<strong>in</strong>al cord <strong>in</strong>jury <strong>and</strong> nontraumaticsp<strong>in</strong>al cord <strong>in</strong>jury us<strong>in</strong>g national rehabilitation database, 2010Objective: To compare the demographic characteristics <strong>and</strong> outcomes between ntSCI <strong>and</strong> tSCI patients<strong>in</strong> Australia between 1 January 2002 <strong>and</strong> 31 December 2006. Method: An open cohort population-basedstudy us<strong>in</strong>g a national database <strong>of</strong> <strong>in</strong>-patient rehabilitation admissions. Results: Total <strong>of</strong> 3610 patients<strong>in</strong>dentified. <strong>The</strong>re were more patients admitted with ntSCI than with tSCI. Compared to tSCI patients,ntSCI patients tended to be older, more likely to be female, have a shorter rehabilitation LOS, <strong>and</strong> be lessdisabled on admission.Def<strong>in</strong>ition <strong>of</strong> traumatic SCI:Inclusion: Australasian Rehabilitation Outcome Centre (AROC) impairment classification codesfor tSCI <strong>and</strong> ntSCI. Exclusion: If admitted for less than 7 days, only for assessment or were a readmission.Def<strong>in</strong>ition <strong>of</strong> non-traumatic SCI:Inclusion: AROC impairment classification codes for tSCI <strong>and</strong> ntSCI. Exclusion: as above<strong>Incidence</strong> rates: N/AMale-female ratio: N/A<strong>Prevalence</strong> rates: N/A Life expectancy: N/ADemographic Characteristics <strong>of</strong> tSCI <strong>and</strong> ntSCI:tSCI & ntSCI by GenderntSCItSCIMale 1,179 (52.5%) 976 (71.6%)Female 1,067 (47.5%) 388 (28.4%)Total 2,246 (62.1%) 1,364 (37.7%)Median age 67 467. Wyndaele <strong>and</strong> Wyndaele. <strong>Incidence</strong>, prevalence <strong>and</strong> epidemiology <strong>of</strong> sp<strong>in</strong>al cord <strong>in</strong>jury:what learns a worldwide literature survey?, 2006Objective: <strong>The</strong> objective was to present an overview <strong>of</strong> data on <strong>in</strong>cidence, prevalence, <strong>and</strong> epidemiology<strong>of</strong> SCI <strong>and</strong> a study <strong>of</strong> their evolution s<strong>in</strong>ce 1977. Method: Literature survey from 1995 onwards, searchedon Pubmed, an onl<strong>in</strong>e digital archive <strong>of</strong> biomedical <strong>and</strong> life sciences journals. Three older studies were<strong>in</strong>cluded for evolutionary data. Results: <strong>Incidence</strong> <strong>and</strong> prevalence had not changed considerably overthe past 30 years. A higher percentage <strong>of</strong> patients with SCI are tetraplegic <strong>and</strong> a higher percentage <strong>of</strong> SCIpatients have a complete lesion.Def<strong>in</strong>ition <strong>of</strong> traumatic SCI:Inclusion: No specifics on classification, however, <strong>in</strong> order to make comparison with prevalenceestimates, only <strong>in</strong>cidence studies based on a post-<strong>in</strong>jury acute care <strong>and</strong> on a rehabilitationpopulation were <strong>in</strong>cluded.Exclusion: SCI cases that died before hospitalizationDef<strong>in</strong>ition <strong>of</strong> non-traumatic SCI: N/A<strong>Incidence</strong> rates: 21 to 254 per millionMale-female ratio: 3.8:1<strong>Prevalence</strong> rates: Range 223-755 per million <strong>in</strong>habitants (data <strong>in</strong>sufficient, not representative globally)<strong>The</strong> <strong>Incidence</strong> <strong>and</strong> <strong>Prevalence</strong> <strong>of</strong> <strong>Sp<strong>in</strong>al</strong> <strong>Cord</strong> <strong>Injury</strong> <strong>in</strong> <strong>Canada</strong>Page 32December 2010
URBAN FUTURESS t r a t e g i c R e s e a r c h t o M a n a g e C h a n g eLife expectancy: Median survival time <strong>of</strong> patients with tSCI between ages 24 <strong>and</strong> 35: 38 years post-<strong>in</strong>jury;43 percent surviv<strong>in</strong>g at least 40 yearsEstimated years <strong>of</strong> life left post-<strong>in</strong>jury at 40 years <strong>of</strong> age: Paraplegia 28.3; low tetraplegia 24.4; hightetraplegia (as reported by NSCISC) 21.5.<strong>Incidence</strong> Rates <strong>of</strong> SCI <strong>in</strong> Studies <strong>in</strong> Various Countries S<strong>in</strong>ce 1995:<strong>Incidence</strong> rates <strong>of</strong> SCI <strong>in</strong> Studies <strong>in</strong> Various Countries, 1995-presentStudyObservationPeriodCountry<strong>Incidence</strong>(per million p/a)Karamehmetoglu et al, 1995 1992 Istanbul, Turkey 21Warren et al, 1995 1991-1993 Alaska, USA 83Sh<strong>in</strong>gu et al, 1995 1990-1992 Japan 40.2Silberste<strong>in</strong> et al, 1995 1989-1993 Novosibirsk, Russia 29.7Maharaj, 1996 1985-1994 Fiji Isl<strong>and</strong>s 18.7Chen et al, 1997 1992-1996 Taiwan 18.8Otom et al, 1997 1988-1993 Jordan 18Karamehmetoglu et al, 1997 1994 Rural areas, Turkey 16.9Mart<strong>in</strong>s et al, 1998 1989-1992 Coimbra, Portugal 254van Asbeck et al, 2000 1994 <strong>The</strong> Netherl<strong>and</strong>s 10.4Karacan et al, 2000 1992 Turkey 12.7Surk<strong>in</strong> et al, 2000 1992-1994 Mississippi, USA 59Burke et al, 2001 Kentucky, Indiana, USA 27.1O'Connor, 2002 1998-1999 Australia 14.5Pickett et al, 2003 1994-1999 Ontario, <strong>Canada</strong> 37.2-46.2Dryden et al, 2003 1997-2000 Alberta, <strong>Canada</strong> 44.3Albert et al, 2005 2000 France 19.4Evolution <strong>of</strong> <strong>Incidence</strong> <strong>and</strong> <strong>Prevalence</strong> <strong>of</strong> SCI <strong>in</strong> North America:Evolution <strong>of</strong> <strong>Incidence</strong> & <strong>Prevalence</strong> <strong>of</strong> SCI <strong>in</strong> North AmericaReview <strong>Incidence</strong> <strong>Prevalence</strong>Tricot, 1981 43.3 -Blumer & Qu<strong>in</strong>e, 1995 46 681Wyndaele & Wyndaele, 2006 51 7558. Cahill et al. Christopher & Dana Reeve Foundation Paralysis Study, 2009Objective: To f<strong>in</strong>d the prevalence <strong>of</strong> paralysis, <strong>in</strong>clud<strong>in</strong>g sp<strong>in</strong>al cord <strong>in</strong>jury <strong>and</strong> other causes <strong>of</strong> paralysis,<strong>in</strong> the United States. Method: R<strong>and</strong>om-digit dial population survey <strong>of</strong> over 33,000 households withtelephones <strong>in</strong> U.S. Results: Approximately 1.84% <strong>of</strong> the U.S. population reported some form <strong>of</strong> paralysis,0.4% <strong>of</strong> the U.S. population reported be<strong>in</strong>g paralyzed due to a SCI.Def<strong>in</strong>ition <strong>of</strong> Paralysis: Paralysis is a central nervous system disorder result<strong>in</strong>g <strong>in</strong> difficulty or <strong>in</strong>ability tomove the upper or lower extremities. For someone to be counted as “paralysed” <strong>in</strong> this national survey,they had to answer yes to the <strong>in</strong>itial screen<strong>in</strong>g question “Do you or does anyone <strong>in</strong> this household haveany difficulty mov<strong>in</strong>g their arms or legs?” <strong>and</strong> give one <strong>of</strong> the follow<strong>in</strong>g causes <strong>of</strong> the difficulty:<strong>Sp<strong>in</strong>al</strong> <strong>Cord</strong> <strong>Injury</strong>, Traumatic Bra<strong>in</strong> <strong>Injury</strong>, Stroke, Poison<strong>in</strong>g, Complications from surgery, ALS/LouGehrig’s, Guilla<strong>in</strong> Barre Syndrome, Multiple Sclerosis, Neur<strong>of</strong>ibromatosis, Epidural <strong>in</strong>fection, Chiarimalformation, Syr<strong>in</strong>gomyelia, Post-Polio Syndrome, <strong>Sp<strong>in</strong>al</strong> Muscular Atrophy, Fredrich’s Ataxia,Transverse Myelitis, Cerebral palsy, or Sp<strong>in</strong>a Bifida.<strong>The</strong> <strong>Incidence</strong> <strong>and</strong> <strong>Prevalence</strong> <strong>of</strong> <strong>Sp<strong>in</strong>al</strong> <strong>Cord</strong> <strong>Injury</strong> <strong>in</strong> <strong>Canada</strong>Page 33December 2010
URBAN FUTURESS t r a t e g i c R e s e a r c h t o M a n a g e C h a n g e<strong>Incidence</strong> rates: N/A Life expectancy: N/AMale-female ratio: N/A<strong>Prevalence</strong> rates: 1.84% <strong>of</strong> U.S. with paralysis, 0.4% <strong>of</strong> U.S. with paralysis as a result <strong>of</strong> SCIGender distribution <strong>of</strong> Respondents report<strong>in</strong>g paralysis due to SCI: 61 percent male; 39 percent femaleReported causes <strong>of</strong> SCI by respondents report<strong>in</strong>g paralysis due to SCI:Reported Causes <strong>of</strong> SCI by thoseReport<strong>in</strong>g Paralysis due to SCICauses <strong>of</strong> SCI% <strong>of</strong>RespondentsMVA 24Accident Work<strong>in</strong>g 28Fall 9Sport<strong>in</strong>g/Recreation Accident 16Victim <strong>of</strong> Violence 4Birth Defect 3Natural Disaster 1Other 6Unknown/No response 9This distribution clearly <strong>in</strong>dicates a strong bias towards traumatic sp<strong>in</strong>al cord <strong>in</strong>jury, with 82 percent<strong>of</strong> causes be<strong>in</strong>g clearly traumatic <strong>and</strong> only 3 percent be<strong>in</strong>g clearly non-traumatic (birth defects). <strong>The</strong>structur<strong>in</strong>g <strong>of</strong> the question, where sp<strong>in</strong>al cord <strong>in</strong>jury was presented as an alternative to other sources <strong>of</strong><strong>in</strong>jury (such as transverse myelitis, multiple sclerosis, chiari malformation, cerebral palsy, ALS/Lou Gehrig’s,neur<strong>of</strong>ibromatosis, syr<strong>in</strong>gomyelia, Fredrich’s Ataxia, or sp<strong>in</strong>a bifida) which can be a cause <strong>of</strong> sp<strong>in</strong>al cord<strong>in</strong>jury, is the likely cause <strong>of</strong> this skewed response.Age Distribution <strong>of</strong> respondents report<strong>in</strong>g paralysis due to SCI:Age Distribution <strong>of</strong> thoseReport<strong>in</strong>g Paralysis due to SCIAge (years)% <strong>of</strong>Respondents0-19 120-29 1230-39 11.540-49 30.150-59 24.960-69 11.170-79 5.780+ 3.7<strong>The</strong> <strong>Incidence</strong> <strong>and</strong> <strong>Prevalence</strong> <strong>of</strong> <strong>Sp<strong>in</strong>al</strong> <strong>Cord</strong> <strong>Injury</strong> <strong>in</strong> <strong>Canada</strong>Page 34December 2010
URBAN FUTURESS t r a t e g i c R e s e a r c h t o M a n a g e C h a n g eAppendix II: Comparison <strong>of</strong> ICD Codes Used In SCI ResearchA table <strong>of</strong> the ICD-Codes used <strong>in</strong> published studies reviewed <strong>in</strong> Appendix II, <strong>and</strong> other selected sources, ispresented <strong>in</strong> Table A.II-1. As a general commentary on this tabulation, it was noted that every study haddifferent <strong>in</strong>clusion <strong>and</strong> exclusion criteria us<strong>in</strong>g ICD-9 or ICD-10 codes. <strong>The</strong> ICD-10 codes are more specific<strong>in</strong> describ<strong>in</strong>g the level <strong>and</strong> severity <strong>of</strong> <strong>in</strong>jury, therefore provid<strong>in</strong>g more <strong>in</strong>formation than the ICD-9 codes.<strong>The</strong>re is general agreement on the codes used <strong>in</strong> the <strong>in</strong>clusion criteria for tSCI, although differences acrossthe studies rema<strong>in</strong>. ICD-9 codes most commonly used were 806.x <strong>and</strong> 952.x for all studies that used ICD-9codes. <strong>The</strong> common ICD-10 codes were: <strong>in</strong>jury to the cervical sp<strong>in</strong>al cord: S14.0, S14.1; thoracic: S24.0,S24.1; lumbar: S34.0, S34.1; other: T06.0, T06.1). Laceration <strong>of</strong> cauda equ<strong>in</strong>a (S34.30) was <strong>in</strong>cluded <strong>in</strong>three <strong>of</strong> the four studies that addressed ICD-10 codes.In this review, only one study (New & Sundararajan) presented ICD codes for non-traumatic SCI, hence noconclusions could be drawn. <strong>The</strong> lack <strong>of</strong> agreement <strong>in</strong> the ICD codes for tSCI, <strong>and</strong> the absence <strong>of</strong> studies <strong>of</strong>ntSCI, calls strongly for discussion <strong>in</strong> the SCI research community to address the limitation these have onpreparation <strong>of</strong> comparable research <strong>and</strong> to develop a code st<strong>and</strong>ard.Table A.II-1: Inclusion <strong>and</strong> Exclusion Criteria for tSCI <strong>and</strong> ntSCI from Multiple SourcesStudy traumatic SCI non-traumatic SCICahill et al, 2009 N/A N/ACouris et al, 2010 Inclusion: ICD-10-CA Codes (Cervical sp<strong>in</strong>al N/Acord: S14.0, S14.10, S14.11, S14.12, S14.13,S14.18, S14.19; Thoracic sp<strong>in</strong>al cord: S24.0,S24.10, S24.11, S24.12, S24.13, S24.18, S24.19;Lumbar sp<strong>in</strong>al cord: S34.0, S34.10, S4.11,S34.12, S34.13, S34.18, S34.19; Other sp<strong>in</strong>alcord <strong>in</strong>jury: S34.30, S34.38, T06.0, T06.1)(obta<strong>in</strong>ed from Rick Hansen Foundation)Dryden et al, 2003Exclusion: Invalid value for gender, less than18 years <strong>of</strong> age at time <strong>of</strong> admission, previoushospital stay for SCI with<strong>in</strong> past year, SCI notmost responsible diagnosisInclusion: ICD, 9 th revision, Cl<strong>in</strong>ical Modificationdiagnostic codes: 806.x (fracture <strong>of</strong> thevertebral column with SCI) or 952.x (SCIwithout evidence <strong>of</strong> sp<strong>in</strong>al bone <strong>in</strong>jury).Injuries <strong>of</strong> cauda equ<strong>in</strong>a were <strong>in</strong>cluded. Caseswere <strong>in</strong>cluded if they had an external cause <strong>of</strong><strong>in</strong>jury code (E code) consistent with tSCI, <strong>and</strong>were admitted for at least one day to a traumacentre <strong>in</strong> Alberta.N/AExclusion: Diagnosis <strong>of</strong> a “conversion” disorder(ICD-9-CM code 300.11)<strong>The</strong> <strong>Incidence</strong> <strong>and</strong> <strong>Prevalence</strong> <strong>of</strong> <strong>Sp<strong>in</strong>al</strong> <strong>Cord</strong> <strong>Injury</strong> <strong>in</strong> <strong>Canada</strong>Page 35December 2010
URBAN FUTURESS t r a t e g i c R e s e a r c h t o M a n a g e C h a n g eJaglal et al, 2009New et al, 2010Inclusion: ICD-10 diagnostic codes: <strong>in</strong>jury tocervical sp<strong>in</strong>al cord (S14.0, S14.10, S14.11,S14.12, S14.13, S14.18, S14.19), <strong>in</strong>jury to thethoracic sp<strong>in</strong>al cord (S24.0, S24.10, S24.11,S24.12, S24.13, S24.18, S24.19), <strong>in</strong>jury tolumbar sp<strong>in</strong>al cord (S34.0, S34.10, S34.11,S34.12, S34.13, S34.18, S34.19), other SCIS34.30 (laceration <strong>of</strong> cauda equ<strong>in</strong>a), T06.0(<strong>in</strong>juries <strong>of</strong> bra<strong>in</strong> <strong>and</strong> cranial nerves with<strong>in</strong>juries <strong>of</strong> nerves <strong>and</strong> sp<strong>in</strong>al cord at neck level)<strong>and</strong> T06.1 (<strong>in</strong>juries <strong>of</strong> nerves <strong>and</strong> sp<strong>in</strong>al cord<strong>in</strong>volv<strong>in</strong>g other multiple body regions).Inclusion: Australasian Rehabilitation OutcomeCentre (AROC) uses separate impairmentclassification codes for tSCI <strong>and</strong> ntSCI.Exclusion: If admitted for less than 7 days, onlyfor assessment or were a readmission.N/AInclusion: Australasian RehabilitationOutcome Centre (AROC) uses separateimpairment classification codes for tSCI<strong>and</strong> ntSCI.Exclusion: If admitted for less than 7days, only for assessment or were areadmission.<strong>The</strong> <strong>Incidence</strong> <strong>and</strong> <strong>Prevalence</strong> <strong>of</strong> <strong>Sp<strong>in</strong>al</strong> <strong>Cord</strong> <strong>Injury</strong> <strong>in</strong> <strong>Canada</strong>Page 36December 2010
URBAN FUTURESS t r a t e g i c R e s e a r c h t o M a n a g e C h a n g eNew &Sundararajan, 2008N/AInclusion: A new onset <strong>of</strong> ntSCI or whodeveloped ntSCI after hospitalization. ICD-10-AM codes: acute paraplegia (G8201,G8203, G8205, G8211, G8213, G8215,G8221, G8223, G8225); acute tetraplegia(G8231, G8233, G8235, G8241, G8243,G8245, G8251, G8253, G8255) or caudaequ<strong>in</strong>a syndrome (G834). Patients withcauda equ<strong>in</strong>a syndrome <strong>and</strong> C prefix(occurred dur<strong>in</strong>g course <strong>of</strong> hospitalization)were <strong>in</strong>cluded. If the P prefix (conditionswere present on admission to hospital<strong>and</strong> underwent evaluation <strong>and</strong> treatment)was used, only those patients with thecauda equ<strong>in</strong>a SCI listed as the first <strong>of</strong> thepresent<strong>in</strong>g diagnoses were <strong>in</strong>cluded.Exclusion: For identified cases, if aprevious admission that <strong>in</strong>cluded an SCIwas found, the follow<strong>in</strong>g cases wereexcluded: ICD-10-AM exclude codes 2000-2006: T91; 1998-2000: G82, G83, S140,S141, S240, S241, S340, S341, S343; ICD-9-AM exclude codes 1996-1998: 336, 340,341, 344, 440, 441, 806, 952, 953, 013.4,013.5, 192.2, 192.3 198.3, 198.4, 225.3,225.4, 324.1, 721.1, 721.4, 722.7, 907.2,907.3, 721.91). Patients with congenitalconditions caus<strong>in</strong>g ntSCI, or patientswith motor neurone disease or multiplesclerosis were excluded. Non-Victorianresidents <strong>and</strong> immigrants <strong>and</strong> residentsmov<strong>in</strong>g from other states <strong>of</strong> Australia oroverseas after ntSCI were excluded.Pickett et al, 2006 Inclusion: ICD-9, Cl<strong>in</strong>ical Modification N/Adiagnostic codes 952.x (SCI without evidence<strong>of</strong> sp<strong>in</strong>al bone <strong>in</strong>jury) <strong>and</strong> 806.x (fracture <strong>of</strong>vertebral column with SCI).Exclusion: sp<strong>in</strong>e fracture without SCI, SCIunrelated to trauma (tumour, vascular lesion,iatrogenic <strong>in</strong>jury), neurologic deficit cause byperipheral nerve lesion.<strong>The</strong> <strong>Incidence</strong> <strong>and</strong> <strong>Prevalence</strong> <strong>of</strong> <strong>Sp<strong>in</strong>al</strong> <strong>Cord</strong> <strong>Injury</strong> <strong>in</strong> <strong>Canada</strong>Page 37December 2010
URBAN FUTURESS t r a t e g i c R e s e a r c h t o M a n a g e C h a n g eWyndaele &Wyndaele, 2006Codes used for ACT(Access to Care/Tim<strong>in</strong>g) request toNational TraumaRegistryPublic HealthAgency <strong>of</strong> <strong>Canada</strong>codes provided toStatistics <strong>Canada</strong>Inclusion: No specifics on classification,however, <strong>in</strong> order to make comparison withprevalence estimates, only <strong>in</strong>cidence studiesbased on a post-<strong>in</strong>jury acute care <strong>and</strong> on arehabilitation population were <strong>in</strong>cluded.Exclusion: SCI cases that died beforehospitalizationInclusion: ICD-9: cervical sp<strong>in</strong>al cord <strong>in</strong>jury(806.0, 806.1, 952.0); thoracic sp<strong>in</strong>al cord<strong>in</strong>jury (806.2, 806.3, 952.1); lumbar sp<strong>in</strong>alcord <strong>in</strong>jury (806.4, 806.5, 952.2, 952.3); caudaequ<strong>in</strong>a sp<strong>in</strong>al cord <strong>in</strong>jury (952.4)ICD-10: cervical sp<strong>in</strong>al cord <strong>in</strong>jury (S14.0,S14.1); thoracic sp<strong>in</strong>al cord <strong>in</strong>jury (S24.0,S24.1); lumbar sp<strong>in</strong>al cord <strong>in</strong>jury (S34.0, S34.1);cauda equ<strong>in</strong>a sp<strong>in</strong>al cord <strong>in</strong>jury (S34.30, S34.38)Other/unspecified: T06.0, T06.1Inclusion: ICD-9: 805-809, 952ICD-10: S12-S12.7, S12.9, S14.0, S14.1, S22.0,S22.1, S24, S24.1, S32.0-32.2, S34, S34.1,T06.0, T06.1, T08, T09.3N/AN/AN/A<strong>The</strong> <strong>Incidence</strong> <strong>and</strong> <strong>Prevalence</strong> <strong>of</strong> <strong>Sp<strong>in</strong>al</strong> <strong>Cord</strong> <strong>Injury</strong> <strong>in</strong> <strong>Canada</strong>Page 38December 2010
URBAN FUTURESS t r a t e g i c R e s e a r c h t o M a n a g e C h a n g eAppendix III: Prelim<strong>in</strong>ary Estimates <strong>of</strong> <strong>Prevalence</strong> <strong>of</strong> <strong>Sp<strong>in</strong>al</strong> <strong>Cord</strong><strong>Injury</strong> <strong>in</strong> <strong>Canada</strong> Us<strong>in</strong>g Published <strong>Incidence</strong> RatesA. Prelim<strong>in</strong>ary Estimates <strong>of</strong> <strong>Prevalence</strong> <strong>of</strong> tSCI <strong>in</strong> <strong>Canada</strong>A simple prelim<strong>in</strong>ary estimate <strong>of</strong> prevalence <strong>of</strong> a condition <strong>in</strong> one population can be calculated byus<strong>in</strong>g the <strong>in</strong>cidence rate <strong>and</strong> the duration <strong>of</strong> the condition for another population. In this section thisapproach is employed to estimate the prevalence <strong>of</strong> tSCI us<strong>in</strong>g published <strong>in</strong>cidence rates for tSCI <strong>and</strong>life expectancies for people liv<strong>in</strong>g with SCI. <strong>The</strong>se examples are presented start<strong>in</strong>g with the simplestapplication, consider<strong>in</strong>g published crude rates, followed by more complex examples us<strong>in</strong>g age <strong>and</strong> genderspecific rates. <strong>The</strong> purpose <strong>of</strong> <strong>in</strong>clud<strong>in</strong>g these calculations <strong>in</strong> this report is to demonstrate what the extent<strong>of</strong> SCI <strong>in</strong> <strong>Canada</strong> would be if the rates that prevail elsewhere prevailed here: what they also demonstrateis that, <strong>in</strong> aggregate, use <strong>of</strong> the published rates provides such a wide range <strong>of</strong> possibilities as to be <strong>of</strong> littlevalue <strong>in</strong> the Canadian context. <strong>The</strong> same analysis is repeated for ntSCI <strong>in</strong> Section B <strong>of</strong> this Appendix.1. Wyndaele & Wyndaele, 2006Wyndaele <strong>and</strong> Wyndaele published a summary <strong>of</strong> crude <strong>in</strong>cidence rates (rates per million population)from a number <strong>of</strong> studies done <strong>in</strong> different countries from 1985 on that have been published s<strong>in</strong>ce 1995:these are listed <strong>in</strong> order <strong>of</strong> <strong>in</strong>creas<strong>in</strong>g <strong>in</strong>cidence rates on Table III-3. <strong>The</strong>se <strong>in</strong>cidence rates were multipliedby Statistics <strong>Canada</strong>’s current estimate <strong>of</strong> the population <strong>of</strong> <strong>Canada</strong> <strong>of</strong> 33,739,000 to estimate what theannual number <strong>of</strong> new cases <strong>of</strong> tSCI would be if the published rates applied <strong>in</strong> <strong>Canada</strong>: the result was arange from a low <strong>of</strong> 351 cases per year to a high <strong>of</strong> 2,800. <strong>The</strong> study also presented an estimate <strong>of</strong> years<strong>of</strong> life left after <strong>in</strong>jury <strong>of</strong> 38 years which was <strong>in</strong> turn applied to the calculated <strong>in</strong>cidence to estimate thecorrespond<strong>in</strong>g level <strong>of</strong> prevalence, which resulted <strong>in</strong> a range from 13,334 to 106,416 persons liv<strong>in</strong>g withsp<strong>in</strong>al cord <strong>in</strong>jury <strong>in</strong> <strong>Canada</strong> today.<strong>Prevalence</strong> <strong>of</strong> tSCI Us<strong>in</strong>g <strong>Incidence</strong> Rates from Selected StudiesCountry<strong>Incidence</strong>(per million p/a)Implied AnnualNew CasesImplied Canadian<strong>Prevalence</strong><strong>The</strong> Netherl<strong>and</strong>s 10.4 351 13,334Turkey 12.7 428 16,283Australia 14.5 489 18,591Rural areas, Turkey 16.9 570 21,668Jordan 18 607 23,078Fiji Isl<strong>and</strong>s 18.7 631 23,976Taiwan 18.8 634 24,104France 19.4 655 24,873Istanbul, Turkey 21 709 26,924Coimbra, Portugal 25.4 857 32,566Kentucky, Indiana, USA 27.1 914 34,745Novosibirsk, Russia 29.7 1,002 38,079Ontario, <strong>Canada</strong> (Range lower limit) 37.2 1,255 47,695Japan 40.2 1,356 51,541Alberta, <strong>Canada</strong> 44.3 1,495 56,798Ontario, <strong>Canada</strong> (Range upper limit) 46.2 1,559 59,234Mississippi, USA 59 1,991 75,645Alaska, USA 83 2,800 106,416<strong>The</strong> <strong>Incidence</strong> <strong>and</strong> <strong>Prevalence</strong> <strong>of</strong> <strong>Sp<strong>in</strong>al</strong> <strong>Cord</strong> <strong>Injury</strong> <strong>in</strong> <strong>Canada</strong>Page 39December 2010
URBAN FUTURESS t r a t e g i c R e s e a r c h t o M a n a g e C h a n g eWyndaele <strong>and</strong> Wyndaele also present two post 1985 studies that provide direct estimates <strong>of</strong> prevalence(<strong>in</strong> contrast to those derived from <strong>in</strong>cidence rates). <strong>The</strong> two prevalence estimates were for North Americafor the years 1995 (681 cases <strong>of</strong> tSCI per million <strong>in</strong>habitants) <strong>and</strong> 2006 (755 per million). Apply<strong>in</strong>g theseprevalence estimates to <strong>Canada</strong>’s estimated population <strong>in</strong> 2010 results <strong>in</strong> estimated prevalence <strong>of</strong> 22,976<strong>and</strong> 25,473 persons, respectively.ReviewEstimated <strong>Prevalence</strong> <strong>of</strong> tSCI, 2010<strong>Prevalence</strong> Rate(per million p/a)Implied Canadian<strong>Prevalence</strong><strong>Incidence</strong>Implied Canadian<strong>Prevalence</strong>Blumer & Qu<strong>in</strong>e, 1995 681 22,976 46 62,080Wyndaele & Wyndaele, 2006 755 25,473 51 68,828Accompany<strong>in</strong>g these prevalence estimates were correspond<strong>in</strong>g <strong>in</strong>cidence rates from the same studies,which when multiplied by <strong>Canada</strong>’s population <strong>and</strong> scaled by rema<strong>in</strong><strong>in</strong>g years <strong>of</strong> life provided <strong>in</strong>cidencebased estimates <strong>of</strong> prevalence <strong>of</strong> 62,080 <strong>and</strong> 68,828 new cases per year that were significantly higher thanthose based on the correspond<strong>in</strong>g directly measured prevalence rates (22,976 <strong>and</strong> 25,473, respectively).<strong>The</strong> variability <strong>of</strong> <strong>in</strong>cidence <strong>and</strong> prevalence shown <strong>in</strong> these studies highlights both the limitations <strong>of</strong> thedata <strong>and</strong> the methodology. On the data side, the study does not specify the <strong>in</strong>clusion <strong>and</strong> exclusion criteriaused to calculate each <strong>in</strong>cidence rate, omitt<strong>in</strong>g, <strong>in</strong> some cases, to even note whether the rate was for tSCI,ntSCI, or both; furthermore, there is no <strong>in</strong>dication whether these are <strong>in</strong>itial or discharge <strong>in</strong>cidence rates.On the methodology side, the underly<strong>in</strong>g demography, economy, <strong>and</strong> social structure <strong>of</strong> these countriesare all different from that <strong>of</strong> <strong>Canada</strong>, clearly limit<strong>in</strong>g the applicability <strong>of</strong> crude rates from one region <strong>in</strong>studies <strong>of</strong> <strong>in</strong>cidence <strong>and</strong> prevalence <strong>in</strong> another.2. Couris et al, 2010Couris et al published gender specific tSCI <strong>in</strong>cidence rates for 2003-2006 for Ontario for the populationaged 18 years <strong>of</strong> age <strong>and</strong> older (age specific rates were charted but no numerical values were given), <strong>and</strong>these rates were then applied to Statistics <strong>Canada</strong>’s estimated male <strong>and</strong> female 2010 Canadian populationaged 18 plus. When scaled by an average <strong>of</strong> 40 years <strong>of</strong> life rema<strong>in</strong><strong>in</strong>g after <strong>in</strong>jury (longer than the 38years <strong>of</strong> Wyndaele & Wyndaele to reflect <strong>Canada</strong>’s longer life expectancies), the result is an estimatedprevalence <strong>of</strong> 24,816 cases <strong>of</strong> tSCI.This estimate is not without its own limitations, as it excludes <strong>in</strong>cidence under the age <strong>of</strong> 18, is limited totSCI, <strong>and</strong> is not specified as to whether it is <strong>in</strong>itial or discharge <strong>in</strong>cidence.Selected Statistics, tSCIMale FemalePopulation aged 18+ 12,698,100 13,178,000<strong>Incidence</strong> rate 36.3 12.1Annual new cases <strong>of</strong> tSCI 461 159Hypothetical average years <strong>of</strong> lifeleft for person with tSCI40 40Gender-specific prevalence 18,438 6,378Implied Canadian <strong>Prevalence</strong> 24,816<strong>The</strong> <strong>Incidence</strong> <strong>and</strong> <strong>Prevalence</strong> <strong>of</strong> <strong>Sp<strong>in</strong>al</strong> <strong>Cord</strong> <strong>Injury</strong> <strong>in</strong> <strong>Canada</strong>Page 40December 2010
URBAN FUTURESS t r a t e g i c R e s e a r c h t o M a n a g e C h a n g e3. Pickett et al, 2006Pickett et al published tSCI rates for southern Ontario at a f<strong>in</strong>er level <strong>of</strong> demography, giv<strong>in</strong>g rates for threeage groups; 0-14 years (an <strong>in</strong>cidence rate <strong>of</strong> 3.37 per million <strong>in</strong> the age group), 15-65 years (41.79), <strong>and</strong> 65years <strong>and</strong> older (50.87). <strong>The</strong> 2010 population <strong>of</strong> <strong>Canada</strong> <strong>in</strong> these three age groups was multiplied by thecorrespond<strong>in</strong>g <strong>in</strong>cidence rates to produce the estimated number <strong>of</strong> annual new cases <strong>of</strong> tSCI <strong>in</strong> each agegroup, result<strong>in</strong>g <strong>in</strong> a total <strong>in</strong>cidence <strong>of</strong> 1,237 new cases.<strong>The</strong> midpo<strong>in</strong>t <strong>of</strong> the 0 to 14 age group is 7.5 years <strong>of</strong> age, <strong>and</strong> <strong>of</strong> the 15 to 64 age group is 40 years <strong>of</strong> age.With an average life expectancy <strong>of</strong> 80 years, the result is an average <strong>of</strong> 72.5 <strong>and</strong> 40 years <strong>of</strong> life rema<strong>in</strong><strong>in</strong>g,respectively. For the 65 <strong>and</strong> older age group, assum<strong>in</strong>g that most tSCI occurs between ages 65 <strong>and</strong> 75, amidpo<strong>in</strong>t <strong>of</strong> 70 years <strong>of</strong> age was used, result<strong>in</strong>g <strong>in</strong> 10 years <strong>of</strong> life left after <strong>in</strong>jury. For each <strong>of</strong> these agegroups, the product <strong>of</strong> annual cases <strong>and</strong> years <strong>of</strong> life left were summed to produce an estimated 2010 tSCIprevalence <strong>of</strong> 43,000:Age<strong>Incidence</strong>rateSelected Statistics, tSCIAnnualnew casesHypotheticalAvg Years <strong>of</strong>Life Post-<strong>in</strong>juryImpliedCanadian<strong>Prevalence</strong>0-14 3.4 19 72.5 1,37115-64 41.8 980 40 39,18365+ 50.9 238 10 2,385Total 42,939This estimate <strong>of</strong> prevalance applies only to tSCI <strong>and</strong> it is not clear whether the <strong>in</strong>cidence rate is an <strong>in</strong>tial ora discharge rate.4. Dryden et al, 2003Dryden et al published gender specific tSCI <strong>in</strong>cidence rates for 1997-2000 for Alberta for st<strong>and</strong>ard agegroups. <strong>The</strong>se rates were applied to Statistics <strong>Canada</strong>’s estimated 2010 male <strong>and</strong> female Canadianpopulations, aggregated <strong>in</strong>to the appropriate age groups, which resulted <strong>in</strong> an <strong>in</strong>cidence estimate <strong>of</strong> 1,762annual new cases <strong>of</strong> tSCI. When scaled by an average <strong>of</strong> life rema<strong>in</strong><strong>in</strong>g after <strong>in</strong>jury estimated accord<strong>in</strong>g toage group, the result was a prevalence <strong>of</strong> 68,916 persons.Selected Statistics, tSCI<strong>Incidence</strong> rate Annual New casesEstimatedImplied Canadian <strong>Prevalence</strong>Average Yrs <strong>of</strong>Life Post-<strong>Injury</strong>Age Group Male Female Male Female Male Female Total0..4 3.8 1.9 4 2 78 282 134 4155..14 22.0 14.4 43 26 70 2,986 1,846 4,83315..19 91.0 62.5 105 69 63 6,608 4,328 10,93620..29 132.1 38.3 314 88 55 17,282 4,826 22,10730..39 71.8 33.5 165 76 45 7,407 3,427 10,83440..49 91.0 19.1 241 50 35 8,451 1,756 10,20750..59 71.8 15.3 171 37 25 4,265 925 5,19160..69 57.4 24.9 92 42 15 1,385 630 2,01570+ 94.7 56.2 132 106 10 1,315 1,063 2,378Total 1,266 496 49,982 18,934 68,916<strong>The</strong> <strong>Incidence</strong> <strong>and</strong> <strong>Prevalence</strong> <strong>of</strong> <strong>Sp<strong>in</strong>al</strong> <strong>Cord</strong> <strong>Injury</strong> <strong>in</strong> <strong>Canada</strong>Page 41December 2010
URBAN FUTURESS t r a t e g i c R e s e a r c h t o M a n a g e C h a n g eThis estimate is limited to tSCI, <strong>in</strong>clud<strong>in</strong>g deaths before hospital admission <strong>and</strong> dur<strong>in</strong>g hospitalization,hence the <strong>in</strong>cidence rates need to be adjusted so that only hospital discharge cases <strong>of</strong> tSCI are <strong>in</strong>cluded <strong>in</strong>the prevalence calculation.B. Prelim<strong>in</strong>ary Estimates <strong>of</strong> <strong>Prevalence</strong> <strong>of</strong> ntSCI <strong>in</strong> <strong>Canada</strong>1. New & Sundararajan, 2008New <strong>and</strong> Sundararajan provided crude <strong>in</strong>cidence rates for both tSCI <strong>and</strong> ntSCI for Australia for 2000 to2006. <strong>The</strong>se values permit use <strong>of</strong> the same methodology used above for values published by Wyndaele<strong>and</strong> Wyndaele <strong>in</strong> the estimation <strong>of</strong> prevalence <strong>of</strong> SCI for <strong>Canada</strong>. With respect to tSCI, the <strong>in</strong>cidence ratesranged from 11.9 to 17 per million population, result<strong>in</strong>g <strong>in</strong> a prevalence range <strong>in</strong> <strong>Canada</strong> from 16,060 to22,943 persons liv<strong>in</strong>g with SCI as a result <strong>of</strong> tSCI:Selected Statistics, tSCIAustralia(lower range)Australia(upper range)Victoria,AustraliaPopulation 33,739,800 33,739,800 33,739,800<strong>Incidence</strong> rate 15 17 12Annual new cases <strong>of</strong> tSCI 506 574 402Hypothetical average years <strong>of</strong>life left for person with tSCI40 40 40<strong>Prevalence</strong> 20,244 22,943 16,060With respect to ntSCI, the <strong>in</strong>cidence rates were provided for two age groups, 0 to 14 <strong>and</strong> 15 <strong>and</strong> older<strong>and</strong> for both males <strong>and</strong> females. When multiplied by the number <strong>of</strong> people <strong>in</strong> the Canadian population <strong>in</strong>these age <strong>and</strong> sex groups, total prevalence <strong>of</strong> 30,261 persons liv<strong>in</strong>g with ntSCI <strong>in</strong> <strong>Canada</strong> was calculated:Selected Statistics, ntSCIPopulation Male Female0-14 years 2,880,900 2,730,70015+ 13,851,400 14,276,800<strong>Incidence</strong> rate0-14 years 0.7 0.715+ 30.5 22.9Annual New0-14 years 2 215+ 422 327Hypothetical average years <strong>of</strong> life left for persons with SCI0-14 years 72.5 72.515+ 40 40Implied Cdn <strong>Prevalence</strong> 17,045 13,216Total <strong>Prevalence</strong> 30,261This study does not <strong>in</strong>dicate whether these are <strong>in</strong>itial or discharge <strong>in</strong>cidence rates <strong>and</strong> is limited to cases<strong>of</strong> ntSCI.This publication also tabulates the results <strong>of</strong> a literature review, similar to that found <strong>in</strong> the Wyndaele& Wyndaele, 2006, for published rates <strong>of</strong> <strong>in</strong>cidence for ntSCI. <strong>The</strong>se rates were applied to the Canadianpopulation <strong>and</strong> scaled by a presumed 40 years <strong>of</strong> rema<strong>in</strong><strong>in</strong>g life expectancy to estimate the prevalence <strong>of</strong>ntSCI <strong>in</strong> <strong>Canada</strong> should the published rates apply here, result<strong>in</strong>g <strong>in</strong> a range from 6,883 to 107,967.<strong>The</strong> <strong>Incidence</strong> <strong>and</strong> <strong>Prevalence</strong> <strong>of</strong> <strong>Sp<strong>in</strong>al</strong> <strong>Cord</strong> <strong>Injury</strong> <strong>in</strong> <strong>Canada</strong>Page 42December 2010
URBAN FUTURESS t r a t e g i c R e s e a r c h t o M a n a g e C h a n g eCountrySelected Statistics, ntSCI<strong>Incidence</strong><strong>of</strong> ntSCIAnnualNew CasesImpliedCanadian<strong>Prevalence</strong>Spa<strong>in</strong> 5.1 172 6,883France 6.6 223 8,907Denmark 8.3 280 11,202Netherl<strong>and</strong>s 8.3 280 11,202Fiji 8.7 294 11,741Australia (Victoria) 17 574 22,943Australia 19 641 25,642Australia 26 877 35,089Italy 42.7 1,441 57,628USA 51.9 1,751 70,044USA 80 2,699 107,967As with Wyndaele <strong>and</strong> Wyndaele, this 2006 publication does not <strong>in</strong>dicate whether the <strong>in</strong>cidence rates are<strong>in</strong>itial or discharge, nor what is <strong>in</strong>cluded <strong>in</strong> ntSCI <strong>in</strong> each <strong>of</strong> the underly<strong>in</strong>g studies. <strong>The</strong> range <strong>of</strong> prevalenceestimates that result from these calculations is largely the product <strong>of</strong> data differences <strong>and</strong> underly<strong>in</strong>gdifferences <strong>in</strong> demography, economy, social structure, <strong>and</strong> health care <strong>in</strong> the countries studied.C. Prelim<strong>in</strong>ary Estimates <strong>of</strong> <strong>Prevalence</strong> <strong>of</strong> SCI <strong>in</strong> <strong>Canada</strong> - Cahill et al, 2009Cahill et al provide an estimate <strong>of</strong> prevalence <strong>of</strong> sp<strong>in</strong>al cord <strong>in</strong>jury <strong>in</strong> the United States <strong>of</strong> 0.4 percent<strong>of</strong> the population; given <strong>Canada</strong>’s estimated 2010 population, such a prevalence rate would result <strong>in</strong> aprevalence estimate <strong>of</strong> 134,959 persons with sp<strong>in</strong>al cord <strong>in</strong>jury liv<strong>in</strong>g <strong>in</strong> <strong>Canada</strong>. In this study, what is<strong>in</strong>cluded as sp<strong>in</strong>al cord <strong>in</strong>jury is primarily the result <strong>of</strong> traumatic <strong>in</strong>jury, with 82 percent <strong>of</strong> the causes<strong>of</strong> sp<strong>in</strong>al cord <strong>in</strong>jury specifically identified as traumatic, three percent from birth <strong>in</strong>jury (<strong>and</strong> hence nontraumatic),<strong>and</strong> 15 percent from other <strong>and</strong> unknown causes.<strong>The</strong> <strong>Incidence</strong> <strong>and</strong> <strong>Prevalence</strong> <strong>of</strong> <strong>Sp<strong>in</strong>al</strong> <strong>Cord</strong> <strong>Injury</strong> <strong>in</strong> <strong>Canada</strong>Page 43December 2010
URBAN FUTURESS t r a t e g i c R e s e a r c h t o M a n a g e C h a n g eAppendix IV: Age specific estimates <strong>of</strong> <strong>in</strong>cidence <strong>and</strong> prevalence <strong>of</strong>sp<strong>in</strong>al cord <strong>in</strong>jury <strong>in</strong> <strong>Canada</strong>, 2010This appendix presents the detailed results <strong>of</strong> the calculations <strong>of</strong> the estimates <strong>of</strong> <strong>in</strong>cidence <strong>and</strong> prevalencefollow<strong>in</strong>g the methodology described <strong>in</strong> Section IV <strong>of</strong> this report.Total Population, <strong>Canada</strong>, 2010Age Male Female Total0..4 952,454 905,954 1,858,4085..9 926,149 873,002 1,799,15110..14 993,572 944,098 1,937,67115..19 1,125,036 1,076,326 2,201,36220..24 1,184,776 1,131,400 2,316,17625..29 1,204,094 1,170,958 2,375,05230..34 1,148,825 1,144,085 2,292,91035..39 1,154,231 1,138,513 2,292,74440..44 1,222,287 1,198,868 2,421,15545..49 1,404,910 1,384,959 2,789,86950..54 1,305,819 1,311,470 2,617,28955..59 1,129,037 1,160,225 2,289,26260..64 965,953 1,004,079 1,970,03265..69 714,031 758,170 1,472,20070..74 522,597 587,678 1,110,27475..79 413,813 502,637 916,45080..84 285,194 406,630 691,82385..89 150,999 279,886 430,88590+ 169,478 159,125 328,603Total 16,973,254 17,138,063 34,111,316Estimated Age- <strong>and</strong> Gender-specific <strong>Incidence</strong> Rates <strong>of</strong> tSCI & ntSCI, <strong>Canada</strong>, 2010AgetSCI Initial ntSCI Initial tSCI Discharge ntSCI DischargeMale Female Male Female Female Female Male Female0..4 3.8 1.9 2.1 2.1 3.0 1.5 2.0 2.05..9 22 14.4 2.1 2.1 17.1 11.2 2.0 2.010..14 22 14.4 2.1 2.1 17.1 11.2 2.0 2.015..19 91 62.5 25.0 12.2 70.8 48.6 23.1 11.320..24 132.1 38.3 25.0 12.2 102.8 29.8 23.1 11.325..29 132.1 38.3 29.6 24.7 102.8 29.8 27.3 22.830..34 71.8 33.5 29.6 24.7 55.9 26.1 27.3 22.835..39 71.8 33.5 59.4 40.5 55.9 26.1 54.9 37.440..44 91 19.2 59.4 40.5 70.8 14.9 54.9 37.445..49 91 19.2 87.1 50.0 70.8 14.9 80.5 46.250..54 71.8 15.3 87.1 50.0 55.9 11.9 80.5 46.255..59 71.8 15.3 135.6 96.6 55.9 11.9 125.3 89.260..64 57.4 24.9 135.6 96.6 44.7 19.4 125.3 89.265..69 57.4 24.9 225.8 162.7 44.7 19.4 208.6 150.370..74 94.7 56.2 225.8 162.7 73.7 43.7 208.6 150.375..79 94.7 56.2 310.5 237.3 73.7 43.7 286.9 219.380..84 94.7 56.2 310.5 237.3 73.7 43.7 286.9 219.385..89 94.7 56.2 388.1 217.8 73.7 43.7 358.6 201.390+ 94.7 56.2 388.1 217.8 73.7 43.7 358.6 201.3*based on Dryden*based on New’s ratio<strong>The</strong> <strong>Incidence</strong> <strong>and</strong> <strong>Prevalence</strong> <strong>of</strong> <strong>Sp<strong>in</strong>al</strong> <strong>Cord</strong> <strong>Injury</strong> <strong>in</strong> <strong>Canada</strong>Page 44December 2010
URBAN FUTURESS t r a t e g i c R e s e a r c h t o M a n a g e C h a n g eEstimated Age-, Gender-, Severity-specific <strong>Incidence</strong> <strong>of</strong> tSCI <strong>and</strong> ntSCI, <strong>Canada</strong>, 2010*AgetSCI Initial ntSCI Initial tSCI Discharge ntSCI DischargeMale Female Male Female Paraplegia Tetraplegia Parapelegia Tetraplegia0..4 4 2 2 2 2 2 3 15..9 20 13 2 2 11 15 2 110..14 22 14 2 2 12 16 3 115..19 102 67 28 13 57 75 26 1220..24 157 43 30 14 67 88 28 1225..29 159 45 36 29 69 90 41 1830..34 82 38 34 28 41 53 40 1835..39 83 38 69 46 41 53 73 3340..44 111 23 73 49 45 59 77 3445..49 128 27 122 69 52 68 123 5550..54 94 20 114 66 38 50 115 5155..59 81 18 153 112 33 44 170 7560..64 55 25 131 97 27 35 146 6565..69 41 19 161 123 20 26 182 8170..74 49 33 118 96 28 36 137 6175..79 39 28 128 119 23 30 158 7180..84 27 23 89 97 17 22 118 5385..89 14 16 59 61 10 13 76 3490+ 16 9 66 35 8 11 64 29Total 1,284 501 1,415 1,059 601 787 1,582 704*Data may not sum to totals due to round<strong>in</strong>g.Estimated Age- <strong>and</strong> Severity-Specific <strong>Prevalence</strong> <strong>of</strong> SCI <strong>in</strong> <strong>Canada</strong>, 2010AgetSCI ntSCI TotalPara Tetra Total Para Tetra Total Para Tetra Total0..4 5 7 12 7 3 11 13 10 235..9 41 54 95 19 8 27 60 62 12310..14 102 134 236 33 15 48 135 149 28415..19 310 406 716 121 54 175 431 460 89120..24 616 806 1,422 253 113 366 869 919 1,78825..29 778 1,019 1,797 359 160 519 1,138 1,179 2,31730..34 1,257 1,646 2,903 643 286 929 1,900 1,932 3,83235..39 1,271 1,663 2,935 858 382 1,240 2,130 2,045 4,17540..44 1,542 2,016 3,559 1,273 566 1,839 2,815 2,583 5,39845..49 2,051 2,679 4,731 2,011 894 2,905 4,062 3,573 7,63550..54 2,148 2,802 4,950 2,463 1,094 3,557 4,611 3,896 8,50755..59 2,040 2,656 4,696 2,851 1,265 4,116 4,891 3,920 8,81260..64 1,879 2,437 4,316 3,191 1,412 4,603 5,070 3,849 8,92065..69 1,482 1,909 3,390 3,128 1,379 4,506 4,609 3,287 7,89770..74 1,208 1,537 2,745 3,053 1,335 4,388 4,261 2,873 7,13475..79 933 1,165 2,097 2,842 1,227 4,070 3,775 2,392 6,16780..84 941 1,127 2,068 3,175 1,329 4,504 4,116 2,456 6,57285..89 447 500 947 1,842 730 2,572 2,289 1,230 3,51990+ 179 179 357 887 319 1,206 1,066 497 1,563Total 19,232 24,742 43,974 29,011 12,571 41,582 48,243 37,313 85,556<strong>The</strong> <strong>Incidence</strong> <strong>and</strong> <strong>Prevalence</strong> <strong>of</strong> <strong>Sp<strong>in</strong>al</strong> <strong>Cord</strong> <strong>Injury</strong> <strong>in</strong> <strong>Canada</strong>Page 45December 2010
URBAN FUTURESS t r a t e g i c R e s e a r c h t o M a n a g e C h a n g eAppendix V: Projection <strong>of</strong> <strong>in</strong>cidence <strong>and</strong> prevalence <strong>of</strong> sp<strong>in</strong>al cord<strong>in</strong>jury <strong>in</strong> <strong>Canada</strong>, 2010 to 2030Urban Futures ma<strong>in</strong>ta<strong>in</strong>s a projection series for the Canadian population by s<strong>in</strong>gle years <strong>of</strong> age <strong>and</strong> sex,as well as for their accompany<strong>in</strong>g projected birth <strong>and</strong> death rates for the period 2010 to 2060. <strong>The</strong> dataon the <strong>in</strong>cidence <strong>and</strong> characteristics <strong>of</strong> SCI <strong>and</strong> the methodology used to estimate the 2010 prevalence <strong>of</strong>sp<strong>in</strong>al cord <strong>in</strong>jury <strong>in</strong> <strong>Canada</strong> was used with this projection series to estimate the future level <strong>of</strong> <strong>in</strong>cidence<strong>and</strong> prevalence <strong>of</strong> sp<strong>in</strong>al cord <strong>in</strong>jury <strong>in</strong> <strong>Canada</strong>. <strong>The</strong>se estimates <strong>of</strong> future levels are subject to the sameassumptions that are described for the 2010 estimates. Given the constancy <strong>of</strong> the sp<strong>in</strong>al cord rates used,the chang<strong>in</strong>g extent <strong>of</strong> sp<strong>in</strong>al cord <strong>in</strong>jury shown <strong>in</strong> these projections is the result <strong>of</strong> the changes <strong>in</strong> theunderly<strong>in</strong>g demography <strong>of</strong> <strong>Canada</strong>.Figure V-1Estimated <strong>Incidence</strong> & <strong>Prevalence</strong> <strong>of</strong> SCI, <strong>Canada</strong>, 2010 to 2030(Dryden, 2003)140,00014,000120,000120,99812,000100,00080,00060,00085,556<strong>Prevalence</strong>(number persons liv<strong>in</strong>g with SCI)10,0008,0006,0005,0033,67540,00020,000Discharge <strong>Incidence</strong>(number <strong>of</strong> new SCI cases annually)4,0002,00000201020112012201320142015201620172018201920202021202220232024202520262027202820292030Both <strong>in</strong>cidence <strong>and</strong> prevalence <strong>of</strong> SCI is projected to <strong>in</strong>crease over the next two decades, with <strong>in</strong>itial<strong>in</strong>cidence <strong>in</strong>creas<strong>in</strong>g from the 4,300 cases estimated for 2010 to 5,800 cases <strong>in</strong> 2030; discharge <strong>in</strong>cidence<strong>in</strong>creas<strong>in</strong>g from the 3,700 cases estimated for 2010 to 5,000 <strong>in</strong> 2010; <strong>and</strong> prevalence <strong>in</strong>creas<strong>in</strong>g fromthe estimated 86,000 persons liv<strong>in</strong>g with SCI <strong>in</strong> 2010 to 121,000 persons <strong>in</strong> 2030. <strong>The</strong> greatest <strong>in</strong>creasewould be <strong>in</strong> the number <strong>of</strong> people with SCI as a result <strong>of</strong> ntSCI (post<strong>in</strong>g an <strong>in</strong>crease <strong>of</strong> 52 percent), <strong>and</strong> <strong>in</strong>the number with tetraplegia (an <strong>in</strong>crease <strong>of</strong> 43 percent). <strong>The</strong> number <strong>of</strong> people liv<strong>in</strong>g with SCI as a result<strong>of</strong> traumatic causes would <strong>in</strong>crease to the 58,000 range (a 32 percent <strong>in</strong>crease) while those with SCI as aresult <strong>of</strong> non-traumatic causes would <strong>in</strong>crease to the 63,000 range (a 52 percent <strong>in</strong>crease).This pattern is largely the result <strong>of</strong> the ag<strong>in</strong>g <strong>of</strong> the Canadian population that will result over the com<strong>in</strong>gtwo decades, someth<strong>in</strong>g that will be reflected <strong>in</strong> the age pr<strong>of</strong>ile <strong>of</strong> the population liv<strong>in</strong>g with SCI (FigureV-2). Today 49 percent <strong>of</strong> people liv<strong>in</strong>g with sp<strong>in</strong>al cord <strong>in</strong>jury are 60 years <strong>of</strong> age or older; by 2030, givenag<strong>in</strong>g <strong>of</strong> the population as a whole, the secondary peak <strong>in</strong> tSCI due to falls <strong>in</strong> the older population, <strong>and</strong> thegeneral <strong>in</strong>creas<strong>in</strong>g rate <strong>of</strong> ntSCI with <strong>in</strong>creas<strong>in</strong>g age, over 63 percent <strong>of</strong> the people liv<strong>in</strong>g with sp<strong>in</strong>al cord<strong>in</strong>jury will be 60 years <strong>of</strong> age <strong>and</strong> older.<strong>The</strong> <strong>Incidence</strong> <strong>and</strong> <strong>Prevalence</strong> <strong>of</strong> <strong>Sp<strong>in</strong>al</strong> <strong>Cord</strong> <strong>Injury</strong> <strong>in</strong> <strong>Canada</strong>Page 46December 2010
URBAN FUTURESS t r a t e g i c R e s e a r c h t o M a n a g e C h a n g eFigure V-216,000Estimated Age-Specific <strong>Prevalence</strong> <strong>of</strong> SCI, <strong>Canada</strong>, 2010 & 203014,00012,0002030 <strong>Prevalence</strong>10,0008,0006,0004,0002010 <strong>Prevalence</strong>2,000Cases00..4Age5..910..1415..1920..2425..2930..3435..3940..4445..4950..5455..5960..6465..6970..7475..7980..8485..8990+<strong>The</strong> <strong>Incidence</strong> <strong>and</strong> <strong>Prevalence</strong> <strong>of</strong> <strong>Sp<strong>in</strong>al</strong> <strong>Cord</strong> <strong>Injury</strong> <strong>in</strong> <strong>Canada</strong>Page 47December 2010
URBAN FUTURESS t r a t e g i c R e s e a r c h t o M a n a g e C h a n g eReferences1. Ackery A, Tator C, Krassioukov A. A global perspective on sp<strong>in</strong>al cord <strong>in</strong>jury epidemiology. J Neurotrauma2004; 21: 1355-1370.2. Berkowitz M, O’Leary PK, Kruse DL, Harvey C. <strong>Sp<strong>in</strong>al</strong> <strong>Cord</strong> <strong>Injury</strong>: An Analysis <strong>of</strong> Medical <strong>and</strong> SocialCosts. New York: Demos Medical Publish<strong>in</strong>g Inc., 1998.3. Blackwell TL, Krause JS, W<strong>in</strong>kler T, Stiens SA. <strong>Sp<strong>in</strong>al</strong> <strong>Cord</strong> <strong>Injury</strong> Desk Reference: Guidel<strong>in</strong>es for Life CarePlann<strong>in</strong>g <strong>and</strong> Case Management. New York: Demos Medical Publish<strong>in</strong>g Inc., 2001.4. Cahill A, Fred<strong>in</strong>e H, Zilberman L. Initial Brief<strong>in</strong>g: <strong>Prevalence</strong> <strong>of</strong> Paralysis Includ<strong>in</strong>g <strong>Sp<strong>in</strong>al</strong> <strong>Cord</strong> Injuries <strong>in</strong>the United States, 2008.5. Catz, A Thaleisnik M, Fishel B, Ronen J, Spasser R, Fredman B, Shabtay E, Gebste<strong>in</strong> R. Survivalfollow<strong>in</strong>g sp<strong>in</strong>al cord <strong>in</strong>jury <strong>in</strong> Israel. <strong>Sp<strong>in</strong>al</strong> <strong>Cord</strong> 2002; 40: 595-598.6. Cosar SN, Yemisci OU, Oztop P, Cet<strong>in</strong> N, Sarifakioglu B, Yalbuzdag SA, Ustaomer K, Karatas M.Demographic characteristics after traumatic <strong>and</strong> non-traumatic sp<strong>in</strong>al cord <strong>in</strong>jury: a retrospectivecomparison study. <strong>Sp<strong>in</strong>al</strong> <strong>Cord</strong> 2010; 48: 862-866.7. Couris CM, Guilcher SJT, Munce SEP, Fung K, Craven BC, Verrier M, Jaglal SB. Characteristics <strong>of</strong> adultswith <strong>in</strong>cident traumatic sp<strong>in</strong>al cord <strong>in</strong>jury <strong>in</strong> Ontario, <strong>Canada</strong>. <strong>Sp<strong>in</strong>al</strong> <strong>Cord</strong> 2010; 48: 39-44.8. Dryden DM, Saunders LD, Rowe BH, May LA, Yiannakoulias N, Svenson LW, Schopflocher DP, Voakl<strong>and</strong>erDC. <strong>The</strong> Epidemiology <strong>of</strong> Traumatic <strong>Sp<strong>in</strong>al</strong> <strong>Cord</strong> <strong>Injury</strong> <strong>in</strong> Alberta, <strong>Canada</strong>. Can J Neurol Sci 2003; 30: 113-121.9. Guilcher SJT, Munce SEP, Couris CM, Fung K, Craven BC, Verrier M, Jaglal SB. Health care utilization <strong>in</strong>non-traumatic <strong>and</strong> traumatic sp<strong>in</strong>al cord <strong>in</strong>jury: a population-based study. <strong>Sp<strong>in</strong>al</strong> <strong>Cord</strong> 2010; 48: 45-50.10. Jaglal SB, Munce SEP, Guilcher SJ, Couris CM, Fung K, Craven BC, Verrier M. Health system factorsassociated with rehospitalizations after traumatic sp<strong>in</strong>al cord <strong>in</strong>jury: a population-based study. <strong>Sp<strong>in</strong>al</strong> <strong>Cord</strong>2009; 47: 604-609.11. Kirshblum S, Campagnolo D, DeLisa J (eds.). <strong>Sp<strong>in</strong>al</strong> <strong>Cord</strong> Medic<strong>in</strong>e. Philadelphia: Lipp<strong>in</strong>cott Williams &Wilk<strong>in</strong>s, 2002.12. Krueger H. <strong>The</strong> Economic Burden <strong>of</strong> <strong>Sp<strong>in</strong>al</strong> <strong>Cord</strong> <strong>Injury</strong>: A Literature Review <strong>and</strong> Analysis. H. Krueger &Associates Inc., 2010.13. L<strong>in</strong> VW (ed.). <strong>Sp<strong>in</strong>al</strong> <strong>Cord</strong> Medic<strong>in</strong>e: Pr<strong>in</strong>ciples <strong>and</strong> Practices. Demos Medical Publish<strong>in</strong>g Inc.,2003.14. New PW, Simmonds F, Stevermuer T. A population-based study compar<strong>in</strong>g traumatic sp<strong>in</strong>al cord <strong>in</strong>jury<strong>and</strong> non-traumatic sp<strong>in</strong>al cord <strong>in</strong>jury us<strong>in</strong>g a national rehabilitation database. <strong>Sp<strong>in</strong>al</strong> <strong>Cord</strong> 2010; Jul 6(epub ahead <strong>of</strong> pr<strong>in</strong>t).15. New PW, Sundararajan V. <strong>Incidence</strong> <strong>of</strong> non-traumatic sp<strong>in</strong>al cord <strong>in</strong>jury <strong>in</strong> Victoria, Australia: apopulation-based study <strong>and</strong> literature review. <strong>Sp<strong>in</strong>al</strong> <strong>Cord</strong> 2008; 46: 406-411.<strong>The</strong> <strong>Incidence</strong> <strong>and</strong> <strong>Prevalence</strong> <strong>of</strong> <strong>Sp<strong>in</strong>al</strong> <strong>Cord</strong> <strong>Injury</strong> <strong>in</strong> <strong>Canada</strong>Page 48December 2010
URBAN FUTURESS t r a t e g i c R e s e a r c h t o M a n a g e C h a n g e16. Pickett GE, Campos-Benitez M, Keller JL, Duggal N. Epidemiology <strong>of</strong> traumatic sp<strong>in</strong>al cord <strong>in</strong>jury <strong>in</strong><strong>Canada</strong>. Sp<strong>in</strong>e 2006; 31: 799-805.17. Ronen J, Gold<strong>in</strong> D, Bluvshte<strong>in</strong> V, Fishel B, Gelernter I, Catz A. Survival after nontraumatic sp<strong>in</strong>alcord lesions <strong>in</strong> Israel. Arch Phys Med Rehabil 2004; 85: 1499-1502.18. Scivoletto G, Frachi S, Laurenza L, Mol<strong>in</strong>ari M. Traumatic <strong>and</strong> non-traumatic sp<strong>in</strong>al cord lesions: anItalian comparison <strong>of</strong> neurological <strong>and</strong> functional outcomes. <strong>Sp<strong>in</strong>al</strong> <strong>Cord</strong> 2010; Jul 6 (epub ahead <strong>of</strong> pr<strong>in</strong>t).19. Wyndaele M, Wyndaele JJ. <strong>Incidence</strong>, prevalence <strong>and</strong> epidemiology <strong>of</strong> sp<strong>in</strong>al cord <strong>in</strong>jury: what learnsa worldwide literature survey? <strong>Sp<strong>in</strong>al</strong> <strong>Cord</strong> 2006; 44: 523-529.<strong>The</strong> <strong>Incidence</strong> <strong>and</strong> <strong>Prevalence</strong> <strong>of</strong> <strong>Sp<strong>in</strong>al</strong> <strong>Cord</strong> <strong>Injury</strong> <strong>in</strong> <strong>Canada</strong>Page 49December 2010