2006 Biomet Annual Report : Embracing Change
2006 Biomet Annual Report : Embracing Change
2006 Biomet Annual Report : Embracing Change

You also want an ePaper? Increase the reach of your titles
YUMPU automatically turns print PDFs into web optimized ePapers that Google loves.
embracing changebiomet <strong>2006</strong> annual report
<strong>Annual</strong> MeetingWednesday, September 20, <strong>2006</strong>4:00 p.m., local time2517 Restaurant2517 E. Center StreetWarsaw, Indiana 46580Investor Contact<strong>Biomet</strong>, Inc.c/o Barbara A. GosleeCorporate Communications ManagerP.O. Box 587Warsaw, Indiana 46581-0587Phone: 574.267.6639or 574.372.1514Email: barb.goslee@biometmail.comTransfer AgentAmerican Stock Transfer& Trust CompanyShareholder Relations59 Maiden LaneNew York, NY 10007Phone: 212.936.5100or 800.937.5449Email: info@amstock.comInternet Address: www.amstock.comThe Company<strong>Biomet</strong>, Inc. and its subsidiaries design, manufacture and market products usedprimarily by musculoskeletal medical specialists in both surgical and non-surgicaltherapy. The Company’s product portfolio encompasses reconstructive devices,including orthopedic joint replacement devices, bone cements and accessories,autologous therapies and dental reconstructive devices; fixation products, includingelectrical bone growth stimulators, internal and external orthopedic fixation devices,craniomaxillofacial implants and bone substitute materials; spinal products,including spinal stimulation devices, spinal hardware and orthobiologics; andother products, such as arthroscopy and softgoods and bracing products.Headquartered in Warsaw, Indiana, <strong>Biomet</strong> and its subsidiaries currently distributeproducts in more than 100 countries.Mailing ProcedureUnless shareholders elect otherwise, one annual report is mailed to shareholderswith the same last name residing in the same household. Shareholders may requestadditional copies by calling the Company’s Investor Contact. <strong>Biomet</strong>’s annualand quarterly reports are available on the Internet via our corporate website atwww.biomet.com. If you do not have access to the Internet or would like to receivea hard copy of the quarterly report, please notify the Investor Contact and we willforward one to you.CorporateProduct BrochureA brochure containing photos of the Company’s key products and services isavailable by request from the Investor Contact.Consolidated Financial HighlightsDesign<strong>Biomet</strong> Creative ServicesPhotographyGalliher PhotographyFort Wayne, IndianaRoberts Photography Inc.Fort Wayne, IndianaScott Bourdon StudiosSouth Bend, IndianaPrintingand Pre-PressRR Donnelley FinancialLancaster, Pennsylvania<strong>Biomet</strong>, Inc. & Subsidiaries(dollars in thousands, except per share amounts)PercentYears ended May 31: <strong>2006</strong> 2005 <strong>Change</strong>Net sales $2,025,739 $1,879,950 8%Gross profit 1,443,669 1,346,854 7Operating income 608,327 546,884 11Net income 406,144 351,616 16Basic earnings per share 1.64 1.39 18Working capital 794,996 672,525 18Total assets 2,263,922 2,096,577 8Cash and investments 225,471 177,074 27Cash flow from operations 413,470 410,920 1Shareholders’ equity 1,716,499 1,563,931 10Book value per share 7.01 6.26 12Net profit margin 20.0% 18.7%Return on equity 24.8% 23.3%
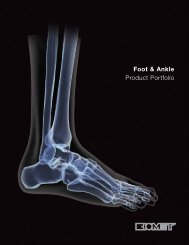
Mary LourettonApproximately six years ago, Mary Lou Retton began experiencingpain in her left hip. As a world-renowned gymnast, Mary Lou hadno idea she had been born with hip dysplasia, an anatomicabnormality. Her performances during the 1984 Olympic Gameshad earned Mary Lou five medals, the greatest number of medalswon by any athlete that year and placed her as the firstAmerican woman to win the All Around Gold Medal in women’sgymnastics. Dealing with hip pain in recent years had become MaryLou’s newest challenge, severely limiting her active lifestyle.When the pain began, Mary Lou visited her general practitioner,who prescribed medication. Then, approximately two years ago,Mary Lou decided to seek the advice of a specialist, Houstonorthopedic surgeon Brian S. Parsley, M.D. After reviewing resultsfrom her diagnostic workup, Dr. Parsley stated, “Mary Lou,there’s no way around it. You need a hip replacement.” Mary Loureplied that she just wasn’t ready yet. Dr. Parsley responded,“You’ll be back”.It wasn’t the fear of surgery that concerned Mary Lou. After all,she had been through various other surgeries over the years andhad even undergone a knee procedure six weeks prior to herparticipation in the Olympics. As she contemplated hip surgery,she realized it was the fear of the unknown that worried her.What would be the outcome? Would she be able to work out?What about range of motion?Another year passed before Mary Lou went back to see Dr.Parsley. The constant pain had become unbearable. Mary LouRetton had come to the realization that the combination ofher hip dysplasia and the effects of performing an estimated150,000 vaults during her career had resulted in the need fortotal hip replacement surgery. She was now psychologicallyprepared to proceed.activities, including her workout schedule. At the age of 37,Mary Lou was not the average total hip replacement patient.With her high physical activity level, she wasn’t even the averageyoung total hip replacement patient. Dr. Parsley knew that ifMary Lou wanted to return to an active lifestyle, she wouldneed a technologically advanced hip system that could provideexcellent range of motion and a low risk of dislocation. Hewould need to contact <strong>Biomet</strong>.<strong>Biomet</strong>’s M 2 a-Magnum Large Metal Articulation System, alongwith the Taperloc ® Hip Stem would be the best implant combinationon the market for Mary Lou Retton. The M 2 a-Magnum System, with its large head design, more closely resemblesthe natural anatomy to provide for exceptional joint stabilityand excellent range of motion. The Taperloc ® Stem is porouscoated to allow bony ingrowth, offering clinically proven longtermfemoral fixation.Dr. Parsley performed Mary Lou’s total hip replacementprocedure on June 24, 2005. Three months following surgery,Mary Lou received the green light to begin an exercise routine.In addition to regaining her range of motion, she was simplythrilled about getting her life back to normal. More importantly,Mary Lou felt blessed to be able to rejoin in the family’s activitieswith her husband and their fourdaughters, ages 11, 9, 6 and 4.Summarizing her experience,Mary Lou reflected, “Withdysplasia in both hips,some day I’ll need another<strong>Biomet</strong> hip. The next time,I won’t wait so long. <strong>Biomet</strong>changed my life!”Mary Lou communicated to Dr. Parsley her desire to moveforward with the surgery, with the hope of returning to her normalThe M 2 a-Magnum Large Metal Articulation Systemand the clinically proven Taperloc ® Hip Stem.
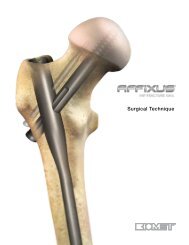
to our shareholdersto ourshareholdersUnited States$1,325,11365%<strong>2006</strong> Net Sales(in thousands)$2,025,73935%International$700,626Reconstructive$1,379,420<strong>2006</strong> Net Sales(in thousands)$2,025,73968%11%12%Spinal Products$221,9649%Other$172,995Fixation$251,3607% Increase – United States 9% Increase – International10% Increase – Reconstructive 4% Increase – Spinal Products2% Increase – Fixation 5% Increase – Other<strong>Change</strong> is the best word that describes <strong>Biomet</strong> this pastfiscal year. Following Dane Miller’s retirement at the end ofMarch, the Company began the process of implementingnumerous management and infrastructural changes designedto enhance <strong>Biomet</strong>’s operational execution in the comingyears. The Company intends to become more centralized inkey areas such as accounting, information technology, humanresources, clinical and regulatory affairs, and certain researchand development activities. We intend to expand the Company’sworldwide salesforces by approximately 10% during fiscalyear 2007 to approximately 2,900 sales representatives.Additionally, we will remain true to our engineering heritage byintroducing approximately 100 new products during fiscal year2007. We believe these changes will enable <strong>Biomet</strong> to competemore effectively in the $26 billion worldwide musculoskeletalproducts market.We believe <strong>Biomet</strong> is well-positioned to experience strong growthduring fiscal year 2007 and beyond. Our orthopedic and dentalreconstructive device operations performed very well duringfiscal year <strong>2006</strong> and we experienced solid sales growth ofinternal fixation, craniomaxillofacial fixation, arthroscopy andbiologic products. Product categories that underperformedduring fiscal year <strong>2006</strong> include electrical stimulation, externalfixation and spinal products, as well as softgoods and bracing.However, appropriate corrective actions will be taken and wefirmly believe we have a multitude of opportunities in theseproduct categories.Demographic trends continue to be extremely favorable forour industry, particularly for the orthopedic reconstructivedevice market. Baby boomers are entering the age range mostaffected by degenerative joint disease, which has historicallybeen between 55 and 75 years. Additionally, the orthopedicmarket is expanding as younger patients are seeking treatmentearlier in the disease process, while elderly patients are stayinghealthier longer and life spans are increasing. Mary Lou Retton,the 1984 Olympic gold medalist pictured on the cover of thisyear’s annual report, is a prime example of an active young adultwho has benefited from <strong>Biomet</strong>’s leading edge hip technology.In addition to the favorable demographics, expansion ofthe market through the proliferation of new products andtechnologies is expected to also drive future growth. Duringthe past 7 years, the Company introduced more than 600 newproducts to the market, leading the industry in innovation andoffering clinicians and their patients a myriad of treatmentoptions.As fiscal year <strong>2006</strong> came to a close, <strong>Biomet</strong> recorded itstwenty-eighth consecutive year of record year-over-year salesand earnings growth. Fiscal year <strong>2006</strong> was a milestone yearfor the Company, attaining net sales exceeding $2 billion, anincrease of 8% over last year’s sales, which approached $1.9billion. Net income increased 16% during fiscal year <strong>2006</strong>, asreported, from $351.6 million to $406.1 million, while adjusted*net income increased 7% from $393.5 to $420.6 million. Basicearnings per share increased 18% from $1.39 to $1.64 pershare, as reported, and increased 9% on an adjusted* basisfrom $1.56 to $1.70 per share.During fiscal year <strong>2006</strong>, domestic sales increased 7% from$1.24 billion to $1.33 billion, while international sales increased9% from $641.2 million to $700.6 million. International salesexperienced 12% growth during fiscal year <strong>2006</strong>, on a constantcurrency basis.Reviewing the Company’s fiscal year <strong>2006</strong> sales by productsegment, reconstructive device sales exhibited growth of 10%over last year’s sales of $1.25 billion to reach $1.38 billion;fixation sales increased 2% from $246.7 million to $251.4million; spinal product sales experienced growth of 4% from$214.0 million to $222.0 million; and “other product” salesincreased 5% from $164.9 million to $173.0 million.<strong>Biomet</strong>’s solid sales growth during fiscal year <strong>2006</strong> wasprimarily a result of increased demand for the Company’s corereconstructive devices, including strong worldwide sales growthfor dental reconstructive devices. On a constant currency basis,reconstructive device sales increased 11% worldwide and inthe United States during fiscal year <strong>2006</strong>, including dental*Adjusted results for fiscal year <strong>2006</strong>, which are non-GAAP measures, exclude the following one-time charges: $9 million in connection with the separation package payable toformer President and Chief Executive Officer, Dane A. Miller, Ph.D.; $5.4 million for expenses related to the Company’s review and reorganization of its EBI operations; $4.8million related to the discontinuation of the Acumen ® Surgical Navigation product line and the Company’s investment in Z-KAT, Inc.; and $2.6 million for a cross-licensing andsettlement agreement between <strong>Biomet</strong> Biologics, Inc. and Cytomedix, Inc. Adjusted results for fiscal year 2005, which are non-GAAP measures, exclude the impact of inventorystep-up related to the March 2004 acquisition of Merck KGaA’s 50% interest in the <strong>Biomet</strong> Merck joint venture and the June 2004 acquisition of Interpore International, Inc.These items are discussed in detail in the Form 10-K section titled, Management’s Discussion & Analysis of Financial Condition & Results of Operations.
econstructive device sales, which increased 15% worldwide,constant currency, and 11% in the United States.During fiscal year <strong>2006</strong>, <strong>Biomet</strong>’s strong knee sales growthof 14% in the United States and 13% worldwide, constantcurrency, was a result of the continued excellent marketdemand for the Vanguard Complete Knee System and theOxford ® Unicompartmental Knee System. The Vanguard Knee,our most comprehensive total knee system, is designed toprovide precise fit for all patients, regardless of gender, race,stature, or any other variables contributing to anatomicaldifferences, while offering high flexion benefits. <strong>Biomet</strong> recentlyinitiated the market introduction of the Vanguard SSK (SuperStabilized Knee) Revision System, which will continue to be rolledout throughout fiscal year 2007. The Oxford ® Knee, which wasintroduced to the domestic market during fiscal year 2005, isthe only true mobile-bearing unicompartmental knee systemavailable in the United States and offers a conservative treatmentfor early stage osteoarthritis.Hip sales increased 11% worldwide, excluding the impact offoreign currency, and increased 8% in the United States duringfiscal year <strong>2006</strong>. Hip products that received strong marketdemand during fiscal year <strong>2006</strong> were the M 2 a-Magnum LargeMetal Articulation System, the Taperloc ® Hip Stem, ArComXL Polyethylene and the C 2 a-Taper Acetabular System. Additionally,the ReCap ® Total Resurfacing System experienced strong marketacceptance in Europe during fiscal year <strong>2006</strong>.The M 2 a-Magnum System, <strong>Biomet</strong>’s best-selling metal-on-metalacetabular product, offers the benefits of increased range ofmotion and joint stability due to the large head design thatmore closely resembles the natural anatomy. With its excellentlong-term clinical results, the Taperloc ® is our top-selling porouscoated hip stem and is particularly well-suited for minimallyinvasive procedures due to ease of implantation as a resultof its tapered design. ArComXL, a second generation highlycrosslinked polyethylene, provides a significant decreasein the volumetric wear rate compared to standard ArCom ®Polyethylene in laboratory studies, along with an increase inultimate tensile strength. The C 2 a-Taper Acetabular System,featuring ceramic-on-ceramic articulation and our provenporous plasma spray coating technology, was recentlyintroduced to the domestic market. The ReCap ®Total Resurfacing System is a bone-preservingresurfacing system indicated for patients inthe early stages of degenerative joint disease.Currently, this system is being marketedoutside the United States with a clinical studyongoing in the United States.Another new technology that should contribute to hip salesgrowth during fiscal year 2007 is the Regenerex PorousTitanium Construct. We recently received domestic regulatoryclearance to market Regenerex acetabular cups and augmentsand we are scheduled to initiate the product launch during thesecond quarter of fiscal year 2007. We believe the Regenerex Construct will become the material of choice for porous metalimplants, as titanium is already a clinically proven material inthe orthopedic market, providing excellent biological fixation.New growth drivers for the dental reconstructive device businessinclude the Provide ® Abutment, the Certain ® Prevail ® ImplantSystem and PreFormance Post Provisional Components.The Provide ® System includes a series of abutments, whichwe believe will be more widely accepted by general dentistsdue to ease of use. The Certain ® Prevail ® System is designedto reduce crestal bone remodeling and may help in efforts topreserve crestal bone.The PreFormance Post is manufacturedfrom PEEK (poly-ether-ether-ketone) material, which allows foreasy modification by the clinician and is particularly suitablefor temporary restoration of an implant.Additionally, Implant Innovations, Inc. (“3i”) plans to introduceNanoTite Implants to the dental reconstructive device marketduring the second quarter of fiscal year 2007. New formulationtechnologies allow for the deposit of nanometer sized crystalsof calcium phosphate onto 3i’s proprietary OSSEOTITE ® surfaceas the foundation for the NanoTite Implants. The OSSEOTITE ®base promotes contact osteogenesis for rapid and extensivebone formation onto the implant surface. The NanoTite ImplantDaniel P. Hann, Interim President and Chief Executive Officer (left)and Niles L. Noblitt, Chairman of the Board.
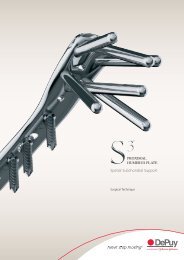
Net SalesOperating IncomeBasic Earnings Per ShareFiscal Years 1991 – <strong>2006</strong>16% Compound <strong>Annual</strong> Growth RateFiscal Years 1991 – <strong>2006</strong>18% Compound <strong>Annual</strong> Growth RateFiscal Years 1991 – <strong>2006</strong>17% Compound <strong>Annual</strong> Growth Rateis scheduled for full release during the fourth quarter of fiscalyear 2007.On June 28, <strong>2006</strong>, the Company announced the decision by itsBoard of Directors to declare a cash dividend of $0.30 per share,payable on July 21, <strong>2006</strong>, to shareholders of record at the closeof business on July 14, <strong>2006</strong>. The declaration of this dividendis in response to the Company’s record financial performanceduring fiscal year <strong>2006</strong> and our optimism for strong resultsduring fiscal year 2007.<strong>Biomet</strong>’s current share repurchase program, authorizedin December 2005, currently has $46 million available topurchase the Company’s outstanding Common Shares. Thisshare repurchase program included authorization to repurchaseup to $100 million of the Company’s outstanding CommonShares in open market or privately negotiated transactions.Since December 2001, the Company has repurchased 32.6million of its Common Shares for an aggregate amount of$1.064 billion.<strong>Biomet</strong>’s fifteen-year compound annual growth in revenues,operating income and earnings per share increased 16%, 18%and 17%, respectively. The Company’s consistently strongbalance sheet is evident with no long-term debt, $225.5 millionin cash and investments, and shareholders’ equity of $1.7 billion.<strong>Biomet</strong>’s net cash flow from operations totaled $413 millionduring fiscal year <strong>2006</strong>, providing continued opportunities forthe Company to strategically acquire additional products andtechnologies to bolster <strong>Biomet</strong>’s broad product platform.On behalf of the <strong>Biomet</strong> team, we would like to take thisopportunity to publicly thank Dane Miller for his leadershipduring the past three decades, taking the Company fromfirst year sales of $17,000 to sales in excess of $2 billionduring fiscal year <strong>2006</strong>. His legacy can be perpetuated by thecontinued growth and prosperity of the Company, and we arededicated to achieving that success.Please be assured that <strong>Biomet</strong> will continue to focus on waysto increase revenues and optimize shareholder value. Ourcommitment to the Company’s engineering excellence andentrepreneurial spirit remains unchanged. However, while aprimarily decentralized structure has historically served <strong>Biomet</strong>well, we believe the Company will benefit from increasedcentralization of key operational functions. Additionally, weare conducting a critical evaluation of each of our divisionsand manufacturing facilities, sharing best practices throughoutthe organization, including benchmarking activities. We believechange brings opportunity. We embrace this change and believe<strong>Biomet</strong> has a bright future.The Company’s core strengths reside in our team-basedorganizational structure, our unique culture, and the resilienceof our Team Members, honed by their dedication to improve thelives of the patients we serve throughout the world. On behalf ofour entire team, thank you for your continued support of <strong>Biomet</strong>.Respectfully,While fiscal <strong>2006</strong> was a year of challenge and transition forthe <strong>Biomet</strong> team, demand remained strong for the Company’sorthopedic and dental reconstructive devices. However,<strong>Biomet</strong>’s financial results, as a whole, did not meet our internalexpectations. The progress at EBI, the Company’s trauma andspine division, has been slower than anticipated; however,additional improvements will continue to be made during fiscalyear 2007. We are committed to providing ongoing support toensure the future success of this key business unit.Daniel P. HannInterim Presidentand Chief Executive OfficerNiles L. NoblittChairman of the Board
UNITED STATESSECURITIES AND EXCHANGE COMMISSIONWASHINGTON, D.C. 20549FORM 10-K(Mark One)ANNUAL REPORT PURSUANT TO SECTION 13 OR 15(d) OF THE SECURITIESEXCHANGE ACT OF 1934For the fiscal year ended May 31, <strong>2006</strong>.ORTRANSITION REPORT PURSUANT TO SECTION 13 OR 15(d) OF THE SECURITIESEXCHANGE ACT OF 1934For the transition period from _______________________ to ______________________.Commission file No. 0-12515.(Exact name of registrant as specified in its charter)Indiana 35-1418342(State of incorporation)(IRS Employer Identification No.)56 East Bell Drive, Warsaw, Indiana 46582(Address of principal executive offices)(Zip Code)Title of Each ClassCommon SharesRights to Purchase Common Shares(574) 267-6639(Registrant’s telephone number, including area code)Securities registered pursuant to Section 12(b) of the Act:Name of Each Exchange on which registeredThe NASDAQ Stock MarketThe NASDAQ Stock MarketSecurities registered pursuant to Section 12(g) of the Act: NoneIndicate by check mark if the registrant is a well-known seasoned issuer, as defined in Rule 405 of the Securities Act. Yes NoIndicate by check mark if the registrant is not required to file reports pursuant to Section 13 or Section 15(d) of the Act. YesIndicate by check mark whether the registrant (1) has filed all reports required to be filed by Section 13 or 15(d) of the Securities ExchangeAct of 1934 during the preceding 12 months (or for such shorter period that the registrant was required to file such reports), and (2) hasbeen subject to such filing requirements for the past 90 days. Yes NoIndicate by check mark if disclosure of delinquent filers pursuant to Item 405 of Regulation S-K is not contained herein, and will not becontained, to the best of registrant’s knowledge, in definitive proxy or information statements incorporated by reference in Part III of thisForm 10-K or any amendment to this Form 10-K.Indicate by a check mark whether the registrant is a large accelerated filer, an accelerated filer, or a non-accelerated filer. See definitionof “accelerated filers and large accelerated filer” in Rule 12b-2 of the Exchange Act. (Check one): Large accelerated filerAccelerated filer Non-accelerated filerThe aggregate market value of the Common Shares held by non-affiliates of the registrant, based on the closing price of the CommonShares on November 30, 2005, as reported by The Nasdaq Stock Market, was approximately $8,037,326,823. As of July 13, <strong>2006</strong>, therewere 244,831,097 Common Shares outstanding.DOCUMENTS INCORPORATED BY REFERENCEParts of Form 10-KInto Which DocumentIdentity of DocumentIs IncorporatedProxy Statement with respect to the <strong>2006</strong><strong>Annual</strong> Meeting of Shareholders of the RegistrantPart IIINo
FORWARD-LOOKING STATEMENTSThis report contains “forward-looking statements” within the meaning of federal securities laws. Those statements are often indicated by theuse of words such as “will,” “intend,” “anticipate,” “estimate,” “expect,” “plan” and similar expressions, and include, but are not limited to,statements related to the timing and number of planned new product introductions; the effect of anticipated changes in the size, health and activitiesof population on demand for the Company’s products; assumptions and estimates regarding the size and growth of certain market segments; theCompany’s ability and intent to expand in key international markets; the timing and anticipated outcome of clinical studies; assumptions concerninganticipated product developments and emerging technologies; the future availability of raw materials; the anticipated adequacy of the Company’scapital resources to meet the needs of its business; the Company’s continued investment in new products and technologies; the ultimate successof the Company’s strategic alliances; the ultimate marketability of products currently being developed; the ability to successfully implementnew technologies; future declarations of cash dividends; the Company’s ability to sustain sales and earnings growth; the Company’s goals for salesand earnings growth; the future value of the Company’s Common Stock; the ultimate effect of the Company’s Share Repurchase Programs; theCompany’s success in achieving timely approval or clearance of its products with domestic and foreign regulatory entities; the stability of certainforeign economic markets; the impact of anticipated changes in the musculoskeletal industry and the ability of the Company to react to and capitalizeon those changes; the ability of the Company to successfully implement its desired organizational changes; the impact of the Company’s managerialchanges; and the Company’s ability to take advantage of technological advancements. Readers of this report are cautioned that reliance on any forwardlookingstatement involves risks and uncertainties. Although the Company believes that the assumptions on which the forward-looking statementscontained herein are based are reasonable, any of those assumptions could prove to be inaccurate given the inherent uncertainties as to the occurrence ornonoccurrence of future events. There can be no assurance that the forward-looking statements contained in this report will prove to be accurate. Theinclusion of a forward-looking statement herein should not be regarded as a representation by the Company that the Company’s objectives will beachieved. Readers of this report should carefully read the factors set forth under the caption “Risk Factors” beginning on page 15 of this report fora description of certain risks that could, among other things, cause actual results to differ from those contained in forward-looking statements madein this report and presented elsewhere by management from time to time. Such factors, among others, may have a material adverse effect upon theCompany’s business, financial condition and results of operations. The Company undertakes no obligation to update publicly or revise any forwardlookingstatements, whether as a result of new information, future events or otherwise. Accordingly, the reader is cautioned not to place undue relianceon forward-looking statements, which speak only as of the date on which they are made.TABLE OF CONTENTSPART IItem 1. Business........................................................................................................................................................................ 1Item 1A. Risk Factors............................................................................................................................................................... 15Item 1B. Unresolved Staff Comments..................................................................................................................................... 17Item 2. Properties................................................................................................................................................................... 18Item 3. Legal Proceedings...................................................................................................................................................... 19Item 4. Submission of Matters to a Vote of Security Holders............................................................................................ 19PART IIItem 5. Market for the Registrant’s Common Equity, Related Stockholder Mattersand Issuer Purchases of Equity Securities.............................................................................................................. 21Item 6. Selected Financial Data............................................................................................................................................ 22Item 7. Management’s Discussion & Analysis of Financial Condition & Results of Operations................................... 23Item 7A. Quantitative & Qualitative Disclosures About Market Risk................................................................................ 29Item 8. Financial Statements and Supplementary Data..................................................................................................... 30Item 9. <strong>Change</strong>s in and Disagreements with Accountants on Accounting and Financial Disclosure............................. 51Item 9A. Controls and Procedures.......................................................................................................................................... 51Item 9B. Other Information..................................................................................................................................................... 51PART IIIItem 10. Directors and Executive Officers of the Registrant............................................................................................... 52Item 11. Executive Compensation.......................................................................................................................................... 52Item 12. Security Ownership of Certain Beneficial Owners and Management and Related Stockholder Matters........ 52Item 13. Certain Relationships and Related Transactions................................................................................................... 53Item 14. Principal Accounting Fees and Services.................................................................................................................. 53PART IVItem 15. Exhibits and Financial Statement Schedules.......................................................................................................... 53
Item 1. Business.part iGeneral<strong>Biomet</strong>, Inc. (“<strong>Biomet</strong>” or the “Company”), an Indiana corporation incorporated in 1977, and its subsidiaries design, manufacture and marketproducts used primarily by musculoskeletal medical specialists in both surgical and non-surgical therapy. The Company’s product portfolioencompasses reconstructive products, fixation devices, spinal products and other products. <strong>Biomet</strong> has corporate headquarters in Warsaw,Indiana, and manufacturing and/or office facilities in more than 50 locations worldwide.The Company’s principal subsidiaries include <strong>Biomet</strong> Orthopedics, Inc.; <strong>Biomet</strong> Manufacturing Corp.; EBI, L.P. (operating under the assumednames <strong>Biomet</strong> Spine and <strong>Biomet</strong> Trauma); <strong>Biomet</strong> Europe B.V.; Implant Innovations, Inc.; Walter Lorenz Surgical, Inc.; Arthrotek, Inc. and<strong>Biomet</strong> Biologics, Inc. Unless the context requires otherwise, the term “Company” as used herein refers to <strong>Biomet</strong> and all of its subsidiaries.On June 18, 2004, the Company completed the merger of Interpore International, Inc., now known as Interpore Spine Ltd. (“Interpore”), witha wholly-owned subsidiary of <strong>Biomet</strong>. As a result of the merger, Interpore shareholders were entitled to receive $14.50 per share in cash,representing an aggregate purchase price of approximately $266 million. Interpore’s primary products include spinal implants, orthobiologicsand minimally-invasive surgery products used by surgeons in a wide variety of applications.The Company’s annual reports on Form 10-K (for the five most recent fiscal years), Quarterly <strong>Report</strong>s on Form 10-Q, Current <strong>Report</strong>s onForm 8-K and amendments to these reports filed or furnished pursuant to Section 13(a) or 15(d) of the Securities Exchange Act of 1934 areavailable free of charge in, or may be accessed through, the Investors Section of the Company’s Internet website at www.biomet.com as soonas reasonably practicable after the Company files or furnishes such material with or to the Securities and Exchange Commission. In addition,copies of these reports will be made available free of charge, upon written request to the Company’s Investor Relations Department.The information on <strong>Biomet</strong>’s website is not included as part of, nor incorporated by reference into, this Form 10-K.ProductsThe Company operates in one business segment, musculoskeletal products, which includes the design, manufacture and marketingof four major market segments: reconstructive products, fixation devices, spinal products and other products. The Company hasthree reportable geographic markets: United States, Europe and Rest of World. Reconstructive products include knee, hip andextremity joint replacement systems, as well as dental reconstructive implants, bone cements and accessories, the GPS ® Systemand the procedure-specific instrumentation required to implant the Company’s reconstructive systems. Fixation devices includeinternal and external fixation devices, craniomaxillofacial fixation systems and electrical stimulation devices that do not addressthe spine. Spinal products include electrical stimulation devices addressing the spine, spinal fixation systems and orthobiologics.The other product sales category includes, arthroscopy products, softgoods and bracing products, casting materials, general surgicalinstruments, operating room supplies and other surgical products. Depending on the intended application, the Company reports sales ofbiologics products in the reconstructive product, fixation device or spinal product segment.The following table shows the net sales and percentages of total net sales contributed by each of the Company’s product segments for eachof the three most recent fiscal years ended May 31, <strong>2006</strong>.Years Ended May 31,(Dollar amounts in thousands)<strong>2006</strong> 2005 2004Percent Percent PercentNet of Total Net of Total Net of TotalSales Net Sales Sales Net Sales Sales Net SalesReconstructive Products $1,379,420 68% $1,254,234 67% $1,052,865 65%Fixation Devices 251,360 12% 246,730 13% 248,821 15%Spinal Products 221,964 11% 214,039 11% 159,927 10%Other Products 172,995 9% 164,947 9% 153,640 10%Total $2,025,739 100% $1,879,950 100% $1,615,253 100%
Reconstructive ProductsOrthopedic reconstructive implants are used to replace joints that have deteriorated as a result of disease (principally osteoarthritis) or injury.Reconstructive joint surgery involves the modification of the area surrounding the affected joint and the implantation of one or more manufacturedcomponents, and may involve the use of bone cement. The Company’s primary orthopedic reconstructive joints are knees, hips andshoulders, but it produces other joints as well. The Company also produces the associated instruments required by orthopedic surgeons toimplant the Company’s reconstructive devices, as well as bone cements and cement delivery systems. Additionally, dental reconstructiveimplants and associated instrumentation are used for oral rehabilitation through the replacement of teeth and repair of hard and soft tissues.Knee Systems. A total knee replacement typically includes a femoral component, a patellar component, a tibial component and anarticulating surface. Total knee replacement may occur as an initial joint replacement procedure, or as a revision procedure, which may berequired to replace, repair or enhance the initial implant. Partial, or unicondylar, knee replacement is an option when only a portion of theknee requires replacement.<strong>Biomet</strong>’s newest and most comprehensive total knee system, the Vanguard System, accommodates up to 145 degrees of flexion. The launchof the Vanguard System, in conjunction with <strong>Biomet</strong>’s Microplasty ® Minimally Invasive Total Knee Instrumentation, continued throughoutfiscal year <strong>2006</strong>. The Microplasty ® Instrumentation is designed to reduce incision size and surrounding soft tissue disruption, whichmay provide reduced blood loss, a shortened hospital stay, reduced postoperative pain and less time spent in rehabilitation, as compared to aconventional procedure.During fiscal year <strong>2006</strong>, the Company continued the development efforts to complete the rotating platform and revision options of theVanguard Complete Knee System, as well as the expansion of the Microplasty ® Minimally Invasive Instrument Platform to include lessinvasive posterior referencing, anterior referencing and image-guided options. In addition, the launch of the Premier Instrumentation andthe Vanguard Revision SSK (Super Stabilized Knee) System began during fiscal year <strong>2006</strong> and will be expanded during fiscal year 2007. InEurope, the Company plans to continue the rollout of the ROCC (ROtating Concave Convex) Knee, a mobile-bearing total knee system.The Company continues to be a market leader in addressing the increasing demand from practitioners and patients for proceduresand products accommodating minimally-invasive knee techniques. The Oxford ® Unicompartmental Knee, which is a mobilebearingunicondylar knee that utilizes a minimally-invasive technique, continues to experience strong global sales. TheOxford ® Knee, which was introduced in the United States during fiscal year 2005, is currently the only free-floating meniscalunicompartmental system approved for use in the United States. The Company’s offering of minimally-invasive unicondylarknee systems also includes the Alpina ® Unicompartmental Knee, which is not currently available in the United States, and theVanguard M Series Unicompartmental Knee System. The Vanguard M System is a modified version of the Oxford ® Knee thatincorporates a fixed-bearing tibial component as opposed to a floating tibial bearing. The Repicci II ® Unicondylar Knee Systemis specifically designed to accommodate a minimally-invasive knee arthroplasty procedure. This system incorporates selfaligningmetal and polyethylene components. This innovative procedure can often be performed on an outpatient basis and requires a smallerincision and minimal bone removal, which may result in shorter recovery time and reduced blood loss.The <strong>Biomet</strong> ® OSS Orthopaedic Salvage System continues to gain market acceptance. This system provides modular flexibility while reducingoverall inventory demands. The OSS System is used mainly in instances of severe bone loss and/or significant soft tissue instability asa result of multiple revision surgeries or oncological bone deficiencies.Hip Systems. A total hip replacement involves the replacement of the head of the femur and the acetabulum, and may occur asan initial joint replacement procedure, or as a revision procedure, which may be required to replace, repair or enhance the initial implant.A femoral hip prosthesis consists of a femoral head and stem, which can be cast, forged or wrought, depending on the design and materialused. Acetabular components include a prosthetic replacement of the socket portion, or acetabulum, of the pelvic bone. Because of variationsin human anatomy and differing design preferences among surgeons, femoral and acetabular prostheses are manufactured by the Companyin a variety of sizes and configurations. The Company offers a broad array of total hip systems, most of which utilize titanium or cobaltchromium alloy femoral components and the Company’s patented ArCom ® or ArComXL polyethylene-lined, metal-on-metal or ceramic-onceramicacetabular components. Many of the femoral prostheses utilize the Company’s proprietary PPS ® porous plasma spray coating, whichenables cementless fixation.The Alliance ® family of Hip systems is designed to address the demand from hospitals and surgeon groups toward standardization of total hipsystems. The Alliance ® Hip family provides the largest selection in the marketplace of primary and revision stems available for implantationwith a single set of instruments. The Alliance ® family of hip systems includes the Answer ® , Bi-Metric ® , Hip Fracture, Integral ® , Intrigue ,Reach ® and Rx90 ® Hip Systems. The Alliance ® family was further augmented by introducing Exact Instrumentation, an integrated instrumentset developed to promote intraoperative flexibility and increase the efficiency, simplicity and consolidation of instrument use.
The Taperloc ® Hip System is marketed for non-cemented use in patients undergoing primary hip replacement surgery as a result ofnoninflammatory degenerative joint disease. The Taperloc ® femoral component is a collarless, flat, wedge-shaped implant designedto provide excellent durability and stability in a design that is relatively simple and predictable to implant. The incorporationof standard and lateralized offset options provides the surgeon with the ability to reconstruct a stable joint with proper leg length in virtuallyall patient anatomies.The Mallory/Head ® Hip System is designed for both primary and revision total hip arthroplasty procedures. The primary femoral componentsfeature a specific proximal geometry for cementless indications and a slightly different proximal ribbed geometry for those patients requiringfixation with bone cement. The Mallory/Head ® Revision Calcar components provide innovative solutions for difficult revision cases. TheMallory/Head ® Calcar replacement prosthesis is offered in both a one-piece and a modular version, which allows for individual customizationat the time of surgical intervention, even in cases of severe bone deficiency. The modular version of the Mallory/Head ® System incorporatesthe Company’s patented roller hardened technology, which dramatically increases the strength of the modular connection.The Company continues to explore the development of innovative articulation technologies and materials. <strong>Biomet</strong>’s M 2 a Metal-on-MetalArticulation System combines a cobalt chromium head with a cobalt chromium liner and has demonstrated a 20- to 100-fold reduction involumetric wear in simulator studies compared to traditional metal-polyethylene articulation systems. The M 2 a-Metal-on-Metal ArticulationSystem may be utilized on all of <strong>Biomet</strong>’s femoral components and has continued to evolve with the introduction of the M 2 a-Magnum Articulation System, which incorporates larger diameter metal-on-metal components designed to more closely resemble the natural anatomy,offering improved range of motion and joint stability. The Company introduced the C 2 a-Taper Acetabular System during fiscal year <strong>2006</strong>,which provides an additional alternative bearing option featuring ceramic-on-ceramic articulation. In addition, the Company is pursuing thedevelopment of a diamond-on-diamond hip articulation system through its relationship with Diamicron, Inc., a global leader in the research,development and manufacture of polycrystalline diamond composite technology for biomedical applications. The Company continues tomarket ArComXL , which is a second-generation highly crosslinked polyethylene bearing material based on the Company’s proven ArCom ®polyethylene. ArComXL polyethylene has demonstrated excellent wear characteristics without measurable oxidation afteraccelerated aging.<strong>Biomet</strong>’s comprehensive Microplasty ® Minimally Invasive Hip Program includes proprietary products from <strong>Biomet</strong>’s broad array of hipproducts, as well as a distinctive training program and uniquely-designed instruments for a minimally-invasive approach. The Companycontinues to enhance the development of the Microplasty ® Minimally Invasive Hip Instruments. <strong>Biomet</strong>’s minimally-invasive hip developmentefforts have been focused on various surgical approaches, including an anterior supine approach, which is an intramuscular surgical approach.Instruments relating to the anterior supine approach were introduced during fiscal year <strong>2006</strong>.The ReCap ® Total Resurfacing System is a bone-conserving approach indicated for patients in the early stages of degenerative jointdisease, including osteoarthritis, rheumatoid arthritis and avascular necrosis. The Company commenced a clinical study for the ReCap ® TotalResurfacing System in the United States during fiscal year <strong>2006</strong>.The Company also provides constrained hip liners, which are indicated for patients with a high risk of hip dislocation. While the percentageof patients requiring a constrained liner is relatively small, surgeons often prefer to utilize a primary and revision system that includesthis option.The Company plans to introduce the Regenerex Porous Titanium Construct Acetabular System during fiscal year 2007. The Regenerex Construct provides design flexibility and solutions for difficult primary and revision cases. The advanced titanium scaffold structure of theRegenerex Construct is a continuous three-dimensional matrix comprised of industry-standard Ti-6AL-4V.Extremity Systems. The Company offers a variety of shoulder systems including the Absolute ® Bi-Polar, Bi-Angular ® ,Bio-Modular ® , Comprehensive ® , Copeland , Integrated and Mosaic Shoulder Systems, as well as uniquely-designed elbowreplacement systems.The Copeland Humeral Resurfacing Head was developed to minimize bone removal in shoulder procedures and has over 18 years of positiveclinical results in the United Kingdom. During fiscal year 2007, this system is scheduled to be expanded to include a new EAS extendedarticular surface designed to address rotator cuff arthropathy.During fiscal year <strong>2006</strong>, the Company initiated the roll out of the ExploR ® Radial Head Replacement System, a two-piece hemi-elbowcomprised of a tapered stem paired with a head designed to articulate with the patient’s natural bone.The Company plans to continue the introduction of T.E.S.S. (Total Evolutive Shoulder System) in selected European markets. The T.E.S.S.System is a complete shoulder system that can be used in all indications of shoulder arthroplasty. The Company plans to begin distribution ofthe T.E.S.S. System in the United States by the end of fiscal year 2007.
Dental Reconstructive Implants. Through its subsidiary, Implant Innovations, Inc. (“3i”), the Company develops, manufacturesand markets products designed to enhance oral rehabilitation through the replacement of teeth and the repair of hard and soft tissues. Theseproducts include dental reconstructive implants and related instrumentation, bone substitute materials and regenerative products and materials.A dental implant is a small screw or cylinder, normally constructed of titanium, that is surgically placed in the bone of the jaw to replacethe root of a missing tooth and provide an anchor for an artificial tooth. 3i’s flagship product, the OSSEOTITE ® product line, features apatented micro-roughened surface technology, which allows for early loading and improved bone integration to the surface of the implant.The OSSEOTITE ® Certain ® Implant System, which was 3i’s fastest growing product line in fiscal year <strong>2006</strong>, is an internally connectedsystem that, through the use of the QuickSeat ® connection, provides audible and tactile feedback when abutments and copings are seatedinto the implant. In addition, the 6/12 point connection design of the OSSEOTITE ® Certain ® Implant System offers enhanced flexibility inplacing the implant and abutment. In fiscal year <strong>2006</strong>, 3i continued to build on the strength of this product line by introducing the Certain ®PREVAIL ® Implant System. This new implant is designed to enhance crestal bone preservation as a result of its integration of theIntegrated Platform Switching and a medialized Implant-Abutment-Junction. In addition, the Certain ® PREVAIL ® Implant is acid-etched with aFull OSSEOTITE ® Surface (FOSS) with an expanded collar for increased stability.In an effort to continue to increase simplicity and accuracy for clinicians, 3i introduced new surgical instrumentation across severaldifferent categories during fiscal year <strong>2006</strong>. These launches included new quad shaping drills and depth indicators for use with the OSSEOTITENT ® Implant System; ACT reusable drills featuring improved cutting performance, better depth visibility and a matte surface for glarereduction; and the Osseocision Surgical Drill System. Key features of the Osseocision Surgical Drill System include an ergonomicfoot pedal design and miniature handpiece head for access in tight interdental spaces.During fiscal year <strong>2006</strong>, 3i launched several additions to the Provide ® Abutment Restoration System, which is designed to be more widelyaccepted by general dentists due to its ease of use.3i’s offering of restorative treatment options also includes the GingiHue Post and the ZiReal ® Post. The GingiHue Post is a gold-coloredtitanium nitride coated abutment, which optimizes the projection of natural color through soft tissue. The ZiReal ® Post offers a highly aestheticrestorative option. This zirconia-based abutment provides the natural translucence of ceramic material, but with greater strength, durabilityand resistance to cracking than conventional alumina oxide ceramic abutments. Both of these products may be used with conventionalimplant therapy.Other Reconstructive Devices. <strong>Biomet</strong>’s PMI ® Patient-Matched Implant services group expeditiously designs, manufactures anddelivers one-of-a-kind reconstructive devices to orthopedic specialists. The Company believes this service continues to enhance <strong>Biomet</strong>’sreconstructive sales by strengthening its relationships with orthopedic surgeons and augmenting its reputation as a responsive companycommitted to excellent product design. In order to assist orthopedic surgeons and their surgical teams in preoperative planning, <strong>Biomet</strong>’sPMI ® group utilizes a three-dimensional (“3-D”) bone reconstruction imaging system. The Company uses computed tomography (“CT”) datato produce 3-D reconstructions for the design and manufacture of patient-matched implants. With this imaging and model-making technology,<strong>Biomet</strong>’s PMI ® group is able to assist the physician prior to surgery by creating 3-D models. Within strict deadlines, the model is used byengineers, working closely with the surgeon, to create a PMI ® design for the actual manufacturing of the custom implant for the patient.The Company is involved in the ongoing development of bone cements and delivery systems. The Company has broadened the range of itsinternally developed and manufactured bone cement product offerings. Cobalt HV Bone Cement, which was introduced in the United Statesduring fiscal year <strong>2006</strong>, is particularly well suited for use in minimally-invasive surgery, but may be used in all applicable joint replacementprocedures. The excellent handling characteristics and high optical contrast of Cobalt HV Bone Cement are well suited to the current trendsin orthopedic surgery. The Company offers its internally developed and manufactured bone cements with and without antibiotic and marketsthem in conjunction with <strong>Biomet</strong>’s patented Optivac ® Vacuum Mixing System. During fiscal year <strong>2006</strong>, the Company began to market inEurope a full range of internally-developed bone cements, including Refobacin ® Bone Cement with antibiotic.Additional products and services for reconstructive indications include bone graft substitute materials and services related to allograft material.Calcigen ® S calcium sulfate bone graft substitute is a self-setting paste used to fill bone voids. The Calcigen ® PSI (Porous Synthetic Implant)Bone Graft System is a porous, calcium phosphate bone substitute material used as a bone void filler. The Company also provides servicesrelated to the supply of allograft material procured through several tissue bank alliances. Markets addressed by the Company’s allograft servicesinclude the orthopedic and dental reconstructive market segments, as well as the spinal, craniomaxillofacial and arthroscopy segments.The GPS ® Gravitational Platelet Separation System is a unique device that collects platelet concentrate from a small volume ofthe patient’s blood using a fast, single spin process. The GPS ® System offers a high-quality platelet concentrate and has broadpotential applications in the reconstructive and spine markets. The GPS ® System is marketed in conjunction with the <strong>Biomet</strong> ® Rapid RecoveryProgram, a comprehensive approach to patient education, a minimally-invasive surgical approach and pain management that was developedin conjunction with leading orthopedic surgeons in the United States.The Company has discontinued its development efforts related to the Acumen ® Surgical Navigation System.Refobacin ® is a registered trademark of Merck KGaA.
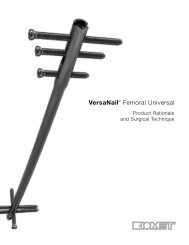
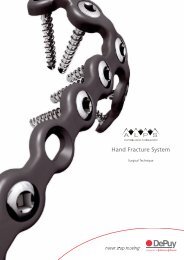
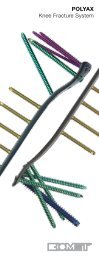
Fixation DevicesThe Company’s fixation products include electrical stimulation devices (that do not address the spine), external fixation devices,craniomaxillofacial fixation systems, internal fixation devices and bone substitute materials utilized in fracture fixation applications. TheCompany’s craniomaxillofacial fixation products are marketed by its subsidiary, Walter Lorenz Surgical, Inc. All other fixation products aremarketed primarily under the <strong>Biomet</strong> Trauma tradename.Electrical Stimulation Systems. The Company is the market leader in the electrical stimulation segment of the fixationmarket. The U.S. Food and Drug Administration (FDA) has acknowledged the Company’s extensive preclinical research documenting theMechanism of Action for its pulsed electromagnetic field (“PEMF”), capacitative coupling and direct current technologies. The Mechanismof Action for these technologies involves the stimulation of a cascade of bone morphogenic proteins (“BMPs”), as well as angiogenesis,chondrogenesis and osteogenesis.The EBI Bone Healing System ® unit is a non-invasive bone growth stimulation device indicated for the treatment of recalcitrantbone fractures (nonunions), failed fusions and congenital pseudarthrosis that have not healed with conventional surgical and/ornon-surgical methods. The non-invasive bone growth stimulation devices sold by the Company generally provide an alternativeto surgical intervention in the management of these bony applications. The EBI Bone Healing System ® units produce low-energyPEMF signals that induce weak pulsing currents in living tissues that are exposed to the signals. These pulses, when suitablyconfigured in amplitude, repetition and duration, affect living bone cells to differentiate, migrate and proliferate. The Mechanismof Action behind the PEMF technology involves the stimulation of growth factors involved in normal bone healing. EBI’s preclinical researchdemonstrates that PEMF signals increase a number of growth factors, such as TGF-ß, BMP-2 and BMP-4, which are normal physiologicalregulators of the various stages of bone healing, including angiogenesis, chondrogenesis and osteogenesis. The EBI Bone Healing System ®unit may be utilized over a patient’s cast, incorporated into the cast or worn over the skin.The OrthoPak ® Bone Growth Stimulation System, which is indicated for the treatment of recalcitrant (nonunion) fractures, offers a small,lightweight, non-invasive bone growth stimulator using capacitive coupling technology. The OrthoPak ® System delivers bone growthstimulation through wafer-thin electrodes that add virtually no extra weight on the nonunion site. The Mechanism of Action behind the Company’scapacitive coupling stimulation technology involves the stimulation of osteopromotive factors involved in normal bone healing, such asTGF-ß1 and PGE2. The OrthoPak ® System provides greater ease of use and enhances access to fracture sites that are normally hard to treat.The Company also offers an implantable option when bone growth stimulation is required in conjunction with or subsequent to surgicalintervention. The OsteoGen ® Surgically Implanted Bone Growth Stimulator is an adjunct treatment when bone grafting and surgicalintervention are required to treat recalcitrant (nonunion) fractures in long bones. The Mechanism of Action behind the Company’s directcurrent stimulation technology involves the stimulation of a number of osteoinductive growth factors including BMP-2, -6 and -7 and theBMP-2 receptor ALK2, which are normal physiological regulators of various stages of bone healing, including chondrogenesis andosteogenesis. In addition, electrochemical reactions at the cathode lower oxygen concentrations and increase pH.During fiscal year 2005, a private company petitioned the FDA to reclassify noninvasive bone growth stimulators from Class III to Class IImedical devices. The petition is directed at products, like those described above, that utilize electromagnetic fields to stimulate bone growth.In June <strong>2006</strong>, the FDA Advisory Panel recommended that the bone growth stimulator devices remain Class III devices. However, the FDAis not required to act in concert with the Advisory Panel’s recommendation. The outcome of this matter will most likely not be known forsome time.External Fixation Devices. External fixation is utilized for stabilization of fractures when alternative methods of fixation are notsuitable. The Company offers a complete line of systems that address the various segments of the trauma and reconstructive external fixationmarketplace. The DynaFix ® and DynaFix ® Vision Systems are patented, modular external fixation devices intended for use in complextrauma situations involving upper extremities, the pelvis and lower extremities. EBI also has a full line of external fixation products for certainreconstructive procedures involving limb lengthening, fusion, articulated fixation and deformity correction applications.Internal Fixation Devices. The Company’s internal fixation devices include products such as nails, plates, screws, pins and wiresdesigned to stabilize traumatic bone injuries. These devices are used by orthopedic surgeons to provide an accurate means of setting andstabilizing fractures and for other reconstructive procedures. They are intended to aid in the healing process and may be removed when healingis complete. Internal fixation devices are not intended to replace normal body structures.The Company develops, manufactures and/or distributes innovative products that fit into key segments of the fixation marketplace.The VHS ® Vari-Angle Hip Fixation System is used primarily in the treatment of hip fractures. The components of the VHS ® Vari-AngleHip Fixation System can be adjusted intraoperatively, allowing the hospital to carry less inventory, while providing greater intraoperativeflexibility to achieve the optimum fixation angle. The Holland Nail System is a single, universal trochanteric nail designed to treat all typesof femoral (hip or thigh) fractures.VHS ® is a registered trademark of Implant Distribution Network, Ltd.
During fiscal year 2005, the Company introduced the EBI ® Peritrochanteric Nail System, which incorporates an innovative single lag screwconcept and is delivered through a trochanteric entry point. In conjunction with the VHS ® System and the Holland Nail System, the EBI ®Peritrochanteric Nail System will further augment the Company’s product portfolio for hip fracture fixation treatment.The EBI ® Low Profile Tibial Nail, used to treat fractures between the knee and ankle, is primarily indicated in the treatment of unstable ornonunion fractures. The EBI ® Ankle Arthrodesis Nail is designed for reconstructive procedures where internal fixation is desired for fusionof the ankle joint.The Company has also implemented several projects in the area of locked plating designs. The OptiLock ® Distal Radius PlatingSystem was designed using state-of-the-art locking technology and incorporates plates and screws that address volar, radial and dorsal platingapplications. During fiscal year <strong>2006</strong>, the Company completed the surgical validation and initial rollout of the OptiLock ® Periarticular Plating System.The complete domestic launch for this system is scheduled to be completed during fiscal year 2007. The OptiLock ® Periarticular Plating System is aunique, pre-contoured plating system designed for fixation of periarticular lower extremity fractures. It incorporates patent-pending technology thatallows the surgeon to utilize locked or unlocked screws in various diameters through any hole in the plate, while incorporating minimally-invasivetechniques. During fiscal year 2007, the Company intends to continue to make innovative improvements in hip fracture, locked plating, external fixationand intramedullary fixation devices to enhance the Company’s portfolio of fixation implants for the trauma marketplace.Craniomaxillofacial Fixation Systems. The Company manufactures and distributes craniomaxillofacial, neurosurgical,and thoracic titanium and resorbable implants, along with associated surgical instrumentation, principally marketed to craniomaxillofacial,neurosurgical, plastic, ear/nose/throat, pediatric and cardiothoracic surgeons through its subsidiary, Walter Lorenz Surgical, Inc. (“LorenzSurgical”). Lorenz Surgical also offers specialty craniomaxillofacial surgical instruments, HTR-PMI ® Hard Tissue Replacement for repair ofsevere cranial defects, and the Mimix ® Bone Substitute Material for use in craniomaxillofacial and neurosurgical applications.Lorenz Surgical manufactures and markets the LactoSorb ® Fixation System of resorbable plates and screws comprised of a copolymerof poly-L-lactic acid and polyglycolic acid. As a result of its innovative design, the LactoSorb ® System is comparable in strength to titaniumplating systems at its initial placement and is resorbed within 9 to 15 months after implantation. The LactoSorb ® System is especially beneficialin pediatric reconstruction cases by eliminating the need for a second surgery to remove the plates and screws.Mimix ® Bone Substitute Material is a synthetic tetra-calcium phosphate/tri-calcium phosphate material. This material is most commonly usedfor the repair of cranial defects and is currently offered in putty form. Mimix ® QS, a quick-setting bone substitute material, provides surgeonswith a faster-setting formulation. This version of the Mimix ® material in malleable putty form is designed to improve handling properties ofthis self-setting bone void filling material.Bone Substitute Materials. When presented with a patient demonstrating a bone defect, such as a fractured bone or boneloss due to removal of a tumor, the treating surgeon may remove a portion of bone from the patient at a second site to use as a graft to inducehealing at the site of the defect. Bone substitute materials eliminate the pain created at the graft site, as well as the costs associated with thisadditional surgical procedure. Depending on the specific use of the bone substitute material, it can have reconstructive, fixation or spinalapplications.Spinal ProductsThe Company’s spinal products include electrical stimulation devices for spinal applications, spinal fixation systems, bone substitute materialsand allograft services for spinal applications and the development of motion preservation systems. These products are marketed in the U. S.primarily under the <strong>Biomet</strong> Spine tradename.Spinal Fusion Stimulation Systems. Spinal fusions are surgical procedures undertaken to establish bony union between adjacentvertebrae. The Company distributes both non-invasive and implantable electrical stimulation units that surgeons can use as options to providean appropriate adjunct to surgical intervention in the treatment of spinal fusion applications. The Company has assembled extensive preclinicalresearch documenting the Mechanism of Action for the technology utilized in its spinal fusion stimulation systems.The SpinalPak ® Spine Fusion Stimulator utilizes capacitive coupling technology to encourage fusion incorporation. The Mechanism of Actionbehind the capacitive coupling stimulation technology involves the stimulation of osteopromotive factors that modulate normal bone healing,such as TGF-b1 and PGE2. The unit consists of a small, lightweight generator worn outside the body that is connected to wafer-thin electrodesapplied over the fusion site. The SpinalPak ® System is patient friendly, enhancing comfort whether the patient is standing, sitting or reclining,and optimizes compliance with the treatment regimen to enhance fusion success.The surgically implanted SpF ® Spinal Fusion Stimulator consists of a generator that provides a constant direct current to titanium cathodes placed wherebone growth is required. The Mechanism of Action behind the Company’s direct current stimulation technology involves the stimulation of a number ofosteoinductive growth factors including BMP-2, -6 and -7 and the BMP-2 receptor ALK2, which are normal physiological regulators of various stagesVHS ® is a registered trademark of Implant Distribution Network, Ltd.
of bone healing, including chondrogenesis and osteogenesis. The SpF ® Stimulator has exhibited a 50% increase in fusion success rates over fusionswith autograft alone. The SpF ® MINI, a new, smaller SpF ® Stimulator, designed to enhance patient comfort and physician pre-implant testing andimplantation, was launched during fiscal year <strong>2006</strong>.Spinal Fixation Systems. The Company markets spinal fixation products for various spinal fusion applications. The Company’sSynergy System has been on the market since 1992. This is a complete system, capable of addressing both degenerative and deformityindications. It is available in both stainless steel and titanium versions, offering 4.75mm and 6.35mm rod diameters, as well as a full complementof screws ranging from 4.0mm to 8.0mm in both fixed and polyaxial styles. The Synergy System also contains a full offering of hooks in awide variety of styles and sizes. A more recent introduction in this market is the Array ® Spinal System. The Array ® System has a single lockingsetscrew featuring V-Force Thread Technology designed to enhance the intraoperative ease of use for the surgeon during system locking. Infiscal year <strong>2006</strong>, the Company launched the Array ® Deformity Spine System, which includes various styles of screws, hooks and rods for scoliosiscorrection. The most recent product offering in this area is the Polaris System, which is a top-loading, inner tightening thoracolumbar systemutilizing a patented closing mechanism known as a Helical Flange . This feature helps prevent cross threading and seat splay, simplifying theimplant closing procedure for the surgeon. Currently, the Polaris System is available in titanium, in a 6.35mm rod diameter, with both fixed andpolyaxial screws ranging in size from 4.0 to 7.0mm. The Company also markets the Structure System, which utilizes various kinds of fixationwashers used to secure screws to the vertebral body for an anterior screw/rod construct. In the thoracolumbar fusion area, the Company marketsthe EBI ® Omega 21 Spine System. This system features a unique multidirectional coupler and expandable screw. The Company also marketsthe SpineLink ® -II Spinal Fixation System, which addresses many of the inherent limitations of traditional rod and plate systems by linkingeach spine segment individually for intrasegmental control. Through the use of a modular titanium link and polydirectional screw, this uniquesystem provides an intrasegmental option for spine fixation, enabling the surgeon to tailor the segmental construction to the patient’s anatomy.The Company offers a variety of spacer products for the thoracolumbar market segment. The Ionic ® Spine Spacer System features an opendesign that allows for optimal bone graft placement and bone ingrowth, along with the additional benefit of excellent postoperative x-rayvisualization. The Geo Structure ® family features various sizes and shapes, including ovals, straight rectangles and bent rectangles. The GeoStructure ® family of products are produced from cast titanium, offering a maximum amount of space inside the implant, with a minimumamount of material, resulting in excellent strength characteristics and imaging capabilities. The Solitaire System is a stand-alone device foranterior indications. The TPS System is a unique implant indicated for trauma and tumor pathologies of the thoracolumbar spine. This implantis designed as a combination of a plate and spacer that is expandable, allowing the surgeon to fit the implant to the defect. The Company alsooffers the ESL and Ibex Spine Systems. Both of these systems are endplate-sparing designs, reducing the risk of subsidence. In addition,both the ESL and Ibex Systems are open to permit ample space for bone graft placement and growth. The ESL System features an ellipticalshape offering optimal surface contact with the vertebral body endplates. The Ibex implant is curved to conform to the anatomical shape ofthe vertebral body. Additionally, the beveled corners of the Ibex implant facilitate ease of use for the surgeon during implantation. In fiscalyear <strong>2006</strong>, the Company released the Ibex System with a PEEK-OPTIMA ® implant option for increased radiographic fusion assessment.The Company plans to launch the PEEK-OPTIMA ® version of the ESL Spine System in fiscal year 2007.For cervical applications, the VueLock ® Anterior Cervical Plate System offers surgeons several important benefits. The open design of theVueLock ® System provides surgeons with enhanced visualization of the bone graft both during the actual surgical procedure and postoperativelyon x-ray. The Company also offers the C-Tek ® Anterior Cervical Plate System, which offers a constrained, semi-constrained or a completelyrigid construct, depending on the surgeon’s preference. Made from titanium, the C-Tek ® Anterior Cervical Plate System offers both fixedand variable screws in a wide variety of diameters and lengths. This system also features a unique locking mechanism to prevent screw backout. For posterior cervical procedures, the Company offers the Altius M-INI System, which offers top loading, inner tightening, polyaxialscrews as well as hooks for the cervico-thoracic spine. The Altius M-INI System features a 3.5mm rod and a wide variety of screws rangingin diameter from 3.5mm to 4.5mm. Occipital fixation is also available with the Altius M-INI System, featuring a low profile plate that isplaced independently from the rod, allowing for easier assembly and less rod contouring.Minimally-invasive spine surgery is of growing interest in the practice of many spine surgeons. Traditional, open surgical approaches tothe spine for discectomy, fusion and fixation have brought with them lengthy postoperative healing and rehabilitation issues. A minimallyinvasiveapproach to spine surgery has demonstrated less morbidity, minimal blood loss and further benefits such as a shorter hospital stay.In the minimally-invasive surgery market, the Company markets the VuePASS Portal Access Surgical System, which offers spine surgeonsan optimized balance between the current limitations of competitive percutaneous systems and traditional successful open techniques. Underdirect visualization for a posterior lumbar approach, the VuePASS System allows for traditional open techniques through a minimally-invasivecannula access system.To address the vertebral body compression fracture market, the Company offers a Vertebroplasty System. This system is designed for thedelivery of materials to weakened bony structures and comes in several different configurations, including the CDO , LP2 and DCD Systems. The Vertebroplasty System is a low-pressure system designed to deliver high viscosity material. Through a series of dilatingcannulae and various instruments, the Vertebroplasty System allows the surgeon to access the anatomy through a percutaneous approach andsafely deliver the desired material under low, controlled pressure.Helical Flange is a trademark of the Jackson Group.PEEK-OPTIMA ® is a registered trademark of Victrex PLC.
Bone Substitute Materials. Traditional spinal fixation surgery includes the use of a spinal fixation device in conjunction with a bonesubstitute or bone graft material to increase the likelihood of successful bone fusion. Pro Osteon ® 200R and Pro Osteon ® 500R are bone graftsubstitutes made from marine coral. Both are a resorbable combination of hydroxyapatite and calcium carbonate that is resorbed and replacedwith natural bone during the healing process. Pro Osteon ® 200R is available as granules. Pro Osteon ® 500R is available in granules and blocks.The EBI ® DBM (Demineralized Bone Matrix) Putty, derived exclusively from human bone, can be used with a variety of substances, suchas bone substitute material, machined allograft, autograft and platelet rich plasma, to enhance the surgeon’s treatment options. The Companyalso has available the InterGro ® line of DBM products (InterGro ® Paste, InterGro ® Putty and InterGro ® Plus). The InterGro ® DBM productsuse lecithin as a carrier. Lecithin is an entirely natural carrier that can be easily absorbed by the body.Precision Machined Allograft. Many spinal fusion procedures, in both the lumbar and cervical spine, involve interbody spinalfusion. Surgeons often utilize precision machined allograft spacers to fuse the interbody space. The Company provides services related tothe OsteoStim ® Cervical Allograft Spacer for anterior cervical interbody fusions, the OsteoStim ® ALIF Allograft Spacer for anterior lumbarinterbody fusions and the OsteoStim ® PLIF Allograft Spacer for posterior lumbar interbody fusions. All three systems are lordotic in shape,have serrated teeth on the top and bottom for added stability, are offered in various heights and have specific instrumentation to facilitateimplantation.Motion Preservation Products. The international clinical study for the lumbar version of the Regain Lumbar Artificial Disc, aone-piece pyrocarbon artificial disc nucleus replacement, began during fiscal year 2005. The pyrocarbon material has a high level of strength,is biocompatible and extremely resistant to wear. An IDE study for the Regain Disc is planned to begin in the United States during fiscalyear 2007. In addition, the Company is developing the Rescue Cervical Disc Replacement product and the Min T Lumbar Artificial Discfor total lumbar disc replacement procedures.Other ProductsThe Company also manufactures and distributes several other products, including orthopedic support products (also referred to assoftgoods and bracing products), arthroscopy products, operating room supplies, casting materials, general surgical instruments, wound careproducts and other surgical products. The Company manufactures and markets a line of arthroscopy products through its Arthrotek, Inc.(“Arthrotek”) subsidiary.Arthroscopy Products. Arthroscopy is a minimally-invasive orthopedic surgical procedure in which an arthroscope is inserted througha small incision to allow the surgeon direct visualization of the joint. This market is comprised of five product categories: power instruments, manualinstruments, visualization products, soft tissue anchors, and procedure-specific instruments and implants. Arthrotek’s principal products consistof the EZLoc Femoral Fixation Device, the WasherLoc Tibial Fixation Device, LactoSorb ® resorbable arthroscopic fixation products,MaxBraid PE high strength suture material and the InnerVue Diagnostic Scope System, which utilizes a needle scope to diagnose knee andshoulder conditions in a physician’s office.Orthopedic Support Products. The Company distributes a line of orthopedic support products under the EBI ® Sports Medicinename, including back braces, knee braces and immobilizers, wrist and forearm splints, cervical collars, shoulder immobilizers, slings, abdominalbraces, ankle supports and a variety of other orthopedic splints. Sales of these softgoods and bracing products are assisted by the S.O.S. SMSupport-on-Site stock and bill program, which efficiently handles the details of product delivery for the healthcare provider.Product DevelopmentThe Company’s research and development efforts are essentially divided into two categories: innovative new technology and evolutionarydevelopments. Most of the innovative new technology development efforts are focused on biomaterial products, and are managed at thecorporate level and take place primarily in Warsaw, Indiana. Evolutionary developments are driven primarily by the individual subsidiariesand include product line extensions and improvements.The Company continues to aggressively conduct internal research and development efforts to generate new marketable products, technologiesand materials. In addition, the Company is well positioned to take advantage of external acquisition and development opportunities. Animportant component of the Company’s strategy has been the formation of strategic alliances to enhance the development of newmusculoskeletal products.For the years ended May 31, <strong>2006</strong>, 2005 and 2004, the Company expended approximately $84,914,000, $79,676,000, and $63,636,000,respectively, on research and development. It is expected that ongoing research and development expenses will continue to increase.The Company’s principal research and development efforts relate to its orthopedic reconstructive devices, spinal fixation products, revisionorthopedic reconstructive devices, dental reconstructive implants, arthroscopy products, resorbable technology and biologics products.The Company’s research and development efforts have produced more than 700 new products and services during the last six fiscal years.During fiscal year 2007, the Company intends to release numerous new products, product line extensions and improvements.
Government RegulationMost aspects of the Company’s business are subject to some degree of government regulation in the countries in which its operationsare conducted. It has always been the practice of the Company to comply with all regulatory requirements governing its products andoperations and to conduct its affairs in an ethical manner. This practice is reflected in the Company’s Code of Business Conduct andEthics and through the responsibility of the Audit Committee of the Board of Directors to review the Company’s systems of internalcontrol, its process for monitoring compliance with laws and regulations and its process for monitoring compliance with its Code ofBusiness Conduct and Ethics. For some products, and in some areas of the world such as the United States, Canada, Japan and Europe,government regulation is significant and, in general, there appears to be a trend toward more stringent regulation throughout the world, aswell as global harmonization of various regulatory requirements. The Company devotes significant time, effort and expense to addressingthe extensive government and regulatory requirements applicable to its business. Governmental regulatory actions can result in the recall orseizure of products, suspension or revocation of the authority necessary for the production or sale of a product, and other civil and criminalsanctions. The Company believes that it is no more or less adversely affected by existing government regulations than are its competitors.In the United States, the development, testing, marketing and manufacturing of medical devices are regulated under the Medical DeviceAmendments of 1976 to the Federal Food, Drug and Cosmetic Act, the Safe Medical Devices Act of 1990, the FDA Modernization Act of1997, the Medical Device User Fee and Modernization Act of 2002 and additional regulations promulgated by the FDA and various other federal,state and local agencies. In general, these statutes and regulations require that manufacturers adhere to certain standards designed to ensure thesafety and efficacy of medical devices and related medical products.The Company believes it is well positioned to face the changing international regulatory environment. The International StandardsOrganization (“ISO”) has an internationally recognized set of standards aimed at ensuring the design and manufacture of qualityproducts. A company that has passed an ISO audit and obtained ISO certification applicable to its activity sector is internationallyrecognized as having quality manufacturing processes. The European Union legislation requires that medical devices bear a CE mark. TheCE mark is a European Union and European Free Trade Association symbol, which indicates that the product adheres to European MedicalDevice Directives. Compliance with ISO quality systems standards is one of the requirements for placing the CE mark on the Company’sproducts. Each of the Company’s principal manufacturing facilities has been certified to ISO 13485:2003. Each of the Company’s productssold in Europe bears the CE mark, with the exception of custom-made implants that do not require a CE mark.In addition, governmental bodies in the United States and throughout the world have expressed concern about the costs relating to healthcare and,in some cases, have focused attention on the pricing of medical devices. Government regulation regarding pricing of medical devices alreadyexists in some countries and may be expanded in the United States and other countries in the future. The Company is subject to increasingpricing pressures worldwide as a result of growing regulatory pressures, as well as the expanding predominance of managed care groups andinstitutional and governmental purchasers. Under Title VI of the Social Security Amendments of 1983, hospitals receive a predeterminedamount of Medicare reimbursement for treating a particular patient based upon the patient’s type of illness identified with reference to thepatient’s diagnosis under one or more of several hundred diagnosis-related groups (“DRGs”). Other factors affecting a specific hospital’sreimbursement rate include the size of the hospital, its teaching status and its geographic location. The Company’s orthopedic reconstructiveproducts are primarily covered by DRG 544 (Major Joint Replacement or Reattachment of the Lower Extremity; previously included inDRG 209), DRG 545 (Revision of Hip or Knee Replacement; previously included in DRG 209), DRG 471 (Bilateral Major Procedures ofthe Lower Extremity) and DRG 491 (Major Joint and Limb Reattachment Procedures–Upper Extremities), and have also received approvalfor pass-through coding under the Hospital Outpatient Prospective Payment System. Effective October 1, 2005, certain reimbursements forDRG payment were adjusted by the Center for Medicare and Medicaid Services (CMS). In addition, CMS replaced DRG 209 (Major Jointand Limb Reattachment Procedures–Lower Extremities), with DRG codes 544 and 545. The new reimbursement rates for DRG 544 andDRG 545 represented an increase of 0.1% and 26.5%, respectively, over the previous DRG 209 rate. The reimbursement rates for DRG 471and 491 were increased 6.6% and 2.1%, respectively. In addition, the average reimbursement rates for spinal and trauma procedures wereincreased 5.0% and 4.5%, respectively.On August 1, <strong>2006</strong>, CMS announced the revised rates that will go into effect October 1, <strong>2006</strong>. CMS has proposed substantial changes in theDRGs, based on recommendations made by the Congressional Medicare Payment Advisory Commission (MedPAC). These proposed changeshave three major components. First, there would be an across-the-board payment increase of approximately 3.0%, consisting of a 3.4% increasein operating payments and essentially no increase in capital payments. Second, the DRG relative weights would be set on the basis of averageaccounting costs in each DRG rather than average standardized charges (cost-based weights). Third, in 2008, or possibly earlier, CMS wouldbegin to eliminate the current DRGs in favor of consolidated severity-adjusted DRGs (CSA-DRGs), which would group cases in ways thatare sometimes substantially different from the current DRGs. In addition, these proposed changes would separate out cases by the apparentseverity of illness based on diagnoses reported on the inpatient claims (severity-adjusted DRGs).
EXECUTIVE OFFICERS OF THE REGISTRANTThe name, age, business background, positions held with the Company and tenure as an executive officer of each of the Company’s executiveofficers as of August 1, <strong>2006</strong> are set forth below. No family relationship exists among any of the executive officers. Except as otherwisestated, each executive officer has held the position indicated during the last five years. Executive officers are elected annually by the Boardof Directors to serve for one year and until their successors are elected, subject to resignation, retirement or removal.Served as Executive Current Position(s)Name, Age and Business Experience Officer Since with the CompanyDaniel P. Hann, 51Interim President and Chief Executive Officer since March 27, <strong>2006</strong>. 1989 Interim President and ChiefPrior thereto, Senior Vice President, General Counsel and SecretaryExecutive Officer andof the Company. Director of the Company since 1989.Director of the Company.Charles E. Niemier, 50Senior Vice President of the Company, President of EBI, L.P., <strong>Biomet</strong> Spine and 1984 Senior Vice President of the<strong>Biomet</strong> Trauma since July 14, <strong>2006</strong>. Chief Operating Officer – InternationalCompany, President of EBI, L.P.,Operations from December 2005 to July <strong>2006</strong>. Prior thereto, Senior Vice President –<strong>Biomet</strong> Spine and <strong>Biomet</strong> TraumaInternational Operations of the Company. Director of the Company since 1987.and Director of the Company.Garry L. England, 52Chief Operating Officer – Domestic Operations since December 2005. 1987 Chief Operating Officer –Prior thereto, Senior Vice President - Warsaw Operations.Domestic OperationsGregory D. Hartman, 49Senior Vice President – Finance, Chief Financial Officer and Treasurer. 1991 Senior Vice President –Finance, Chief FinancialOfficer and TreasurerJames W. Haller, 49Controller of the Company and Vice President – Finance 1991 Controller of the Companyof <strong>Biomet</strong> Orthopedics, Inc. since June 2001.and Vice President – Financeof <strong>Biomet</strong> Orthopedics, Inc.Roger P. Van Broeck, 58President of International Operations since July <strong>2006</strong>, Vice President 2004 President of Internationalof the Company since July 2004, and President of <strong>Biomet</strong> EuropeOperationssince March 2004. Prior thereto Chief Executive Officer of BioMer C.V.and <strong>Biomet</strong> Merck B.V.Steven F. Schiess, 46Vice President of the Company and President of Implant Innovations 2005 Vice President of the CompanyInc. since June 2005. Prior thereto, Senior Vice President,and President of ImplantSales and Marketing of Implant Innovations, Inc.Innovations, Inc.Bradley J. Tandy, 47Vice President, Acting General Counsel and Secretary and Corporate <strong>2006</strong> Vice President, Acting GeneralCompliance Officer since March 27, <strong>2006</strong>. Prior thereto, Vice President,Counsel and Secretary andAssistant General Counsel and Corporate Compliance Officer.Corporate Compliance OfficerThomas R. Allen, 53President – International Operations, The Americas and Asia Pacific since <strong>2006</strong> President – InternationalJune 29, <strong>2006</strong>. Prior thereto, Vice President – The Americas and Asia PacificOperations, The Americasfor <strong>Biomet</strong> Orthopedics, Inc.and Asia Pacific13
EXECUTIVE OFFICERS OF THE REGISTRANT, continuedRichard J. Borror, 47Chief Information Officer and Corporate Vice President for Manufacturing <strong>2006</strong> Chief Information Officersince April 10, <strong>2006</strong>. Corporate Vice President for Manufacturing fromand Corporate Vice PresidentDecember 2005 to April <strong>2006</strong>. Prior thereto, Vice President – Manufacturingfor Manufacturingfor <strong>Biomet</strong> Manufacturing Corp.Gregory W. Sasso, 44Senior Vice President – Corporate Development and Communications <strong>2006</strong> Senior Vice President –since June 29, <strong>2006</strong>. Prior thereto, Vice President – Corporate DevelopmentCorporate Development andand Communications of <strong>Biomet</strong>, Inc.CommunicationsDarlene Whaley, 49Senior Vice President – Human Resources since June 29, <strong>2006</strong>. Prior <strong>2006</strong> Senior Vice President –thereto, Vice President – Human ResourcesHuman ResourcesWilliam C. Kolter, 48President, <strong>Biomet</strong> Orthopedics, Inc. since December 2005. Prior thereto, <strong>2006</strong> President – <strong>Biomet</strong>Vice President – Marketing of <strong>Biomet</strong> Orthopedics, Inc.Orthopedics, Inc.14
Item 1A. Risk Factors.The following factors, among others, could cause the Company’s future results to differ from those contained in forward-lookingstatements made in this report and presented elsewhere by management from time to time. Such factors, among others, may have a materialadverse effect on the Company’s business, financial condition and results of operations. The risks identified in this section are notexhaustive. The Company operates in a dynamic and competitive environment. New risk factors affecting the Company emerge from timeto time and it is not possible for management to predict all such risk factors. Further, it is not possible to assess the impact of all risk factorson the Company’s business or the extent to which any single factor or combination of factors may cause actual results to differ materiallyfrom those contained in any forward-looking statements. Given these inherent risks and uncertainties, investors are cautioned not to placeundue reliance on forward-looking statements as a prediction of actual results. In addition, the Company undertakes no obligation to publiclyupdate or revise any forward-looking statements, whether as a result of new information, future events or otherwise. The followingdiscussion of the Company’s risk factors speaks only as of the date on which they were made and should be read in conjunction with theconsolidated financial statements and related notes included herein. Because of these and other factors, past financial performance should not beconsidered an indication of future performance.The Company’s future profitability depends on the success of the Company’s principal product lines.Sales of the Company’s reconstructive products accounted for approximately 68% of the Company’s net sales for the year ended May 31,<strong>2006</strong>. The Company expects sales of reconstructive products to continue to account for a significant portion of the Company’s aggregatesales. Any event adversely affecting the sale of reconstructive products may, as a result, adversely affect the Company’s business, results ofoperations and financial condition.If the Company is unable to continue to develop and market new products and technologies in a timely manner, the demand for the Company’sproducts may decrease, or the Company’s products could become obsolete, and the Company’s revenue and profitability may decline.The market for the Company’s products is highly competitive and dominated by a small number of large companies. The Company iscontinually engaged in product development, research and improvement efforts, and new products and line extensions of existing productsrepresent a significant component of the Company’s growth rate. The Company’s ability to continue to grow sales effectively depends on itscapacity to keep up with existing or new products and technologies in the musculoskeletal products market. In addition, if the Company’scompetitors’ new products and technologies reach the market before the Company’s products, they may gain a competitive advantage or renderthe Company’s products obsolete. See “Competition” in Item 1 – “Business” of this Form 10-K for more information about the Company’scompetitors. The ultimate success of the Company’s product development efforts will depend on many factors, including, but not limitedto, the Company’s ability to create innovative designs and materials; provide innovative surgical techniques; accurately anticipate and meetcustomers’ needs; commercialize new products in a timely manner; and manufacture and deliver products and instrumentation in sufficientvolumes on time.Moreover, research and development efforts may require a substantial investment of time and resources before the Company is adequatelyable to determine the commercial viability of a new product, technology, material or other innovation. Even in the event that the Company isable to successfully develop innovations, they may not produce revenue in excess of the costs of development and may be quickly renderedobsolete as a result of changing customer preferences or the introduction by the Company’s competitors of products embodying new technologiesor features.The Company is subject to substantial government regulation that could have a material adverse effect on the Company’s business.Most aspects of the Company’s business are subject to some degree of government regulation in the countries in which its operations areconducted. As discussed under the heading “Government Regulation” in Item 1 – “Business” of this Form 10-K, for some products and insome areas of the world, such as the United States, Canada, Japan and Europe, government regulation is significant. Overall, there appears tobe a trend toward more stringent regulation throughout the world. The Company does not anticipate this trend to dissipate in the near future. Inaddition, the medical device industry is subject to a myriad of complex laws governing Medicare and Medicaid reimbursements and the U.S.Department of Health and Human Services has become increasingly vigilant in recent years with respect to investigations of various businesspractices. Further, as a publicly-traded company, the Company is subject to increasingly demanding corporate and financial legislation in theUnited States, such as the Sarbanes-Oxley Act of 2002, which requires the time and attention of management and creates additional costsand expenses.In general, the development, testing, manufacture and marketing of the Company’s products are subject to extensive regulationand review by numerous governmental authorities both in the United States and abroad. The regulatory process requires the expenditureof significant time, effort and expense to bring new products to market. In addition, the Company is required to implement and maintain15
stringent reporting, labeling and record keeping procedures. The Company cannot assure that the relevant authorities will approve any of itsproducts. Furthermore, governmental and regulatory actions against the Company can result in various actions that could adversely impactthe Company’s operations, including:• the recall or seizure of products;• the suspension or revocation of the authority necessary for the production or sale of a product;• the imposition of fines and penalties;• the delay of the Company’s ability to introduce new products into the market; and• other civil or criminal sanctions against the Company.The Company is subject to risks arising from currency exchange rate fluctuations, which could increase the Company’s costs and maycause the Company’s profitability to decline.During fiscal year <strong>2006</strong>, sales of the Company’s products in foreign markets approximated $700,626,000 or 35% of the Company’s total revenues.Accordingly, the U.S. dollar value of the Company’s foreign-generated revenues varies with currency exchange rate fluctuations. Measured inlocal currency, the majority of the Company’s foreign-generated revenues was generated in Europe. Significant increases in the value of theU.S. dollar relative to foreign currencies could have an adverse effect on the Company’s results of operations. The Company’s consolidatednet sales were negatively affected by approximately 1% during fiscal year <strong>2006</strong> and positively affected by 2% during fiscal year 2005, as aresult of the impact of foreign currency translations. At the present time, the Company does not engage in hedging transactions to protectagainst uncertainty in future exchange rates between any particular foreign currency and the U.S. dollar.Sales may decline if the Company’s customers do not receive adequate levels of reimbursement from third-party payors for the Company’sproducts and if certain types of healthcare programs are adopted in the Company’s key markets.In the United States, healthcare providers that purchase the Company’s products generally rely on payments from third-party payors (principallyfederal Medicare, state Medicaid and private health insurance plans) to cover all or a portion of the cost of the Company’s musculoskeletalproducts. In the event that third-party payors deny coverage or reduce their current levels of reimbursement, the Company may be unable tosell certain of its products on a profitable basis, thus, adversely impacting the Company’s results of operations. Further, third-party payors arecontinuing to carefully review their coverage policies with respect to existing and new therapies and can, without notice, deny coverage fortreatments that may include the use of the Company’s products.In addition, some healthcare providers in the United States have adopted, or are considering the adoption of, a managed care system in whichthe providers contract to provide comprehensive healthcare for a fixed cost per person. Healthcare providers in a managed care system mayattempt to control costs by authorizing fewer elective surgical procedures, including joint reconstructive surgeries, or by requiring the useof the least expensive implant available. In response to these, and other, pricing pressures, the Company’s competitors may lower the pricesfor their products. The Company may not be able to match the prices offered by the Company’s competitors, thus, adversely impacting theCompany’s results of operations and future prospects. Further, in the event that the United States considers the adoption of a national healthcaresystem in which prices are controlled and patient care is managed by the government, such regulation could have a material adverse effect onthe Company’s business, results of operations and financial condition.Outside the United States, reimbursement systems vary significantly from country to country. In the majority of the international markets inwhich the Company’s products are sold, government-managed healthcare systems mandate the reimbursement rates and methods for medicaldevices and procedures. If adequate levels of reimbursement from third-party payors outside of the United States are not obtained, internationalsales of the Company’s products may decline. Many foreign markets, including Canada, and some European and Asian countries, havetightened reimbursement rates. The ability of the Company to continue to sell certain of its products profitably in these markets may diminishif the government-managed healthcare systems continue to reduce reimbursement rates.The Company’s business may be harmed as a result of litigation.The Company’s involvement in the manufacture and sale of medical devices creates exposure to significant risk of product liability claims,particularly in the United States. In the past, the Company has received product liability claims relating to the Company’s products andanticipates that it will continue to receive claims in the future, some of which could have a negative impact on the Company’s business.Additionally, the Company could experience a material design or manufacturing failure in its products, a quality system failure, other safetyissues or heightened regulatory scrutiny that would warrant a recall of some of the Company’s products. The Company’s existing productliability insurance coverage may be inadequate to satisfy liabilities the Company might incur. If a product liability claim or series of claimsis brought against the Company for uninsured liabilities or is in excess of the Company’s insurance coverage limits, the Company’s businesscould suffer and its results could be materially impacted.16
In addition, the musculoskeletal products industry is highly litigious with respect to the enforcement of patents and other intellectual propertyrights. In some cases, intellectual property litigation may be used to gain a competitive advantage. The Company has in the past and may inthe future become a party to lawsuits involving patents or other intellectual property. Further, as a publicly traded company, the Companymay be the subject of shareholder litigation. A legal proceeding, regardless of the outcome, could put pressure on the Company’s financialresources and divert the time, energy and efforts of the Company’s management.A natural or man-made disaster could have a material adverse effect on the Company’s business.The Company has approximately twenty manufacturing operations located throughout the world. However, a significant portion of theCompany’s products are produced at and shipped from its facility in Warsaw, Indiana. In the event that this facility were severely damagedor destroyed as a result of a natural or man-made disaster, the Company would be forced to shift production to its other facilities and/or relyon third-party manufacturers. Such an event could have a material adverse effect on the Company’s business prospects, results of operationsand financial condition.The Company may not be able to retain its historical level of business in the bone cements and cement delivery system market segment.During fiscal year <strong>2006</strong>, Heraeus Kulzer GmbH (“Kulzer”) ended its relationship with the Company. Historically, Kulzer was the primarysupplier of bone cement to the Company, including, most notably, the Palacos ® family of bone cement products. In addition, price increases forthe Septopal ® product (which continues to be supplied by Kulzer to the Company) that were put into effect at the end of fiscal year 2005 haveled to significantly decreased profit on sales of the Septopal ® product. The Company has been working to broaden the range of its internallydeveloped and manufactured bone cement products. Although the Company believes the bone cement products newly introduced and underdevelopment are well suited to meet the current trends in orthopedic surgery, and with respect to some products represent an improvement inbone cement, the market acceptance of those products has yet to be determined. The Company cannot provide any assurances that it will beable to maintain its historic level of bone cement sales and such a decrease in sales may adversely affect the Company’s financial results.The Company, like other companies in the orthopedic industry, is involved in ongoing investigations by the United States Department ofJustice, the results of which may adversely impact the Company’s business and results of operations.As discussed in greater detail in Item 3 on page 19 of this Form 10-K, the Company has received two grand jury subpoenas from the UnitedStates Department of Justice. The Company has cooperated and intends to continue to fully cooperate with the Department of Justice.Nonetheless, the results of these inquiries may not be known for several years. The cooperation in these inquiries requires the diversion ofCompany resources, including time and expense, from other Company matters. Moreover, in the event that the Company is found to haveviolated one or more applicable laws as a result of these investigations, our business and results of operations may be materially adverselyimpacted and the Company may be required to significantly change some of its existing business practices.Item 1B. Unresolved Staff Comments.None.Palacos ® is a registered trademark of Heraeus Kulzer GmbH.17
Item 2. Properties.The following are the principal properties of the Company:FACILITY LOCATION SQUARE OWNED/FEET LEASEDCorporate headquarters of <strong>Biomet</strong>, Inc.; Warsaw, Indiana 517,200 Ownedmanufacturing, storage and research and development facilitiesof <strong>Biomet</strong> Manufacturing Corp.; distribution centerand offices of <strong>Biomet</strong> Orthopedics, Inc.Administrative, manufacturing and distribution facility (1) Parsippany, New Jersey 1 63,000 Ownedof EBI, L.P. and administrative offices of Electro-Biology, Inc. (2) Parsippany, New Jersey 209,700 OwnedManufacturing facility of EBI, L.P. Allendale, New Jersey 30,000 LeasedManufacturing facility of EBI, L.P. Marlow, Oklahoma 51,500 OwnedAdministrative, manufacturing and distribution facility Jacksonville, Florida 82,500 Ownedof Walter Lorenz Surgical, Inc.Office, manufacturing and distribution facility (1) Palm Beach Gardens, FL 117,000 Ownedof Implant Innovations, Inc. (2) Palm Beach Gardens, FL 2 69,000 OwnedOffice and manufacturing facilities of Arthrotek, Inc. (1) Ontario, California 35,400 Owned(2) Redding, California 14,400 LeasedManufacturing facility of <strong>Biomet</strong> Fair Lawn L.P. Fair Lawn, New Jersey 40,000 OwnedOffice and manufacturing facility of Electro-Biology, Inc. Guaynabo, Puerto Rico 34,700 OwnedOffice, manufacturing and distribution facilities (1) Irvine, California 36,800 Leasedof Interpore Spine Ltd. (2) Irvine, California 27,700 LeasedOffice, manufacturing and warehouse facility of Valence, France 86,100 Owned<strong>Biomet</strong> France SarlOffice, manufacturing and warehouse facilities of Berlin, Germany 49,900 Owned<strong>Biomet</strong> Deutschland GmbHOffice and research and development facility of <strong>Biomet</strong> Darmstadt, Germany 29,200 LeasedDeutschland GmbHAdministrative offices of <strong>Biomet</strong> Europe B.V. and office Dordrecht, The Netherlands 37,700 Ownedand warehouse facility of <strong>Biomet</strong> Nederland BV, WalterLorenz Surgical Europe B.V. and <strong>Biomet</strong> Europe Spine B.V.Office and manufacturing facility of <strong>Biomet</strong> Spain Valencia, Spain 69,600 OwnedOrthopedics S.L.Office, manufacturing and warehouse facilities of <strong>Biomet</strong> Sjöbo, Sweden 24,200 OwnedCementing Technologies ABManufacturing and administrative facilities of (1) Bridgend, South Wales 105,200 Owned<strong>Biomet</strong> UK Ltd. (2) Swindon, England 53,400 OwnedIn addition, the Company maintains more than 30 other manufacturing facilities, offices and warehouse facilities in variouscountries, including Canada, Europe, Asia Pacific and Latin America. The Company believes that all of its facilities are adequate,well-maintained and suitable for the development, manufacture, distribution and marketing of all its products.1Includes 42,000 square feet of space in this facility that is leased to other parties.2Includes 23,000 square feet of space in this facility that is leased to other parties.18
Item 3. Legal Proceedings.On March 30, 2005 the Company announced that it had received a subpoena from the U.S. Department of Justice through the U.S.Attorney for the District of New Jersey requesting documents related to any consulting and professional service agreements with orthopedicsurgeons using or considering the use of <strong>Biomet</strong>’s hip or knee implants for the period January 2002 through March 29, 2005. The Company isaware that similar inquiries were directed to other companies in the orthopedics industry. On July 19, <strong>2006</strong> <strong>Biomet</strong> received a letter from theU.S. Department of Justice through the U.S. Attorney for the District of New Jersey requesting additional documents further to the subpoenaissued in March 2005. This letter requested additional documents related to consulting and service agreements for the time period January1998 through the present, as well as research and other grant agreements for that same time period. Further, the letter requested that theCompany provide copies of the agreements identified in the supplemental request on an on-going basis. In addition, the requested informationrelated to Company-sponsored training events, the selection process used by the Company to identify consultants and researchers, theCompany’s product design process for hip and knee implants and information on the Company’s orthopedic sales force. The Company hascooperated and intends to continue to fully cooperate with the Department of Justice inquiry. The results of this inquiry may not be knownfor several years.In February <strong>2006</strong>, SDGI Holdings, Inc. and Medtronic Sofamor Danek, Inc. (collectively referred to herein as “Medtronic”) brought anaction against EBI and <strong>Biomet</strong> alleging infringement of seven patents. Specifically, Medtronic alleges that the patents are infringed by certaincomponents of the Company’s Vuelock ® Anterior Cervical Plate System, as well as instruments and surgical implantation methods associatedwith the Company’s Array ® Spinal System. Medtronic’s complaint did not seek a specific amount of damages, but does seek to enjoin theCompany from manufacturing, selling and/or distributing the allegedly infringing products. The Company has filed a counterclaim seekinga finding of noninfringement of the patents at issue and a finding that certain of the patents are invalid and unenforceable. The litigation is inthe early stages of discovery. The Company is vigorously defending this matter and intends to continue to do so.On June 26, <strong>2006</strong> the Company announced that it had received a federal grand jury subpoena issued at the request of the U.S. Departmentof Justice, Antitrust Division, requesting documents regarding possible violations of federal criminal law, including possible violations ofthe antitrust laws, relating to the manufacture and sale of orthopedic implant devices (the “Subpoena”). The Subpoena requests documentsfrom January 1, 2001 through the present date. The Company is aware of similar subpoenas directed to other companies in the orthopedicsindustry. The Company has cooperated and intends to continue to fully cooperate with the Department of Justice investigation. Theresult of this investigation may not be known for several years. However, the scope of the Subpoena has currently been narrowed to aspecific geographic region and specific product lines. It is the Company’s belief that the other orthopedic companies that received similarsubpoenas have received similar guidance. It is the Company’s belief that the investigation was prompted by an unsolicited e-mail sent by arepresentative of one of the Company’s competitors that proposed a common pricing strategy in connection with a particular hospital. Thise-mail was received by an independent sales representative of an independent distributor for <strong>Biomet</strong> Orthopedics, but it was never transmittedto the Company. Neither the Company, its independent distributor, nor its independent sales representative took any action in response tothe e-mail, and the Company believes that no anticompetitive activity took place as a result of it. The Company requires compliance by itsemployees and its independent distributors with its Code of Business Conduct and Ethics and with applicable antitrust laws. The informationprovided herein is limited to the information available to the Company at the present time and the Company cannot offer any assurances asto the scope and final outcome of this investigation.On an issue related to the subpoena received from the Antitrust Division of the U.S. Department of Justice, the Company has received twocomplaints in class action lawsuits alleging violations of the Sherman Antitrust Act. In addition, the Company is aware of other complaints thathave been filed, but not served on the Company. The complaints also named various other companies in the orthopedics industry as defendants.The Company intends to vigorously defend this matter and believes that it has meritorious defenses to the claims being asserted.There are various other claims, lawsuits, disputes with third parties, investigations and pending actions involving various allegations against theCompany incident to the operation of its business, principally product liability and intellectual property cases. Each of these matters is subjectto various uncertainties, and it is possible that some of these matters may be resolved unfavorably to the Company. The Company establishesaccruals for losses that are deemed to be probable and subject to reasonable estimate. Based on the advice of counsel to the Company in thesematters, management believes that the ultimate outcome of these matters and any liabilities in excess of amounts provided will not have amaterial adverse impact on the Company’s consolidated financial statements taken as a whole.Item 4. Submission of Matters to a Vote of Security Holders.Not Applicable.19
THIS PAGE INTENTIONALLY LEFT BLANK20
part iiItem 5. Market for the Registrant’s Common Equity, RelatedStockholder Matters and Issuer Purchases of Equity Securities.The following table shows the quarterly range of high and low sales prices for the Company’s Common Shares as reported by TheNasdaq Stock Market for each of the three most recent fiscal years ended May 31. The approximate number of shareholders of record as ofJuly 13, <strong>2006</strong>, was 5,774.HighLow<strong>2006</strong>20052004Fourth $39.45 $33.64Third 38.66 34.90Second 39.09 32.50First 39.11 33.64Fourth $43.32 $34.90Third 49.64 40.53Second 49.50 43.13First 49.60 39.69Fourth $41.67 $37.05Third 41.25 34.50Second 36.25 29.56First 30.95 27.26The Company paid cash dividends of $0.25, $0.20 and $0.15 per share during fiscal years ending May 31, <strong>2006</strong>, 2005 and2004, respectively.On June 28, <strong>2006</strong>, the Company announced a cash dividend of $0.30, payable July 21, <strong>2006</strong>, to shareholders of record at theclose of business on July 14, <strong>2006</strong>.Issuer Purchases of Equity SecuritiesDuring the quarter ended May 31, <strong>2006</strong>, the Company had two publicly-announced share repurchase programs outstanding. The first, announcedJune 30, 2005, approved the purchase of 2,500,000 shares to be automatically purchased daily in equal increments over a twelve-month period.The second, announced December 21, 2005, approved the purchase of shares up to $100 million in open market or privately-negotiatedtransactions through December 20, <strong>2006</strong>. The shares repurchased in the last quarter of fiscal <strong>2006</strong>, the average price paid, and shares (orapproximate dollar value) remaining available for purchase are as follows:Total Number ofMaximum Number ofShares PurchasedShares (or ApproximateTotal Number of Average Price as Part of Publicly Dollar Value) that May YetPeriod Shares Purchased Paid Per Share Announced Plans Be Purchased Under the PlansMarch 1–31 369,800 $35.74 369,800 620,000 shares and $73,851,913April 1–30 939,900 37.40 939,900 430,000 shares and $45,861,661May 1–31 220,000 36.08 220,000 210,000 shares and $45,861,661Total 1,529,700 $36.81 1,529,700 210,000 shares and $45,861,66121
Item 6. Selected Financial Data.Income Statement DataYears ended May 31,(in thousands, except per share amounts)<strong>2006</strong> 2005 2004 2003 2002Net sales.......................................................................................... $2,025,739 $1,879,950 $1,615,253 $1,390,300 $1,191,902Cost of sales.................................................................................... 582,070 533,096 461,502 407,295 332,727Gross profit..................................................................................... 1,443,669 1,346,854 1,153,751 983,005 859,175Selling, general and administrative expenses................................. 750,428 694,254 595,234 495,391 437,731Research and development expense............................................... 84,914 79,696 63,636 55,309 50,750In-process research and development............................................. – 26,020 1,250 – –Other charges/(credits)................................................................... – – – (5,800) –Operating income........................................................................... 608,327 546,884 493,631 438,105 370,694Other income, net........................................................................... 2,874 2,816 15,165 13,638 5,421*Income before income taxes and minority interest...................... 611,201 549,700 508,796 451,743 376,115Provision for income taxes............................................................. 205,057 198,084 176,098 156,961 127,665Income before minority interest................................................. 406,144 351,616 332,698 294,782 248,450Minority interest............................................................................. – – 7,071 8,081 8,710Net income.................................................................................. $ 406,144 $ 351,616 $ 325,627 $ 286,701 $ 239,740Earnings per share:Basic........................................................................................... $1.64 $1.39 $1.27 $1.10 $.89Diluted........................................................................................ 1.63 1.38 1.27 1.10 .88Shares used in the computation of earnings per share:Basic........................................................................................... 247,576 252,387 255,512 259,493 268,475Diluted........................................................................................ 248,430 254,148 257,204 261,394 271,245Cash dividends paid per common share......................................... $.25 $.20 $.15 $.10 $.09Balance Sheet DataAt May 31,(in thousands)<strong>2006</strong> 2005 2004 2003 2002Working capital............................................................................... $ 794,996 $ 672,525 $ 807,259 $ 845,101 $ 715,245Total assets...................................................................................... 2,263,922 2,096,577 1,782,905 1,672,169 1,521,723Shareholders’ equity....................................................................... 1,716,499 1,563,931 1,448,210 1,286,134 1,176,479• The selected financial data includes the operations of Interpore International, Inc. from its date of acquisition (June 18, 2004).* Other income, net for fiscal 2002 was adversely impacted by a $9 million charge as a result of equity write-downs in marketablesecurities and other investments.22
Item 7. Management’s Discussion & Analysis of Financial Condition& Results of Operations.This discussion should be read in conjunction with the Company’s consolidated financial statements and the corresponding notes containedherein. The Management’s Discussion and Analysis of Financial Condition and Results of Operations contains forward-looking statementsthat are subject to certain risk factors, as discussed elsewhere in this report under the caption Forward-Looking Statements.Overview<strong>Biomet</strong>, Inc. (the “Company”) is engaged in the research, development, manufacturing and marketing of products used primarily bymusculoskeletal medical specialists. The Company operates in one business segment, musculoskeletal products, which includes the design,manufacture and marketing of products in four major market segments: reconstructive products, fixation devices, spinal products andother products. Reconstructive products, which represented 68% of the Company’s net sales for fiscal year <strong>2006</strong>, include knee, hip andextremity joint replacement systems, as well as dental reconstructive implants, bone cements and accessories, the GPS ® System and theprocedure-specific instrumentation required to implant the Company’s reconstructive systems. Fixation devices, which represented 12% ofthe Company’s net sales for fiscal year <strong>2006</strong>, include internal and external fixation devices, craniomaxillofacial fixation systems and electricalstimulation devices that do not address the spine. Spinal products, which represented 11% of the Company’s net sales for fiscal year <strong>2006</strong>,include electrical stimulation devices addressing the spine, spinal fixation systems and orthobiologics. The other product sales category,which represented 9% of the Company’s net sales for fiscal year <strong>2006</strong>, includes arthroscopy products, softgoods and bracing products,casting materials, general surgical instruments, operating room supplies and other surgical products. Depending on the intended application,the Company reports sales of bone substitute materials in the reconstructive product, fixation device or spinal product segment.The Company has operations at over 50 locations and distributes its products in over 100 countries throughout the world and manages itsoperations through three reportable geographic markets: United States, Europe and Rest of World. The solid growth experienced by theCompany during fiscal year <strong>2006</strong> in both domestic and international markets is attributable to the Company’s emphasis on technologicaladvances through product line extensions and new product introductions. In addition, growth in the patient population (as a result of increasesin both the size of the elderly population and the expansion of the traditional age bracket of musculoskeletal patients) has contributed tothis growth.The following table shows the percentage relationship to net sales of items derived from the Consolidated Statements of Income and thepercentage change from year to year.<strong>2006</strong> 2005<strong>2006</strong> 2005 2004 vs. 2005 vs. 2004Net sales.......................................................................................... 100.0% 100.0% 100.0% 8% 16%Cost of sales.................................................................................... 28.7 28.4 28.5 9 16Gross profit..................................................................................... 71.3 71.6 71.5 7 17Selling, general and administrative expenses................................. 37.1 36.9 36.9 8 17Research and development expense............................................... 4.2 4.2 3.9 7 25In-process research and development............................................. – 1.4 0.1 n/m n/mOperating income........................................................................... 30.0 29.1 30.6 11 11Other income, net........................................................................... 0.1 0.1 0.9 2 (81)Income before income taxes and minority interest......................... 30.1 29.2 31.5 11 8Provision for income taxes............................................................. 10.1 10.5 10.9 4 12Income before minority interest..................................................... 20.0 18.7 20.6 16 6Minority interest............................................................................. – – 0.4 n/m n/mNet income...................................................................................... 20.0% 18.7% 20.2% 16% 8%n/m – Not MeaningfulPercentage of Net SalesPercentageIncrease (Decrease)23
Management’s Discussion & Analysis of Financial Condition& Results of Operations (continued)Fiscal <strong>2006</strong> Compared to Fiscal 2005*Net Sales – Net sales increased 8% during the current fiscal year to $2,025,739,000 from $1,879,950,000 in 2005. Excluding thenegative impact of foreign currency translations (1%), net sales increased 9%. Worldwide sales of reconstructive devices increased 10%to $1,379,420,000 in fiscal <strong>2006</strong> compared to $1,254,234,000 in 2005. Factors contributing to this increase include incremental volumeand product mix (11%), offset by currency translation (1%). During the current year, worldwide dental reconstructive product salesincreased 14%, knee and extremity sales increased 12%, hip sales increased 9% and bone cement and accessory sales decreased 5%.Bone cement and accessory sales were negatively impacted by the loss of the Company’s primary bone cement supplier during the year.The Company introduced its own bone cement during the year and anticipates recapturing some of its lost market share.Fixation sales increased 2% during fiscal <strong>2006</strong> to $251,360,000 from $246,730,000 in 2005. Increased volume and product mix (3%) offsetby pricing decreases (1%), accounted for this increase. Worldwide sales of craniomaxillofacial products, including bone substitutes, increased12%, internal fixation devices increased 6%, electrical stimulation devices decreased 2% and external fixation devices decreased 7%. Thecombination and management of the Interpore and EBI salesforces continues to have a negative impact on sales in the fixation, spinal andsoftgoods and bracing market segments. In July <strong>2006</strong>, the Company named a new management team at its EBI subsidiary and acceleratedits time frame for converting this business unit’s name to <strong>Biomet</strong>.Spinal sales increased 4% to $221,964,000 in fiscal <strong>2006</strong> compared to $214,039,000 in 2005. Incremental volume and product mixaccounted for this increase. Worldwide sales of spinal hardware, including orthobiologics, increased 6%, while spinal stimulation productsales decreased 3%.Sales of the Company’s other products increased 5% to $172,995,000 in fiscal <strong>2006</strong> from $164,947,000 in 2005. Factors contributing tothis increase included pricing increases (1%) and incremental volume and product mix (5%), offset by negative currency translation (1%).Worldwide sales of arthroscopy products increased 12%, general surgical instrumentation increased 4%, while softgoods and bracingproducts decreased 3%.Sales in the United States increased 7% to $1,325,113,000 during the current fiscal year compared to $1,238,727,000 last year. Components of thisincrease were incremental volume and product mix (6%) and positive pricing environment (1%). European sales increased 7% to $520,660,000during the current fiscal year from $487,991,000 in 2005. Components of this increase were incremental volume and product mix (12%),offset by pricing decreases (mainly in bone cements) (1%) and negative currency translation (4%). The Company anticipates foreign currencytranslations will positively influence sales during fiscal 2007. Sales in Rest of World increased 17% to $179,966,000 this year from $153,232,000last year. Components of this increase were incremental volume and product mix (19%), offset by pricing decreases (1%) and negativecurrency translation (1%). The Company commenced direct sales of its products in Japan during fiscal 2002 and continues to experiencegood product acceptance with growth at approximately 39% for the current fiscal year in local currency.Gross Profit – The Company’s gross profit increased 7% to $1,443,669,000 in fiscal <strong>2006</strong> from $1,346,854,000 in 2005. The gross profitmargin decreased to 71.3% of sales in fiscal <strong>2006</strong> compared to 71.6% in 2005. The components of this change are an increase of 1.3%relating to the impact of inventory step-up from acquisitions on last year’s cost of goods sold, offset by a decrease of 0.3% due to anunanticipated, retroactive price increase from the supplier of <strong>Biomet</strong>’s antibiotic delivery system in Europe, additional expenses of 0.2%related to the Company’s review and reorganization of its EBI operations and discontinuation of the Acumen Surgical Navigation productline, 0.5% from average selling price decreases in Japan, Australia and Korea and 0.6% from higher growth rates in foreign sales, wheregross margins are lower, versus domestic sales.Selling, General and Administrative Expenses – Selling, general and administrative expenses increased 8% in fiscal <strong>2006</strong> to $750,428,000compared to $694,254,000 last year. This increase results from increased commission expense on higher sales (2.8%), the direct to consumeradvertising that commenced during the second quarter of fiscal year <strong>2006</strong> (1.4%), additional expenses in connection with the separationpackage payable to former President and CEO Dane A. Miller, Ph.D. (1.3%), additional expenses related to the Company’s review andreorganization of its EBI operations, discontinuation of the Acumen Surgical Navigation product line and the write off of its investment inZ-KAT, Inc. (0.9%) and an increase in marketing and general and administrative expenses (1.6%). As a percent of sales, selling, generaland administrative expenses were 37.1% in fiscal <strong>2006</strong> compared to 36.9% in fiscal 2005.Research and Development Expense – Research and development expense increased 7% during the current year to $84,914,000 comparedto $79,696,000 in 2005. The increase includes the $2.6 million paid for a cross-licensing and settlement agreement between <strong>Biomet</strong>Biologics, Inc. and Cytomedix, Inc. In addition, the increase reflects the Company’s continued emphasis on new product development andenhancements and additions to its existing product lines and technologies. As a percent of sales, research and development expenses were4.2% in fiscal <strong>2006</strong> and 2005.Operating Income – Operating income increased 11% during fiscal <strong>2006</strong> to $608,327,000 from $546,884,000 in 2005. U.S. operating incomeincreased 2% to $519,536,000 from $507,690,000, reflecting solid sales growth for higher-margin product lines, offset by the additionalexpenses discussed above. European operating income increased 2% to $77,927,000 compared to $76,566,000 in 2005. The growth inEurope operating income was negatively affected by a reduction in gross margins and higher selling expenses for the Company’s dentalproducts, but reflects solid sales growth, higher gross margins (primarily related to the elimination in fiscal <strong>2006</strong> of inventory step-up costs* For purposes of this Management’s Discussion and Analysis, the fiscal period is June 1 – May 31.24
Management’s Discussion & Analysis of Financial Condition& Results of Operations (continued)recognized in fiscal 2005) and lower selling expenses for the rest of the Company’s products. Rest of World operating income decreased16% to $10,864,000 in fiscal <strong>2006</strong> from $12,898,000 in 2005. This decline reflects higher selling expenses due to expanding salesforcesand increased expenses to meet additional regulatory requirements in Japan, including support of new product introductions.Other Income, Net – Other income, net increased during the current year to $2,874,000 from $2,816,000 in 2005. Other income increased 22%to $14,248,000 from $11,677,000, while interest expense increased 28% to $11,374,000 from $8,861,000. As interest rates increased duringfiscal <strong>2006</strong>, investment income, as well as interest expense increased. In addition, during fiscal <strong>2006</strong>, investment income increased as theCompany’s cash and investments increased. To reduce the risk of exchange rate gains and losses on transfer of inventory from domestic sitesto international sites, the Company has lines of credit in both Europe and Japan in local currencies. (See Note G in the Notes to ConsolidatedFinancial Statements). These lines of credit are used solely to fund inventory purchases and acquisitions in those local currencies.Provision for Income Taxes – The provision for income taxes increased to $205,057,000, or 33.5% of income before income taxes for fiscal<strong>2006</strong> compared to $198,084,000 or 36.0% of income before income taxes last year. The effective income tax rate decreased primarily asa result of a $26 million write-off of in-process research and development last year, in connection with the Interpore acquisition not beingtax affected. In addition, the tax rate benefited from the new Qualified Production Activities Deduction in the U.S. and continued expansionof operations in lower tax jurisdictions.Net Income – The factors mentioned above resulted in a 16% increase in net income to $406,144,000 for fiscal <strong>2006</strong> from $351,616,000 in2005. These factors and the reduction in the shares used in the computation of earnings per share through the Company’s share repurchaseprograms resulted in an 18% increase in basic earnings per share for <strong>2006</strong> to $1.64 compared to $1.39 in 2005.Fiscal 2005 Compared to Fiscal 2004Net Sales – Net sales increased 16% during fiscal 2005 to $1,879,950,000 from $1,615,253,000 in 2004. Excluding the positive impact offoreign currency translations (2%), net sales increased 14%. Worldwide sales of reconstructive devices increased 19% to $1,254,234,000 infiscal 2005 compared to $1,052,865,000 in 2004. Factors contributing to this increase included currency translation (3%), pricing increases(2%) and incremental volume and product mix (14%). During fiscal 2005, worldwide bone cement sales increased 30%, knee sales increased25%, dental reconstructive product sales increased 16%, extremity sales increased 13% and hip sales increased 11%.Fixation sales decreased slightly during fiscal 2005 to $246,730,000 from $248,821,000 in 2004. Decreased volume and product mix (2%)offset by positive currency translation (1%) accounted for this decrease. Worldwide sales of craniomaxillofacial products, including bonesubstitutes, increased 7%, electrical stimulation devices decreased 5%, internal fixation devices increased 1% and external fixation devicesdecreased 4%. Fixation sales have been negatively impacted by the combination of the Interpore and EBI salesforces, and at the same timethe integration of <strong>Biomet</strong>’s internal fixation salesforce into EBI’s fixation salesforce.Spinal sales increased 34% to $214,039,000 in fiscal 2005 compared to $159,927,000 in 2004. Factors contributing to this increase includedthe Interpore acquisition (32%), currency translation (1%) and incremental volume and product mix (1%). Worldwide sales of spinalhardware, including orthobiologics, increased 118%, while spinal stimulation products decreased 9%. Spinal sales have been negativelyimpacted by the combination of the Interpore and EBI salesforces, and at the same time the integration of <strong>Biomet</strong>’s internal fixationsalesforce into EBI’s fixation salesforce.Sales of the Company’s other products increased 7% to $164,947,000 in fiscal 2005 from $153,640,000 in 2004. Factors contributing tothis increase included currency translation (1%), pricing increases (1%) and incremental volume and product mix (5%). Worldwide sales ofarthroscopy products increased 12%, softgoods and bracing products decreased 3% and general surgical instrumentation decreased 6%.Sales in the United States increased 15% to $1,238,727,000 during fiscal 2005 compared to $1,079,532,000 in 2004. Components ofthis increase were incremental volume and product mix (13%) and positive pricing environment (2%). European sales increased 17% to$487,991,000 during fiscal 2005 from $418,328,000 in 2004. Components of this increase were positive currency translation (7%) andincremental volume and product mix (10%). Sales in Rest of World increased 31% to $153,232,000 in fiscal 2005 from $117,393,000 in2004. Components of this increase were positive currency translation (4%) and incremental volume and product mix (27%). The Companycommenced direct sales of its products in Japan during fiscal 2002 and continues to experience good product acceptance with growth atapproximately 37% for fiscal 2005 in local currency.Gross Profit – The Company’s gross profit increased 17% to $1,346,854,000 in fiscal 2005 from $1,153,751,000 in 2004. The gross profitmargin increased to 71.6% of sales in fiscal 2005 compared to 71.5% in 2004. This improvement was realized through a 1% increase inselling prices and improved manufacturing efficiencies, offset by $21.8 million of additional expense in fiscal 2005 as compared to fiscal2004 as a result of an inventory step-up charge recognized in connection with the purchase of Merck KGaA’s 50% interest in the <strong>Biomet</strong>Merck joint venture and the Interpore acquisition.Selling, General and Administrative Expenses – Selling, general and administrative expenses increased 17% in fiscal 2005 to $694,254,000compared to $595,234,000 in fiscal 2004. This increase resulted from increased commission expense on higher sales (8%) and an increasein marketing and general and administrative expenses (9%). As a percent of sales, selling, general and administrative expenses were 36.9%in both fiscal 2005 and 2004.25
Management’s Discussion & Analysis of Financial Condition& Results of Operations (continued)Research and Development Expense – Research and development expense increased 25% during fiscal 2005 to $79,696,000 comparedto $63,636,000 in 2004. The increase reflected the Company’s continued emphasis on new product development and enhancements andadditions to its existing product lines and technologies. As a percent of sales, research and development expenses were 4.2% in fiscal 2005compared to 3.9% in fiscal 2004.In-Process Research and Development – In connection with the Interpore acquisition, the Company assigned $26,020,000 to in-processresearch and development, which was written off as of the acquisition date.Operating Income – Operating income increased 11% during fiscal 2005 to $546,884,000 from $493,631,000 in 2004. U.S. operating incomeincreased 14% to $507,690,000 from $443,862,000, reflecting solid sales growth for higher-margin product lines. European operatingincome increased 56% to $76,566,000 compared to $49,228,000 in 2004. Rest of World operating income increased 204% to $12,898,000in fiscal 2005 from $4,241,000 in 2004. The growth in both Europe and Rest of World operating income reflects solid sales growth, highergross margins, lower selling expenses and improved foreign currency translation.Other Income, Net – Other income, net decreased during fiscal 2005 to $2,816,000 from $15,165,000 in 2004. Other income decreased 38%to $11,677,000 from $18,702,000, while interest expense increased 151% to $8,861,000 from $3,537,000. During the fourth quarter of fiscal2004, the Company recorded a $3,362,000 gain on the disposition of an equity investment. Excluding this gain, other income decreased 24%mainly due to the cash used in the acquisitions of Merck KGaA’s 50% interest in the <strong>Biomet</strong> Merck joint venture and Interpore acquisition.Interest expense increased as a result of the $200 million 36-month revolving credit facility entered into and utilized to fund the Interporeacquisition. To reduce the risk of exchange rate gains and losses on transfer of inventory from domestic sites to international sites, theCompany has lines of credit in both Europe and Japan in local currencies. (See Note G in the Notes to Consolidated Financial Statements).These lines of credit are used solely to fund inventory purchases and acquisitions in those local currencies.Provision for Income Taxes – The provision for income taxes increased to $198,084,000, or 36.0% of income before income taxes for fiscal2005 compared to $176,098,000 or 34.6% of income before income taxes last year. The effective income tax rate increased primarily as aresult of a $26 million write-off of in-process research and development in connection with the Interpore acquisition not being tax affected,offset by continued expansion of operations in lower tax jurisdictions.Net Income – The factors mentioned above resulted in an 8% increase in net income to $351,616,000 for fiscal 2005 from $325,627,000 in2004. These factors and the reduction in the shares used in the computation of earnings per share through the Company’s share repurchaseprograms resulted in a 9% increase in basic earnings per share for 2005 to $1.39 compared to $1.27 in 2004. The purchase of Interpore didnot have a significant impact on net income, as the expense associated with the amortization of intangibles and reduced investment incomewere offset by the additional income associated with the sale of Interpore’s products.Liquidity & Capital ResourcesThe Company’s cash and investments increased to $225,471,000 at May 31, <strong>2006</strong>, from $177,074,000 at May 31, 2005. Net cash fromoperating activities was $413,470,000 in fiscal <strong>2006</strong> compared to $410,920,000 in 2005. The principal sources of cash from operatingactivities were net income of $406,144,000 and non-cash charges of depreciation and amortization of $82,177,000. The principal use ofcash includes an increase in accounts receivable and inventory of $31,284,000 and $69,728,000, respectively. Accounts receivable andinventory continue to increase as the Company continues to expand its direct selling operations in countries where it traditionally sold todistributors, and as it experiences sales growth.Cash flows used in investing activities were $99,065,000 in fiscal <strong>2006</strong> compared to $360,682,000 in 2005. The primary uses of cash forinvesting activities in fiscal <strong>2006</strong> were purchases of investments and capital expenditures, offset by sales and maturities of investments.Major capital expenditures for the year were expansion of manufacturing facilities in New Jersey and Florida, and purchases of instrumentsoutside the United States to support new product launches and sales growth. Cash flows used in investing activities included the acquisitionof Interpore in fiscal 2005.Cash flows used in financing activities were $257,594,000 in fiscal <strong>2006</strong> compared to $98,270,000 in 2005. The primary uses of fundsduring the current year were the share repurchase programs, in which $215,430,000 was used to purchase 5,986,000 Common Shares ofthe Company, and a cash dividend of $0.25 per share paid on July 22, 2005, to shareholders of record on July 15, 2005. The source of fundsfrom financing activities was proceeds on the exercise of stock options. On June 28, <strong>2006</strong>, the Company’s Board of Directors announceda cash dividend of $0.30 per share payable on July 21, <strong>2006</strong>, to shareholders of record at the close of business on July 14, <strong>2006</strong>.At May 31, <strong>2006</strong>, the Company has three lines of credit outstanding: 1) a 36-month revolving credit facility in the amount of $200 million;2) a European line of credit in the amount of EUR 100 million ($126 million); and 3) a Japanese line of credit in the amount of YEN 4.5billion ($39.5 million). The total amount available under these lines of credit at May 31, <strong>2006</strong>, is approximately $92 million.The Company maintains its cash and investments in money market funds, certificates of deposit, corporate bonds, debt instruments,mortgage-backed securities and equity securities. The Company’s investments are generally liquid and investment grade. The Company isexposed to interest rate risk on its corporate bonds, debt instruments, fixed rate preferred equity securities and mortgage-backed securities.The Company anticipates that its use of cash for capital expenditures in fiscal 2007 will be reduced slightly from fiscal <strong>2006</strong>. The Company26
Management’s Discussion & Analysis of Financial Condition& Results of Operations (concluded).intends to continue to pursue strategic acquisition candidates. The Company is confident about the growth prospects in its markets andintends to invest in an effort to improve its worldwide market position. The Company expects to spend in excess of $350 million over thenext two fiscal years for capital expenditures and research and development costs in an effort to develop products and technologies thatfurther enhance musculoskeletal procedures. Funding of these and other activities is expected to come from currently available funds andcash flows generated from future operations. The Company has no off-balance sheet financial arrangements and no material long-termcontractual financial obligations.Critical Accounting Policies and EstimatesManagement’s discussion and analysis of its financial position and results of operations are based upon the Company’s consolidated financialstatements, which have been prepared in accordance with accounting principles generally accepted in the United States. The preparationof these financial statements requires management to make estimates and judgments that affect the reported amounts of assets, liabilities,revenues and expenses, and related disclosure of contingent assets and liabilities. The Company’s significant accounting policies arediscussed in Note B of the Notes to Consolidated Financial Statements. In management’s opinion, the Company’s critical accountingpolicies include revenue recognition, excess and obsolete inventory, goodwill and intangible assets, and accrued insurance.Revenue Recognition – For the majority of the Company’s products in a country where the Company has a direct distribution operation,revenue is recognized upon notification to the Company that the product has been implanted in or applied to the patient. For other productsor services, and in countries where the Company does not have a direct distribution operation, the Company recognizes revenue when titlepasses to the customer and there are no remaining obligations that will affect the customer’s final acceptance of the sale. For its insurancebillings in the United States, the Company records anticipated price adjustments, which can occur subsequent to invoicing, based onestimates derived from past experience, as a reduction of net sales in the same period that revenue is recognized. The Company also recordsestimated sales returns and other adjustments as a reduction of net sales in the same period that revenue is recognized. In addition, theCompany maintains an allowance for doubtful accounts for estimated losses resulting from the inability of our customers to make requiredpayments. If the assumptions used in estimating pricing adjustments or the financial condition of our customers were to deteriorate,resulting in an impairment of the Company’s ability to collect its net receivables, additional allowances may be required which would affectour future operating results.Excess and Obsolete Inventory – In our industry, inventory is routinely placed at hospitals to provide the healthcare provider with theappropriate product when needed. Because product usage tends to follow a bell curve, larger and smaller sizes of inventory are provided,but infrequently used. In addition, the musculoskeletal market is highly competitive, with new products, raw materials and procedures beingintroduced continually, which may obsolete products currently on the market. The Company must make estimates regarding the futureuse of these products and provide a provision for excess and obsolete inventory. If actual product life-cycles, product demand or marketconditions are less favorable than those projected by management, additional inventory write-downs may be required which would affectfuture operating results.Goodwill and Other Intangible Assets – In assessing the recoverability of the Company’s intangibles, the Company must make assumptionsregarding estimated future cash flows and other factors to determine the fair value of the respective assets. If these estimates or their relatedassumptions change in the future, the Company may be required to record impairment charges for these assets.Accrued Insurance – As noted in Note M of the Notes to Consolidated Financial Statements, the Company has a self-insured retentionagainst product liability claims with insurance coverage over and above the retention. There are various other claims, lawsuits, disputeswith third parties, investigations and pending actions involving various allegations against the Company. Product liability claims areroutinely reviewed by the Company’s insurance carrier and management routinely reviews all claims for purposes of establishing ultimateloss estimates. In addition, management must determine the estimated liability for claims incurred, but not reported. Such estimates andany subsequent changes in estimates may result in adjustments to the Company’s operating results in the future.Recent Accounting Pronouncements – Information about recent accounting pronouncements and their effect on the Company can be foundin Note B of the Notes to Consolidated Financial Statements.27
Quarterly Results.(in thousands, except earnings per share)1st Qtr. 2nd Qtr. 3rd Qtr. 4th Qtr. Year<strong>2006</strong>Net sales.......................................................................................... $484,903 $494,690 $506,254 $539,892 $2,025,739Gross profit..................................................................................... 350,408 355,079 363,193 374,988 1,443,668Net income...................................................................................... 100,299 101,278 106,065 98,502 406,144Earnings per share:Basic........................................................................................... .40 .41 .43 .40 1.64Diluted........................................................................................ .40 .41 .43 .40 1.632005Net sales.......................................................................................... $438,160 $456,674 $482,023 $503,093 $1,879,950Gross profit..................................................................................... 312,188 325,559 343,955 365,152 1,346,854Net income...................................................................................... 60,433 91,199 96,784 103,200 351,616Earnings per share:Basic........................................................................................... .24 .36 .38 .41 1.39Diluted........................................................................................ .24 .36 .38 .41 1.382004Net sales.......................................................................................... $370,319 $387,561 $410,185 $447,188 $1,615,253Gross profit..................................................................................... 264,701 278,771 294,193 316,086 1,153,751Net income...................................................................................... 76,478 82,692 86,600 79,857 325,627Earnings per share:Basic........................................................................................... .30 .32 .34 .31 1.27Diluted........................................................................................ .30 .32 .34 .31 1.27• Per share data may not cross-foot due to the share repurchase program affecting the weighted share calculation differently by quartercompared to the full fiscal year.• Net income for the fourth quarter of fiscal <strong>2006</strong> was adversely impacted by pre-tax charges of $9 million in connection with the separationpackage payable to former President and CEO Dane A. Miller, Ph.D.; $5.4 million for expenses related to the Company’s review andreorganization of its EBI operations; $4.8 million related to the discontinuation of the Acumen Surgical Navigation product line and theCompany’s investment in Z-KAT, Inc.; and $2.6 million for a cross-licensing and settlement agreement between <strong>Biomet</strong> Biologics, Inc.and Cytomedix, Inc.• Net income for the first quarter of fiscal 2005 was adversely impacted by a $26 million charge as a result of in-process research anddevelopment in connection with the Interpore acquisition.• Net income for the fourth quarter of fiscal 2004 was adversely impacted by a $25 million pre-tax charge as a result of a change in theCompany’s estimate for bad debt allowance on its domestic insurance receivables.28
Item 7A. Quantitative & Qualitative DisclosuresAbout Market Risk.In the normal course of business, operations of the Company are exposed to fluctuations in interest rates and foreign currencies. Thesefluctuations can vary the cost of financing, investment yields and operations of the Company.In connection with the Interpore acquisition, the Company entered into a 36-month revolving credit facility in the amount of $200 million. TheCompany also maintains unsecured lines of credit in countries in which it has significant intercompany transactions in an effort to minimizecurrency rate risks. At May 31, <strong>2006</strong> and 2005, the Company had lines of credit of EUR 100 million ($126 million) and EUR 100 million ($129million), respectively, in Europe and YEN 4.5 billion ($39.5 million) and YEN 4.3 billion ($41 million), respectively, in Japan. Outstandingborrowings under all lines of credit bear interest at a variable rate of the lender’s interbank rate plus an applicable margin and, accordingly,changes in interest rates would impact the Company’s cost of financing.The Company does not have any investments that would be classified as trading securities under generally accepted accounting principles.The Company’s non-trading investments, excluding cash and cash equivalents, consist of certificates of deposit, debt securities, equitysecurities and mortgage-backed securities. The debt securities include municipal bonds, with fixed rates, and preferred stocks, which payquarterly fixed rate dividends. These financial instruments are subject to market risk in that changes in interest rates would impact themarket value of such investments. The Company generally does not utilize derivatives to hedge against increases in interest rates whichdecrease market values, except for one of its investment managers who utilizes U.S. Treasury bond futures options (“futures options”)as a protection against the impact of increases in interest rates on the fair value of preferred stocks managed by that investment manager.The Company marks any outstanding futures options to market and market value changes are recognized in current earnings. The futuresoptions generally have terms ranging from 90 to 180 days. Net realized gains (losses) on sales of futures options aggregated ($136,000)and ($360,000) for the years ended May 31, <strong>2006</strong> and 2005, respectively, and unrealized gains (losses) on outstanding futures options atMay 31, <strong>2006</strong> and 2005, aggregated ($19,000) and ($5,000), respectively.Based on the Company’s overall interest rate exposure at May 31, <strong>2006</strong>, including variable rate debt and fixed rate preferred stocks, ahypothetical 10 percent change in interest rates applied to the fair value of the financial instruments as of May 31, <strong>2006</strong>, would not have amaterial impact on earnings, cash flows or fair values of interest rate risk sensitive instruments over a one-year period.The Company’s foreign currency risk exposure results from fluctuating currency exchange rates, primarily the U.S. dollar against theEuropean currencies. The Company faces transactional currency exposures that arise when its foreign subsidiaries (or the Company itself)enter into transactions, generally on an intercompany basis, denominated in currencies other than their local currency. The Company alsofaces currency exposure that arises from translating the results of its global operations to the U.S. dollar at exchange rates that have fluctuatedfrom the beginning of the period. The Company has not used financial derivatives to hedge against fluctuations in currency exchange rates.Based on the Company’s overall exposure for foreign currency at May 31, <strong>2006</strong>, a hypothetical 10 percent change in foreign currency rateswould not have a material impact on the Company’s balance sheet, net sales, net income or cash flows over a one-year period.29
Item 8. Financial Statements and Supplementary Data.<strong>Biomet</strong>, Inc. and Subsidiaries Index to consolidated FinancialStatements and Schedule.1. Financial Statements:Management’s <strong>Report</strong> on Internal Control over Financial <strong>Report</strong>ing...................................................................30<strong>Report</strong> of Independent Registered Public Accounting Firm on Internal Control over Financial <strong>Report</strong>ing........31<strong>Report</strong> of Independent Registered Public Accounting Firm..................................................................................................... 32Consolidated Balance Sheets as of May 31, <strong>2006</strong> and 2005.................................................................................................... 33Consolidated Statements of Income for the years ended May 31, <strong>2006</strong>, 2005 and 2004........................................................ 34Consolidated Statements of Shareholders’ Equity for the years ended May 31, <strong>2006</strong>, 2005 and 2004................................... 35Consolidated Statements of Cash Flows for the years ended May 31, <strong>2006</strong>, 2005 and 2004.................................................. 36Notes to Consolidated Financial Statements............................................................................................................................ 372. Financial Statement Schedule:Schedule II - Valuation and Qualifying Accounts for the years ended May 31, <strong>2006</strong>, 2005 and 2004.................................... 50Schedules other than that listed above are omitted because they are not applicable or the required information is shownin the financial statements or notes thereto.Management’s <strong>Report</strong> on Internal Control over Financial <strong>Report</strong>ing.The management of <strong>Biomet</strong>, Inc. is responsible for establishing and maintaining adequate internal control over financial reporting for theCompany (including its consolidated subsidiaries) and all related information appearing in the Company’s annual report on Form 10-K.The Company’s internal control over financial reporting is designed to provide reasonable assurance regarding the reliability of financialreporting and the preparation of financial statements for external purposes in accordance with accounting principles generally accepted inthe United States of America.Because of its inherent limitations, internal control over financial reporting may not prevent or detect misstatements. Also, projectionsof any evaluation of effectiveness to future periods are subject to the risk that controls may become inadequate because of changes inconditions, or that the degree of compliance with the policies or procedures may deteriorate.Under the supervision and with the participation of the Interim Chief Executive Officer and Chief Financial Officer, management conducted anevaluation of the effectiveness of its internal control over financial reporting as of May 31, <strong>2006</strong>. The framework on which such evaluationwas based is contained in the report entitled “Internal Control – Integrated Framework” issued by the Committee of Sponsoring Organizationsof the Treadway Commission (the “COSO” <strong>Report</strong>). Based on that evaluation and the criteria set forth in the COSO <strong>Report</strong>, managementconcluded that its internal control over financial reporting was effective as of May 31, <strong>2006</strong>.Management’s assessment of the effectiveness of the Company’s internal control over financial reporting as of May 31, <strong>2006</strong> has beenaudited by Ernst & Young LLP, an independent registered public accounting firm, as stated in their report, which appears on page 31.30
<strong>Report</strong> of Independent Registered Public Accounting FirmOn Internal Control over Financial <strong>Report</strong>ing.To the Board of Directors and Shareholders of <strong>Biomet</strong>, Inc.We have audited management’s assessment, included in the accompanying Management’s <strong>Report</strong> on Internal Control over Financial <strong>Report</strong>ing,that <strong>Biomet</strong>, Inc. maintained effective internal control over financial reporting as of May 31, <strong>2006</strong>, based on criteria established in InternalControl – Integrated Framework issued by the Committee of Sponsoring Organizations of the Treadway Commission (the COSO criteria).<strong>Biomet</strong>, Inc.’s management is responsible for maintaining effective internal control over financial reporting and for its assessment of theeffectiveness of internal control over financial reporting. Our responsibility is to express an opinion on management’s assessment and anopinion on the effectiveness of the company’s internal control over financial reporting based on our audit.We conducted our audit in accordance with the standards of the Public Company Accounting Oversight Board (United States). Thosestandards require that we plan and perform the audit to obtain reasonable assurance about whether effective internal control over financialreporting was maintained in all material respects. Our audit included obtaining an understanding of internal control over financial reporting,evaluating management’s assessment, testing and evaluating the design and operating effectiveness of internal control, and performing suchother procedures as we considered necessary in the circumstances. We believe that our audit provides a reasonable basis for our opinion.A company’s internal control over financial reporting is a process designed to provide reasonable assurance regarding the reliability of financialreporting and the preparation of financial statements for external purposes in accordance with generally accepted accounting principles. Acompany’s internal control over financial reporting includes those policies and procedures that (1) pertain to the maintenance of recordsthat, in reasonable detail, accurately and fairly reflect the transactions and dispositions of the assets of the company; (2) provide reasonableassurance that transactions are recorded as necessary to permit preparation of financial statements in accordance with generally acceptedaccounting principles, and that receipts and expenditures of the company are being made only in accordance with authorizations ofmanagement and directors of the company; and (3) provide reasonable assurance regarding prevention or timely detection of unauthorizedacquisition, use, or disposition of the company’s assets that could have a material effect on the financial statements.Because of its inherent limitations, internal control over financial reporting may not prevent or detect misstatements. Also, projections of anyevaluation of effectiveness to future periods are subject to the risk that controls may become inadequate because of changes in conditions, orthat the degree of compliance with the policies or procedures may deteriorate.In our opinion, management’s assessment that <strong>Biomet</strong>, Inc. maintained effective internal control over financial reporting as of May 31, <strong>2006</strong>,is fairly stated, in all material respects, based on the COSO criteria. Also, in our opinion, <strong>Biomet</strong>, Inc. maintained, in all material respects,effective internal control over financial reporting as of May 31, <strong>2006</strong>, based on the COSO criteria.We also have audited, in accordance with the standards of the Public Company Accounting Oversight Board (United States), the consolidatedbalance sheets of <strong>Biomet</strong>, Inc. as of May 31, <strong>2006</strong> and 2005, and the related consolidated statements of income, shareholders’ equity,and cash flows for each of the three years in the period ended May 31, <strong>2006</strong> and our report dated July 28, <strong>2006</strong> expressed an unqualifiedopinion thereon.Fort Wayne, IndianaJuly 28, <strong>2006</strong>/s/ Ernst & Young LLP31
<strong>Report</strong> of Independent Registered Public Accounting Firm.To the Board of Directors and Shareholders of <strong>Biomet</strong>, Inc.:We have audited the accompanying consolidated balance sheets of <strong>Biomet</strong>, Inc. and subsidiaries as of May 31, <strong>2006</strong> and 2005, and the relatedconsolidated statements of income, shareholders’ equity, and cash flows for each of the three years in the period ended May 31, <strong>2006</strong>.Our audits also included the financial statement schedule listed in the index at Item 15(a). These financial statements and schedule are theresponsibility of the Company’s management. Our responsibility is to express an opinion on these financial statements and schedule basedon our audits.We conducted our audits in accordance with the standards of the Public Company Accounting Oversight Board (United States). Thosestandards require that we plan and perform the audit to obtain reasonable assurance about whether the financial statements are free ofmaterial misstatement. An audit includes examining, on a test basis, evidence supporting the amounts and disclosures in the financialstatements. An audit also includes assessing the accounting principles used and significant estimates made by management, as well asevaluating the overall financial statement presentation. We believe that our audits provide a reasonable basis for our opinion.In our opinion, the financial statements referred to above present fairly, in all material respects, the consolidated financial position of<strong>Biomet</strong>, Inc. and subsidiaries at May 31, <strong>2006</strong> and 2005, and the consolidated results of its operations and its cash flows for each of thethree years in the period ended May 31, <strong>2006</strong> in conformity with U.S. generally accepted accounting principles. Also, in our opinion, therelated financial statement schedule, when considered in relation to the basic financial statements taken as a whole, presents fairly in allmaterial respects the information set forth therein.We have also audited in accordance with standards of the Public Company Accounting Oversight Board (United States), the effectivenessof <strong>Biomet</strong> Inc.’s internal control over financial reporting as of May 31, <strong>2006</strong>, based on criteria established in Internal Control – IntegratedFramework issued by the Committee of Sponsoring Organizations of the Treadway Commission and our report dated July 28, <strong>2006</strong> expressedan unqualified opinion thereon.Fort Wayne, IndianaJuly 28, <strong>2006</strong>/s/ Ernst & Young LLP32
<strong>Biomet</strong>, Inc. & Subsidiaries Consolidated Balance Sheets.At May 31,(in thousands, except par value)AssetsCurrent assets:<strong>2006</strong> 2005Cash and cash equivalents.......................................................................................................................... $ 160,963 $ 104,706Investments................................................................................................................................................. 6,380 10,962Accounts and notes receivable, less allowance for doubtful receivables(<strong>2006</strong> – $69,134 and 2005 – $59,513).................................................................................................... 507,883 479,745Inventories ................................................................................................................................................. 534,515 469,791Deferred income taxes................................................................................................................................ 73,345 72,732Prepaid expenses and other........................................................................................................................ 32,342 35,980Total current assets................................................................................................................................. 1,315,428 1,173,916Property, plant and equipment:Land and improvements............................................................................................................................. 24,944 24,297Buildings and improvements...................................................................................................................... 154,101 145,928Machinery and equipment.......................................................................................................................... 476,387 404,173655,432 574,398Less, Accumulated depreciation................................................................................................................. 297,800 251,511Property, plant and equipment, net......................................................................................................... 357,632 322,887Investments..................................................................................................................................................... 58,128 61,406Goodwill......................................................................................................................................................... 441,397 435,621Other intangible assets.................................................................................................................................... 79,498 87,835Other assets..................................................................................................................................................... 11,839 14,912Total assets.............................................................................................................................................. $2,263,922 $2,096,577Liabilities & Shareholders’ EquityCurrent liabilities:Short-term borrowings................................................................................................................................ $ 276,561 $ 282,193Accounts payable........................................................................................................................................ 62,276 57,021Accrued income taxes................................................................................................................................. 6,356 9,725Accrued wages and commissions............................................................................................................... 63,279 62,171Other accrued expenses.............................................................................................................................. 111,960 90,281Total current liabilities............................................................................................................................ 520,432 501,391Deferred income taxes.................................................................................................................................... 26,991 31,255Total liabilities........................................................................................................................................ 547,423 532,646Commitments and contingencies (Note M)Shareholders’ equity:Preferred shares, $100 par value: Authorized 5 shares; none issued......................................................... – –Common shares, without par value: Authorized 500,000 shares;issued and outstanding <strong>2006</strong> – 244,976 shares and 2005 – 249,879 shares .......................................... 206,633 188,162Additional paid-in capital........................................................................................................................... 72,839 67,613Retained earnings....................................................................................................................................... 1,419,297 1,284,905Accumulated other comprehensive income................................................................................................ 17,730 23,251Total shareholders’ equity....................................................................................................................... 1,716,499 1,563,931Total liabilities and shareholders’ equity................................................................................................ $2,263,922 $2,096,577The accompanying notes are a part of the consolidated financial statements.33
<strong>Biomet</strong>, Inc. & Subsidiaries Consolidated Statements of Income.For the years ended May 31,(in thousands, except per share amounts)<strong>2006</strong> 2005 2004Net sales..................................................................................................................................... $2,025,739 $1,879,950 $1,615,253Cost of sales............................................................................................................................... 582,070 533,096 461,502Gross profit............................................................................................................................. 1,443,669 1,346,854 1,153,751Selling, general and administrative expenses............................................................................ 750,428 694,254 595,234Research and development expense ......................................................................................... 84,914 79,696 63,636In-process research and development........................................................................................ – 26,020 1,250Operating income................................................................................................................... 608,327 546,884 493,631Other income, net ..................................................................................................................... 14,248 11,677 18,702Interest expense ........................................................................................................................ (11,374) (8,861) (3,537)Income before income taxes and minority interest................................................................ 611,201 549,700 508,796Provision for income taxes ....................................................................................................... 205,057 198,084 176,098Income before minority interest............................................................................................. 406,144 351,616 332,698Minority interest........................................................................................................................ – – 7,071Net income............................................................................................................................. $ 406,144 $ 351,616 $ 325,627Earnings per share:Basic....................................................................................................................................... $1.64 $1.39 $1.27Diluted.................................................................................................................................... 1.63 1.38 1.27Shares used in the computation of earnings per share:Basic....................................................................................................................................... 247,576 252,387 255,512Diluted.................................................................................................................................... 248,430 254,148 257,204The accompanying notes are a part of the consolidated financial statements.34
<strong>Biomet</strong>, Inc. & Subsidiaries Consolidated Statementsof Shareholders’ Equity.AccumulatedAdditional Other TotalCommon Shares Paid-In Retained Comprehensive Shareholders’(in thousands, except per share amounts) Number Amount Capital Earnings Income (Loss) EquityBalance at June 1, 2003............................................. 257,489 $141,931 $54,081 $1,100,462 $(10,340) $1,286,134Net income............................................................. – – – 325,627 – 325,627<strong>Change</strong> in unrealized holding value on investments,net of $71 tax effect........................................... – – – – 133 133Reclassification adjustment for losses includedin net income, net of $158 tax effect.................. – – – – (294) (294)Currency translation adjustments.......................... – – – – 12,384 12,384Comprehensive income...................................... – – – – – 337,850Exercise of stock options....................................... 1,921 28,208 – – – 28,208Tax benefit from exercise of stock options............ – – 5,953 – – 5,953Purchase of shares................................................. (5,148) (2,838) (1,083) (168,803) – (172,724)Cash dividends ($.15 per common share)............. – – – (38,604) – (38,604)Other...................................................................... – – 1,393 – – 1,393Balance at May 31, 2004........................................... 254,262 167,301 60,344 1,218,682 1,883 1,448,210Net income............................................................. – – – 351,616 – 351,616<strong>Change</strong> in unrealized holding value on investments,net of $76 tax effect........................................... – – – – 142 142Reclassification adjustment for losses includedin net income, net of $76 tax effect.................... – – – – 141 141Currency translation adjustments.......................... – – – – 21,085 21,085Comprehensive income...................................... – – – – – 372,984Exercise of stock options....................................... 1,360 24,640 – – – 24,640Tax benefit from exercise of stock options............ – – 6,779 – – 6,779Purchase of shares................................................. (5,743) (3,779) (1,362) (234,522) – (239,663)Cash dividends ($.20 per common share)............. – – – (50,871) – (50,871)Other...................................................................... – – 1,852 – – 1,852Balance at May 31, 2005........................................... 249,879 188,162 67,613 1,284,905 23,251 1,563,931Net income............................................................. – – – 406,144 – 406,144<strong>Change</strong> in unrealized holding value on investments,net of $591 tax effect......................................... – – – – 1,098 1,098Reclassification adjustment for losses includedin net income, net of $366 tax effect.................. – – – – (678) (678)Currency translation adjustments.......................... – – – – (5,941) (5,941)Comprehensive income...................................... – – – – – 400,623Exercise of stock options....................................... 1,083 23,002 – – – 23,002Tax benefit from exercise of stock options............ – – 5,224 – – 5,224Purchase of shares................................................. (5,986) (4,531) (1,620) (209,279) – (215,430)Cash dividends ($.25 per common share)............. – – – (62,473) – (62,473)Other...................................................................... – – 1,622 – – 1,622Balance at May 31, <strong>2006</strong>........................................... 244,976 $206,633 $72,839 $1,419,297 $ 17,730 $1,716,499The accompanying notes are a part of the consolidated financial statements.35
<strong>Biomet</strong>, Inc. & Subsidiaries Consolidated Statements of Cash Flows.For the years ended May 31,(in thousands)<strong>2006</strong> 2005 2004Cash flows from (used in) operating activities:Net income............................................................................................................................. $406,144 $351,616 $325,627Adjustments to reconcile net income to net cash from operating activities:Depreciation....................................................................................................................... 71,976 61,781 52,461Amortization...................................................................................................................... 10,201 7,821 5,757Write-off of in-process research and development............................................................ – 26,020 1,250Minority interest................................................................................................................. – – 7,071Other .................................................................................................................................. 1,130 (19) (214)Deferred income taxes....................................................................................................... (5,102) 3,250 (13,686)Tax benefit from exercise of stock options........................................................................ 5,224 6,779 5,953<strong>Change</strong>s in current assets and liabilities, excluding effects of acquisitions and dispositions:Accounts and notes receivable........................................................................................ (31,284) 16,265 (29,955)Inventories....................................................................................................................... (69,728) (42,188) 2,888Accounts payable............................................................................................................ 4,030 (5,927) 10,949Other................................................................................................................................ 20,879 (14,478) 17,988Net cash from operating activities............................................................................... 413,470 410,920 386,089Cash flows from (used in) investing activities:Proceeds from sales and maturities of investments........................................................... 77,400 62,344 236,360Purchases of investments................................................................................................... (68,621) (57,890) (119,819)Capital expenditures........................................................................................................... (108,912) (97,372) (61,342)Acquisitions, net of cash acquired..................................................................................... – (266,229) (307,475)Other.................................................................................................................................. 1,068 (1,535) (1,205)Net cash used in investing activities............................................................................ (99,065) (360,682) (253,481)Cash flows from (used in) financing activities:Increase (decrease) in short-term borrowings.................................................................... (2,693) 167,624 (11,487)Issuance of shares.............................................................................................................. 23,002 24,640 28,208Cash dividends................................................................................................................... (62,473) (50,871) (38,604)Purchase of common shares............................................................................................... (215,430) (239,663) (172,724)Net cash used in financing activities............................................................................ (257,594) (98,270) (194,607)Effect of exchange rate changes on cash................................................................................... (554) (6,505) (4,408)Increase (decrease) in cash and cash equivalents........................................................ 56,257 (54,537) (66,407)Cash and cash equivalents, beginning of year........................................................................... 104,706 159,243 225,650Cash and cash equivalents, end of year..................................................................................... $160,963 $104,706 $159,243Supplemental disclosures of cash flow information:Cash paid during the year for:Interest................................................................................................................................ $ 11,342 $ 8,666 $ 3,657Income taxes...................................................................................................................... 216,431 196,295 176,374The accompanying notes are a part of the consolidated financial statements.36
<strong>Biomet</strong>, Inc. & Subsidiaries Notes To ConsolidatedFinancial Statements.Note A: Nature of Operations.<strong>Biomet</strong>, Inc. and its subsidiaries design, manufacture and market products used primarily by musculoskeletal medical specialists in bothsurgical and nonsurgical therapy, including reconstructive products, fixation devices, spinal products and other products. Headquarteredin Warsaw, Indiana, the Company and its subsidiaries currently distribute products in more than 100 countries. The Company operates inone business segment, but has three reportable geographic segments.Note B: Accounting Policies.The following is a summary of the accounting policies adopted by <strong>Biomet</strong>, Inc. that have a significant effect on the consolidated financialstatements.Basis of Presentation – The consolidated financial statements include the accounts of <strong>Biomet</strong>, Inc. and its subsidiaries (individually andcollectively, the “Company”). All foreign subsidiaries are consolidated on the basis of an April 30 fiscal year. All significant intercompanyaccounts and transactions are eliminated. Investments in affiliates in which the Company does not have the ability to significantly influencethe operations are accounted for on the cost method, the carrying amount of which approximates market. Investments in affiliates in which theCompany does have the ability to significantly influence the operations, but does not control, are accounted for using the equity method.Use of Estimates – The consolidated financial statements are prepared in conformity with U.S. generally accepted accounting principlesand, accordingly, include amounts that are based on management’s best estimates and judgments.Translation of Foreign Currency – Assets and liabilities of foreign subsidiaries are translated at rates of exchange in effect at the close oftheir fiscal year. Revenues and expenses are translated at the weighted average exchange rates during the year. Translation gains and lossesare accumulated within other comprehensive income (loss) as a separate component of shareholders’ equity. Foreign currency transactiongains and losses resulting from product transfer between subsidiaries is recorded in cost of goods sold. Other foreign currency exchangegains and losses, which are not material, are included in other income, net.Cash and Cash Equivalents – The Company considers all highly liquid investments with original maturities of three months or less to becash equivalents.Investments – Highly liquid investments with original maturities of three months or less are classified as cash and cash equivalents. Certificatesof deposit with maturities greater than three months and less than one year are classified as short-term investments. Certificates of depositwith maturities greater than one year are classified as long-term investments. The Company accounts for its investments in debt and equitysecurities under Statement of Financial Accounting Standards (“SFAS”) No. 115, “Accounting for Certain Investments in Debt and EquitySecurities,” which requires certain securities to be categorized as either trading, available-for-sale or held-to-maturity. Available-for-salesecurities are carried at fair value with unrealized gains and losses recorded within other comprehensive income (loss) as a separate componentof shareholders’ equity. Held-to-maturity securities are carried at amortized cost. The Company has no trading securities. The cost ofinvestment securities sold is determined by the specific identification method. Dividend and interest income are accrued as earned. TheCompany reviews its investments quarterly for declines in market value that are other than temporary. Investments that have declined in marketvalue that are determined to be other than temporary, are charged to other income by writing that investment down to market value.Concentrations of Credit Risk and Allowance for Doubtful Receivables – The Company provides credit, in the normal course of business,to hospitals, private and governmental institutions and healthcare agencies, insurance providers and physicians. The Company maintainsan allowance for doubtful receivables and charges actual losses to the allowance when incurred. The Company invests the majority ofits excess cash in certificates of deposit with financial institutions, money market securities, municipal, corporate and mortgage-backedsecurities and common stocks. The Company does not believe it is exposed to any significant credit risk on its cash and cash equivalentsor investments.Inventories – Inventories are stated at the lower of cost or market, with cost determined under the first-in, first-out method.Property, Plant and Equipment – Property, plant and equipment are carried at cost less accumulated depreciation. Depreciation is computedby the straight-line method over the estimated useful lives of 5 to 30 years for buildings and improvements and 3 to 10 years for machineryand equipment. Gains or losses on the disposition of property, plant and equipment are included in income. Maintenance and repairs areexpensed as incurred. In accordance with Statement of Financial Accounting Standards (“SFAS”) No. 144, “Accounting for the Impairmentor Disposal of Long-Lived Assets,” the Company reviews property, plant and equipment for impairment whenever events or changes incircumstances indicate that the carrying value of an asset may not be recoverable. An impairment loss would be recognized when estimatedfuture cash flows relating to the asset are less than its carrying amount.Goodwill – The Company accounts for goodwill in accordance with SFAS No. 142, “Goodwill and Other Intangible Assets.” SFAS No.142, among other things, requires that goodwill not be amortized but should be tested for impairment at least annually. In addition, theCompany reviews goodwill for possible impairment by comparing the fair value of each reporting unit to its carrying amount annually.Based on the Company’s reviews, no impairment charges have been recorded.37
<strong>Biomet</strong>, Inc. & Subsidiaries Notes To ConsolidatedFinancial Statements (continued)Note B: Accounting Policies, Continued.Other Intangible Assets – Intangible assets consist primarily of developed technology and patents, trademarks and trade names, customerrelationships and covenants not to compete and are carried at cost less accumulated amortization. Intangible assets with an indefinite life,including certain trademarks and trade names, are not amortized. The useful life of indefinite life intangible assets is assessed annually todetermine whether events and circumstances continue to support an indefinite life. Amortization of intangibles with a finite life is computedbased on the straight-line method over periods ranging from 3 to 15 years. In addition, the Company reviews other intangible assets (indefinitelife) for possible impairment annually or whenever events or circumstances indicate that the carrying amount may not be recoverable.Income Taxes – Deferred income taxes are determined using the liability method. No provision has been made for U.S. and state incometaxes or foreign withholding taxes on the undistributed earnings (approximately $306 million at May 31, <strong>2006</strong>) of foreign subsidiariesbecause it is expected that such earnings will be reinvested overseas indefinitely. Upon distribution of those earnings in the form of dividendsor otherwise, the Company would be subject to U.S. income taxes (subject to an adjustment for foreign tax credits), state income taxes andwithholding taxes payable to the various foreign countries. Determination of the amount of any unrecognized deferred income tax liabilityon these undistributed earnings is not practical.Fair Value of Financial Instruments – The carrying amounts of cash and cash equivalents, receivables, short-term borrowings, accounts payableand accruals that meet the definition of a financial instrument approximate fair value. The fair value of investments is disclosed in Note D.Revenue Recognition – For the majority of the Company’s products in a country where the Company has a direct distribution operation,revenue is recognized upon notification to the Company that the product has been implanted in or applied to the patient. For other productsor services, and in countries where the Company does not have a direct distribution operation, the Company recognizes revenue when titlepasses to the customer and there are no remaining obligations that will affect the customer’s final acceptance of the sale. For its insurancebillings in the United States, the Company records anticipated price adjustments, which can occur subsequent to invoicing, based on estimatesderived from past experience, as a reduction of net sales in the same period that revenue is recognized. The Company also records estimatedsales returns and other adjustments as a reduction of net sales in the same period that revenue is recognized. Shipping and handling feesbilled to customers are recorded as revenue, while related costs are included in cost of goods sold.Comprehensive Income – Other comprehensive income refers to revenues, expenses, gains and losses that under generally acceptedaccounting principles are included in comprehensive income but are excluded from net income as these amounts are recorded directly asan adjustment to shareholders’ equity. The Company’s other comprehensive income is comprised of unrealized gains (losses) on availablefor-salesecurities, net of tax, and foreign currency translation adjustments.The components of accumulated other comprehensive income (loss) at May 31, <strong>2006</strong> and 2005 are as follows:(in thousands)<strong>2006</strong> 2005Net unrealized holding loss on investments................................................................................................... $ (2,049) $ (2,469)Cumulative translation adjustment................................................................................................................. 19,779 25,720$17,730 $23,251Stock-Based Compensation – As permitted by SFAS No. 123, the Company accounts for its employee stock options using the intrinsic valuemethod. Accordingly, no compensation expense is recognized for the employee stock-based compensation plans. If compensation expensefor the Company’s employee stock options had been determined based on the fair value method of accounting in fiscal years <strong>2006</strong>, 2005 and2004, pro forma net income and earnings per share would have been as follows:<strong>2006</strong> 2005 2004Net income as reported (in thousands)...................................................................................... $406,144 $351,616 $325,627Deduct: Total stock-based employee compensation expense determined under fairvalue based method for all awards net of related tax effects (in thousands)......................... (10,196) (7,339) (5,823)Pro forma net income (in thousands)......................................................................................... $395,948 $344,277 $319,804Earnings per share:Basic, as reported................................................................................................................... $1.64 $1.39 $1.27Basic, pro forma.................................................................................................................... 1.60 1.36 1.25Diluted, as reported............................................................................................................... 1.63 1.38 1.27Diluted, pro forma................................................................................................................. 1.59 1.35 1.24Under SFAS No. 123, the fair value of each option is estimated on the date of grant using the Black-Scholes option-pricing model with thefollowing weighted average assumptions used for grants in <strong>2006</strong>, 2005 and 2004: (1) expected life of option of 5.27, 5.22 and 5.25 years;(2) dividend yield of .72%, .43% and .51%; (3) expected volatility of 32%, 33% and 34%; and (4) risk-free interest rate of 5.21%, 3.90%and 3.91%, respectively.38
<strong>Biomet</strong>, Inc. & Subsidiaries Notes To ConsolidatedFinancial Statements (continued)Note B: Accounting Policies, Concluded.In December 2004, the Financial Accounting Standards Board (FASB) issued SFAS No. 123(R), “Share-Based Payment.” This statementis a revision to SFAS No. 123, “Accounting for Stock-Based Compensation,” and supersedes Accounting Principles Board Opinion (APB)No. 25, “Accounting for Stock Issued to Employees.” SFAS No. 123(R) requires the recognition of the cost of employee services receivedin exchange for an award of equity instruments based on the grant date fair value of the award. The cost will be recognized over theperiod during which an employee is required to provide service in exchange for the award. No compensation cost is recognized for equityinstruments for which employees are not expected to render the required service period and thus are forfeited. In April 2005, SEC releaseNo. 33-8568 delayed the implementation of SFAS No. 123(R). The Company will adopt SFAS 123(R) on June 1, <strong>2006</strong> using the modifiedprospectivemethod and will not restate prior periods. SFAS 123(R) will apply to new options, as well as outstanding options as of June 1,<strong>2006</strong>. Compensation expense for outstanding options which are not vested as of June 1, <strong>2006</strong> will be recognized over the remaining vestingperiod using compensation cost as previously calculated for pro forma disclosure and reporting purposes. The Company estimates theadoption of FASB 123(R) will reduce diluted earnings per share by $0.05-$0.06 during fiscal year 2007.In November 2004, the FASB issued SFAS No. 151, “Inventory Costs” to clarify the accounting for abnormal amounts of idle facility expense.SFAS No. 151 requires that fixed overhead production costs be applied to inventory at “normal capacity” and any excess fixed overheadproduction costs be charged to expense in the period in which they were incurred. SFAS No. 151 is effective for fiscal years beginningafter June 15, 2005. The Company does not expect SFAS No. 151 to have a material impact on its financial position, results of operations,or cash flows when adopted in fiscal 2007.In July <strong>2006</strong>, the FASB issued FIN 48, “Accounting for Uncertainty in Income Taxes”, an interpretation of FASB Statement No. 109,“Accounting for Income Taxes”. This statement creates a single model to address uncertainty in tax positions which utilizes a two-stepapproach for evaluating such tax positions. Recognition (step one) occurs when an enterprise concludes that a tax position, based solelyon its technical merits, is more likely than not to be sustained upon examination. Measurement (step two) is only addressed if step one hasbeen satisfied. In addition, expanded disclosures are required. FIN 48 is effective for fiscal years beginning after December 15, <strong>2006</strong>. TheCompany is currently evaluating the impact of adopting FIN 48. At this time, the Company does not expect the adoption of FIN 48 to havea material impact on its financial statements.39
<strong>Biomet</strong>, Inc. & Subsidiaries Notes To ConsolidatedFinancial Statements (continued)Note C: Business Combinations.On June 18, 2004, the Company acquired Interpore International Inc. (“Interpore”) for $266 million in cash. Based in Irvine, California,Interpore is focused on providing innovative products for spinal surgery. The primary reason for making the Interpore acquisitionwas to broaden the product portfolio the Company offers in the spinal market. Interpore’s three major product groups include spinalimplants, orthobiologic products and minimally-invasive surgery products used by orthopedic surgeons and neurosurgeons in a wide rangeof applications. The purchase price of this acquisition exceeded the fair value of identifiable tangible and intangible assets. This reflectsthe strategic compatibility of the products and technologies of Interpore and EBI, which is expected to provide increased earnings powerand an improved platform from which the combined entity can actively pursue growth opportunities in these product categories, bothdomestically and internationally. The Company accounted for this acquisition under the purchase method of accounting pursuant to SFASNo. 141, “Business Combinations.” Accordingly, Interpore’s results of operations have been included in the Company’s consolidatedstatements of income since the closing date, and its respective assets and liabilities were recorded at their estimated fair values in theCompany’s consolidated balance sheets as of the closing date, with the excess purchase price being allocated to goodwill. Interpore’s netsales in 2003 were approximately $67.5 million.The following table summarizes the assets acquired and liabilities assumed in the acquisition:(in thousands)As ofJune 18, 2004Current assets.............................................................................................................................................................. $ 40,100Property, plant and equipment.................................................................................................................................... 9,307Intangible assets not subject to amortization:Trademarks and trade names.................................................................................................................................. 1,260Intangible assets subject to amortization:Developed technology............................................................................................................................................ 16,180License agreements................................................................................................................................................ 3,450Trademarks and trade names.................................................................................................................................. 2,270Customer relationships........................................................................................................................................... 11,440In-process research and development......................................................................................................................... 26,020Deferred taxes............................................................................................................................................................. 15,945Other assets................................................................................................................................................................. 82Goodwill..................................................................................................................................................................... 169,596Total assets acquired........................................................................................................................................... $295,650Deferred taxes............................................................................................................................................................. 14,512Other........................................................................................................................................................................... 14,909Total liabilities assumed...................................................................................................................................... 29,421Net assets acquired..................................................................................................................................................... $266,229The $26,020,000 assigned to in-process research and development was written off as of the acquisition date. With respect to the valuation of theInterpore in-process research and development expense, there were four projects valued. Net cash flows were forecasted to commence between2005 and <strong>2006</strong>, discount rates of 20% to 30% were used, and assumed additional research and development expenditures prior to the date ofinitial product introduction totaled approximately $2 million and approximately $1 million in 2005 and <strong>2006</strong>, respectively. The major project, atotal lumbar disc replacement, represented $18 million of the valuation. The total estimated additional expenditures have not changed to date, butthe time table for getting the total lumbar disc replacement to market has been extended to 2012 or 2013 due to regulatory requirements.The weighted average amortization period for amortizable intangibles is 8 years. No amount of goodwill is expected to be deductible fortax purposes.40
<strong>Biomet</strong>, Inc. & Subsidiaries Notes To ConsolidatedFinancial Statements (continued)Note C: Business Combinations, Concluded.On March 19, 2004, the Company acquired Merck KGaA’s 50% interest in the <strong>Biomet</strong> Merck joint venture for $300 million in cash. TheCompany accounted for this acquisition under the purchase method of accounting pursuant to SFAS No. 141, “Business Combinations.”The acquisition is the culmination of the joint venture to develop, manufacture and distribute orthopedic products in Europe under which<strong>Biomet</strong> and Merck KGaA have been operating since 1998. Since the Company has had operating control of the joint venture since itsformation, the operations of the joint venture have been consolidated since its formation and minority interest deducted on the incomestatement and shown on the balance sheet to account for Merck KGaA’s 50% limited partnership interest. From the date of acquisition, theminority interest has been eliminated and 50% of the respective assets and liabilities have been stepped up to their estimated fair values inthe Company’s consolidated financial statements, with the excess purchase price being allocated to goodwill.The following table summarizes the step-up of the assets acquired and liabilities assumed in the acquisition:(in thousands)As ofMarch 19, 2004Inventories.................................................................................................................................................................. $ 19,600Intangible assets not subject to amortization:Trademarks and trade names.................................................................................................................................. 27,500Intangible assets subject to amortization:Covenant not to compete........................................................................................................................................ 3,100Developed technology............................................................................................................................................ 12,500Trademarks and trade names.................................................................................................................................. 1,100Customer relationships........................................................................................................................................... 1,650In-process research and development......................................................................................................................... 1,250Other assets................................................................................................................................................................. 3,362Goodwill..................................................................................................................................................................... 125,497Total asset step-up............................................................................................................................................... $195,559Deferred taxes............................................................................................................................................................. 17,622Pension liabilities........................................................................................................................................................ 7,109Other........................................................................................................................................................................... (10,214)Elimination of minority interest................................................................................................................................. (118,958)Total liability step-up or elimination................................................................................................................... (104,441)Net assets acquired..................................................................................................................................................... $300,000The $1,250,000 assigned to in-process research and development was written off as of the acquisition date. The weighted average amortizationperiod for amortizable intangibles is 9 years. No amount of goodwill is expected to be deductible for tax purposes.The Company completed its purchase price allocations for Interpore and <strong>Biomet</strong> Merck in accordance with U.S. generally accepted accountingprinciples. The process included interviews with management, review of the economics and competitive environment in which the companiesoperate and examination of assets, including historical performance and future prospects. The purchase price allocations were based oninformation then available to the Company, and expectations and assumptions deemed reasonable to the Company’s management. Noassurances can be given, however, that the underlying assumptions used to estimate expected technology based product revenues, developmentcosts or profitability, or the events associated with such technology, will occur as projected.Other Acquisitions – During fiscal <strong>2006</strong> and 2004, the Company completed several acquisitions of foreign distributors and/or businesses.The acquisitions were accounted for using the purchase method of accounting with the operating results of the acquired businesses includedin the Company’s consolidated financial statements from the date of acquisition. Goodwill recognized in connection with these acquisitionsaggregated $6.4 million in fiscal <strong>2006</strong> and $9.7 million in fiscal 2004.Pro forma financial information reflecting all acquisitions accounted for as purchases has not been presented as it is not materially differentfrom the Company’s historical results.41
<strong>Biomet</strong>, Inc. & Subsidiaries Notes To ConsolidatedFinancial Statements (continued)Note D: Investments.At May 31, <strong>2006</strong>, the Company’s investment securities were classified as follows:(in thousands)Amortized UnrealizedCost Gains Losses Fair ValueAvailable-for-sale:Debt securities............................................................................................................ $ 8,534 $ – $ (551) $ 7,983Equity securities......................................................................................................... 19,307 618 (541) 19,384Mortgage-backed securities........................................................................................ 36,285 – (2,679) 33,606Total available-for-sale....................................................................................... 64,126 618 (3,771) 60,973Held-to-maturity:Debt securities............................................................................................................ 2,961 – (66) 2,895Mortgage-backed obligations..................................................................................... 74 – – 74Total held-to-maturity......................................................................................... 3,035 – (66) 2,969Certificates of deposit................................................................................................. 500 – – 500Total............................................................................................................................ $67,661 $618 $(3,837) $64,442At May 31, 2005, the Company’s investment securities were classified as follows:(in thousands)Amortized UnrealizedCost Gains Losses Fair ValueAvailable-for-sale:Debt securities............................................................................................................ $10,047 $ – $ (356) $ 9,691Equity securities......................................................................................................... 22,288 1,099 (1,975) 21,412Mortgage-backed securities........................................................................................ 36,670 2 (2,569) 34,103Total available-for-sale....................................................................................... 69,005 1,101 (4,900) 65,206Held-to-maturity:Debt securities............................................................................................................ 4,955 – (22) 4,933Mortgage-backed obligations..................................................................................... 107 – – 107Total held-to-maturity......................................................................................... 5,062 – (22) 5,040Certificates of deposit................................................................................................. 2,100 – – 2,100Total............................................................................................................................ $76,167 $1,101 $(4,922) $72,346Proceeds from sales of available-for-sale securities were $71,118,000, $58,050,000 and $178,165,000 for the years ended May 31, <strong>2006</strong>,2005 and 2004, respectively. There were no sales of held-to-maturity securities for the years ended May 31, <strong>2006</strong>, 2005 and 2004. The costof marketable securities sold is determined by the specific identification method. For the year ended May 31, <strong>2006</strong>, gross realized gainsand (losses) on sales of available-for-sale securities were $2,380,000 and $(2,107,000), respectively. For the year ended May 31, 2005,gross realized gains and (losses) on sales of available-for-sale securities were $918,000 and $(899,000), respectively. For the year endedMay 31, 2004, gross realized gains and (losses) on sales of available-for-sale securities were $1,669,000 and $(1,455,000), respectively.The Company’s investment securities at May 31, <strong>2006</strong> include $5,880,000 of debt securities, and $500,000 of certificates of deposits allmaturing within one year, and $5,064,000 of debt securities and $33,680,000 of mortgage-backed securities all maturing past one year.Investment income (included in other income, net) consists of the following:(in thousands)<strong>2006</strong> 2005 2004Interest income....................................................................................................................... $ 6,851 $4,191 $ 8,271Dividend income.................................................................................................................... 1,905 1,890 2,150Net realized gains................................................................................................................... 5,617 1,785 3,576Total................................................................................................................................ $14,373 $7,866 $13,99742
<strong>Biomet</strong>, Inc. & Subsidiaries Notes To ConsolidatedFinancial Statements (continued)Note E: Inventories.Inventories at May 31, <strong>2006</strong> and 2005 consist of the following:(in thousands)<strong>2006</strong> 2005Raw materials................................................................................................................................................. $ 71,126 $ 50,676Work-in-progress............................................................................................................................................ 48,416 56,610Finished goods................................................................................................................................................ 225,997 200,041Consigned distributor..................................................................................................................................... 188,976 162,464Total................................................................................................................................................................ $534,515 $469,791Reserves for excess and slow-moving inventory at May 31, <strong>2006</strong> and 2005 were $99,427,000 and $93,046,000, respectively.Note F: Goodwill and Other Intangible Assets.The following table summarizes the changes in the carrying amount of goodwill for the year ended May 31, <strong>2006</strong>:(in thousands)UnitedRest ofStates Europe World TotalBalance at May 31, 2004............................................................................................ $ 76,403 $181,578 $4,087 $262,068Goodwill acquired.................................................................................................. 169,596 – – 169,596Currency translation............................................................................................... – 3,443 514 3,957Balance at May 31, 2005............................................................................................ 245,999 185,021 4,601 435,621Goodwill acquired.................................................................................................. – 6,409 – –Currency translation............................................................................................... – (752) 119 5,776Balance at May 31, <strong>2006</strong>............................................................................................ $245,999 $190,678 $4,720 $441,397The components of identifiable intangible assets are as follows as of May 31:(in thousands)<strong>2006</strong> 2005Gross Carrying Accumulated Gross Carrying AccumulatedAmount Amortization Amount AmortizationIntangible assets subject to amortization:Developed technology and patents............................................. $ 50,658 $15,102 $ 49,215 $10,943Trademarks and trade names...................................................... 3,599 765 3,599 453Customer relationships............................................................... 16,734 5,858 16,670 2,808Covenants not to compete.......................................................... 3,974 1,639 4,055 923Other........................................................................................... 923 526 923 26075,888 23,890 74,462 15,387Intangible assets not subject to amortization:Trademarks and trade names...................................................... 27,500 – 28,760 –Total identifiable intangible assets.................................................. $103,388 $23,890 $103,222 $15,387Total amortization expense for finite-lived intangible assets was $10,201,000, $7,821,000 and $5,757,000 in <strong>2006</strong>, 2005 and 2004,respectively, and was recorded as part of selling, general and administrative expense. The weighted average amortization lives for thecovenants not to compete, developed technology and patents, trademarks and trade names, and customer relationships are 5 years, 10years, 10 years and 15 years, respectively. The weighted average amortization life of these intangible assets on a combined basis is 9 years.Estimated annual amortization expense for the years ended May 31, 2007 through 2011 is $8.7 million.43
<strong>Biomet</strong>, Inc. & Subsidiaries Notes To ConsolidatedFinancial Statements (continued)Note G: Debt.At May 31, <strong>2006</strong> and 2005, short-term borrowings consist of the following:(in thousands)<strong>2006</strong> 2005Bank line of credit........................................................................................................................................... $180,000 $180,000Bank line of credit – <strong>Biomet</strong> Europe............................................................................................................... 57,037 61,565Bank line of credit – <strong>Biomet</strong> Japan................................................................................................................. 39,524 40,628Total............................................................................................................................................................. $276,561 $282,193In connection with the Interpore acquisition, the Company entered into a 36-month revolving credit facility in the amount of $200 milliondue in June 2007. Interest is payable monthly at the applicable LIBOR Rate plus .375%. The Company also pays a quarterly facility fee of.125%. The interest rate at May 31, <strong>2006</strong> was 5.47%. <strong>Biomet</strong> Europe has a EUR 100 million ($126 million at May 31, <strong>2006</strong>) unsecured lineof credit with a major European bank. This line of credit is used to finance its operations and interest on outstanding borrowings is payablemonthly at the lender’s interbank rate plus 0.6% (effective rate of 3.1% and 2.65% at May 31, <strong>2006</strong> and 2005, respectively). <strong>Biomet</strong> Japanhas a YEN 4.5 billion ($39.5 million at May 31, <strong>2006</strong>) unsecured line of credit with major Japanese banks. This line of credit is used tofinance its operations and interest on outstanding borrowings is payable monthly at the lender’s interbank rate plus 0.6% (effective rate of1.03% and 1.01% at May 31, <strong>2006</strong> and 2005, respectively).Note H: Team Member Benefit Plans.The Company has an Employee Stock Bonus Plan for eligible Team Members of the Company and certain subsidiaries. The Company hashistorically contributed up to 3% of an eligible Team Member’s compensation. The amounts expensed under this plan for the years endedMay 31, <strong>2006</strong>, 2005 and 2004 were $6,603,000, $5,849,000 and $5,759,000, respectively. The Company makes cash contributions to theplan and issues no Common Shares in connection with the plan.The Company also has a defined contribution profit sharing plan which covers substantially all of the Team Members within the continentalU.S. and allows participants to make contributions by salary reduction pursuant to Section 401(k) of the Internal Revenue Code. The Companycurrently matches up to 75% of the Team Member’s contribution up to a maximum of 5% of the Team Member’s compensation. The amountsexpensed under this profit sharing plan for the years ended May 31, <strong>2006</strong>, 2005 and 2004 were $6,319,000, $5,472,000 and $4,586,000,respectively.44
<strong>Biomet</strong>, Inc. & Subsidiaries Notes To ConsolidatedFinancial Statements (continued)Note I: Stock Option Plans.The Company has various stock option plans: the 1992 Employee and Non-Employee Director Stock Option Plan; the 1992 DistributorStock Option Plan and the <strong>Biomet</strong>, Inc. 1998 Qualified and Non-Qualified Stock Option Plan. At May 31, <strong>2006</strong>, the only plan with sharesavailable for grant is the <strong>Biomet</strong>, Inc. 1998 Qualified and Non-Qualified Stock Option Plan.Under the stock option plans, options may be granted to key employees, non-employee directors and distributors, at the discretion of theCompensation and Stock Option Committee, and generally become exercisable in annual or biannual increments beginning one or twoyears after the date of grant in the case of employee options and in annual increments beginning at the date of grant for distributor options.In the case of options granted to an employee of the Company who is a 10% or more shareholder, the option price is an amount per sharenot less than 110% of the fair market value per share on the date of granting the option, as determined by the Compensation and StockOption Committee. No options have been granted to employees who are 10% or more shareholders. The option price for options grantedto all other employees, distributors and non-employee directors is an amount per share not less than the fair market value per share on thedate of granting the option. The term of each option granted expires within the period prescribed by the Compensation and Stock OptionCommittee, but shall not be more than five years from the date the option is granted if the optionee is a 10% or more shareholder, and notmore than ten years for all other optionees. All rights under the options automatically terminate upon the optionee’s separation from servicewith the Company, unless such separation results from retirement, disability or death. For the years ended May 31, <strong>2006</strong>, 2005 and 2004, theamount of compensation expense applicable to options granted to distributors was not material to the consolidated financial statements.The following table summarizes stock option activity:Number Weighted Averageof Shares Exercise PriceOutstanding, May 31, 2003............................................................................................................................ 7,792,141 $20.93Granted....................................................................................................................................................... 1,892,270 34.45Exercised.................................................................................................................................................... (1,982,116) 15.45Terminated.................................................................................................................................................. (344,926) 20.75Outstanding, May 31, 2004............................................................................................................................ 7,357,369 25.89Granted....................................................................................................................................................... 2,407,505 42.44Exercised.................................................................................................................................................... (1,326,339) 19.21Terminated.................................................................................................................................................. (374,700) 24.99Outstanding, May 31, 2005............................................................................................................................ 8,063,835 31.86Granted....................................................................................................................................................... 2,878,601 35.01Exercised.................................................................................................................................................... (1,172,179) 22.76Terminated.................................................................................................................................................. (607,301) 34.59Outstanding, May 31, <strong>2006</strong>............................................................................................................................ 9,162,956 $33.84Options outstanding at May 31, <strong>2006</strong>, are exercisable at prices ranging from $11.14 to $48.27 and have a weighted average remainingcontractual life of 7.2 years. At May 31, <strong>2006</strong> there were 4,618,962 shares available for future option grants. The following table summarizesinformation about stock options outstanding at May 31, <strong>2006</strong>.OutstandingWeighted WeightedNumber Average Average Number WeightedRange of Outstanding at Remaining Exercise Exercisable at AverageExercise Price May 31, <strong>2006</strong> Contractual Life Price May 31, <strong>2006</strong> Exercise Price$11.14 – 20.00 169,542 0.8 years $13.62 160,398 $13.4420.01 – 30.00 2,570,541 5.3 years 26.09 752,735 26.0330.01 – 40.00 4,398,451 8.3 years 34.99 349,862 35.2040.01 – 48.27 2,024,422 7.5 years 42.89 310,376 42.559,162,956 1,573,371At May 31, 2005 and 2004, there were exercisable options outstanding to purchase 1,540,773 and 1,781,383 shares, respectively, at weightedaverage exercise prices of $23.20 and $20.27, respectively. The weighted average fair value of options granted during the fiscal years endedMay 31, <strong>2006</strong>, 2005, and 2004 was $12.57, $11.87, and $11.03, respectively.45
<strong>Biomet</strong>, Inc. & Subsidiaries Notes To ConsolidatedFinancial Statements (continued)Note J: Shareholders’ Equity & Earnings Per Share.The Company announced a cash dividend of thirty cents ($0.30) per share, payable July 21, <strong>2006</strong> to shareholders of record at the close ofbusiness on July 14, <strong>2006</strong>.Shares used in computation of diluted earnings per share reflect the dilutive effect of stock options.In December 1999, the Board of Directors of the Company adopted a new Shareholder Rights Plan (the “Plan”) to replace a 1989 rights planthat expired on December 2, 1999. Under the Plan, rights have attached to the outstanding common shares at the rate of one right for eachshare held by shareholders of record at the close of business on December 28, 1999. The rights will become exercisable only if a person orgroup of affiliated persons (an “Acquiring Person”) acquires 15% or more of the Company’s common shares or announces a tender offer orexchange offer that would result in the acquisition of 30% or more of the outstanding common shares. At that time, the rights may be redeemedat the election of the Board of Directors of the Company. If not redeemed, then prior to the acquisition by the Acquiring Person of 50% ormore of the outstanding common shares of the Company, the Company may exchange the rights (other than rights owned by the AcquiringPerson, which would have become void) for common shares (or other securities) of the Company on a one-for-one basis. If not exchanged,the rights may be exercised and the holders may acquire preferred share units or common shares of the Company having a value of two timesthe exercise price of $117.00. Each preferred share unit carries the same voting rights as one common share. If the Acquiring Person engagesin a merger or other business combination with the Company, the rights would entitle the holders to acquire shares of the Acquiring Personhaving a market value equal to twice the exercise price of the rights. The Plan will expire in December 2009. The Plan is intended to protectthe interests of the Company’s shareholders against certain coercive tactics sometimes employed in takeover attempts.Note K: Income Taxes.The components of income before income taxes are as follows:(in thousands)<strong>2006</strong> 2005 2004United States operations............................................................................................................ $531,001 $490,252 $468,701Foreign operations..................................................................................................................... 80,200 59,448 40,095Total....................................................................................................................................... $611,201 $549,700 $508,796The provision for income taxes is summarized as follows:(in thousands)Current: <strong>2006</strong> 2005 2004Federal................................................................................................................................... $171,339 $161,971 $156,925State, including Puerto Rico.................................................................................................. 19,012 19,927 20,865Foreign................................................................................................................................... 19,808 12,936 11,994210,159 194,834 189,784Deferred..................................................................................................................................... (5,102) 3,250 (13,686)Total....................................................................................................................................... $205,057 $198,084 $176,098Effective tax rate........................................................................................................................ 33.5% 36.0% 34.6%A reconciliation of the statutory federal income tax rate to the Company’s effective tax rate follows:<strong>2006</strong> 2005 2004U.S. statutory income tax rate................................................................................................... 35.0% 35.0% 35.0%Add (deduct):State taxes, less effect of federal reduction........................................................................... 1.7 2.0 2.1Foreign income taxes at rates different from the U.S. statutory rate..................................... (.9) (1.3) (.4)Tax benefit relating to operations in Puerto Rico.................................................................. (.6) (.2) (.2)Tax credits............................................................................................................................. (.3) (.4) (.7)Tax benefit relating to U.S. export sales................................................................................ (1.2) (.6) (.5)In-process research and development.................................................................................... – 1.7 –Other...................................................................................................................................... (.2) (.2) (.7)Effective tax rate........................................................................................................................ 33.5% 36.0% 34.6%46
<strong>Biomet</strong>, Inc. & Subsidiaries Notes To ConsolidatedFinancial Statements (continued)Note K: Income Taxes, Concluded.The components of the net deferred tax asset and liability at May 31, <strong>2006</strong> and 2005 are as follows:(in thousands)Current deferred tax asset: <strong>2006</strong> 2005Accounts and notes receivable................................................................................................................... $ 19,541 $ 19,730Inventories.................................................................................................................................................. 43,480 40,875Accrued expenses....................................................................................................................................... 10,324 12,127Current deferred tax asset....................................................................................................................... $ 73,345 $ 72,732Long-term deferred tax asset (liability):Depreciation............................................................................................................................................... $(11,296) $(12,202)Financial accounting basis of net assets of acquired companies different than tax basis.......................... (12,100) (12,681)Other........................................................................................................................................................... (3,595) (6,372)Long-term deferred tax liability.............................................................................................................. $(26,991) $(31,255)Note L: Segment Data.The Company operates in one business segment, musculoskeletal products, which includes the designing, manufacturing and marketingof reconstructive products, fixation devices, spinal products and other products. Other products consist primarily of EBI’s softgoods andbracing products, Arthrotek’s arthroscopy products, general instruments and operating room supplies. The Company manages its businesssegment primarily on a geographic basis. These geographic markets are comprised of the United States, Europe and the Rest of World.Major markets included in the Rest of World geographic market are Australia, Japan and Canada. The Company evaluates performance ofeach geographic segment based on net sales growth exclusive of foreign currency impact and operating income exclusive of acquisitionexpenses and inventory step-up and in-process research and development write-offs. Identifiable assets are those assets used exclusively inthe operations of each geographic segment. Revenues attributable to each geographic segment are based on the location of the customer.Net sales growth by geographic segment and product category are as follows:(in thousands)<strong>2006</strong> 2005Sales Growth Sales Growth in Sales Growth Sales Growth inAs <strong>Report</strong>ed FX Impact Local Currencies As <strong>Report</strong>ed FX Impact Local CurrenciesNet sales to customers:United States......................... 7% –% 7% 15% –% 15%Europe................................... 7 4 11 17 7 10Rest of World........................ 17 1 16 31 4 27Total...................................... 8% 1% 9% 16% 2% 14%Product category sales growth:Reconstructive products....... 10% 1% 11% 19% 3% 16%Fixation devices.................... 2 0 2 (1) 1 (2)Spinal products..................... 4 0 4 34 1 33Other products...................... 5% 1% 6% 7% 1% 6%47
<strong>Biomet</strong>, Inc. & Subsidiaries Notes To ConsolidatedFinancial Statements (continued)Note L: Segment Data, Concluded.Net sales of musculoskeletal products by product category and reportable geographic segment results are as follows:(in thousands)<strong>2006</strong> 2005 2004Reconstructive products............................................................................................................ $1,379,420 $1,254,234 $1,052,865Fixation devices......................................................................................................................... 251,360 246,730 248,821Spinal products.......................................................................................................................... 221,964 214,039 159,927Other products........................................................................................................................... 172,995 164,947 153,640$2,025,739 $1,879,950 $1,615,253Net sales to customers:United States.......................................................................................................................... $1,325,113 $1,238,727 $1,079,532Europe.................................................................................................................................... 520,660 487,991 418,328Rest of World......................................................................................................................... 179,966 153,232 117,393$2,025,739 $1,879,950 $1,615,253Operating income:United States.......................................................................................................................... $ 519,536 $ 507,690 $ 443,862Europe.................................................................................................................................... 77,927 76,566 49,228Rest of World......................................................................................................................... 10,864 12,898 4,241Current period impact of inventory step-up.......................................................................... – (24,250) (2,450)Write-off of in-process research and development................................................................ – (26,020) (1,250)$ 608,327 $ 546,884 $ 493,631Long-lived assets:United States.......................................................................................................................... $ 488,097 $ 475,087 $ 241,035Europe.................................................................................................................................... 364,110 353,979 334,177Rest of World......................................................................................................................... 32,879 23,732 19,814$ 885,086 $ 852,798 $ 595,026Capital expenditures:United States.......................................................................................................................... $ 48,175 $ 50,930 $ 26,833Europe.................................................................................................................................... 47,023 38,008 26,068Rest of World......................................................................................................................... 13,714 8,434 8,441$ 108,912 $ 97,372 $ 61,342Depreciation and amortization:United States.......................................................................................................................... $ 39,275 $ 29,273 $ 22,309Europe.................................................................................................................................... 37,477 34,695 30,746Rest of World......................................................................................................................... 5,425 5,634 5,163$ 82,177 $ 69,602 $ 58,21848
<strong>Biomet</strong>, Inc. & Subsidiaries Notes To ConsolidatedFinancial Statements (concluded).Note M: Commitments & Contingencies.Medical Insurance Plan – The Company maintains a self-insurance program for covered medical expenses for all Team Members withinthe continental U.S. The Company is liable for claims up to $150,000 per insured annually, as well as an additional annual aggregate of$60,000. Self-insurance costs are accrued based upon the aggregate of the liability for reported claims and a management-determinedestimated liability for claims incurred but not reported.Liability Insurance – Since 1989, the Company has self-insured against product liability risks, with excess coverage on a claims-made basisfrom various insurance carriers in excess of the self-insured amounts and subject to certain policy limits. Self-insurance costs are accruedbased on reserves set in consultation with the insurance carrier for reported claims and a management-determined estimated liability forclaims incurred but not reported. Based on historical experience, management does not anticipate that incurred but unreported claims wouldhave a material impact on the Company’s consolidated financial position.Litigation – On March 30, 2005 the Company announced that it had received a subpoena from the U.S. Department of Justice through the U.S.Attorney for the District of New Jersey requesting documents related to any consulting and professional service agreements with orthopedicsurgeons using or considering the use of <strong>Biomet</strong>’s hip or knee implants for the period January 2002 through March 29, 2005. The Companyis aware that similar inquiries were directed to other companies in the orthopedics industry. On July 19, <strong>2006</strong> <strong>Biomet</strong> received a letterfrom the U.S. Department of Justice through the U.S. Attorney for the District of New Jersey requesting additional documents further tothe subpoena issued in March 2005. This letter requested additional documents related to consulting and service agreements for the timeperiod January 1998 through the present, as well as research and other grant agreements for that same time period. Further, the letterrequested that the Company provide copies of the agreements identified in the supplemental request on an on-going basis. In addition, therequested information related to Company-sponsored training events, the selection process used by the Company to identify consultantsand researchers, the Company’s product design process for hip and knee implants and information on the Company’s orthopedic salesforce. The Company has cooperated and intends to continue to fully cooperate with the Department of Justice inquiry. The results of thisinquiry may not be known for several years.In February <strong>2006</strong>, SDGI Holdings, Inc. and Medtronic Sofamor Danek, Inc. (collectively referred to herein as “Medtronic”) brought anaction against EBI and <strong>Biomet</strong> alleging infringement of seven patents. Specifically, Medtronic alleges that the patents are infringed by certaincomponents of the Company’s Vuelock ® Anterior Cervical Plate System, as well as instruments and surgical implantation methods associatedwith the Company’s Array ® Spinal System. Medtronic’s complaint did not seek a specific amount of damages, but does seek to enjoin theCompany from manufacturing, selling and/or distributing the allegedly infringing products. The Company has filed a counterclaim seekinga finding of noninfringement of the patents at issue and a finding that certain of the patents are invalid and unenforceable. The litigation isin the early stages of discovery. The Company is vigorously defending this matter and intends to continue to do so.On June 26, <strong>2006</strong> the Company announced that it had received a federal grand jury subpoena issued at the request of the U.S. Departmentof Justice, Antitrust Division, requesting documents regarding possible violations of federal criminal law, including possible violations ofthe antitrust laws, relating to the manufacture and sale of orthopedic implant devices (the “Subpoena”). The Subpoena requests documentsfrom January 1, 2001 through the present date. The Company is aware of similar subpoenas directed to other companies in the orthopedicsindustry. The Company has cooperated and intends to continue to fully cooperate with the Department of Justice investigation. Theresult of this investigation may not be known for several years. However, the scope of the Subpoena has currently been narrowed to aspecific geographic region and specific product lines. It is the Company’s belief that the other orthopedic companies that received similarsubpoenas have received similar guidance. It is the Company’s belief that the investigation was prompted by an unsolicited e-mail sent by arepresentative of one of the Company’s competitors that proposed a common pricing strategy in connection with a particular hospital. Thise-mail was received by an independent sales representative of an independent distributor for <strong>Biomet</strong> Orthopedics, but it was never transmittedto the Company. Neither the Company, its independent distributor, nor its independent sales representative took any action in response tothe e-mail, and the Company believes that no anticompetitive activity took place as a result of it. The Company requires compliance by itsemployees and its independent distributors with its Code of Business Conduct and Ethics and with applicable antitrust laws. The informationprovided herein is limited to the information available to the Company at the present time and the Company cannot offer any assurancesas to the scope and final outcome of this investigation.On an issue related to the subpoena received from the Antitrust Division of the U.S. Department of Justice, the Company has receivedtwo complaints in class action lawsuits alleging violations of the Sherman Antitrust Act. In addition, the Company is aware of othercomplaints that have been filed, but not served on the Company. The complaints also named various other companies in the orthopedicsindustry as defendants. The Company intends to vigorously defend this matter and believes that it has meritorious defenses to the claimsbeing asserted.There are various other claims, lawsuits, disputes with third parties, investigations and pending actions involving various allegations againstthe Company incident to the operation of its business, principally product liability and intellectual property cases. Each of these matters issubject to various uncertainties, and it is possible that some of these matters may be resolved unfavorably to the Company. The Companyestablishes accruals for losses that are deemed to be probable and subject to reasonable estimate. Based on the advice of counsel to theCompany in these matters, management believes that the ultimate outcome of these matters and any liabilities in excess of amounts providedwill not have a material adverse impact on the Company’s consolidated financial statements taken as a whole.49
<strong>Biomet</strong>, Inc. and Subsidiaries Schedule II – Valuationand Qualifying Accounts.for the years ended May 31, <strong>2006</strong>, 2005 and 2004(in thousands)________Col. A Col. B Col. C Col. D Col. EAdditions(1) (2)Charged toDescription Balance at Charged to other Balancebeginning of costs and accounts – Deductions – at end ofperiod expenses describe describe periodAllowance fordoubtful receivables:For the year endedMay 31, <strong>2006</strong> $59,513 $21,725 $(351) (C) $11,753 (A) $69,134===== ====== ===== ===== ======For the year endedMay 31, 2005 $43,384 $29,116 $ 288 (B) $14,280 (A) $59,5131,005 (C)===== ====== ===== ===== ======For the year endedMay 31, 2004 $18,742 $41,341 $1,195 (B) $14,562 (A) $43,384223 (C)(3,555) (D)===== ====== ===== ===== ======Excess and obsoleteinventory reserves:For the year endedMay 31, <strong>2006</strong> $93,046 $29,577 $(1,290) (C) $21,906 (E) $99,427===== ====== ===== ===== ======For the year endedMay 31, 2005 $81,655 $34,792 $2,984 (C) $26,385 (E) $93,046===== ====== ===== ===== ======For the year endedMay 31, 2004 $80,467 $37,338 $2,259 (C) $22,239 (E) $81,655(16,170) (D)===== ====== ===== ===== ======Notes:(A) Uncollectible accounts written off(B) Collection of previously written off accounts(C) Effect of foreign currency translation(D) Acquisitions(E) Inventory written off50
Item 9. <strong>Change</strong>s in and Disagreements with Accountants on Accountingand Financial Disclosure.Not Applicable.Item 9A. Controls and Procedures.(a) Evaluation of Disclosure Controls and Procedures. As of the end of the period covered by this report, the Company carried out anevaluation, under the supervision and with the participation of its management, including the Company’s Interim Chief Executive Officer andChief Financial Officer, of the effectiveness of the Company’s disclosure controls and procedures (as defined in Rules 13a-15(e) and 15d-15(e)of the Securities Exchange Act of 1934). Based on this evaluation, the Company’s Interim Chief Executive Officer and Chief Financial Officerhave concluded that the Company’s disclosure controls and procedures are effective in timely notifying them of information the Company isrequired to disclose in its periodic SEC filings and in ensuring that this information is recorded, processed, summarized and reported withinthe time periods specified in the SEC’s rules and regulations.(b) Management’s <strong>Report</strong> on Internal Control over Financial <strong>Report</strong>ing. Pursuant to Section 404 of the Sarbanes-Oxley Act of 2002 and therules and regulations adopted pursuant thereto, the Company included a report of management’s assessment of the effectiveness of its internalcontrol over financial reporting as of May 31, <strong>2006</strong> as part of this report. The Company’s independent registered public accounting firm alsoattested to, and reported on, management’s assessment of the effectiveness of internal control over financial reporting as of May 31, <strong>2006</strong>.Management’s report and the independent registered public accounting firm’s attestation report are included on pages 30 and 31, respectively,of this report and are incorporated herein by reference.(c) <strong>Change</strong>s in Internal Control. During the fourth quarter of fiscal year <strong>2006</strong>, there were no significant changes in our internal control overfinancial reporting that have materially affected, or are reasonably likely to materially affect, our internal control over financial reporting.Item 9B. Other InformationThere was no information to be disclosed in a current <strong>Report</strong> on Form 8-K during the forth quarter of fiscal year <strong>2006</strong> that was not previouslyreported.51
PART IIIItem 10. Directors and Executive Officers of the Registrant.Information regarding the background of directors, matters related to the Audit Committee and Section 16(a) compliance appears under thecaptions “Item I–Election of Directors” and “Section 16(a) Beneficial Ownership <strong>Report</strong>ing Compliance” in the Company’s definitive ProxyStatement filed with the Securities and Exchange Commission pursuant to Regulation 14A in connection with its <strong>2006</strong> <strong>Annual</strong> Meeting ofShareholders (the “Proxy Statement”), which is incorporated herein by reference in response to this item.Information regarding executive officers of the Company is included in Part I, Item 1 of this <strong>Report</strong> under the caption “Executive Officers ofthe Registrant.”There have been no material changes to the procedures by which shareholders may recommend nominees to the Company’s Board of Directorssince August 12, 2005, the date of the Company’s last Proxy Statement.The Company has adopted a Code of Business Conduct and Ethics (the “Code”) that applies to all of its employees, officers, and directors,including its Chief Executive Officer, Chief Financial Officer, and Controller, as well as certain other personnel associated with the Company.A copy of the Code is posted on the Company’s website at www.biomet.com in the Corporate Governance section. A free copy of the Code mayalso be requested by contacting <strong>Biomet</strong>’s Investor Relations Department at P.O. Box 587, Warsaw, IN 46581-0587 or at (574) 372-1514.The Company has also adopted written charters for its Audit Committee and Nominating and Corporate Governance Committee, each ofwhich is attached to the Proxy Statement and posted on the Company’s website www.biomet.com in the Corporate Governance section.A free copy of the charters may also be requested by contacting <strong>Biomet</strong>’s Investor Relations Department at P.O. Box 587, Warsaw, IN46581-0587 or at (574) 372-1514.Item 11. Executive Compensation.The information included under the captions “Election of Directors – Compensation of Directors” and “Executive Compensation” in the ProxyStatement is incorporated herein by reference in response to this item. The “<strong>Report</strong> of the Compensation and Stock Option Committee” is notincorporated herein by reference.Item 12. Security Ownership of Certain Beneficial Owners andManagement and Related Stockholder Matters.The information contained under the captions “Stock Ownership” in the Proxy Statement is incorporated herein by reference in response tothis item.Securities Authorized for Issuance Under Equity Compensation PlansThe following table sets forth information regarding the securities to be issued and the securities remaining available for issuance under theCompany’s stock-based incentive plans as of May 31, <strong>2006</strong> (in thousands, except exercise price per share):Number of Securities RemainingNumber of Securities to Weighted-Average Available for Future IssuanceBe Issued upon Exercise Exercise Price of Under Equity Compensationof Outstanding Options, Outstanding Options, Plans (exluding securitiesWarrants and Rights Warrants and Rights reflected in first column)Equity compensation plans approvedby security holders......................................... 9,162,956 $33.84 4,618,962Equity compensation plans not approvedby security holders......................................... – – –Total................................................................... 9,162,956 $33.84 4,618,962Further information about the Company’s stock-based incentive plans can be found in Note I to the financial statements contained in Item 8of this report. The Company does not have any plans not approved by its shareholders.52
Item 13. Certain Relationships and Related Transactions.The information contained under the caption “Certain Transactions” in the Proxy Statement is incorporated herein by reference in responseto this item.Item 14. Principal Accounting Fees and Services.Information relating to the Company’s auditors and the Audit Committee’s pre-approval policies can be found under the caption “MattersRelating to Auditors” in the Proxy Statement which is incorporated herein by reference. The “Audit Committee <strong>Report</strong>” is not incorporatedherein by reference.PART IVItem 15. Exhibits, Financial Statement Schedules.(a) The following financial statements and financial statement schedule are included in Item 8 herein.(1) Financial Statements:Management’s <strong>Report</strong> on Internal Control over Financial <strong>Report</strong>ing<strong>Report</strong> of Independent Registered Public Accounting Firm on Internal Control over Financial <strong>Report</strong>ing<strong>Report</strong> of Independent Registered Public Accounting FirmConsolidated Balance Sheets as of May 31, <strong>2006</strong> and 2005Consolidated Statements of Income for the years ended May 31, <strong>2006</strong>, 2005 and 2004Consolidated Statements of Shareholders’ Equity for the years ended May 31, <strong>2006</strong>, 2005 and 2004Consolidated Statements of Cash Flows for the years ended May 31, <strong>2006</strong>, 2005 and 2004Notes to Consolidated Financial Statements(2) Financial Statement Schedule:Schedule II - Valuation and Qualifying Accounts(3) Exhibits:Refer to the Index to Exhibits immediately following the signature page of this report, which is incorporatedherein by reference.53
SIGNATURESPursuant to the requirements of Section 13 or 15(d) of the Securities Exchange Act of 1934, the registrant has duly caused thisreport to be signed on its behalf by the undersigned, thereunto duly authorized on August 11, <strong>2006</strong>.BIOMET, INC.By:/s/ DANIEL P. HANNDaniel P. HannInterim President and Chief Executive OfficerPursuant to the requirements of the Securities Exchange Act of 1934, this report has been signed below by the following personson behalf of the registrant and in the capacities indicated on August 11, <strong>2006</strong>.By:/s/ NILES L. NOBLITTNiles L. Noblitt, Chairman of the Board and DirectorBy:/s/ JERRY L. FERGUSONJerry L. Ferguson, Vice-Chairman of the Board and DirectorBy:/s/ DANE A. MILLERDane A. Miller, DirectorBy:/s/ DANIEL P. HANNDaniel P. Hann, Interim President and Chief Executive Officerand Director(Principal Executive Officer)By:/s/ C. SCOTT HARRISONC. Scott Harrison, Lead DirectorBy:/s/ M. RAY HARROFFM. Ray Harroff, DirectorBy:/s/ THOMAS F. KEARNS, JR.Thomas F. Kearns, Jr., Director54
By:/s/ SANDRA A. LAMBSandra A. Lamb, DirectorBy:/s/ JERRY L. MILLERJerry L. Miller, DirectorBy:/s/ KENNETH V. MILLERKenneth V. Miller, DirectorBy:/s/ CHARLES E. NIEMIERCharles E. Niemier, DirectorBy:/s/ MARILYN TUCKER QUAYLEMarilyn Tucker Quayle, DirectorBy:/s/ L. GENE TANNERL. Gene Tanner, DirectorBy:/s/ GREGORY D. HARTMANGregory D. Hartman, Senior Vice President - Finance(Principal Financial Officer)By:/s/ JAMES W. HALLERJames W. Haller, Controller(Principal Accounting Officer)55
INDEX TO EXHIBITSExhibit Number Assignedin Regulation S-K, Item 601Title of Exhibits(2) No exhibit(3) 3.1 Amended Articles of Incorporation filed July 23,1982. (Incorporated by reference to Exhibit 3(a) to <strong>Biomet</strong>,Inc. Form S-18 Registration Statement, File No. 2-78589C).3.2 Articles of Amendment to Amended Articles of Incorporation filed July 11, 1983. (Incorporated byreference to Exhibit 3.2 to <strong>Biomet</strong>, Inc. Form 10-K <strong>Report</strong> for year ended May 31, 1983, File No. 0-12515).3.3 Articles of Amendment to Amended Articles of Incorporation filed August 22, 1987. (Incorporated byreference to Exhibit 3.3 to <strong>Biomet</strong>, Inc. Form 10-K <strong>Report</strong> for year ended May 31, 1987, File No. 0-12515).3.4 Articles of Amendment to the Amended Articles of Incorporation filed September 18, 1989. (Incorporatedby reference to Exhibit 3.4 to <strong>Biomet</strong>, Inc. Form 10-K <strong>Report</strong> for year ended May 31, 1990, File No.0-12515).3.5 Amended and Restated Bylaws as Amended December 13, 1997. (Incorporated by reference to Exhibit 3.6to <strong>Biomet</strong>, Inc. Form 10-K <strong>Report</strong> for year ended May 31, 1998, File No. 0-12515).(4) 4.1 Specimen certificate for Common Shares. (Incorporated by reference to Exhibit 4.1 to <strong>Biomet</strong>, Inc. Form10-K <strong>Report</strong> for year ended May 31, 1985, File No. 0-12515).4.2 Rights Agreement between <strong>Biomet</strong>, Inc. and Lake City Bank as Rights Agent, dated as of December 16,1999. (Incorporated by reference to Exhibit 4 to <strong>Biomet</strong>, Inc. Form 8-K <strong>Report</strong> dated December 16, 1999,File No. 0-12515), as amended September 1, 2002 to change rights agent to American Stock Transfer andTrust Company. (Incorporated by reference to Exhibit 4.2 to <strong>Biomet</strong>, Inc. Form 10-Q Quarterly <strong>Report</strong>dated January 13, 2003, File No. 0-12515).(9) No exhibit.(10) 10.1 Employee and Non-Employee Director Stock Option Plan, dated September 18, 1992. (Incorporated byreference to Exhibit 19.1 to <strong>Biomet</strong>, Inc. Form 10-K <strong>Report</strong> for year ended May 31, 1993, File No.0-12515).10.2 Form of Stock Option Agreement under the Employee and Non-Employee Stock Option Plan datedSeptember 18, 1992. (Incorporated by reference to Exhibit 4.03 to <strong>Biomet</strong>, Inc. Form S-8 RegistrationStatement, File No. 33-65700).10.3 401(k) Profit Sharing Plan filed January 19,1996. (Incorporated by reference to Form S-8 RegistrationStatement, File No. 333-00331).10.4 <strong>Biomet</strong>, Inc. 1998 Qualified and Non-Qualified Stock Option Plan adopted August 3, 1998. (Incorporatedby reference to Exhibit 10.6 to <strong>Biomet</strong>, Inc. Form 10-K <strong>Report</strong> for year ended May 31, 1998, File No.0-12515).10.5 Joint Venture Agreement between <strong>Biomet</strong>, Inc. and Merck KGaA dated as of November 24, 1997(Incorporated by reference to Exhibit 2.01 to <strong>Biomet</strong>, Inc. Form 8-K Current <strong>Report</strong> dated February 17,1998, File No. 0-12515).10.6 Purchase and Substitution Agreement dated March 19, 2004 by and among Merck KGaA, <strong>Biomet</strong>, Inc.,BioHoldings UK Ltd. and <strong>Biomet</strong> Europe Ltd. (Incorporated by reference to Exhibit 10.1 to <strong>Biomet</strong>, Inc.Form 8-K current <strong>Report</strong> dated March 19, 2004, File No. 0-12515).10.7 Agreement and Plan of Merger dated March 7, 2004 among <strong>Biomet</strong>, Inc., Laker Acquisition Corp. I andInterpore International, Inc. (Incorporated by reference to Exhibit 1 to <strong>Biomet</strong>, Inc. Form SC 13D GeneralStatement of Acquisition of Beneficial Ownership dated March 17, 2004, File No. 0-12515).56
10.8 Credit Agreement dated as of June 18, 2004, by and among <strong>Biomet</strong>, Inc., Bank of America, N.A. andUBS Securities LLC (Incorporated by reference to Exhibit 10.1 to <strong>Biomet</strong>, Inc. Form 8-K Current<strong>Report</strong> dated June 18, 2004, File No. 0-12515).10.9 Letter dated April 25, <strong>2006</strong> to Bart J. Doedens, M.D. describing compensation and relocation benefits.*(11) No exhibit.(12) No exhibit.(13) No exhibit.(14) No exhibit.(16) No exhibit.(18) No exhibit.(21) 21.1 Subsidiaries of the Registrant.*(22) No exhibit.(23) 23.1 Consent of Independent Registered Public Accounting Firm.*(24) No exhibit.(31) 31.1 Certification of Chief Executive Officer Pursuant to Section 302 of the Sarbanes-Oxley Act of 2002.*31.2 Certification of Chief Financial Officer Pursuant to Section 302 of the Sarbanes-Oxley Act of 2002.*(32) 32.1 Written Statement of Chief Executive Officer and Chief Financial Officer Pursuant to Section 906 of theSarbanes-Oxley Act of 2002.**Filed herewith
Board ofDirectorsNiles L. NoblittChairman of the BoardDaniel P. HannInterim Presidentand Chief Executive OfficerJerry L. FergusonVice Chairman of the BoardC. Scott Harrison, M.D.Lead DirectorOrthopedic Surgeonand Co-Founder,Chief Executive Officerand Chairman ofCURE International(non-profit organization)M. Ray HarroffPresident, StonehengeLinks Village Development(real estate development)Thomas F. Kearns, Jr.Retired Partner,Bear, Stearns & Co., Inc.(investment banking)Sandra A. LambPresidentand Chief Executive Officer,Lamb Advisors LLC(management consultingservices)Dane A. Miller, Ph.D.Retired Presidentand Chief Executive OfficerJerry L. MillerPresident, Havirco, Inc.(private investmentmanagement)Kenneth V. MillerVice President, Havirco, Inc.(private investmentmanagement)Charles E. NiemierSenior Vice President,<strong>Biomet</strong>, Inc.President,EBI, l.p., <strong>Biomet</strong> Spineand <strong>Biomet</strong> TraumaMarilyn Tucker QuaylePresident, BTC, Inc.(private holding company)L. Gene TannerVice Chairman of the Board,NatCity Investments, Inc.(investment banking)PrincipalOfficersDaniel P. HannInterim Presidentand Chief Executive Officer,<strong>Biomet</strong>, Inc.Garry L. EnglandChief Operating Officer –Domestic Operations,<strong>Biomet</strong>, Inc.Charles E. NiemierSenior Vice President,<strong>Biomet</strong>, Inc.President,EBI, l.p., <strong>Biomet</strong> Spineand <strong>Biomet</strong> TraumaGregory D. HartmanSenior Vice President –Finance, Chief Financial Officerand Treasurer,<strong>Biomet</strong>, Inc.Roger P. van BroeckPresident –International Operations,<strong>Biomet</strong>, Inc.Steven F. SchiessPresident,Implant Innovations, Inc.Bradley J. TandyVice President,Acting General Counseland Secretary and CorporateCompliance Officer,<strong>Biomet</strong>, Inc.Thomas R. AllenPresident,<strong>Biomet</strong> International Ltd.Richard J. BorrorChief Information Officerand Corporate Vice President –Manufacturing,<strong>Biomet</strong>, Inc.Greg W. SassoSenior Vice President –Corporate Developmentand Communications,<strong>Biomet</strong>, Inc.Darlene K. WhaleySenior Vice President –Human Resources,<strong>Biomet</strong>, Inc.William C. KolterPresident,<strong>Biomet</strong> Orthopedics, Inc.Robert E. DurginCorporate Vice President –Global Regulatory Affairs,<strong>Biomet</strong>, Inc.Lance D. PerryCorporate Vice President –Global Product Development,Reconstructive Devices,<strong>Biomet</strong>, Inc.Daniel E. WilliamsonCorporate Vice President –Global Biologicsand Biomaterials Development,<strong>Biomet</strong>, Inc.David A. Nolan, Jr.President,Arthrotek, Inc.Stuart G. KleopferPresident,<strong>Biomet</strong> Biologics, Inc.David JoszaPresident,Walter Lorenz Surgical, Inc.CorporateHeadquarters<strong>Biomet</strong>, Inc.56 East Bell DriveP.O. Box 587Warsaw, Indiana 46581-0587Phone 574.267.6639Fax 574.267.8137www.biomet.comPrincipalSubsidiariesArthrotek, Inc.56 East Bell DriveP.O. Box 587Warsaw, Indiana 46581-0587Phone 574.267.6639Fax 574.372.1718www.arthrotek.com<strong>Biomet</strong> Biologics, Inc.56 East Bell DriveP.O. Box 587Warsaw, IN 46581-0587Phone 574.267.6639Fax 574.371.1187www.bmetbiologics.com<strong>Biomet</strong> Europe B.V.Toermalijnring 6003316 LC DordrechtP.O. Box 30553301 DB DordrechtThe NetherlandsPhone 31.78.629.29.19Fax 31.78.629.29.41www.biometeurope.com<strong>Biomet</strong> Orthopedics, Inc.56 East Bell DriveP.O. Box 587Warsaw, Indiana 46581-0587Phone 574.267.6639Fax 574.267.8137www.biomet.comEBI, l.p., <strong>Biomet</strong> Spineand <strong>Biomet</strong> Trauma100 Interpace ParkwayP.O. Box 346Parsippany, NJ 07054-0346Phone 973.299.9300Fax 973.541.9132www.ebimedical.comImplant Innovations, Inc. (3i)4555 Riverside DrivePalm Beach Gardens,FL 33410Phone 561.776.6700Fax 561.776.6762www.3i-online.comWalter Lorenz Surgical, Inc.1520 Tradeport DriveJacksonville, FL 32218Phone 904.741.4400Fax 904.741.4500www.lorenzsurgical.comForward-LookingStatementsThis report contains statementsthat are forward-looking andactual results could differ materially.Factors that could cause thisdifference are set forth in Item 1Aof the <strong>Annual</strong> <strong>Report</strong> on Form 10-Kincluded herein.Unless otherwise noted, all trademarksare owned by <strong>Biomet</strong>, Inc. or one of itsaffiliates/subsidiaries.Merck KGaA, Darmstadt, Germany,is not affiliated with Merck & Co., Inc.,Whitehouse Station, New Jersey.