CR&S Report 2009 - Stockland
CR&S Report 2009 - Stockland
CR&S Report 2009 - Stockland

Create successful ePaper yourself
Turn your PDF publications into a flip-book with our unique Google optimized e-Paper software.
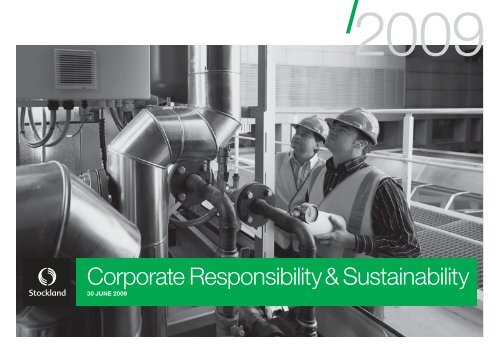
<strong>2009</strong>Corporate Responsibility & Sustainability30 JUNE <strong>2009</strong>
<strong>Stockland</strong> Corporate Responsibility & Sustainability <strong>Report</strong> <strong>2009</strong>MESSAGE FROM OURCR&S COMMITTEEOUR CR&S BOARDCOMMITTEEASSISTS THEBOARD TO OVERSEESTOCKLAND’SCOMMITMENTTO OPERATE ITSBUSINESS ETHICALLY,RESPONSIBLY AND INA SUSTAINABLE WAYLeft to right: Graham Bradley,Matthew Quinn, Nick Greiner,Barry Neil.We are pleased to present <strong>Stockland</strong>’s <strong>2009</strong> Corporate Responsibilityand Sustainability <strong>Report</strong>.This is the fourth year we have produceda Sustainability <strong>Report</strong>, which, togetherwith our Financial <strong>Report</strong> <strong>2009</strong> andShareholder Review <strong>2009</strong>, providesinformation on our environmental, socialand financial performance for the yearending 30 June <strong>2009</strong>.Challenging market conditionsThere is no doubt that the past year hasbeen exceptionally challenging for <strong>Stockland</strong>.The global financial crisis caused a sharpdownturn in the Real Estate Investment Trustsector around the world. This in turn createdchallenges for our business.In response, we adjusted our operations andstreamlined our organisation. For example,our Residential business responded quicklyto changing property market conditions bydeveloping more affordable housing optionsfor purchasers.In our Commercial Property businesswe repositioned our office and retailportfolios with the sale of non-core assetsand maintained our focus on long-termrelationships with our tenants. Our consistentcommitment to being a responsible andethical property owner, manager and lessorhas helped us maintain high occupancy ratesin our office, retail and industrial properties.We see the retirement living sector as akey opportunity for growth and as suchhave established Retirement Living as aseparate business unit. This change willenable us to focus on the specialised natureof retirement living properties and the needsof our residents.In light of the changed market conditions,we have decided to embark on an orderlysale of our UK assets over the next twoto three years. In the meantime we willcomplete projects already underway.Through all of this our commitment tocorporate sustainability has not wavered.We have continued to strive for balancedenvironmental, social and economicoutcomes. This approach was recognisedwith our inclusion once again in the DowJones Sustainability Index World (DJSI World),an index which tracks the performance ofglobal sustainability leaders.Our evolving sustainability strategyThis year we continued to refine our approachto sustainability. We have sought feedbackfrom both internal and external stakeholdersto better understand their expectations andviews on our performance. This ongoingprocess will help us focus on priority areasand respond earlier and more effectivelyto emerging issues and concerns.Part of our business involves developingsites that shape and create communities.2<strong>Stockland</strong> Corporate Responsibility & Sustainability <strong>Report</strong> 30 June <strong>2009</strong>
Recognising the significance of this, weproduced community development guidelinesthat set out how we will engage with the widercommunity at each of our developments toensure the best outcomes for both currentand future residents. Our aim is to createstructures and communities that will endurelong after our development work is complete.A key challenge for us is to achieve aconsistent approach to stakeholderengagement across all parts of our business.We are making continuous improvementsin this area but understand that embeddingsustainable practices is not a simple process.Our peopleWe are proud that at this difficult time wehave continued to achieve high employeeengagement. This reflects our internalculture, which has enabled us to maintainan engaged and loyal workforce despitethe need to downsize and make substantialstructural changes to our business.Employee engagement remained above80 per cent, a score that put us above theGlobal High Performing Companies Norm, forthe fifth year running. While this is a pleasingresult we still have work to do to reduce ourregretted employee turnover further.Our annual employee survey confirmedthat our commitment to sustainabilitycontributed to our high level of employeeengagement. Our employees are proud ofour social contributions and many employeesdemonstrated this through their ownefforts, with 24 per cent of our employeesvolunteering to mentor students from28 priority-funded schools in Australiain the past year.Climate changeClimate change has remained high onthe Australian Government’s agenda.We continue to promote the merits ofmechanisms to encourage energy efficiencysuch as ‘green’ depreciation for eco-efficientrefits of existing commercial buildings, andthe need to streamline energy and carbonreporting requirements.For us, climate change managementis about mitigating risks. Our ClimateChange Action Plan provides us with acomprehensive plan to minimise our carbonemissions. We are also undertaking researchto better understand the potential physicalimpacts of climate change on our propertiesand communities.These risks also present opportunities.Examining these issues will enable us todevelop a more strategic view which willinform how we own, manage and developresilient buildings and communities whichare able to adapt to the future effects ofclimate change. In recognition of our effortsin this area we were listed in the AustralianClimate Leadership Index in 2008 which ratescompanies with advanced climate changestrategies and disclosures.We have continued to refine the quality of ouremissions reporting system in preparationfor our first report under the NationalGreenhouse and Energy <strong>Report</strong>ing Act 2007(NGERA) which will be submitted in October<strong>2009</strong>. In addition, we actively participate inraising the standards and capability of theproperty industry as a whole. For example,we have actively worked with our peers inproperty to understand what NGERA meansfor our industry.Eco-efficiencyWe also address climate change risk byminimising the environmental impacts ofour properties and projects and raising theenvironmental performance of our entireportfolio. For our existing buildings we usethe National Australian Built EnvironmentalRating System (NABERS), a performancebasedratings system for environmentalperformance. In the 2008 calendar year weattained an average NABERS Energy rating of3.4 Stars. While we fell short of our target of3.5 Stars, we made a significant improvementon our 2007 average of 2.9 Stars.We have continued to reduce ourconsumption of electricity. Our retail centreportfolio achieved a 7 per cent reductionin absolute electricity use, surpassing ourtarget of 5 per cent.While this is in part due to the sale of someassets, we have also continued to improveenergy efficiency. Our greenhouse gasemission intensities (GHG per m 2 ) werereduced by 3 per cent for retail centresand 8 per cent for office buildings over thepast year.We have also achieved two 6 Star Green Starratings (classified as ‘World Leadership’) fromthe Green Building Council of Australia. Ourhead office in Sydney was the first projectin Australia to achieve a 6 Star Green StarOffice Interiors v1.1 rating for sustainableoffice interiors. Our office development at2 Victoria Avenue in Perth also received a6 Star Green Star Office Design v2 rating.Our best practice aspirationIn 2010, we will maintain our momentumin corporate sustainability by focusingon achieving high quality managementof economic, social and environmentalperformance. Responding to the interestsof our customers and local communities. Wewill continue to develop and manage propertyassets of long-term value to our customers,tenants, investors and business partners.GRAHAM BRADLEYChairmanNICK GREINERChair of CR&S Board CommitteeBARRY NEILNon-Executive DirectorMATTHEW QUINNManaging DirectorCR&S BOARDCOMMITTEE ANDLEADERSHIPTEAMGraham Bradley (Chairman);Nick Greiner (Chair of CR&S Board Committee),Barry Neil (Non-Executive Director)Matthew Quinn (Managing Director);Karyn Munsie (Executive General Manager,Corporate Affairs);Siobhan Toohill (General Manager,Corporate Responsibility and Sustainability),Cliff Bromiley (General Manager, Health,Safety and Environment).<strong>Stockland</strong> Corporate Responsibility & Sustainability <strong>Report</strong> 30 June <strong>2009</strong> 3
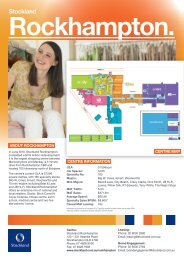
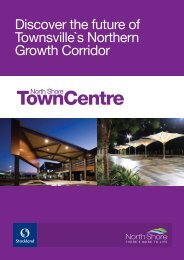
ContentsMessage from our CR&S Committee 2About <strong>Stockland</strong> 4Value chain 6Key financial results 7Governance and risk management 8Government relations 8Our CR&S approach 10FY09 highlights 11Memberships and awards 11CR&S strategy 13About this report 14Stakeholder engagement 15Commercial Property 17Residential and Retirement Living 18<strong>Stockland</strong> UK 20Responsible investment performance summary 21Valuing our people 22Employee engagement 24Capability development 27Embedding sustainability 28Employee health and safety 29Employee profile 31Our customers and suppliers 32Responding to our customers 35– Commercial Property 35– Residential 36– Retirement Living 37Engaging with our suppliers 37Community 38Community development 40Community involvement 42Climate change and energy 44Understanding climate change 46Regulation 48Energy efficiency in existing buildings 50Energy efficiency in new buildings 52Energy Metrics 53Natural resources 58Biodiversity 60Water 62NABERS Office Energy and Water ratings 65Waste 67Global <strong>Report</strong>ing Initiative (GRI) Index 68Independent Assurance Statement 76<strong>Stockland</strong> contactsback cover<strong>Stockland</strong> Corporate Responsibility & Sustainability <strong>Report</strong> <strong>2009</strong>ABOUT STOCKLAND<strong>Stockland</strong> is one of Australia’s most diversified property groups with total assetsof over $8.7 billion and operations in Australia and the United Kingdom.6 754213WHERE WE OPERATE1 Sydney, Australia2 Melbourne, Australia3 Brisbane, Australia4 Perth, Australia5 London, UK6 Glasgow, UK7 Edinburgh, UK4<strong>Stockland</strong> Corporate Responsibility & Sustainability <strong>Report</strong> 30 June <strong>2009</strong>
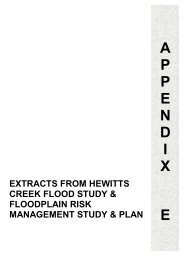
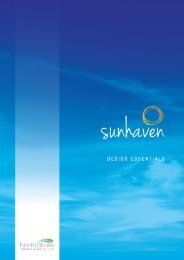
BUSINESS BY GEOGRAPHYBUSINESS BY ASSETNSW 46%ACT 2%QLD 23%VIC 18%WA 7%SA 1%UK 3%Office 26%Industrial 11%Retail 37%Retirement Living 4%Apartments 5%Communities 17%ABOUT STOCKLAND<strong>Stockland</strong> is one of Australia’s most diversifiedproperty groups with total assets of over$8.7 billion and operations in Australia and theUnited Kingdom. We are a top 50 AustralianSecurities Exchange Listed Company (ASX:SGP).Founded in 1952, we have grown to becomeone of Australia’s leading diversified propertygroups – developing and managing a largeportfolio of residential community, apartment,retirement living, retail, office and industrialassets.COMMERCIAL PROPERTYRetailWe have 39 retail centres valued at$3.9 billion that provide diverse shoppingand social experiences for customersand other stakeholders.OfficeWe have an office portfolio of 33 propertiesvalued at $2.8 billion. Our track record ofhigh portfolio occupancy levels, solid tenantretention and leasing results demonstratethe benefit of our commitment to strongtenant relationships. Our tenants includegovernment departments and blue chippublic and private companies.IndustrialOur industrial portfolio is valued at $1.1 billion,with 23 properties, incorporating well overone million square metres of building area.Our tenants include large-scale distribution,warehousing and logistics companies. Ourproperties are strategically positioned forlogistics, infrastructure and employment.RESIDENTIALResidential CommunitiesWe have 67 projects in New South Wales,Victoria, Queensland and Western Australiawith a total end value of approximately$15 billion. Our focus is on the creation ofmedium and large-scale masterplannedcommunities in key urban growth markets,ranging in size from 100 lots to 20,000 lots. Increating new communities we are involved inproviding infrastructure to meet local needs.ApartmentsWe acquire, design, project manage andmarket apartment and mixed-use projectsin urban locations. Our apartments businesshas responded to urban consolidationopportunities, providing accommodationoptions close to transport and employment.We have nine apartment projects with anestimated end value of $1.7 billion.Planning approvals are being soughtfor projects yet to commence, howeverdevelopment will only commence ifappropriate returns can be achieved.If not, sites will be sold in an orderlyfashion over the next two to three years.RETIREMENT LIVING*We have established our business asa top five retirement living operatorwithin Australia, with 3,974 establishedunits across Victoria and Queensland.Our portfolio also includes a short-tomediumterm development pipelineof over 2,900 units. The businessuses our land bank for futuredevelopments and draws on ourresidential development capabilities.STOCKLAND UKOur UK business is a propertydevelopment and asset managementcompany spanning retail, officeand mixed-use property. We haveannounced an orderly withdrawalfrom the UK market, selling assetsover the next two to three years.STOCKLAND GROUP STRATEGYFoster an engagedculture that attractsand retains highperforming peopleAchieve bestpracticeoperationalefficiencyOur enduring strategic themesManage a coreportfolio ofhigh qualityproperty assetsOur vision:To create aworld classdiversifiedproperty groupOptimise sourcesof capitalInvest in profitableand complementarygrowth-focusedinitiativesActive managementof asset classand geographicdiversity tooptimise value* Retirement Living, formally part of ourResidential business, became a separatebusiness from 1 July <strong>2009</strong>.<strong>Stockland</strong> Corporate Responsibility & Sustainability <strong>Report</strong> 30 June <strong>2009</strong> 5
ABOUT STOCKLANDVALUE CHAINWe operate across most parts of theproperty value chain. We own, manageand develop property. However, weengage others to carry out buildingworks and to provide services suchas security and cleaning.Our primary areas of direct activity:OwnerWe own shopping centres, office buildings,industrial sites and retirement villages.We manage the acquisition process andare responsible for protecting and enhancingthe value of the asset over time. As abuilding owner, we have the capacity tomake investment decisions that influencethe performance of these assets.Asset and property managerWe also manage shopping centres, officebuildings and industrial sites. We manage thelarge majority of the assets we own, and thoseassets that are held in our unlisted propertyfunds. This gives us significant influence overthe performance of these assets.DeveloperWe are developing over 60 projectsnationally, including residential communities,and new and substantially refurbishedretail, office and industrial projects. As adeveloper, we have significant capacity toshape environmental and social outcomes.However, our capacity to direct supply chaindecisions, such as the selection of buildingmaterials, suppliers and construction wastemanagement service providers, can belimited in some instances as we rarely actas the principal contractor (builder).For the purposes of reporting energy andgreenhouse gas emissions under the FederalGovernment’s National Greenhouse andEnergy <strong>Report</strong>ing Act we are consideredto have operational control of our residentialdevelopments. We have commencedreporting on the energy and greenhousegas emissions from those sites in this report.VALUE CHAIN – STOCKLAND ACTIVITIESRetirementLivingResidentialCommunitiesCommercialPropertyUpstreamProductsBuilding materials(e.g Boral)Building technologies(e.g grey waterrecycling)Off-balancesheetOn-balancesheetCoordinated by <strong>Stockland</strong> or sometimesundertaken by <strong>Stockland</strong>.Currently undertaken by <strong>Stockland</strong>.Funding Acquisition DesignNot currently undertaken by <strong>Stockland</strong>.MasterplanningDetailed designDetaileddesign bydesignconsultantsApprovalsProjectManagementProcurementand contractingConstructionCompletionand handoverBuildingand constructionby contractorsLeasingand SalesLeasingSalesSales bycommercialagentAsset andPropertyManagementAssetmanagementPropertymanagementRefurbishment/RedevelopmentDownstreamProductsDownstream services are associatedwith the ongoing operation ofproperties but go beyond our existingproperty and asset managementactivities.They include:Our areas of influence:Fund managerWe act as an unlisted property fundmanager for a number of retail and officeassets, and a small number of residentialsites. Typically, the fund manager has somescope to influence social and environmentalperformance through directing theproperty manager. We are able to exercisea reasonable level of control over theenvironmental performance of these assetsas we are generally both the fund managerand the property and asset manager.DesignOur involvement in the design processis largely limited to design management.Generally, we engage design consultantssuch as planners, architects andengineers to provide detailed solutions anddocumentation. In setting project briefsand managing the design process throughdesign and development managers, wecan greatly influence design solutionsfor communities and buildings, and theirsocial and environmental impact.6<strong>Stockland</strong> Corporate Responsibility & Sustainability <strong>Report</strong> 30 June <strong>2009</strong>
Builder (principal contractor)We generally do not take on the role ofbuilder. We engage contractors whoare equipped to deliver this service andmanage the associated risks. Throughour development and project managers,however, we have the opportunity todefine and clearly set expectations withour builders, particularly in terms of labourconditions for construction workers,including health and safety, as well asenvironmental management.Commercial office leasingCommercial leasing is undertaken bycontractors. We have reduced opportunityto influence our prospective tenants’perception of the value of energy efficiencyand high environmental performance.Upstream products, includingbuilding materialsMany upstream products such as buildingmaterials are generally selected by ourbuilders. This can limit our ability to directthe selection of environmentally and sociallyappropriate materials. We can guide theperformance attributes of building materialsby setting clear briefs and highlightingthe value we place on environmentalperformance. Our commitment to the useof Green Star rating tools aids this influence.Downstream services, includingcleaning and securityWe have increasingly recognised ourcapacity to influence the sustainabilityperformance of our service providers,such as cleaning and security providers.In particular, we have made clear ourexpectations to our service contractors thattheir workers have fair working conditions.FINANCIAL PERFORMANCEFor complete discussion of our financialperformance over the past year, pleasesee our Shareholder Review <strong>2009</strong> andFinancial <strong>Report</strong> <strong>2009</strong>.KEY FINANCIAL RESULTSUnderlying profitFY09FY08FY07FY06FY05Earnings per securityFY09 38.8cFY08 46.2cFY0744.0cFY0641.5cFY0539.1cDividend and distribution per securityFY09 34.0cFY08 46.5cFY0744.3cFY0641.4cFY0538.9cBalance sheetWEIGHTEDAVERAGEDEBTMATURITY6.6 YEARS8007006005004003002001000175ResidentialGEARING16%Composition of underlying profit ($m)43RetirementLiving$631.4m$674.0m$611.0m$553.7m$502.7m541CommercialPropertySTATUTORYLOSS$1,801.9MThe fall in our underlying earnings per security reflects adrop in underlying profit as well as dilution from the equitywe issued. (In our statutory accounts we have reportedunderlying earnings per security of 36.5 cents – adjusting thenumber of securities in accordance with the requirements ofaccounting standards following the recent equity raising.)Following a Board review, in April we announced that wehave adopted a more conservative distribution policy. From2010, <strong>Stockland</strong> will distribute the greater of our trust taxableincome or 80 per cent of our adjusted funds from operations.Our balance sheet is strong with conservative gearing of16 per cent, measured as the ratio of net debt (total debtless cash) to total tangible assets. We have $1.2 billion cashon deposit and $1.3 billion available undrawn committeddebt facilities.(1)UK(54)Net unallocatedcorporate costsUnderlying profit is our preferred measure ofperformance as it reflects the profit we achievethrough our daily business operations. Our statutoryresult takes into account inventory impairments, fairvalue changes of our investment properties and othersignificant items set out fully in the Directors’ <strong>Report</strong>.(74)Net interestexpense1Tax631UnderlyingprofitThis graph demonstrates how each of our operating businesses contributed to our underlying profit. More detailsabout the performance of each of our operating businesses can be found in our Shareholder Review <strong>2009</strong>.<strong>Stockland</strong> Corporate Responsibility & Sustainability <strong>Report</strong> 30 June <strong>2009</strong> 7
ABOUT STOCKLANDWhile risks can be managed through theintroduction of policies, procedures and workpractices, we have taken the view that themost effective long-term method is throughthe creation of a risk-aware culture.Our product responsibility commitmentsare included in the following policies andprocedures:We are interested in working withorganisations that demonstrate acommitment to products responsibilityvia our Sustainable Supply Chain policy.See the ‘Engaging our suppliers’ sectionof this report (page 37).The Board Audit and Risk Committeereceives regular updates from managementand relevant external parties on the statusof risks. At the time of our equity raising inMay <strong>2009</strong> we disclosed key risks to potentialinvestors including:and UK market,issues and changes in law,For further discussion of our approachto risk management please refer to ourFinancial <strong>Report</strong> <strong>2009</strong>.The non-financial risks identified throughoutthe year are discussed in this report.GOVERNANCE AND RISKMANAGEMENTThe Board takes its governanceresponsibilities seriously and believes ithas the necessary mix of experienceand skills to oversee the high standardof corporate governance, integrity andaccountability required of a professionaland ethical organisation. For more detail,including compliance with the ASXCorporate Governance Council bestpractice recommendations, please referto our Financial <strong>Report</strong> <strong>2009</strong>.Many of our policies and charters for BoardCommittees can be found on our website.Over the past year we have reviewed andrefined our Board Committee Charters andCode of Conduct and Ethical Behaviour.As a commercial enterprise we make manybusiness decisions that entail a degreeof risk. We recognise the importance ofmanaging risk associated with our businessactivities in a manner that enables us to:cause loss,laws and regulations,Risk management is about continuouslyidentifying, evaluating, treating andmonitoring exposures.GOVERNMENT RELATIONSAs regulations have a substantial impact onour business, we proactively engage withgovernment and regulatory authorities.In July 2008 our Board implemented a zeropolitical donations policy. We do not makedonations to political parties or politiciansat any level of government. In adopting thispolicy we seek to remove any basis for doubtthat any government approvals we obtain arebased strictly and solely on the merits of ourprojects. There have been no breaches ofthis policy.We monitor legislative and regulatorychange directly through our businessesand the Corporate Affairs team, as wellas via key industry bodies. The PropertyCouncil of Australia (PCA), Green BuildingCouncil of Australia (GBCA) and ShoppingCentre Council of Australia are our primaryrepresentative bodies at both federal andstate levels. During 2008 we substantiallyincreased the frequency of our direct politicalengagement on important public policyissues.The most significant legislation affectingour business this year was the AustralianGovernment’s First Home Owners’ Boost(FHOB). The FHOB was part of the suiteof stimulatory measures introduced in late2008 to protect jobs and buttress economicactivity. The benefit to our business wassubstantial. The proportion of first homebuyers increased from 25 per cent of ourcustomer base to 65 per cent during theearly part of <strong>2009</strong>. We recognised, howeverthat this measure is best suited to distressedeconomic conditions and accordingly wesupported the tapered extension of the boostto December <strong>2009</strong>. In so doing, we alignedclosely with our industry bodies, peers andsuppliers.We made many submissions to governmentover the past year on matters such asplanning, taxation and environmentalregulation.Our regulators recognise the importantrole that our sector can play in reducingAustralia’s greenhouse gas emissionsthrough improving energy efficiencyof buildings. In addition, the FederalGovernment has continued to design anemissions trading system, referred to asthe Carbon Pollution Reduction Scheme,supported by rigorous national carbondata. As a consequence, our sectorhas encountered increasing regulatoryrequirements.Areas of strengthening regulation include:change,requirements.In general, regulation related to sustainabilityperformance has become increasinglycomplex with different layers of governmentseeking to take action. Through the PCA andGBCA we have advocated the harmonisingof reporting and regulatory requirements.Details on these regulations can be found onthe regulation page in the ‘Climate Changeand Energy’ section of this report(page 44 – 57).8<strong>Stockland</strong> Corporate Responsibility & Sustainability <strong>Report</strong> 30 June <strong>2009</strong>
About <strong>Stockland</strong> – Progress and prioritiesOVERALL PERFORMANCE SUMMARYPastLast year, we said we would:PresentThis past year, we have:FutureIn the coming year, our prioritiesare to:<strong>Stockland</strong> Corporate Responsibility & Sustainability <strong>Report</strong> 30 June <strong>2009</strong> 9
ContentsOUR CR&SAPPROACHOur CR&S approach 10FY09 highlights 11Memberships and awards 11CR&S strategy 13About this report 14Stakeholder engagement 15Commercial Property 17Residential and Retirement Living 18<strong>Stockland</strong> UK 20Responsible investment performance summary 21Doing the right thing as aproperty owner, manager anddeveloper is about dealing withrisk, seeking opportunities andcreating long-term value for ourinvestors. It is about balancing theneeds and interests of ourstakeholders.10<strong>Stockland</strong> Corporate Responsibility & Sustainability <strong>Report</strong> 30 June <strong>2009</strong>
FY09 HighlightsOUR HIGHLIGHTS IN FY09 INCLUDE:Dow Jones Sustainability Index World.The Index represents the top 10 per centof the leading companies globally, with fourproperty companies awarded ‘Gold’ status.We are also included in the FTSE4GoodIndex which recognises organisations thatapply and demonstrate outcomes againstenvironmental, social and governanceprinciples,Index in 2008 which rates companies withadvanced strategies on climate change,Avenue, Perth, attained their final GreenStar accreditation with both achieving6 Stars (‘World Leadership’),plans and employee CR&S objectives.MEMBERSHIPS AND AWARDSMembershipsAs a member of industry groups we canassist in promoting sustainability practicesin the property sector. Our contributionincludes membership of committees,steering research projects, speaking atconferences and participating in forums.Our memberships include:Network– Chair– Operational Taskforce representation:NSW, QLD, VIC, WA.– Director– Technical Steering Committee– Industrial Technical Working Group– Residential Multi-unit TechnicalWorking Group.– National Roundtable on Sustainability– NSW Sustainability Committee.Investment.Sustainability indexesWe are listed on the following indexes:Sustainability Index World (DJSI World),2008-9.Management) Sustainability Index(AuSSI), <strong>2009</strong>.Leadership Index, Carbon DisclosureProject 6, 2008-9.Awards:– NSW Australian Institute of Architects,Milo Dunphy Award for SustainableArchitecture, 2008.– Orgatec ‘Best Office’ Award, Cologne,Germany, 2008.– Australian Property Institute Award forEnvironmental Development, 2008.– BPN Environ Sustainability Award for OfficeFitout, 2008.– Finalist, Built Environment Category,Banksia Awards, <strong>2009</strong>.– 6 Star Green Star Office Interiors v1.1,Green Building Council, 2008.: 6 Star Green Star OfficeDesign v2, Green Building Council, <strong>2009</strong>.: <strong>2009</strong> FacilityManagement Association’s Award to <strong>Stockland</strong> FacilityManager Mike Hardy for Environmental Achievement.: Redland City CouncilBusiness Water Conservation Award, June <strong>2009</strong>.Association GreenSmart Award, DevelopmentDesign Concept of the Year, 2008.:– UDIA National Awards for Excellence,Residential Development, <strong>2009</strong>– UDIA WA Awards for Excellence, ResidentialDevelopment 150 lots or more, 2008– UDIA WA Awards for Excellence, MediumDensity, 2008.: UDIA WAAwards for Excellence, Environmental Excellence.:Shoalhaven Building Design Awards, 2008.:NSW UDIA Awards for Excellence, MasterplannedDevelopment, 2008.: NSW UDIAAwards for Excellence - Commendation,Medium Density Housing, 2008.: National Associationof Women in Construction, WorkplaceTeam Innovation Award, 2008.<strong>Report</strong>: Best <strong>Report</strong> in the Property Sector, ACCAAustralia and New Zealand Sustainability <strong>Report</strong>ingAwards, <strong>2009</strong>.MEMBERSHIPSAWARDSBest <strong>Report</strong> in theProperty Sector ACCAAustralia and New ZealandSustainability <strong>Report</strong>ing Awards.<strong>Stockland</strong> Corporate Responsibility & Sustainability <strong>Report</strong> 30 June <strong>2009</strong> 11
OUR CR&SAPPROACHOUR APPROACH TO CR&SDoing the right thing as a property owner,manager and developer is about dealingwith risk, seeking opportunities and creatinglong-term value for our investors. It is aboutbalancing the needs and interests of ourstakeholders.Over the past year we have refined ourapproach to CR&S. Our strategy for thepast year included:specifically our people, suppliers, partners,investors, customers and regulators in themarketplace; and the wider community,we operate, including identifying andresponding to the risks and opportunitiesassociated with climate change.CR&S GOVERNANCECR&S Board CommitteeOur CR&S Board Committee assists theBoard to oversee <strong>Stockland</strong>’s commitmentto operate its business ethically, responsiblyand in a sustainable way. The Committeemet five times during FY09.The following Directors were members of theCommittee at the close of the financial year:Mr N Greiner (Chair) – Non-ExecutiveDirector,Mr G Bradley – Non-Executive Director,Mr B Neil – Non-Executive Director,Mr M Quinn – Managing Director.<strong>Report</strong>ingA monthly report on CR&S is submittedto the Executive Committee and the Board.Additionally, all stakeholder issues arereported at Board and ExecutiveCommittee level.CR&S Employee CommitteeOur CR&S Employee Committee was formedin 2004 and meets monthly to track progressagainst the CR&S strategy. The Committeeis chaired by the general manager ofCR&S and its current members include ournational sustainability managers, as wellas representatives working in governmentrelations, stakeholder engagement, health,safety and environment, and humanresources.OVERALL CR&S STRATEGYand toolsStakeholderengagementEffective workingrelationships withour investors,customers,suppliers andgovernmentSpecific FY10 CR&S focus areasReducing ourimpact onthe environmentEnduring CR&S themesIdentifying,understandingand engagingwith ourstakeholdersOurCR&SStrategyEnergylimate changeNaturalresourcesEngaging withour peopleCommunityinvolvementCommunitydevelopmentStrengtheningour placein thecommunityDiversitySafety12<strong>Stockland</strong> Corporate Responsibility & Sustainability <strong>Report</strong> 30 June <strong>2009</strong>
CR&S STRATEGYWe revised our CR&S strategy in April <strong>2009</strong>to better align with our reporting year and toinform the commitments set out in this report.We also reflected on how to best address theamended sustainability assurance standard,AA1000AS and more effectively encompassthe principles associated with the standard:stakeholders are,addressed the key issues of interestor concern,we have addressed these key issues.STOCKLAND GROUP STRATEGYOur enduring strategic themesManage a coreportfolio ofhigh qualityproperty assetsAn external stakeholder forum helpedinform our CR&S strategy-setting program.The forum provided feedback on ourperformance, as well as on emerging keyissues and expectations for the comingyear. This process also assisted us withdetermining our material CR&S issues for usto focus on for the coming year. We see FY10as a year of transition in our CR&S strategy,as we improve our systems to determinematerial CR&S issues as seen through theeyes of our stakeholders in line with theamended assurance statement.ENGAGING STAKEHOLDERS INDEVELOPING OUR CR&S STRATEGYOur CR&S strategy was then developedby our CR&S Employee Committee. Weexplored our key stakeholder groups andexamined their areas of concern and interest.We identified sources of stakeholder dataand feedback that we could use to form aclearer view of our stakeholders’ interests.This process helped us identify a numberof priority areas of focus (material themes)for FY10. These issues included:– stakeholder engagement,– employee wellbeing,– affordability of our products and services,– health and safety of our people andcontractors,– community development,– energy efficiency,– climate change,– natural resource management.Our strategy was refined by our sustainabilitymanagers, and reviewed and endorsedby our CR&S Board Committee in May<strong>2009</strong>. The strategy has provided the basisfor sustainability plans for our Residential,Commercial Property and UK businesses.Monthly CR&S Employee Committee meetingsprovide an opportunity to review progressagainst the strategy.Our goal is to review our performance fromboth our own and our stakeholders’ points ofview. We need time to improve our systems todo this successfully and recognise that FY10is a period of transition for our strategy as weincorporate stakeholder input into our systems.OUR MATERIALITY PROCESSCaptureInternal and external prioritiesEnduring CR&S themesInternal review/ISR captureUncover external views through engagement tools/surveysReview peers’ actions and commitmentsFoster an engagedculture that attractsand retains highperforming peopleOur vision:To create aworld classdiversifiedproperty groupInvest in profitableand complementarygrowth-focusedinitiativesFilter to prioritise material issuesQuantitative ranking and analysisRisk reviewPrioritised materiality registerAchieve bestpracticeoperationalefficiencyOptimise sourcesof capitalActive managementof asset classand geographicdiversity tooptimise valueCorporateRespond by strategy and actionsStrategy responding to prioritiesBusinessunitProjectSystems,processes andcommunicationPerformanceand reward<strong>Stockland</strong> Corporate Responsibility & Sustainability <strong>Report</strong> 30 June <strong>2009</strong> 13
OUR CR&SAPPROACHABOUT THIS REPORTThis is our fourth CR&S <strong>Report</strong> and coversour performance during our financial year,1 July 2008 to 30 June <strong>2009</strong> (FY09).It follows our Corporate Responsibilityand Sustainability <strong>Report</strong> 2008 whichcovered our previous financial yearended 30 June 2008 (FY08).This report explores how we see ourresponsibilities to our stakeholders and to theenvironment. It sets out our CR&S strategyand how we have performed against targetswe set in our FY08 report. We highlight ourachievements as well as share the ongoingand emerging challenges we face.Identifying important issuesIn line with our CR&S strategy we havereported on material issues that areconsidered important to us as a business,and our stakeholders. We took a two-stepapproach to identify these issues:Step 1) Information captureThis included examining:CR&S strategy workshop and a CR&Sreport review workshop, both involvingfeedback from internal and externalstakeholders,employee engagement research,feedback sessions and consumer research.Step 2) Prioritisation of issuesThis process prioritised issues based on:weighting applied to issues identified in ourCR&S workshop process and employeefeedback,CR&S <strong>Report</strong> Editorial Panel,providers.This led us to identify a number of materialthemes for the coming year:stakeholderengagement,Employee engagement and wellbeing,Embedding CR&S into business activities,Health and safety of our people andcontractors, Affordability of our products and services,particularly housing,Community development, Energy efficiency and our responseto climate change,natural resources, particularly waterand biodiversity.We developed our report in a highlycollaborative manner. Following extensivebriefings, over 40 employees contributeddata, case studies and discussion of ourperformance to an online wiki. The use of thisonline tool enabled a high level of participationin our report from across the organisation.Our CR&S team then reviewed andcoordinated the editing of the wiki content,prior to and during the assurance process.the report is specifically designed forthose seeking full documentation of ourperformance, for example, environmental,social, governance (ESG) analysts.online report and has been designed fora wide audience, enabling easy use andsearchability for matters of interest.forms part of our Shareholder Review<strong>2009</strong>, distributed to our securityholders.In previous years, we produced a CR&SSummary Review. As part of our strategyto integrate CR&S into the entire businesswe have consolidated this information intothe Shareholder Review <strong>2009</strong>.our suite of annual reports.We have chosen once again to submit ourreport to assurance, applying the revisedAA1000 Assurance Standard’s principles ofinclusivity, materiality and responsiveness.We have also reported against the Global<strong>Report</strong>ing Initiative (GRI), applying theindicators to application level B+. Ourresponse to GRI criteria varies in responseto our level of control as owner, manager,developer and/or fund manager of assets.We have also used GRI criteria to reporton our performance in the UK.This year we have also applied in part theProperty Council of Australia’s (PCA) DraftGuide to Corporate Responsibility <strong>Report</strong>ingin the Property Sector. This guide wasdeveloped as a means to identify propertysector-specific material indicators, buildingupon the GRI. Some of our employees wereinstrumental in developing this draft guide.We expect that the guide will be appliedby other property companies in Australialeading to a more consistent application ofmetrics. Longer-term this will allow for moreuseful benchmarking across the propertysector. We are aiming to report against thePCA guide more completely in our nextCR&S report.We have incorporated our UK operations intoour main report. All material is to be read asrelating to our Australian operations exceptwhere indicated. Greater detail on what thisreport covers for our respective businessunits can be found on the Residentialand Commercial Property pages. Datameasurement techniques and calculationsappear in this report as footnoteswhere relevant.14<strong>Stockland</strong> Corporate Responsibility & Sustainability <strong>Report</strong> 30 June <strong>2009</strong>
PRIORITYPROJECTS WITHA STAKEHOLDERPLANPROJECTS WITHA STAKEHOLDERPLANRESIDENTIAL100 % 22STAKEHOLDER ENGAGEMENTBalancing the needs of our stakeholders isfundamental to the success of our business.Stakeholder engagement informs ourcorporate strategy and the strategies forour operating businesses. We are workingto create a measurable and proactivestakeholder engagement framework intoour daily operations.Embedding a proactive approachto stakeholder engagementThis year we have reinforced our businessfocus on stakeholder engagement with theintroduction of a dedicated role within ourcorporate affairs team. Our stakeholderengagement manager works closely withour CR&S team and with business unitstakeholder engagement representativesto build a consistent, strategic frameworkand to balance stakeholder interestsacross our projects.We aim to embed our strategy in oureveryday operations so that our developmentand asset managers take ownership of theirrespective stakeholder engagement plans.We train our people on stakeholderengagement and issues management aspart of our employee orientation program andthrough business unit forums. Our strategicurban planning workshops provide specifictraining for our development managers onstakeholder priorities and concerns.In FY10, we will incorporate performancemeasures for development and assetmanagers on stakeholder engagementand issues management. The performanceobjectives of our executives will reflectthese priorities.OUR STAKEHOLDERSThe EnvironmentOur StakeholdersOuSuppliers & PartnersGovernmentOurPeopleCommunitysInvestorsCustomersSTAKEHOLDER ENGAGEMENT PERFORMANCE SUMMARYPastLast year, we said we would:PresentThis past year, we have:FutureIn the coming year, our prioritiesare to:We are working to incorporate a measurable and proactive stakeholderengagement framework into our daily operations.<strong>Stockland</strong> Corporate Responsibility & Sustainability <strong>Report</strong> 30 June <strong>2009</strong> 15
OUR CR&SAPPROACHOUR KEY STAKEHOLDERSEmployeesWe have 1,334 employees in Australiaand the United Kingdom.Each year we undertake the ‘Our Voice’survey to understand our level of employeeengagement. Our employee engagementscore remained high in FY09 at 82 per cent,as measured by Towers Perrin-ISR.Government and regulatorsFederal, state and local governmentsset the regulatory environment in whichwe operate. We engage regularly with alllevels of government in Western Australia,Queensland, New South Wales, Victoriaand the Australian Capital Territory directlyand through industry associations. Our keyindustry representative body is the PropertyCouncil of Australia and two aligned bodies,the Shopping Centre Council of Australiaand the Green Building Council of Australia.Our senior staff hold director-level leadershiproles in these bodies. We also work with theUrban Development Institute of Australia,the Australian Institute of Architects and thePlanning Institute of Australia.Shareholders and the investmentcommunityWe have over 45,000 shareholders inAustralia and overseas. We engage with ourcorporate investors via regular meetings withmanagement and briefings on our strategyand financial results. At our Annual GeneralMeeting, investors can engage with ourBoard of Directors and are updated onour performance and strategy.We recently undertook qualitative researchwith some of our retail shareholders tounderstand attitudes and preferences forcommunication channels. Over the pastyear we have enhanced access to onlineinvestor information.CustomersWe have a diverse range of customers,ranging from our commercial, retail andindustrial tenants and shoppers in our retailcentres to purchasers of our residentialproperties. We regularly seek feedback fromcustomers about their priorities throughsurveys and research, and we incorporatetheir feedback into our product design andservice offerings.SuppliersWe procure services and products from over7,000 suppliers. We established a program in2008 to commence aligning the performanceof our key suppliers with our CR&S values.Suppliers complete a CR&S questionnaireand a comprehensive health, safety andenvironment questionnaire as part of theirresponse to our tender requests.CommunitiesOur communities include those affectedby our residential, apartment and retirementliving developments, as well as thecommunities that visit our retail centres.Our engagement with communities includescommunity consultation forums, meetingswith community groups and local leaders,as well as surveys and research.MediaWe engage with journalists across a widespectrum of local, regional, metropolitan andnational print and electronic media outlets.Our corporate media strategy outlines ourapproach to dealing consistently with themedia. We aim to be responsive to requestsfor information about our business activities.ENGAGING WITH OUR STAKEHOLDERS:A CONSISTENT MEASURABLEFRAMEWORKOver the past year we have field tested ourstakeholder engagement template to ensurea consistent and strategic approach. We willbe implementing this template across ourprojects in FY10.This template will ensure that stakeholdersare listed in priority order and includes anengagement plan for each group that clearlyidentifies primary concerns throughout thestages of a project. The plans will addressthe particular social, political, economic andenvironmental concerns of the community.This will help to identify the potential risksand opportunities to our business on aproject by project basis.Our stakeholder engagement plans willbe active, ‘live’ documents and will beupdated regularly by our project teams.The outcomes of engagement activitieswill be communicated to key stakeholdersthrough newsletters to residents, stakeholdermeetings, website updates or site toursfor local community groups.FUTURE REGIONAL FOCUSThe diversity and geographic spread ofour business means that a consistent andcoordinated approach to our stakeholderinteractions can be a challenge. In responseto this, in FY10 we are piloting regionalstakeholder engagement plans for bothour Residential and Commercial Propertybusinesses in those geographies whereour business units collectively have asignificant presence.PRIORITY STAKEHOLDER PROJECTSIn our FY08 CR&S report, we said wewould put stakeholder plans in place forour largest and most complex projects.The priority stakeholder projects (PSP) listincludes both the largest projects and thosethat have the highest risk in terms of impacton stakeholders and potential impact onour reputation. The list takes into accountenvironmental issues, planning complexities,and community concerns.Projects on the PSP list are determined bythe senior leaders in our business and the listwill be closely assessed and updated everytwo months. It also incorporates a ‘watch list’for new and existing projects that may havelonger-term issues on the horizon.In line with the commitment we made inour FY08 CR&S report, we have put astakeholder engagement plan in place foreach of these priority stakeholder projects.Our Residential business has recentlyintroduced the first phase of a riskassessment program to identify the keycommercial, environmental and stakeholderrisks of each of our residential projects.This program informs our PSP list and willalso be updated on a two-monthly basis.A review of our residential projects identifiedthat 20 out of 76 projects have a stakeholderplan in place (this includes all ResidentialPSPs). In some cases these plans are notclearly documented or regularly updated.We are committed to improving our approachto stakeholder engagement and aim toensure that all our active Residential projectshave a rigorous stakeholder engagementplan in place by the end of FY10.Priority projects with a stakeholderengagement planFY09FY08 50%100%16<strong>Stockland</strong> Corporate Responsibility & Sustainability <strong>Report</strong> 30 June <strong>2009</strong>
OUR CR&S APPROACHCASE STUDY<strong>Stockland</strong> Glenrose – Working together on the plans for a new centreSTOCKLAND GLENROSE,BELROSE, NSWOur Glenrose shopping centre onSydney’s North Shore has beenthe focus of intense communityinterest since we first lodged aredevelopment proposal in 2006.Following community concernsabout the scale of our proposedredevelopment, Warringah Councilrequested that we resubmit planswith a smaller scheme.Environmental investigations atthe time of our proposal foundcontaminated groundwaterbeneath the centre, and theDepartment of Environment andClimate Change (DECC) wasadvised. The contaminationoriginated prior to our ownershipof the centre.A revised proposal was submittedto Warringah Council in September2007 which incorporated plans forremediation of the contaminatedgroundwater.We engaged with council officerson the key issues, but ourapplication was refused becauseof concerns from local residentsabout traffic issues, designelements and the scale of theredevelopment.Further environmental testingconducted in January <strong>2009</strong>determined that the extentof the contamination in thegroundwater was greater thanoriginally thought, and we notifiedretailers and the community thatthe majority of the centre wouldneed to be demolished to enableremediation works to take place.Responding to stakeholderfeedbackThe centre’s history ofunsuccessful redevelopmentapplications raised a degreeof community concern aboutour plans. Many stakeholdersquestioned the need to demolishall shops located within thecentre. Retailers and thecommunity had concerns aboutthe proposed timetable andquestioned our commitmentto developing a new shoppingcentre on the site to continue toservice the local area.In response to this feedback, andin consultation with the mayorand the State MP, we changedthe timetable to allow additionaltime for retailers and customersto prepare for the remediationworks. We also determined that anumber of retailers would be ableto continue trading during theremediation process, subjectto ongoing environmental analysisto ensure public safety.We acknowledge that earlierconsultation with our Glenrosestakeholders would havealleviated some of their concernsabout the remediation programand the plans for the site.Working together on the plansfor a new centreIn direct response to communityfeedback, the plans for a newshopping centre are anticipatedto be smaller than the schemespreviously proposed.We now have a formalstakeholder working group, ledby our development and centremanagement team, whichincludes a Glenrose retailer,members of the local communityaction group and local residentsand businesses. This group meetson a regular basis to discuss theremediation works and plans for anew centre. We report key issuesand action items to the group, theMayor and the local MP.This process has ensured anopen and consultative approachin the leadup to remediation andredevelopment works, and wehave received positive feedbackabout these sessions.We have learnt many lessons fromthis project and wish to maintainregular communication with ourstakeholders, including throughcommunity newsletters, retailerbriefings, website updates andbriefings for the local newspaper.Working together with ourstakeholders and focusing oncommunity priorities, we aredesigning a new shopping centrethat will be a safe and vibrantplace to shop.AVERAGERIGOUR TESTSCORE OUT OF 53.8IMPROVING OUR ENGAGEMENT PLANSThe stakeholder engagement plans for eachof our priority projects have been ratedin terms of their key elements and overallquality. The key elements include:relationship management,measures of success,Each plan receives a score out of 5 foreach criteria.The FY09 average score of 3.8 out of 5 is anincrease on our FY08 average score of 2.4,and demonstrates our increased focus onimproving the quality and effectiveness of ourplans. In FY10, we will be further developingthe rigour of our scoring to ensure the criteriareflects key elements of our stakeholderengagement approach across all propertiesand projects.Average stakeholder engagement planrigour test score out of 5FY09FY08 2.43.8COMMERCIAL PROPERTYOur evolving Commercial Propertysustainability policyIn July 2008, the office, industrial and retailbusinesses were combined to form theCommercial Property business unit.Bringing together these different assetclasses in one business revealed that weneeded a consolidated CR&S strategy forCommercial Property, and a policy consistentwith the Residential Sustainability Policy.A workshop held in May <strong>2009</strong> involving keyinternal Commercial Property stakeholdersidentified that stakeholder and customerengagement are important to the futuresuccess of the business unit. Other pastyear, customer engagement on sustainabilitymatters has included working with tenantson eco-efficiency through the SustainabilityAdvantage program (run by the Department ofEnvironment and Climate Change), continuingto implement our Retail Green Fitout Guideand supporting sustainable industrial propertydesign by establishing our North LakesBusiness Park Green Business Fund.Implementing revised stakeholderengagement plansDuring FY09 we developed a consistentapproach to the way we identify and prioritisestakeholders at all assets. Our aim was toempower all employees at a project levelto own and manage the relationships andengage with their local communities.As a part of this strategy, two stakeholderengagement templates were launched –one for development assets and one foroperating assets. Most of our retail centresand retail development projects now havestakeholder engagement plans (SEPs) inplace. A common approach is being adoptedacross the business with a focus on ensuringwe routinely identify key stakeholders, theirexpectations and priority issues. In supportof this, early work has been done to integratethis strategy at our largest and most complexoffice and industrial projects including ourMoorebank intermodal site in Sydney.A key challenge for the year ahead will be torevise and put these plans into operation asour needs and the needs of our stakeholderschange.<strong>Stockland</strong> Corporate Responsibility & Sustainability <strong>Report</strong> 30 June <strong>2009</strong> 17
OUR CR&SAPPROACHOur approach to stakeholder engagementis provided in the stakeholder engagementsection of this report (page 15 – 16).The energy and climate change section(page 44 – 57) details how we are improvingenergy efficiency in our new and existingbuildings, and the NABERS Energy andWater ratings for each of our buildings isincluded in the natural resources section(page 65 – 66). This section also includeswaste and water data for our CommercialProperty portfolio (page 62 – 64, 67).RESIDENTIAL ANDRETIREMENT LIVINGRESIDENTIAL SUSTAINABILITY STRATEGY18Developing the Commercial Propertysustainability strategyWe have started to revise our CommercialProperty sustainability strategy.We commenced this process throughinternal and external workshops, stakeholderinterviews, market research, peer analysis,media coverage and our own externalassurance process.The four sustainability priority areas were:waste and biodiversity).The development of action plans thataddress the material issues in these focusareas are a feature of our revised strategy.Particular attention will be given to customer,community and supplier engagementstrategies, job creation, low carbon,high-performing buildings, green regulationand rating tools.Commercial Property in this reportThe first of these priority areas, customerrelationships, is included in the customersand suppliers section of this report (page32 – 37) and includes information on how weare engaging with our Commercial Propertytenants on sustainability and ways that wecollect information from our customers ontheir experience, such as Mystery Shopperand customer feedback programs at ourretail centres.<strong>Stockland</strong> Corporate Responsibility & Sustainability <strong>Report</strong> 30 June <strong>2009</strong>Our evolving Residential sustainabilitypolicyA Residential sustainability policy waslaunched in June 2008, approved by theresidential management group. The policyrequires every project to implement aminimum compliance standard and alsoprovides advice on best practice andinnovation. The policy was communicatedto the business in the first quarter of FY09.While there is no formal mechanism to trackthe implementation of the policy, an informalreview completed in February and March<strong>2009</strong> indicated that there was inconsistentapplication and delivery. This review alsoidentified the need for the Residentialbusiness to further develop its understandingand approach to sustainability and toengage with stakeholders to prioritise thebusiness’s most important social, economicand environmental issues. At this time, ourResidential business encompasses ourRetirement Living business.The Residential sustainability policy is nowbeing revised and includes objectives andactions that are included in the performancemanagement role accountabilities forbusiness development and acquisitionmanagers, development managers,design managers, marketing managersand sales employees.Our stakeholdersSustainability engagement and communicationEssentials policy and consistent operating standardsEnergyand climatechange – managingimpact andmaximisingopportunitySocietyprioritiesSustainabilityforResidentialPropertyNaturalresources– water andbiodiversitymanagementCommunitydevelopment
Developing the Residentialsustainability strategyTo develop the residential sustainabilitystrategy, we conducted more than 35formal interviews in February and March<strong>2009</strong>. These interviews were held withinternal stakeholders, including the CEO,design managers, development managersand customer-facing employees from alllevels of the business. The list of potentialsustainability focus areas was also testedwith external stakeholders, including abuilder, consultant and a governmentrepresentative. We also undertook a review ofcustomers’ perceptions of our performance.In response to these challenges asustainability strategy identifying our areasof focus and action was developed in thefirst half of <strong>2009</strong>. Our sustainability policysetting our minimum standards and ‘beyondcompliance’ aspirations was revised to beconsistent with the strategy.As part of our strategy development thefour sustainability priority areas identifiedas most material to our stakeholders andbusiness were: Society: Our role in contributing to astrong, vibrant, healthy and economicallyviable society. This includes our role inhousing affordability, economic contributionand job creation,Community development: The softand hard infrastructure that create asustainable community,Energy and climate change: Ourenergy management approach andour current and future climate change,Natural resources (water andbiodiversity): Our water managementapproach and our impact on biodiversitythrough developments.The sustainability strategy also includes afocus on stakeholder engagement, improvingour sustainability communications, deliveringconsistent operating standards andembedding sustainability into our operations.These priorities were approved by theresidential management group and theCR&S Board Committee in May <strong>2009</strong>.Progress against the priority areas in thestrategy will be tracked through monthlyreporting to the residential managementgroup. We are developing project reportingstandards to track our performance. Apilot form of this project reporting has beenimplemented for this report, allowing usto establish a performance baseline.Residential and Retirement Livinginformation in this reportInformation on the first two priority areas,society and community development, canbe found in this report in the communitydevelopment and housing affordabilitysections (page 36, 40 – 42). Informationon customer satisfaction and our spend onsuppliers is detailed in the customers andsuppliers section (page 32 – 37).The climate change and energy sectionsummarises our estimated energy use andgreenhouse gas emissions and includesinformation on how we are working withspecialists on researching risks associatedwith flooding, storm surge and sea level rise(page 44 – 57).In the natural resources section there iswater consumption data for our residential,apartments and retirement living villagesand information on how we are managingbiodiversity impacts (page 58 – 67).All the Residential and Retirement Livingdata provided in this report was collectedin July <strong>2009</strong> covers FY09. Our CEOResidential and relevant general managersnominated data owners in their business tocollect and report sustainability data for thereporting period. The data was collectedfor 66 Residential Community projects, nineApartments projects and the four RetirementLiving projects that we determined we hadoperational control for under the NationalGreenhouse and Energy <strong>Report</strong>ing Act(NGERA). An information managementsystem was used to create online forms thatwere sent to the data owners. These formsprovided definitions and guidance on the datacollection process and methodologies.OUR CR&S APPROACHCASE STUDYPoint Lonsdale, VictoriaSTOCKLAND POINTLONSDALE, VICTORIAWe have considered a widerange of community issuesover the past five yearsas we pursued plans fora residential developmentat Point Lonsdale on theBellarine Peninsula in Victoria.Concerns have ranged fromthe potential environmentalimpacts of a development ata sensitive coastal locationto the proposed scale of theproject and the impact on theneighbouring community.This project has beenconsidered by all three levelsof government, ensuring astringent approval processthat provides opportunities forstakeholders to have their sayabout the project.After acquiring the 195hectare site in 2002, weinitially proposed a combinedtourist and residentialscheme, including a golfcourse. These plans weresoon abandoned in responseto community and regulatoryfeedback about theirunsuitability for the township.Since early 2004, wefocused on planning aproject that would be morein keeping with the site’scoastal location. In 2006we put forward a proposalfor a primarily residentialscheme, which includedplans to upgrade the existingdegraded waterway systemto provide better drainage atthe site, mitigate flood risk andcreate a rejuvenated marineenvironment restoring nativevegetation and habitats,which were key concernsraised by the local community.Our proposal also called forsome land to be rezonedfrom rural to residential. Thisplan was rejected by the stategovernment, and after furtherconsultation, we submitteda design that conformed toexisting land uses.Our application, along with theextensive Environment EffectsStatement (EES) prepared forthe project, was then referredto an independent planningpanel which heard publicsubmissions and expertstatements. The panel foundthat the project could proceedsubject to a number ofplanning conditions, includingsetting floor levels of dwellingsto accommodate potential sealevel rise predictions.In February <strong>2009</strong>, theVictorian State Minister forPlanning adopted the Panel’sfindings and referred theapplication to the FederalMinister for the Environmentfor consideration under theEnvironment Protection andBiodiversity Conservation Act.We submitted detailed studiesto ensure the project compliedwith the Act, includingprovisions for wetlands ofinternational significance andthreatened species.Throughout this process, wehave maintained a high levelof engagement with a rangeof stakeholders including localcommunity organisationsand authorities via regularbriefings, newsletters, sitetours and maintaining a visitorinformation centre near thesite for more than three years.In FY10, we will continue toconsult with representativesfrom various stakeholdergroups to ensure thedelivery of a world-class,environmentally-sensitivecoastal village at PointLonsdale.<strong>Stockland</strong> Corporate Responsibility & Sustainability <strong>Report</strong> 30 June <strong>2009</strong> 19
OUR CR&SAPPROACHSTOCKLAND UK PERFORMANCE SUMMARYPastLast year, we said we would:STOCKLAND UKBusiness climateThe past 12 months have been a challengingtime for the UK commercial property industry,which has witnessed a fall of over 25 percent in capital values in the year to May<strong>2009</strong>, with the total fall in capital values nowexpected to reach approximately 50 per centin the second half of <strong>2009</strong>. These pressuresare further compounded by considerabledownward pressures on rental growth andincreasing levels of tenant administrations.Against this challenging backdrop, weare continuing to focus on our enhancingrelationships with our tenants to help supportthem through this difficult period.PresentThis past year, we have:The current economic environment hasforced us to refocus our FY09 CR&S strategy.In particular, it has affected our ability tolaunch a formal program of work to engageour tenants and joint venture partners onCR&S. With the financial pressures thatthese businesses are currently under, andthe proposed sale of our UK assets, wefeel that engaging our customers on newinitiatives at the present time may provecounter-productive. We do, however, remaincommitted to progressing this work once theexternal environment allows.FutureIn the coming year, our prioritiesare to:Developing the UK sustainabilitystrategyOur UK CR&S Committee is made up of keyemployees from across the business. TheCommittee worked closely with the Australianbusiness to formulate our FY09 strategy andimplement this strategy across the business.The focal point for the business in FY09 interms of sustainability has been our existingasset management portfolio. We havecontinued to measure the carbon footprintof our most energy-intensive assets and areworking to identify and implement measuresto reduce the energy consumption ofthese assets. We also focused on meetingemerging environmental sustainabilityregulating requirements.We held a series of environmentalsustainability workshops in the year toeducate employees and develop a tailoredsustainability approach for our assetmanagement and major project areas of thebusiness. Over 90 per cent of employees inthese teams attended these workshops.This year we have also continued to place astrong emphasis on employee engagementand have achieved very positive results asmeasured by our annual employee survey, aswell as a high level of employee participationin the giving and volunteering activities wehave run throughout the year.<strong>Stockland</strong> UK information in this reportThis report includes information on employeevolunteering and community investment inour UK business, and on our communitydevelopment project in Harlow in Essex(page 42).Employee data in our people sectionincludes UK employees unless otherwisestated (page 24 – 26, 28 – 31). We outlineUK environmental regulation affectingour industry in the Regulation section(page 48 – 49).20<strong>Stockland</strong> Corporate Responsibility & Sustainability <strong>Report</strong> 30 June <strong>2009</strong>
United Nations’ Principles for Responsible InvestmentRESPONSIBLE INVESTMENTPERFORMANCE SUMMARYWe became a signatory to two investmentfocusedinitiatives in our previous reportingyear: the Investor Group on Climate Change(IGCC) and the United Nations’ Principles forResponsible Investment (UN PRI).Initially, these initiatives were sponsoredby our Unlisted Property Funds (UPF)business, however we have come to applythe principles of these organisations tothe management of our properties andprojects - beyond those held in UPF.PrinciplesUN Principles for Responsible InvestmentPresentThis past year, we have:A Guide to Corporate Responsibility<strong>Report</strong>ing in the Property Sector<strong>Stockland</strong> Corporate Responsibility & Sustainability <strong>Report</strong> 30 June <strong>2009</strong> 21
ContentsValuing our people 22Employee engagement 24Capability development 27Embedding sustainability 28Employee health and safety 29Employee profile 31VALUING OURPEOPLEMaintaining high levels ofemployee engagement, embeddingCR&S and ensuring the healthand safety of our employeesenables us to operate effectivelyand to continue to attract andretain talent.22<strong>Stockland</strong> Corporate Responsibility & Sustainability <strong>Report</strong> 30 June <strong>2009</strong>
Valuing our people – Progress and prioritiesPERFORMANCE SUMMARYPastLast year, we said we would:PresentThis past year, we have:FutureIn the coming year, our prioritiesare to:<strong>Stockland</strong> Corporate Responsibility & Sustainability <strong>Report</strong> 30 June <strong>2009</strong> 23
VALUING OURPEOPLE<strong>Stockland</strong> workforce – by regionFY09 (total 1,334)Australia (1,236)UK (98)EMPLOYEE ENGAGEMENTOur employees create our products anddeliver our services. How they think, feeland act about the organisation is vital to oursuccess. Our aim is to foster a diverse workenvironment where employees are engagedand their contributions are recognised.Our annual employee opinion survey, ‘OurVoice’, measures employee engagement.Our <strong>2009</strong> employee engagement score was82 per cent, which is above the Global HighPerforming Companies Norm as measuredby Towers Perrin-ISR.VALUING OUR PEOPLEOur employees are vitally important tous. Maintaining high levels of employeeengagement, embedding CR&S and ensuringthe health and safety of our employeesenables us to operate effectively and tocontinue to attract and retain talent.To help foster an engaged, productive andsafe workplace we have a People Strategywhich guides how we attract, develop,support and reward our people. The strategyis updated each year and we report onprogress and key metrics to our Boardeach month.We commenced FY09 with a PeopleStrategy to:frameworks and processes.The global financial crisis provided challengesfor us in FY09. In particular, extensiveorganisational restructuring was requiredto adapt the business to prevailing marketconditions.The restructure had significant implicationsfor our people, with a number of roles beingmade redundant. Despite this, we maintaineda strong focus on our people strategy withkey outcomes detailed in this section.People information in this reportThe employee engagement section outlinesour approach to creating a diverse workenvironment, results from our employeeengagement ‘Our Voice’ survey and thebenefits we provide to our employees.The embedding CR&S section discussesthe work we have done towards our goalof embedding CR&S into the business. Thisincludes implementing new policies andinitiatives in our Residential and CommercialProperty businesses, as well as our work tointegrate CR&S objectives into performancemanagement.The capability development section includesinformation on our initiatives to strengthenleadership and management capability andthe investment we have made in leadershipdevelopment tools and programs.The employee metrics section includesinformation on our total workforce by ethnicbackground and gender. It also detailsour turnover rates and the impacts ofretrenchments in the reporting period.The health and safety section details ourinjury performance, feedback from ouremployees and improvement projectswe have been working on including theintroduction of IRIS, our new incidentreporting system.<strong>Stockland</strong> workforce – number of employeesFY09FY08FY07FY06Full-time (including fixed-term)Part-time (including fixed-term)Casual980<strong>Stockland</strong> workforce – by contractFY09 (total 1,334)Permanent full-time (1,171)Permanent part-time (122)Fixed-term full-time (20)Casual (21)1,2191,3341,375FY08 (total 1,375)Permanent full-time (1,230)Permanent part-time (104)Fixed-term full-time (13)Fixed-term part-time (2)Casual (26)Employee engagementFY09FY08FY07FY0680%80%81%82%FY05 82%83%More than 90% of our employees participatein our annual survey, enabling us to benchmarkourselves against high performing companies.Global High Performing Companies Norm.84%85%While falling by 1 per cent from our 2008score of 83 per cent, this result is statisticallyinsignificant and engagement remains high,despite the uncertainty of the economicclimate at the time of the survey andstructural changes in some parts of thebusiness.The Global High Performance Norm (GHPN)is Towers Perrin-ISR’s highest benchmark.In the <strong>2009</strong> ‘Our Voice’ survey, we either metor exceeded the GHPN in 18 of the 20 resultcategories where a GHPN benchmark scoreis available.24<strong>Stockland</strong> Corporate Responsibility & Sustainability <strong>Report</strong> 30 June <strong>2009</strong>
The area in which we scored most favourablyin comparison with the Global HighPerforming Companies Norm was trainingand learning, with 81 per cent of peoplesaying that there are sufficient opportunitiesfor them to receive training to improve skills.We will continue to develop our employeesas this is a key reason why people stayat <strong>Stockland</strong>. In previous years, pay washighlighted as an area that needed to beexamined. This year’s results show a markedimprovement (eight per cent) in employees’perceptions on pay.While the survey highlights areas in which weare performing well, it also identifies areas inwhich we can improve. The areas in whichwe scored least favourably in comparisonwith the GHPN included:Values: While most people believe ourvalues are clear (92 per cent) and ourcurrent values remain relevant to thebusiness (88 per cent), there has beenan 8 per cent reduction in the belief thatleadership decisions are consistent withour core values. Overall, there has been asignificant reduction in our values categoryscore, from 85 in FY08 to 81 in FY09,which is two points below the GHPN score.This reduction occurred primarily in theparts of the business most affected byorganisational restructuring implementedprior to the survey period. In FY10, we willbe seeking to address this by supporting amore constructive leadership style alignedwith our culture and values, focusing on thebusiness areas where the biggest reductionin scores occurred.Customer Focus: There has been a5 per cent reduction in the belief that wedo not make promises to customers thatwe cannot deliver on. This is a particularconcern in some of our customer-focusingareas and one that we are seeking toaddress through initiatives such as thelaunch of our Customer RelationshipManagement system (link to customersatisfaction page) in our Residentialbusiness.While our perceptions of work/life balancehave improved since 2008 and threequartersof employees find their workschedule allows sufficient flexibility to meetpersonal needs, 43 per cent said that theyfeel their workload is excessive. Action plansto address this will be developed in thecoming year.The <strong>2009</strong> ‘Our Voice’ survey was conductedin March and April <strong>2009</strong> and employeeparticipation was high at 92 per cent.Diversity in the workplaceDiversity forms an integral part of our peoplestrategy, with progress against the diversitytarget reported to the Board twice a year.In the <strong>2009</strong> ‘Our Voice’ employee survey,89 per cent of people felt that we supportequal employment opportunity for allemployees. This represents a 9 per centincrease from our score in 2008 and is17 per cent above the Towers Perrin-ISRGlobal High Performing Companies’ Norm.We value diversity and aim to create avibrant and inclusive workforce, reflectiveof the communities in which we operate.Our focus is on gender equity, disability andIndigenous Australians. During the past year,a Diversity Steering Committee has beenestablished to oversee the implementation ofour diversity strategy. A senior manager hasbeen appointed in the human resources teamto identify best practice diversity initiatives.We accommodate the Diversity Council ofAustralia (DCA) in our head office, providingworkstations and IT facilities free of charge.DCA is an independent, not-for-profitdiversity adviser to businesses in Australia.This arrangement provides us with theopportunity to collaborate with the DCA onhow we can enhance diversity within ourworkplace. Although opportunities to expandthe diversity of our workforce have beenlimited by the global financial crisis and alower level of recruitment activity, several newdiversity programs have been implemented.EthnicityFY09FY08Other 4%North American 1%Asian (south-east, north-east,southern and central) 8%European (British, north-west,central, southern, eastern) 12%Maori and New Zealand 3%Australian 66%Other 3.1%North American 1%Asian (south-east, north-east,southern and central) 5.4%European (British, north-west,central, southern, eastern) 6.6%Maori and New Zealand 2.9%Australian 80.7%Percentages are based on employees who respondedto these questions in the ISR survey. 94 per cent ofemployees provided a response to these questions.MEDIAN AGE OFEMPLOYEES37.5 YEARSMedian age of employeesFY09FY08FY07FY06Disability programsIn conjunction with the Australian Employers’Network on Disability, we participate in the‘Stepping into Finance’ program and the‘Willing & Able Mentoring’ program. Theprogram supports tertiary students witha disability by providing them with eitherpaid work experience during their summervacation or with the opportunity to developa mentoring relationship with an industryprofessional.Providing employment opportunitiesfor Indigenous AustraliansOur commitment to providing employmentopportunities for Indigenous Australians hasbeen strengthened through the graduationof our first Indigenous Cadet into ongoingfull-time employment.34343437.5<strong>Stockland</strong> Corporate Responsibility & Sustainability <strong>Report</strong> 30 June <strong>2009</strong> 25
VALUING OURPEOPLEPROPORTION OF WOMEN IN MANAGEMENTJob BandFY06WomenFY06MenFY07WomenFY07MenFY08WomenFY08MenFY09WomenExecutive Management 33% 67% 33% 67% 33% 67% 25% 75%Leadership Team 10% 90% 14% 86% 16% 84% 15% 85%Senior Management 20% 80% 20% 80% 23% 78% 24% 76%Management 33% 67% 33% 67% 35% 65% 39% 61%Professional/Technical 53% 47% 49% 51% 49% 51% 46% 54%Employee 83% 17% 80% 20% 81% 19% 76% 24%Total 52% 48% 51% 49% 52% 48% 50% 50%FY09MenOVERALLWOMEN INMANAGEMENT33 %Gender equityOur aim is to increase the percentage ofwomen in management roles, and progresshas been achieved over the past year. Thepercentage of women in management rolesincreased from 30.4 per cent at the start ofthe year to 33.4 per cent by the end of theyear. Although this improvement falls slightlybelow our target of 35 per cent, opportunitiesto expand the diversity of our workforce havebeen limited by our lower level of recruitmentactivity in response to the economic climate.Overall women in managementFY09FY08FY07FY0628%28%30%33%We remain committed to professionaldevelopment initiatives to help increasethe number of suitably-qualified femalecandidates for senior roles. The launchof the ‘My Mentor’ program, in additionto expanding our women’s networkingforums, provides further support forwomen to develop their careers.Human rightsOur human rights commitments are includedin the following policies and procedures:These policies can be found on our website.We look to work with organisations thatdemonstrate a commitment to human rights,through our Sustainable Supply Chain Policy.FY09FY08FY09FY08FY09FY08FY09FY08FY09FY08Average fixed remuneration (FTE) by gender and job band1.002.671.001.901.00 1.251.001.331.001.301.001.001.231.241.001.131.001.131.001.09Executive ManagementLeadership TeamSenior ManagementManagementProfessional/TechnicalGender profileGender and age profile221269106158151Years of age60Women (673)Men (661)26<strong>Stockland</strong> Corporate Responsibility & Sustainability <strong>Report</strong> 30 June <strong>2009</strong>
Employee benefitsWe support our employees by offeringa range of benefits such as:share plan and short-term incentiveprogram,in <strong>Stockland</strong> developments,primary care givers,non-primary care givers,referral service,offers confidential counselling foremployees and family members,Since opening in June 2008, the TreehouseChildcare Centre now has an averageenrolment of 45 children, representingan 80 per cent occupancy rate.Where feasible, employees are also ableto arrange flexible work options with theirmanagers. These include part-time roles,job sharing and the flexibility to workfrom home.CAPABILITY DEVELOPMENTTraining and personal development isan important contributor to employeeengagement. Our performance in thisarea continues to be rated highly by ouremployees. The ‘Our Voice’ surveyconducted in April <strong>2009</strong> showed over75 per cent of participants respondedfavourably to the training and learning andpersonal development questions. Theseresults are consistent with the TowersPerrin-ISR Global High PerformingCompanies Norm.We provided around three training daysper employee in the reporting period andcontinue to budget 2.5 per cent of payroll fortraining annually. Our capability developmentstrategy this year responded to the economicenvironment and needs of the business. Thisincluded building internal training capability,encouraging on-the-job development anddeveloping cost-effective training. As a result,our training spend as a percentage of ourpayroll declined, largely as a consequenceof this increase in internal training. In FY09,we focused on:capability and ultimately reduce employeeturnover,for employee development,Annualised training days per employee (excl. UK)FY09FY08FY07FY06FY09FY08FY07FY062.91.3%3.13.7Training spend as % of payroll (excl. UK)1.9%2.0%4.62.1%Inspiring Manager Training SeriesThe Inspiring Manager Training Seriesincludes mandatory half and one-dayprograms for our people managers, whichare run three to four times a year. This yearwe ran programs on Objective Settingand Development Planning, ConductingPerformance Reviews, Manager as Coach,and Skills for Managing in Challenging Times.The series aims to empower our managersto develop capability in their teams andaddress employee turnover.The Managing in Challenging Times programwas developed in response to organisationalneeds following the reduction in employeenumbers in early <strong>2009</strong>. The session helpedmanagers understand the recent businesschanges and provided guidance on how todeal with change, both individually andas a team.Embedding leadership attributesBusiness leaders complete a 360 degreeassessment on our 12 leadership attributes.Over the past year the aggregate scores forleadership team members have increasedfor each of the 12 leadership attributes.This feedback instrument is administeredby Development Dimensions International(DDI). Our leadership team meets or exceedsthe DDI 50th percentile Global ExecutiveNorm for nine of the ten attributes, wherethis external benchmarking measure isavailable. Leaders who participate in theassessment create action plans to supporttheir development.Our leadership capabilities were recognisedwhen Natalie Moore, State Sales Manager,Residential, was chosen as AFR BOSSmagazine’s Young Executive of the Year<strong>2009</strong>, which names six of the best youngleaders in corporate Australia with theskills, talent and drive needed to make asuccessful leader.Gateway Retail Management ProgramWe partner with the Macquarie GraduateSchool of Management for the GatewayRetail Management Program. Gateway, ayear-long course, offers a theoretical andpractical approach to the specifics of retailmanagement at <strong>Stockland</strong>.The program provides participants with theskills and knowledge needed to be a centremanager. Eleven participants in the inauguralprogram completed the training in late 2008.Compliance trainingOnline Trade Practices and Privacy trainingsessions are run every two years. Thistraining was run in FY08, and selectedemployees have been enrolled to completeboth modules in July and August <strong>2009</strong>.We also held online Equal EmploymentOpportunity training in June and July 2008.This training comprises three modules:Discrimination, Grievance and Harassment.Thirty-one per cent of employees undertookthe training at the end of FY08, and theremainder completed it in early FY09. Allemployees are currently enrolled to completethis training again in July and August <strong>2009</strong>.<strong>2009</strong> Peter Daly FellowshipThe Peter Daly Fellowship providesemployees with the opportunity to traveloverseas to investigate an initiative that willhelp bring our business closer to beingworld-class in a key focus area.Almost 40 people, working in teams,applied for the <strong>2009</strong> Fellowship. Thewinning team examined social sustainabilityand ways that we can better engage withour stakeholders to ensure we take theirpoints of view into consideration in thedevelopment of our projects. Workingtowards social sustainability will enhanceour brand awareness, lead to the creation ofdevelopments that are quick to market yetmindful of our stakeholders’ interests, andwill position us as a leader in policy andbest practice development.The research involved travelling to the UnitedStates, Canada and the United Kingdomto benchmark our projects against leadinginternational practice. The research wasconducted in April and May <strong>2009</strong> andrecommendations for the business arenow being developed.<strong>Stockland</strong> Corporate Responsibility & Sustainability <strong>Report</strong> 30 June <strong>2009</strong> 27
EMPLOYEE HEALTH AND SAFETYOur performanceWe have a Health, Safety and Environment(HSE) Management System to promote thewellbeing of all our employees, contractors,tenants and patrons.We have improved our management systemduring FY09 and this will continue to be apriority for us in the year ahead. We considerthat our HSE management system is definedby our collective attitudes and leadershipbehaviours. Our HSE team helps guideour line managers and support them withspecialist knowledge.LOST TIMEINJURY RATE2.6Lost time injury rateFY09 2.6FY082.9FY075.2Number of injuries per million person hours worked.Absentee rates (excl. UK)FY09FY08FY07FY061.5%1.4%1.3%1.3%We aim to drive change by first focusingon our competency and behaviours andthen supporting the changes with ourmanagement system. There are challenges inthis approach and it requires time and effort,however we believe the benefits can be seenin our injury performance, by the feedbackprovided in the ‘Our Voice’ employee surveyand by feedback we have received fromcontractors during the year.During the reporting period we experiencedno serious employee injuries and ouremployee lost time injury frequency rateof 2.6 was lower than our target of 4.0 orless. In the UK we experienced one incidentwith an employee that required notificationto the Health and Safety Executive. Theincident was mild and the Health and SafetyExecutive did not investigate.We experienced no serious environmentalbreaches and continued to carefully managecontamination issues at several of ourproperties. There were two instances offire at our UK properties in the reportingperiod. One was a case of arson and wasinvestigated by the police, with no fault onour part. The other was a tenant issue dueto equipment being left on overnight. Again,there was no fault on our part, and remedialaction was taken by the tenant to ensurethere will be no further occurrences.HEALTH AND SAFETY PERFORMANCEFY07 FY08 FY09Total average workforce during the reporting period – 1,372 1,320Total hours worked 1.93 million 2.40 million 2.31 millionIndependent contractors working on-site to whom <strong>Stockland</strong> is liablefor the general safety of the working environment– NotrecordedNotrecordedNumber of lost time injuries during the reporting period – 7 6Frequency rate of lost time injuries during the reporting period5.2 2.9 2.6(defined as the number of injuries per million person-hours worked)Number of injuries requiring medical treatment during the reporting– 10 12period (not including lost time injuries)Frequency rate of medical treatment (MT) injuries during the reportingperiod (defined as the number of MT injuries per million person-hoursworked)– 4.2 5.2Frequency rate (lost time and medical treatment injuries) during thereporting period (defined as the number of injuries (LT and MT) permillion person-hours worked. Does not include injuries requiring firstaid treatment only).– 7.1 7.8Occupational diseases instances – 0 0Fatalities 0 0 0Lost days – total for the recorded lost time injuries – 14 31Average lost day rate (severity rate). Average number of days lostper lost time injury– 2.3 5.2Notes: Figures are from Australian operations only.i) In last year’s report we recorded six lost time injuries (LTIs), a lost time injury frequency rate (LTIFR) of 2.5 and a frequency rate (lost time and medicaltreatment injuries) of 6.6 for FY08. We have revised the FY08 data in this year’s report to seven LTIs, a LTIFR of 2.9 and a frequency rate of 7.1. Thereason for this change is that an incident in March 2008 was not reported by the employee until December 2008. The lost time was incurred in January<strong>2009</strong> when the employee underwent surgery as a result of an injury arising from the incident.ii) For FY10 we aim to reduce our LTIFR to 2.0 or less. As stated in our Health and Safety Commitment Statement we believe that all injuries arepreventable. Our vision is for workplaces that are free of injury and negative health impacts.<strong>Stockland</strong> Corporate Responsibility & Sustainability <strong>Report</strong> 30 June <strong>2009</strong> 29
VALUING OURPEOPLEEngaging our employees in ourHSE programRecognising that world-class HSE requiresthe active and sustained participation ofall employees, we require all employees toinclude HSE objectives in their performanceplans and we make sure these objectivesrequire personal involvement in HSE activitiessuch as risk assessments and incidentinvestigation.We support employee involvement byproviding induction and training programs,specialist support from the HSE team, andinternal communications on HSE throughour internal newsletter and intranet.Many employees were involved in anextensive program of initiatives during SafeWork Week in October 2008 and for the firsttime we implemented a trial of the GlobalCorporate Challenge walking program, ahealth and wellbeing event that aims toaddress the risks of sedentary occupationsand longer work days.The success of our employee engagementinitiatives is demonstrated by responsesin ‘Our Voice’ survey, where 95 per centof employees reported they have a goodunderstanding of their HSE responsibilitiesand 89 per cent of employees (up from84 per cent in 2008) think that effectiveaction is taken when unsafe conditions arebrought to management’s attention. In theUK, our employee survey showed a distinctincrease in the understanding of individualHSE responsibilities. The HSE category scoreimproved by 12 points from 2008 to 78 percent. We commenced a training programfor an HSE representative for our three officesin London, Edinburgh and Glasgow.We also conducted in-depth HSE trainingwith our centre and building managers in April.We plan to continue our engagement strategyin FY10 and include a more comprehensivehealth and wellbeing program.Working with our contractors andbusiness partnersWe continued improving our contractsduring FY09 by providing clear expectationsfor HSE best practice and improving ourcontractor induction program. We maintainedour focus on timely and accurate reportingand worked with contractors to help theminvestigate HSE incidents to identify changesto prevent recurrence. Two people workingfor construction contractors at differentdevelopment sites sustained serious injuriesneeding long-term rehabilitation withinthe reporting period. In both instances,the sites were under control of principalcontractors. Both incidents involved afall from height, one from a roof duringdemolition works and the other from aformwork platform.We have continued to circulate safety alertsto our contractors and consultants. Mostimportantly, we have continued to improvethe frequency and quality of interactionaround HSE that our front line managershave with contractors and other businesspartners during their regular businessinteractions such as tender meetings,pre-start briefings, coordination meetingsand site visits.In the UK, two of our contractors experiencedserious reportable incidents during the year,one involving a scaffolding pole and the othera partial block wall collapse. Neither werereportable under the <strong>Report</strong>ing of Injuries,Diseases and Dangerous OccurrencesRegulations 1995 (RIDDOR) and no actionwas taken against us.Launch of new online incidentreporting systemWe launched an incident reporting andinvestigation system (IRIS) in January that willhelp us improve our reporting and analysisand identify and eliminate conditions thatcause incidents. We will develop a newIRIS module in FY10 for scheduling andrecording audits and results from the audits.We will also be able to record HSE issuessuch as contamination that require ongoingmanagement. The module will have thefacility to record HSE hazards and actionstaken to eliminate or control hazards.In the UK, we relaunched an online systemin early <strong>2009</strong> called the Risk Action PlanDatabase (RAP). RAP holds all informationfrom external Health and Safety/Fire/Disability Discrimination Act Access auditsand insurance inspections and is ourprimary risk management tool. The systemallows us to monitor and report our risksacross the portfolio. In recent months, asa consequence of the HSE training andrelaunch of the system, we have seen asignificant reduction in the number of risksbeing addressed and closed off.30<strong>Stockland</strong> Corporate Responsibility & Sustainability <strong>Report</strong> 30 June <strong>2009</strong>
EMPLOYEE PROFILEAll figures include data from our UKoperations unless otherwise stated.Employee turnoverIn the reporting period, rolling regrettedturnover has trended downward to10.5 per cent at year end, compared to aninitial target of 12 per cent. Whilst initiativesto further improve career planning andprofessional development have contributedto the reduction in regretted turnover, theeconomic downturn has contributed toimproved retention. By analysing the‘Our Voice’ employee survey results, weidentified that employee wellbeing is stronglycorrelated with regretted turnover. That is,the higher the level of wellbeing, the lowerthe level of turnover. Over the next 12 monthswe will focus on initiatives to improveemployee wellbeing, which we hope willfurther reduce regretted turnover.Extensive organisational restructuring hasresulted in a 13 per cent reduction in ourworkforce during the reporting period.Our total rolling turnover has increased to28.3 per cent as a result of this restructuringand associated employee exits. A changemanagement program aimed to ensure thatall employees affected by these changeswere treated fairly and respectfully. Inaddition to receiving severance paymentsmade in accordance with our redundancypolicy, all exiting employees were providedwith access to a specialist career transitionsupport program.Rolling turnoverFY09FY0810.5%TURNOVER13%FY07 13% 8% 21%RegrettedNon-regretted/<strong>Stockland</strong> initiated17.8%13% 26%28.3%Rolling turnover is calculated using rolling monthly figures.End of year turnover is calculated by dividing the total numberof exits over the year by the end of financial year headcount.The FY09 head count includes permanent employees only.Turnover by age group 60No. exits 99 153 79 34 4Headcount (at 30/06/08) 346 477 234 115 26Turnover rate 29% 32% 34% 30% 15%Turnover by gender Male FemaleNo. exits 166 203Headcount (at 30/06/08) 644 649Turnover rate 26% 31%Overall turnover Australia UKNo. exits 369 24Headcount (at 30/6/08) 1,236 98Turnover rate 29.9% 24.5%Rolling turnover FY07 FY08 FY09Regretted 13% 13% 10.5%Non-regretted/<strong>Stockland</strong> initiated 8% 13% 17.8%Total turnover 21% 26% 28.3%Notes: Rolling turnover is calculated using rolling monthly figures. End of year turnover is calculated by dividing the total numberof exits over the year by the end of financial year headcount. The FY09 head count includes permanent employees only.Over the next 12 months we will focuson initiatives to improve employeewellbeing, which we hope will reduceregretted turnover.<strong>Stockland</strong> Corporate Responsibility & Sustainability <strong>Report</strong> 30 June <strong>2009</strong> 31
ContentsOur customers and suppliers 32Responding to our customers 35– Commercial Property 35– Residential 36– Retirement Living 37Engaging with our suppliers 37OUR CUSTOMERSAND SUPPLIERSEngaging with our suppliers andour customers enables us tounderstand and meet their needsand expectations.32<strong>Stockland</strong> Corporate Responsibility & Sustainability <strong>Report</strong> 30 June <strong>2009</strong>
Our customers and suppliers – Progress and prioritiesPastLast year, we said we would:PresentThis past year, we have:FutureIn the coming year, our prioritiesare to:<strong>Stockland</strong> Corporate Responsibility & Sustainability <strong>Report</strong> 30 June <strong>2009</strong> 33
OUR CUSTOMERSAND SUPPLIERSOUR CUSTOMERS AND SUPPLIERSCASE STUDYWe seek to work with our tenants on sustainable built environmentsOUR CUSTOMERS AND SUPPLIERSWorking with our customers and suppliersis one of the pillars of our CR&S strategy.This includes:customers are and what their needs are,affordability,suppliers.Engaging with our suppliers (we have over7,000 suppliers) and our customers enablesus to understand and meet their needs andexpectations. We have two main groups ofcustomers:include office tenants, industrial tenants,retail tenants and retail shoppers,in a <strong>Stockland</strong> residential community,apartment or retirement village.About our customers and suppliersin this reportWe outline how we respond to ourcustomers.how we are seeking to understand theneeds of customers who shop in our retailcentres, and how we are working with ourtenants on sustainability,customer research we have undertakento better understand our residentialcustomers, and includes discussion ofthe issue of housing affordability and ourresponse to it,information on our supplier base and ourSustainable Supply Chain Managementprogram.WORKING WITH TENANTSON SUSTAINABLE DESIGN– SNOWDONIA AIRCONDITIONING SERVICESWe seek to work with our tenantson sustainable built environments.This includes on projects whereour direct involvement is limited toland development, rather than assetmanagement. The North LakesGreen Business Fund providesincentives of up to $100,000 toencourage companies to usesuperior sustainable buildingpractices in the North LakesBusiness Park.We have worked closely with thefirst developer in the businesspark, Snowdonia Air ConditioningServices, to construct its premises.Snowdonia’s vision was to create anindustrial building featuring innovativeand sustainable design principles inorder to reduce the environmentalimpacts of the building.Snowdonia is the first project to becompleted that aligns with the visionfor sustainability set for the NorthLakes Business Park and is currentlybeing assessed against GreenBusiness Fund criteria to determineeligibility for funding.Many of the design features of theSnowdonia building are leadingexamples of what can be achievedin an industrial facility including:in toilet flushing and landscapeirrigation,which feeds excess renewableenergy directly into the grid,compound paints, sealantsand carpet to improve indoorenvironment quality,systems which respond to daylightsensing and natural lighting in thewarehouse to reduce the need forartificial lighting,top solar system,sustainable plantations or wasrecycled.34<strong>Stockland</strong> Corporate Responsibility & Sustainability <strong>Report</strong> 30 June <strong>2009</strong>
RESPONDING TO OUR CUSTOMERS– COMMERCIAL PROPERTYOur Commercial Property customers includecommercial, industrial and retail tenants, aswell as shoppers in our retail centres.To identify what is important for our retailersand tenants we conducted customersatisfaction research and used the resultsto develop our Insights and CustomerEngagement plan for FY10.Tenant engagementEngaging with our tenants means wecan better understand their needs andidentify areas for improvement. In FY09, weconducted an extensive review to assessefficiencies of the core service interactionswith the <strong>Stockland</strong> Service Centre andassociated stakeholders. The review focusedon three areas which included the keyreactive maintenance process, contractormanagement and invoicing. These areashave now been refined and improved whichwill result in a more personalised service toour customers and efficient managementand payment of our contractors.One of the key areas where we canprovide value and guidance to our officeand industrial tenants is in the area ofenvironmental sustainability. We have theopportunity to help our customers improvetheir environmental performance and thisconstitutes an important part of our overallcommitment to the environment.Project RapportProject Rapport is a client relationshipstrategy that aims to achieve greaterengagement of all key stakeholders inmanaging key Commercial Property tenants.The project was initiated in the context ofour relationship with our largest office tenant,Optus, and over FY09 has been presentedto key government tenants as an opportunityto foster better relationships.This year, our office tenants told us that theway we respond to their daily operationalissues is of great importance. In response tothis we have reviewed our service model andstreamlined internal processes to ensure ourservice process is proactive and responsive.In addition, we have undertaken extensivecustomer service training with our employeesto ensure they have the tools to identify andrespond to the needs of our customers.Engaging with our retailers onenvironmental sustainabilityWe launched a green tenant fit-out guidein 2007 to provide guidance to our retailtenants. Building on this work, we areseeking broader engagement with retailerson environmental sustainability.We have partnered with the Departmentof Environment and Climate Change NSW(DECC) to promote a business programcalled Sustainability Advantage. The programis designed to help our retail tenantsunderstand sustainability and add businessvalue and it will be launched in the secondquarter of FY10. Participants will havethe opportunity to improve their businessthrough innovation, lower costs, improvedproductivity and enhanced reputation as asupplier and employer of choice.Rating customers’ experience in ourshopping centresWe aim to provide convenient and accessibleshopping centres that meet local communityneeds. To better understand and improveour customers’ experience we launchedthe Customer Excellence Programme andCustomer Feedback Solutions in FY09.The Customer Excellence Program involvesmystery shoppers rating our centres on allaspects of the shopping experience includingsignage, customer service, cleanliness offacilities, employee presentation and visibilityand availability of service professionals. Wealso ask the mystery shoppers to tell us whatthey would like to see improved. All mysteryshoppers are local customers and arerecruited by an external company.The Customer Excellence Programbenchmarks our centres and every quarterwe have seen an average 7 per centimprovement in how our customers haverated us.In addition, every branded <strong>Stockland</strong> centrenow has Customer Feedback Solutions.These are visible and accessible touch padslocated throughout our centres enablingcustomers to rate our performance. Thetouch pads include questions on car parks,the cleanliness of our centres and the rangeof shops. Our centre teams use this feedbackto identify areas for improvement. Forexample, <strong>Stockland</strong> Wetherill Park in southwest Sydney used the touch pad informationto identify the time in the day when it wasperceived that our cleaning standardsdropped and worked with cleaners tomaintain standards throughout the day.Raising awareness of access issuesIn FY09 we have been working to improveaccessibility for people with disabilities. Tohelp raise awareness of access issues facedby people with a disability in our shoppingcentres, we participated in International Dayof People with Disability on 3rd December2008. On this day, we hosted awarenessevents at some of our shopping centres inWetherill Park, New South Wales, The Pines,Victoria and Townsville, Queensland.We also participated in the InternationalDay of People with Disability in 2007 at ourForster shopping centre. Our experiencesfrom this day led us to make some changesto the centre, including re-surfacing theconcrete in the southern precinct to make itless slippery in wet weather. We also installeda lay-back for easier access to the car park.Organisations joined us for these eventsincluded Guide Dogs NSW/ACT, The SpasticCentre, local council organisations andlocal radio presenters. Tracy Barrell, anambassador for International Day of Peoplewith Disability and the face of the 2008Don’t DIS My ABILITY Campaign, attendedthe <strong>Stockland</strong> Wetherill Park event and spokeabout the access challenges faced as a triplecongenital amputee when shopping.Employees who influence the design,development and management of ourshopping centres participated in the day.Participants were given tasks to completein either in a wheelchair or wearing goggles,to simulate vision impairments. A personwith a disability guided each group andexplained the challenges they face. Ourteams learned about the importance of lightcontrast and the difference this can maketo the experience of a person with a visionimpairment. They also learned about whereto best place the centre directories andcustomer care desks to make them easier forcustomers to locate and access. The eventshelped increase understanding of the accessdifficulties some of our customers face andhave led to specific changes, such as areview of directional signage placement atour Townsville Shopping Centre.<strong>Stockland</strong> Corporate Responsibility & Sustainability <strong>Report</strong> 30 June <strong>2009</strong> 35
OUR CUSTOMERSAND SUPPLIERSRESPONDING TO OUR CUSTOMERS– RESIDENTIALCustomer insightsTo obtain customer feedback we conductcustomer research specific to each businessunit: Residential Communities, Apartmentsand Retirement Living.Residential CommunitiesIn Residential Communities we conductweekly tracking research. ‘<strong>Stockland</strong>Customer Pulse’ covers more than 30 ofour residential communities across fourstates. We began interviewing customers inJune 2008 and during FY09 conducted over4,000 interviews with our Lead Customersand Purchasers. The results show that96 per cent of our buyers rate the overallsales experience as good to excellent.One of the most important aspects wemeasure is the proportion of Lead Customersand Deposit Customers who are First HomeBuyers, Second/Subsequent Home Buyersand Investors. This helps the businessidentify trends and anticipate the likelycustomer mix six months ahead.The July <strong>2009</strong> ‘Choose New’ marketingcampaign in Residential Communitiesis aimed at both First Home Buyers andSecond/Subsequent Home Buyers, aswe anticipate the former to decline as aproportion of all sales. Consequently,we will have over 500 house and landpackages available at under $450k.In the coming months, we will be refiningour strategy to better meet the needs of‘Mum and Dad’ property investors.ApartmentsCustomer satisfaction research inApartments was conducted in June andJuly 2008. The research identified the needfor customer relations managers to continueto work closely with our customers. We willbe reviewing appropriate consumer researchdedicated to Apartments’ customers in thecoming year.Customer Relationship ManagementTo improve marketing and communicationswith customers and potential customersin our Residential business, we launcheda Customer Relationship Managementsystem in FY09. The system has improvedour ability to capture customer details andhas enabled the increased use of electroniccommunication channels, including email andtext messages. These channels are morecost-effective and enable us to communicatemore frequently and effectively with ourpotential customers. In the coming financialyear we will improve our understanding ofpotential customers and customers throughthe launch of the Siebel Analytics reportingtool in our Residential business.Housing affordabilityThough land price increases have been anentrenched feature of the residential marketover the long-term, the early to mid 2000sreflected a sustained period of above averageprice growth.Between 2000 and <strong>2009</strong>, housing demandincreased, driven largely by populationgrowth. Land supply did not increase at thesame rate, causing prices to increase. Thiswas exacerbated by increasing developmentcosts and demand for larger homes. In someplaces like southeast Queensland, landvalues increased by as much as 16 per centper annum between 2002 and 2008. In allcapital cities, average house and land pricesincreased faster than average incomes,resulting in declining affordability.In FY08, the typical price of a new housewas $240,000. Our modelling suggests that78 per cent of the market would face financialdifficulty in purchasing this typical product.Identifying how we can improveaffordabilityIn the past year we identified two areas wherewe have scope to improve affordability. Thefirst was introducing villa allotments – creatingdetached lots under 300 square metres.The second was to change our productmix, focusing on more affordable lot sizes,essentially lots under $200,000. Over the pastyear, lots between 375-650 square metresincreased from 49 per cent to 56 per centof sales.Lots priced under $200,000 increased from26 per cent to 44 per cent of sales, with thevolume of sales at this price increasing byover 100 per cent over this time.We also undertook a review of developmentpolicies to identify areas for costs savings sowe can reduce prices for our customers.Key outcomes from this included:types and to improve the transportabilityof builders’ standard house plans acrossdifferent projects and markets, rather thanhaving to amend designs or house andland packages for every development,remove particular elements acknowledgedas adding cost, without significant benefitto new housing construction.The Residential Communities business’ability to understand the impact of reducedhousing affordability on housing demand,and to quickly respond with product andoperational changes, has enabled homebuyers who were not able to enter the marketto do so and at the same time stronglycontributed to our market performanceover the past year.We have increased our market share inQueensland from an average of 11 per centin FY08 to approximately 16 per cent in FY09.In particular, we have extended our reach intothe First Home Buyer market.36<strong>Stockland</strong> Corporate Responsibility & Sustainability <strong>Report</strong> 30 June <strong>2009</strong>
RESPONDING TO OUR CUSTOMERS– RETIREMENT LIVINGIn early 2008 we conducted a survey of ourRetirement Living residents to measure theirsatisfaction and identify what we can doto improve it. The survey was posted to allhouseholds in the 19 established villages andwe achieved a response rate of 74 per cent.While the overall response was positive, with89 per cent of residents indicating they werevery happy living in their village, a numberof areas of inconsistent performance wereidentified, and we implemented four projectspecificaction plans in the following areas:interaction,We will be repeating the Residents’ Voicecustomer satisfaction study for RetirementLiving in the first half of FY10. This will allowus to measure how well we have respondedto our residents’ concerns.ENGAGING WITH OUR SUPPLIERSAs a developer, a large portion of our impacton people and the environment occursthrough our contractors and suppliers.These include, for example, builders and civilcontractors, security and cleaning serviceproviders. Despite our lack of direct controlover these activities, we can influence thedecisions made by our contractors onthe selection of materials and the workingconditions of their employees, by settingclear expectations.From March 2008 to July 2008, weconducted a pilot program to engage withour suppliers as part of our SustainableSupply Chain Management (SSCM) program,which aims to align our key suppliers toour CR&S values.The program ‘road tested’ the draft SSCMPolicy and draft Supplier Code of Conductand identified actions with our key suppliers.Suppliers completed a questionnaire oncorporate governance, environmentalmanagement and social governance.Ten key suppliers, identified by spend andcapability to align with our CR&S values intheir area of expertise, participated in this firststage. We originally said we would expandthis program by engaging with a further tenkey suppliers. However, following a reviewof the program in FY09 we decided to takea different approach.Our corporate procurement spendrepresents only around 10 per cent ofour total spend, with the majority of ourspend directed through our Residential andCommercial Property business units. In FY09we extended our engagement to reach thesesuppliers. For our Residential business unitthis includes builders and civil contractors,whilst for our Commercial Property businessthis includes waste, security and cleaningcontractors.Participating suppliers we engaged with wererequested to complete CR&S and health,safety and environment questionnaires andreturn them with their tender response. TheCR&S questionnaire enables the supplier toidentify their progress in respect of policies inareas such as waste management, resourceand environmental management, labourstandards and human rights and health andsafety. In FY09 the suppliers we engagedwith on CR&S covered the full range of oursupply spend with the combined spendtotalling $200.4 million.In our Commercial Property business unit,CR&S requirements are now included intenders and contract documentation forwaste, cleaning and security services.Engaging civil engineering contractorson sustainabilityA project to engage with our five highestspend civil engineering contractors oncorporate responsibility and sustainabilityin New South Wales, Victoria, Queenslandand Western Australia will begin in Julyand August <strong>2009</strong>. This project stemmedfrom working with these contractors on theNational Greenhouse and Energy <strong>Report</strong>ingScheme (NGERS) reporting requirementsfor our residentials and the FY09 CR&Scapability review.TOTAL SPEND OF SUPPLIERS WHO COMPLETEDOUR CR&S QUESTIONNAIRE IN FY09Business unitWe aim to meet with the five contractorsto determine the following:CR&S policies,we can assist,can we assist.On conclusion of the meetings we intendto develop mutually beneficial projects withthe contractors.Partnering with supplierson sustainabilityWe partner with suppliers on a regular basisto deliver outcomes around environmentalsustainability. Some of our partnershipsare with builders and subcontractors onGreen Star and NABERS Energy in officedevelopments.The Green Star As Built tool measures theenvironmental aspects of a project at thePractical Completion stage and requiresdocumentation from the consultants, owner,builder and subcontractors to demonstrateimplementation. Additionally, tracking thebuildings in operation to deliver energy andwater outcomes has led to our operationsteams working closely with subcontractors,builders and consultants.Spend ($ million)Commercial Property 62.4Corporate 11.9Residential and Retirement Living 126.1Total 200.4Performance management toolA performance management tool forsuppliers who provide services to our officeand industrial businesses was developedin late 2006 and formally implemented inMarch 2007. This tool systematically auditscompliance in the following areas:Performance Indicator (KPI) Adherence,(CR&S),The management tool has since beenreworked and ownership of the tool is with<strong>Stockland</strong>’s Commercial Property operatingteam, now encompassing retail shoppingcentres. The online tool was implementedin December 2008 and measures theperformance of cleaning, security, waste,fire and heating, ventilation and coolingequipment and service suppliers whoprovide services to our CommercialProperty portfolio.The CR&S aspect of the tool is customisedaccording to types of services provided.For example, cleaning service suppliers areperformance rated on waste managementand safety management.Labour standards and requirements arebased on national and/or local laws and arespecified in all tendering documentationand contracts.<strong>Stockland</strong> Corporate Responsibility & Sustainability <strong>Report</strong> 30 June <strong>2009</strong> 37
ContentsCommunity 38Community development 40Community involvement 42COMMUNITYWe’re committed to strengtheningour place within the community.38<strong>Stockland</strong> Corporate Responsibility & Sustainability <strong>Report</strong> 30 June <strong>2009</strong>
Community – Progress and prioritiesPERFORMANCE SUMMARYPastLast year, we said we would:PresentThis past year, we have:FutureIn the coming year, our prioritiesare to:<strong>Stockland</strong> Corporate Responsibility & Sustainability <strong>Report</strong> 30 June <strong>2009</strong> 39
COMMUNITYRESIDENTIALPROJECTS WITHA COMMUNITYDEVELOPMENTPLAN22 %COMMUNITYStrengthening our place within thecommunity is one of the five strategicthemes in our CR&S strategy.This includes:community development,program,We have been focusing on these areas byimplementing specific initiatives as well asbuilding internal and external understandingof our role in the community.Community information in this reportThe community development sectionincludes information on communityengagement in our developments and ourimpact on local and national economies.The community investment section detailsour Giving and Volunteering program andhow we are measuring our communitycontribution through the LondonBenchmarking Group.COMMUNITY DEVELOPMENTCommunity development is a priority in oursustainability strategy. We aim to createsustainable and vibrant communities thatthrive long after we have completed ourdevelopments. To achieve this we needto engage with the local community andother key stakeholders. This can lead tous adapting our projects in response toconcerns raised by the local community(see Point Lonsdale case study on page 19).It is also critical to the development ofcommunity and social programs on ourprojects (see East Village case study).Community development plansTo help us develop sustainable communitieswe have community developmentplans. At the end of FY09, 22 per centof our residential communities and twoRetirement Living projects had communitydevelopment plans in place. However, thereis inconsistency in how these plans aredeveloped and most are not documented.We recognise that we need to developa consistent approach to communitydevelopment and are therefore refiningcommunity development guidelines anddeveloping a toolkit for Residential andRetirement Living projects.Community development guidelinesOur Residential Communities businesscurrently implements various communitydevelopment initiatives in terms of bothbuilt infrastructure and social programs.We are aiming to replicate the initiativesthat have proven to be most successful inthe community and introduce world-classinitiatives founded from the Peter DalyInternational Fellowship of <strong>2009</strong> onsocial sustainability.Our development managers will beintroduced to the community developmentguidelines and a supporting toolkit at atraining program in the first quarter of FY10.The guidelines will be launched in thesecond quarter and will be piloted on ourNorth Lakes residential community. Theywill then be applied to the priority stakeholderprojects in our Residential Communities andRetirement Living projects over the courseof FY10.The guidelines set out how to gather socialresearch and require our projects to test theassumptions made from this informationwith community stakeholders. They provideadvice on how to create a sustainablecommunity that thrives after we finishdevelopment. The guidelines will enableus to:at each of our developments to ensurebetter outcomes for existing and futureresidents,approach to community development,community projects nationally,on current and future projects.OUR IMPACT ON LOCAL, REGIONAL AND NATIONAL ECONOMIESResidentialRetirementLivingNumber of jobs created directly by the project(Residential and Retirement Living only) 4,825 50Number of jobs created through construction andmaintenance work (Residential and Retirement Living only) 10,837 23340<strong>Stockland</strong> Corporate Responsibility & Sustainability <strong>Report</strong> 30 June <strong>2009</strong>
COMMUNITYCASE STUDYIn developing new communities, we need to beproactive in identifying the needs of the localand wider community.Proposed site of the East Village residential community, Clyde VictoriaEAST VILLAGE RESIDENTIALCOMMUNITY, VICTORIAEast Village is a residential communitywe are developing in Clyde, northof Melbourne, Victoria. The site is115 hectares and will comprise around1,200 lots when it is completed in 2016.The site was selected as a demonstrationproject in partnership with the GrowthAreas Authority (GAA) and the PlanningInstitute of Australia (PIA), with the Cityof Casey acting as a referral body. It isdesigned to exceed planning and designstandards. It aims to achieve liveabilityby featuring:interlinked street networks andwalking and cycling paths,neighbourhood activity centre,In developing this new community weneed to be proactive in identifying theneeds of the local and wider community.As such, we are engaging and consultingwith residents in the local City of Caseyregion, local councils, state and federalgovernment and other key stakeholders.A formal stakeholder engagement planwill be developed in FY10.We will seek ways to increase residentownership of the community. Whenpeople care about where they live theyoften share this experience with familyand friends and there is a stronger focuson community maintenance.The East Village project is launchinginto a highly competitive corridor. Ourcommunity development strategy willhelp to build awareness of this emergingcommunity. We will engage residentswithin the local government regionparticularly those within a 10km radiusof the East Village site, as they are theprospective neighbours and futureresidents of East Village.<strong>Stockland</strong> Corporate Responsibility & Sustainability <strong>Report</strong> 30 June <strong>2009</strong> 41
COMMUNITYCOMMUNITY INVOLVEMENTOur community investment programs provideus with the opportunity to make a positiveimpact in the communities in which weoperate. While our community developmentprograms focus on our role in shaping thedevelopment of vibrant and sustainablecommunities, our community investmentprogram has been developed by our peopleand is an important way for us to supporttheir interests, as well as contribute to ourlocal communities.Community consultation in the UKIn our 2008 CR&S report, we said we woulddevelop a more comprehensive plan forcommunity development and engagementacross our portfolio that would includeissuing a set of guidelines to cover all majordevelopments in the coming year. Wehave now developed a draft CommunityConsultation Plan which will be used to guidethe consultation process for our developmentprojects. In FY09 we did not have a projectreach an appropriate stage to enable this tobe piloted. In FY10 we hope to trial this if andwhen an appropriate project emerges.Our retail centres support a range of localcharities, sports teams and communityevents. Our on-site centre managers managetheir site-level community involvementactivities as they are best placed to identifylocal opportunities.In <strong>2009</strong>, we signed an agreement withHarlow Council to deliver a 1.3 million squarefoot mixed-use scheme to regenerateHarlow Town Centre North. The plannedredevelopment of this area is set to transformthe town centre, helping to improve thequality and attractiveness of shopping inHarlow. In July <strong>2009</strong>, we will launch a publicexhibition in the town centre to launch thedevelopment plan and seek public feedback.Following this consultation the planningapplication is expected to be submittedmid-2010. We are working closely withpublic sector stakeholders, including theHomes and Communities Agency and theEast England Development Agency.Our impact on local, regional andnational economiesAs one of the largest developers of residentialland in Australia our business operationsresult in the employment of people acrossthe country. The data we collected from ourResidential and Retirement Living businessesestimates that we have created over 4,800direct jobs and 11,000 indirect jobs throughconstruction and maintenance work. Werecognise that there were inconsistenciesin how this data was reported. In FY10 wewill be developing our data collection andreporting capacity in this area.Our Giving and Volunteering programOur Giving and Volunteering programincludes employee donations to charitableorganisations dollar matched by <strong>Stockland</strong>and participation of employees involunteering and mentoring activities.VolunteeringOver the past year we have emphasisedthe value of volunteering activities withour employees. They have respondedwell and participated in:Community Network programs (ABCN)and other similar mentoring programs,NUMBER OF HOURSEMPLOYEESCONTRIBUTEDTO COMMUNITYACTIVITIES4,800 hrsHours employees contributed to community activitiesFY09FY08 3,5004,800EMPLOYEESWHO TOOKPART IN TEAMVOLUNTEERINGDAYS338EMPLOYEES WHOVOLUNTEEREDDURINGSTOCKLAND TIME586TEAMVOLUNTEERINGEVENTS11EMPLOYEES WHOVOLUNTEEREDDURINGSTOCKLAND TIME44 %42<strong>Stockland</strong> Corporate Responsibility & Sustainability <strong>Report</strong> 30 June <strong>2009</strong>
STUDENTSMENTORED355EMPLOYEESINVOLVED INABCN MENTORPROGRAMS316Volunteering leaveIn FY09, we launched personal volunteeringleave. All Australian employees are entitledto two days per year to volunteer with a notfor-profitorganisation of their choice. Whilstsome employees have taken advantage ofthis, uptake has been slow. This could bedue to the economic environment and recentretrenchments, with employees perhapsnot wanting to be out of the office at thistime. Recognising that this could be a factor,senior management has been reinforcing thepersonal value of volunteering in employeecommunications.A volunteering leave policy was also launchedin our UK business, providing employeeswith one paid volunteering day a year.Volunteering days were organised in bothLondon and Scotland, with over 20 per centof our office-based employees choosing totake part. In the UK we also partnered withStarlight Children’s Foundation to ‘adopt’ thewish of a 14-year-old leukemia sufferer andsuccessfully raised the money to fund hiswish to meet the England rugby team.Mentoring studentsIn addition to the two days per year ofpersonal volunteering leave, employees areable to get involved in the local communityby mentoring students. In FY09, over 300employees mentored students from yearsone to 12 from 28 priority-funded schoolsin Australia. The mentoring is organised bythe Australian Business and CommunityNetwork, a partnership of business leadersand companies supporting mentoringand coaching programs. The studentsare mentored on topics including effectivecommunication, budgeting, career choices,literacy skills, and building confidence.<strong>Stockland</strong> contributions by category and contribution ($)Emergency Relief 177,950Environment 76,044How we measure ourcommunity investmentIn 2008, we began using the LondonBenchmarking Group (LBG) to measureand benchmark our community involvementthrough giving and volunteering, sponsorshipsand community development initiatives.We contributed more than 4,800 hours and$3.4 million in community investment in FY09.In our 2008 CR&S report, we said wewould improve reporting on communitycontributions. The LBG tool enables us tounderstand and improve the measurementand management of our communityinvestment. LBG outcomes are reportedback to leaders in the business annually,giving them insight into our key areas ofsupport and where we can improve. Ourkey areas of support are in education andyouth, health, community development,local sporting clubs and arts and culture.Community Development 11,005Sporting 9,580Spirit Awards Arts & Entertainment 26,109Health 822Seniors 104,860Business Developement 158,223 Employee – Giving and Volunteering 170,189VALUE OF CASH,IN-KIND AND TIMECONTRIBUTIONFOR FY09Sponsorship policy and guidelinesWe introduced a sponsorship policy anda guidelines toolkit in 2008 to help ouremployees differentiate between thedifferent kinds of contributions we make.The toolkit distinguishes between:objective is brand exposure,no expectation of commercial return,objective is to deliver direct developmentor business return,employee initiatives that are aligned toour people and our brand strategy andsupport employee engagement.The toolkit provides guidance on choosinga sponsorship that is aligned with our brandand policies. This will help employees makeinformed decisions about the sponsorshipswe support.COMMUNITYCASE STUDY<strong>Stockland</strong> volunteers at the Childhood Cancer Support, BrisbaneRENOVATING HOMES –PARTNERING WITH CHILDHOODCANCER SUPPORT, BRISBANEIn 2008, we partnered with ChildhoodCancer Support in Brisbane.Childhood Cancer Support is a notfor-profitorganisation which providesaccommodation, counselling andemotional and financial support tofamilies whose children are diagnosedwith cancer.Three teams of employees helpedrenovate four self-contained unitsat Childhood Cancer Support’ssite in inner Brisbane for families tostay during their child’s treatment.Over three days, 190 employeeshelped install new kitchens, upgradebathrooms, lay flooring and assemblefurniture. The garden also receiveda facelift with new plants, turf, abarbecue area and a cubby house.$3.4 m <strong>Stockland</strong> Corporate Responsibility & Sustainability <strong>Report</strong> 30 June <strong>2009</strong> 43Value of cash, in-kind and time contributionsFY09$3.4mFY08$1.7m
ContentsClimate change and energy 44Understanding climate change 46Regulation 48Energy efficiency in existing buildings 50Energy efficiency in new buildings 52Energy Metrics 53CLIMATE CHANGEAND ENERGYThe past year has been a periodof consolidation, improving ourreporting capability,understanding and addressingemerging regulation, andcontinuing to improve energyefficiency.44<strong>Stockland</strong> Corporate Responsibility & Sustainability <strong>Report</strong> 30 June <strong>2009</strong>
Climate change and energy – Progress and prioritiesPastLast year, we said we would:PresentThis past year, we have:FutureIn the coming year, our prioritiesare to: <strong>Stockland</strong> Corporate Responsibility & Sustainability <strong>Report</strong> 30 June <strong>2009</strong> 45
CLIMATE CHANGEAND ENERGYCLIMATE CHANGE AND ENERGYImproving energy efficiency and addressingclimate change risk is one of the key pillarsof our CR&S strategy. The past year hasbeen a period of consolidation, improvingour reporting capability, understandingand addressing emerging regulation, andcontinuing to improve energy efficiency. Thisyear we also updated our EnvironmentalPolicy, now referred to as our EnvironmentalCommitment, following extensive internalengagement. We have also gained a betterunderstanding of the physical impacts ofclimate change, and we have started toassess our risk and explore what we can doto mitigate this risk through adaptation.In this sectionThe climate change section details thework we are undertaking to understandand evaluate the risks and opportunitiesassociated with climate change.The energy efficiency and energy metricssections include information on our approachto energy efficiency and our energy andgreenhouse gas emission performance data.Our regulation page provides informationon the regulation relating to energy andclimate change we are responding to.NABERS Energy and Water ratings are alsoincluded in this report.UNDERSTANDING CLIMATE CHANGEWe are committed to better understandingand mitigating potential risks associatedwith climate change. According to theIntergovernmental Panel on Climate Change(IPCC), the impacts of climate change areappearing and further impacts are inevitable.Understanding emerging risks is key toensuring we own, manage and developresilient buildings and communities, ableto withstand the future impacts of climatechange.The IPCC’s Fourth Assessment reportpredicts that likely impacts on property willinclude more hot days, more frequent heavyprecipitation events and increased incidenceof extreme high sea level. If realised, theseimpacts would place greater demands onthe built environment. They will also requiresolutions to make buildings more resilient toextreme weather events, such as flooding,wind and heavy rain. We have also seenstate and local governments develop policypositions on sea level risk.AdaptationOur principal response to climate changeis to reduce emissions by improving energyefficiency across all assets. We also needto address the emerging physical risks ofclimate change and explore mechanismsof adaptation.We are engaging with specialists toexamine these physical risks. In late 2008,our insurance brokers briefed our CR&SBoard Committee on climate change risk.Our brokers shared data on recent severeweather events in Australia, and discussedrisk mitigation currently undertaken by ourorganisation. For example, our shoppingcentres in North Queensland at riskof cyclone impact. We have thereforeundertaken work on our centre roofs toimprove their capacity to withstand such aweather event. We will continue to reviewthe structural integrity of assets located inextreme climate zones.In addition, emerging government policyon sea level rise and the tragic Victorianbushfires of February <strong>2009</strong> led us tocommission research to:storm surge and possible sea level rise,of bushfire.We currently rely largely on local and stateplanning requirements when taking risks inrelation to flooding and fire. We expect thatthe findings of our research will inform a morestrategic view on these risks, and may leadus to adopt a ‘beyond compliance’ approach.46<strong>Stockland</strong> Corporate Responsibility & Sustainability <strong>Report</strong> 30 June <strong>2009</strong>
CLIMATE CHANGE AND ENERGYCASE STUDYFlood risk management, Sunshine Coast, QueenslandCALOUNDRA DOWNS ANDFLOOD RISK MANAGEMENTOur Caloundra Downs project is on the SunshineCoast of Queensland. Covering an area of 3,700hectares we expect that the project will be acommunity of over 20,000 homes, as well asmixed-use town centres, industrial precincts andnetworks of public open space and vegetationcorridors.To better understand the flooding characteristicsand potential risks for the site, we have engagedconsultants BMT/WBM to develop a hydraulicflood model and prepare a flood risk managementstrategy for Caloundra Downs.BTM/WBM analysed a range of climatevariances on flood management within the site.A conservative approach, however, has beenadopted to ensure that our planning aligns withthe current recommendations of the SunshineCoast Regional Council, being:(compared to present day estimates),We ran this model to a 2070 timeframe. Sincethe report was undertaken, the QueenslandGovernment has provided further guidanceon timeframes and impacts. We anticipateundertaking further climate risk analysis forCaloundra Downs in consultation with theQueensland Government and the Sunshine CoastRegional Council. This may include exploringpredicted sea level rise over a range of time scalesas climate risk policy across Australia, includingsoutheast Queensland, becomes more formalisedleading to the emergence of agreed climate riskassessment levels and methodologies.While we see flooding and fire as posingparticular risks for our Residential andRetirement Living businesses, we will alsoreview risks for our Commercial Propertybusiness to confirm the resilience ofour buildings to withstand the extremeweather events.Our approach to energy efficiencyand reducing greenhouse emissionsAs a property business we recognise thatenergy efficiency presents the biggestand most cost-effective means to reduceemissions.To help set targets for improved energyefficiency and reduced emissions, we beganwork on a carbon abatement cost curve.Put simply, this means understanding thoseactions that achieve the biggest emissionscuts at the lowest cost across our portfolio.Our cost curve is based on evidencefrom energy reduction projects to reduceemissions and energy use analysis acrossour portfolio.In FY08 we identified projects to reduceemissions and energy use as part of ourEnergy Efficiency Opportunities (EEO)reporting obligations, which identified 182potential projects across 17 of our properties.Methodology developed by an externalconsultancy, Kinesis, allowed us to identifyspecific abatement opportunities andthe specific costs of implementing thesemeasures. The methodology assesses theprojects over a period of four years anddemonstrates the average cost of abatementif each action is implemented cumulatively.We have incorporated the cost curvemethodology into our Climate Change ActionPlan target-setting function. This will enableus to set an emissions reduction target andhave an accurate, reality-based estimateof the costs associated with achieving thattarget. We will be able to quickly model thecosts of reducing emissions across our entirerange as well as at the individual asset level.Over the past year we have made asignificant reduction in greenhouse gasemissions, however this is due in part to thesale of assets and limited development offloor space. We have however continuedto achieve some improvement in energyintensity, demonstrating that our effortsare achieving real reductions.We are committed to significantly improvingenergy efficiency across our CommercialProperty portfolio. We track our performancethrough measuring energy and greenhousegas emissions intensity (per m 2 ), as well asattaining accredited NABERS ratings forour office buildings. We have set five yearintensity and NABERS ratings targets. Wealso recognise that we need to track ourabsolute emissions. Reducing our emissionsas our portfolio grows will prove challenging.We have set ourselves the target of reducinggreenhouse gas emissions intensity andenergy use intensity across our CommercialProperty portfolio by 20 per cent by FY14.We have also set a NABERS office energytarget of 4.5 stars by FY14. We anticipatethat this will enable us to maintain ourCommercial Property absolute greenhousegas emissions at or below FY09 levelsby FY14. This means that both our newand existing buildings will need to besustainably more efficient than current levelsto achieve this outcome. We anticipate thatour emissions profile will be lumpy duringthis time, reflecting our new developmentprojects.<strong>Stockland</strong> Corporate Responsibility & Sustainability <strong>Report</strong> 30 June <strong>2009</strong> 47
CLIMATE CHANGEAND ENERGYREGULATIONThe past 12 months have seen a significantlevel of new environmental legislationintroduced in the Australian and UKmarkets. For more information on howwe are engaging with government, pleaserefer to the government relations section(page 8). The regulations that affect ourbusiness include:National Greenhouse and Energy<strong>Report</strong>ing System (NGERS)The National Greenhouse Emissions<strong>Report</strong>ing Act (NGERA) is a national systemfor reporting greenhouse gas emissionsand energy consumption and production bycorporations. During FY09 we have soughtadvice as we prepare for our first NGERSreport in October <strong>2009</strong>, accounting for ouremissions in FY09. Our preparation hasincluded:We have engaged our developmentmanagers and facility managers and manyof our impacted contractors to make themaware of these new reporting requirements.Energy Efficiency Opportunities(EEO) Act, 2006The EEO Act aims to improve theidentification and evaluation of energyefficiency opportunities by large energy-usingbusinesses and encourages implementationof cost-effective opportunities. In 2007, weregistered for EEO participation and set outa reporting schedule. Our reporting schedulewas approved by government in 2008 andwe commenced training and identification ofopportunities to implement energy efficiencyinitiatives across our retail and officeportfolios. We have continued identifyingopportunities and have implemented someof these initiatives.CLIMATE CHANGE REGULATIONMarkettransformationRenewable/decentralisedenergySkillsBuildingcodesFederalgovernmentenergy efficiencyprograms forthe builtenvironment<strong>Report</strong>ingRatingtoolsIncentivescollection system, known as our ClimateChange Action Plan (CCAP) tool,that all data sets are being captured by ourdata system,of the NGERA to our organisation,an ‘Industry View Document’ to assistwith the interpretation of the NGERA andthe implementation of NGERS reportingfor property organisations and thosecontracting to property organisations.Our EEO report is available on our website,and we submitted our first formal report togovernment in December 2008.InnovationAppliancesGovernmentprocurement48<strong>Stockland</strong> Corporate Responsibility & Sustainability <strong>Report</strong> 30 June <strong>2009</strong>
Planning approvals and climate changeassessmentClimate change assessments, particularly inrelation to floodplain risk management, areincreasingly expected as part of the planningapproval process for property developmentin Australia. The Victorian coastal strategynow requires consideration of sea level riseas part of planning assessment, proposing aminimum 100 year sea-level rise estimate of80cm be applied for planning purposes. TheNew South Wales Government has prepareda draft sea level risk policy statement, andincludes reference to benchmarks of a riserelative to 1990 of 40cm by 2050 and 90cmby 2100. Similar statements and policies arebeing developed by other local and stategovernments. The federal government is alsoexploring policy related to climate changeadaptation, specifically sea level risk andstorm surge.Building Code of Australia (BCA)– draft amendmentsThe BCA has established minimumrequirements for energy efficiency in newbuildings. Some specific requirements varyfrom state to state. Significant draft changesto the BCA’s energy efficiency provisionswere announced in June <strong>2009</strong>. Proposedchanges to the code include requirements forincreased energy efficiency performance andrequirements for renewable energy. We arecurrently engaging with peers and industrygroups to better understand the implicationsof the proposed changes.State-based residential energyefficiency requirementsThe developments of our ResidentialCommunities, Apartments and RetirementLiving businesses are subject to a range ofenergy efficiency requirements. These statebasedrequirements vary in focus, leadingto different built form outcomes in differentstates, for example:Victoria’s 5 Star standard for new housesresults in design solutions concernedmostly with the performance of thebuilt fabric.New South Wales’s BASIX tool resultsin solutions concerned with the energyperformance of the house, encompassingboth the thermal performance of the builtform as well as the selection of technologysuch as energy efficient lighting, cooling/heating and water heating. The tool allowsfor more flexible design responses at lesscost, while ensuring overall emissions arereduced.Council of Australian Governments(COAG) strategy on energy efficiencyThe Draft Strategy on Energy Efficiency wasreleased by the COAG on 30 May <strong>2009</strong>.Aspects of the draft strategy with significantimplications for us include:standard setting and performanceassessment frameworks,energy performance in existing commercialbuildings (to be phased in from 2010),eco-efficiency performance of residentialbuildings at point of sale (to be phased infrom May 2011, commencing with energy),for residential to 6 Stars nationally(commencing 2010).The draft sets out the intent of proposalsonly. There is significant work yet to bedone in setting out the detail of legislationand how it will be implemented. There isreference however to improving existingrating tools, providing a harmonised nationalfocus, and improving metrics with a focus ongreenhouse emissions and energy efficiency.We welcome the proposed improvementsand will continue to engage with government,sharing our views and experiences towardsthe effective development of standards andsimplified disclosure protocols.UK Carbon Reduction Commitment(CRC)The CRC is the UK’s first mandatoryemissions trading scheme, supporting thegoals of the UK Climate Change Act. It isestimated that around 5,000 organisationswill initially fall within the scope of the CRC.The scheme is compulsory for organisationsusing more than 6,000MWh/year of halfhourlymetered electricity. The intention of thelegislation is to encourage large organisationsto reduce their fixed source energyconsumption.Commencing in April 2010, the CRC willrequire companies to purchase carbonallowances to cover their projected carbonemissions for each coming 12 month period.At the close of each period, companies willbe required to disclose their actual electricityusage. Organisations will then be rankedaccording to energy efficiency achievement,with revenue from the scheme redistributedto participants based on this performance.To prepare for emerging emissionsregulation, our UK business commencedcollating and reporting on carbon data in2008. Under the CRC we will be required tocommence energy use disclosure for thoseassets where we have half-hour metersin 2010. We are reviewing whether we willbe fully captured by the CRC, requiringparticipation in the trading scheme.UK Energy Performance Certificates(EPCs)As of 1 October 2008, all our UK buildingsrequire an EPC when bought, sold or leased.Larger public buildings are also requiredto display an energy certificate. With allcommercial buildings rated against the samescale, the legislation provides a standardfor potential tenants and purchasers touse to compare the ‘energy efficiency’ ofone building against another. Though thelegislation is still relatively new, it is intendedto create a market for more environmentallysustainablebuildings.We continue to be fully compliant with thislegislation, with EPCs performed for 29 ofour assets to date (either in whole or part).<strong>Stockland</strong> Corporate Responsibility & Sustainability <strong>Report</strong> 30 June <strong>2009</strong> 49
CLIMATE CHANGEAND ENERGYTOTAL STOCKLANDAUSTRALIAEMISSIONS (NGERABOUNDARY) FY09(kgCO 2 )*145,368,987TOTAL STOCKLANDUK EMISSIONS FY09(kgCO 2 )13,189,680* NGERA boundary includes all <strong>Stockland</strong> Australia Scope 1 andScope 2 emissions, emissions from vehicle hire and Residentialemissions.50ENERGY EFFICIENCY IN EXISTINGBUILDINGSThe energy used in our existing portfolio ofbuildings is a significant contributor to ourcarbon footprint. We are therefore committedto improving energy efficiency in thesebuildings, as well as our new developments.Regulation, in the form of the FederalGovernment’s Energy EfficiencyOpportunities Act (EEO), has led to areview of energy efficiency opportunitiesbeing undertaken across our CommercialProperty portfolio. The EEO program requirestechnical energy savings evaluations and theimplementation of a continuous improvementprocess. Our office and retail assetsparticipate in the program and assessmentsare undertaken on selected sites on a rollingannual basis.Opportunities with paybacks of four yearsor less are investigated and considered forinclusion in operating and capital budgets.More information on energy efficiencyregulation can be found in the regulationsection (page 48 – 49).Energy efficiency in existing buildingsOfficeWe use NABERS as a tool to benchmarkbuilding energy performance and to helpus develop asset action plans. NABERS isa performance-based ratings system thatmeasures existing buildings’ environmentalperformance during operation.<strong>Stockland</strong> Corporate Responsibility & Sustainability <strong>Report</strong> 30 June <strong>2009</strong>In FY08 we committed to achieving aNABERS Energy portfolio average rating of3.5 Stars for the 2008 calendar year, anddeveloped action plans for strategic assetswith a NABERS rating of less than that target.The plans aim to improve their performancethrough capital investment in energy-savingtechnologies such as lighting controls orvariable speed drives on electric motors.Ultimately we achieved a NABERS Energyportfolio average rating of 3.4 Stars for 2008.In improving the average of entire portfoliowe have faced the challenge of progressivelyexpanding the portfolio of buildings weinclude in our average rating. We originallyset our 3.5 Stars NABERS Energy portfolioaverage target for a smaller portfolio ofbuildings, which have since achieved a3.6 Stars NABERS Energy portfolio average.We broadened our targets in last year’sreport to include all <strong>Stockland</strong> managedbuildings, and this year in response to theNational Greenhouse and Energy RatingSystem (NGERS) we are broadening targetsto include all buildings for which we have‘operational control’ under the NGERSlegislation. Forty-nine per cent of thisNGERS-defined portfolio is included in ourNABERS Energy portfolio average, and weare working to improve this proportion overthe next 12 months. We have set a mediumtermtarget of a 5 Stars NABERS officeEnergy portfolio average by FY14.As NABERS results are calendar yearbased, we also set intensity targets basedon financial year performance. In our FY08report we committed to reducing the energyintensity of our office portfolio by 8 per centin FY09. We achieved this target with a10 per cent reduction in energy intensityfor all assets within our NGERS boundary.Green Building FundThe Green Building Fund is a federalgovernment program to help commercialoffice buildings reduce their energyconsumption and greenhouse gas emissions.Grants from the Green Building Fund are usedto refit commercial office buildings with moreenergy-efficient fittings to help reduce energyconsumption. Applications for 452 FlindersStreet, 175 Castlereagh Street and GardenSquare in Sydney were successful. The workswill be completed in FY10.RetailWe measure the energy efficiencyperformance of our retail centres throughmonthly energy usage reports. We undertookenergy audits of 19 retail centres in FY08,and as a result have implemented initiativessuch as installing energy-efficient lighting incar parks and malls which will result in anapproximate reduction of 8 per cent of ourtotal base building energy use over theperiod FY07 to FY09.Despite this improvement, we still have morework to do to meet our targets. Last year wemade a commitment to reduce our energyconsumption by 5 per cent, and whilst thiswas achieved for overall usage, we onlyachieved a 3 per cent reduction in electricityand greenhouse gas emissions intensity. Thegreater reduction in overall consumption isdue to a reduction in the size of the portfolioover FY09.Raising the environmental performanceof our entire portfolioWe are committed to minimising theenvironmental impacts of our propertiesand projects and raising the environmentalperformance of our entire portfolio, ratherthan developing isolated green flagships.Our goal is to embed a consistent approachto environmental management across theorganisation.This means driving energy and waterefficiency and reducing consumption acrossthe lifecycle of our properties and projectsincluding:The following case studies highlight someof the energy efficiency initiatives we haveundertaken at the different stages of thelifecycle in the reporting period. As a developerof new and existing sites, we have a significantcapacity to shape environmental outcomes.For sites we manage, our main contributionis in working with tenants to increase energyefficiency.
CLIMATE CHANGE AND ENERGYCASE STUDIESEnergy efficiency in our UK portfolioIn the UK we have continued to collectdata to monitor the carbon footprint for the23 highest energy-consuming assets in ourportfolio. We are now identifying ways toreduce this consumption and have engagedconsultants to carry out independentsustainability audits across our assets. Therecommendations from these audits form thebasis for asset-specific sustainability planswhich document the sustainability activitiesthat will be undertaken in the coming yearto reduce the energy, water and wasteconsumption of the asset. In the year to June<strong>2009</strong>, 10 audits were conducted, with morescheduled for the coming year.The sustainability audits were one of thesuggestions from workshops held with ourasset management and major projects teamsin FY09. The workshops aimed to engage theteams in emerging and current environmentalregulations, broader industry practices andhow our UK business should respond. Theoutputs from the workshops are being usedto shape our strategy.Stockhome and Tri-generationSites we redevelop – Stockhomeand Tri-generationIn December 2008, our Sydney office,Stockhome, achieved 6 Star GreenStar Office Interiors v1.1 as awardedby the Green Building Council ofAustralia. This was the first officeto achieve the ‘World Leadership’ranking in this tool and Minister forEnvironment, Heritage and Arts,Peter Garrett, came to our office toannounce the certified rating.A major innovation in theredevelopment was the installation ofa tri-generation plant, which beganoperating in May <strong>2009</strong>. Tri-generationis where a gas-fired generatorproduces electricity on-site, and thewaste heat is used to provide heatingand cooling. The tri-generationplant has the capacity to reduceour greenhouse gas emissions by1,100 tonnes of CO 2per year. Wewill commence reporting annualperformance data in our FY10 report.Stockhome also achieved a5 Star NABERS Energy rating as partof the City Switch program (using17 per cent green power as the trigenerationplant was not operationalin 2008). Analysis completed by theUniversity of Technology in Sydneyfound that 92 per cent of employeesrated the environmental featuresof Stockhome as important tothem. Perceived productivityincreased to 7.21 per cent from-2.38 per cent as a result ofemployees perceptions of theirworkspace.The Melbourne office is currentlyfinalising its Green Star OfficeInteriors assessment. As theGreen Star Interiors tool rates theas-built design, and due to thecomplexity of fit-outs, we havediscovered that these ratings aretime consuming to complete.Sites that we manage –Forster Retail CentreLocated on the mid-Northcoast of New South Wales, wepurchased Forster in 2003, andbegan redevelopment in February2006. The redevelopmentprovided an opportunity for us tooptimise energy efficiency withinthe centre.Through the implementation ofsimple measures, energy usagedramatically improved withina short time. The measuresincluded:Forster Retail Centre, New South Walesscheme. The developmentteam designed the centreso that it would harness theprevailing breezes through highlevellouvers to draw out hotair and cool the centre withoutthe need for any additionalmechanical cooling.As a result, energy usage ismuch lower than a conventionalmechanically-ventilated centreof a similar size.that signage, lights in the carpark, and inside the centrewere turned off after tradinghours.Energy figures were recordedfrom July to December 2007to form a baseline set of data.The monthly figures averaged55,507kWh. After optimisingenergy usage, further figureswere calculated from Januaryto June 2008 to give a monthlyaverage usage of 41,336kWh,which is a reduction of14,171kWh. This equates to a25 per cent reduction andsavings of approximately $9,910over the six month period.<strong>Stockland</strong> Corporate Responsibility & Sustainability <strong>Report</strong> 30 June <strong>2009</strong> 51
CLIMATE CHANGEAND ENERGYCLIMATE CHANGE AND ENERGYCASE STUDIESTriniti, North Ryde, New South WalesENERGY EFFICIENCY IN NEWBUILDINGSThe major contributor to our carbon footprintis energy used in the buildings we own andmanage as part of our Commercial Propertybusiness. Improving our energy efficiency isan important consideration in both our newdevelopments and our existing portfolio ofbuildings.OfficeOur Commercial Property business hascommitted to a minimum NABERS Energyratings of 4.5 Stars for new office buildingsand major refurbishments. Specificationsfor energy-efficient plants and equipmentare now written into project briefs for newbuildings and major refurbishments. Wherebetter outcomes can be achieved foradditional capital investment, cost benefitanalysis is undertaken. Payback periods forinvestment in energy-efficient technologiesconsider improvement to NABERS Energyratings and reduced operating costs as partof the decision-making process. Electricitysub-metering systems are specified for allnew office developments and are installed atselected properties to monitor electricity andgas usage and enable facility managers tobetter manage energy use on the site.RetailEnergy ratings for shopping centresremain in development. We work with theGreen Star Retail Tool to guide our designdecisions, particularly around energyefficiency. We have provided feedbackto the Green Building Council of Australia(GBCA) regarding the operation of the energycalculator and other aspects of this new tool.As refinements are made to the tool, wehope to adopt it as a standard by whichwe undertake retail development.Additionally, the Department of Environmentand Climate Change is working on aNABERS Energy rating for retail and weare on the Technical Working Group.Our UK portfolioIn the year to June <strong>2009</strong>, two developmentprojects were completed. One of these,1 Tudor Street, has been certified asachieving a BREEAM Very Good rating.The BRE Environmental AssessmentMethod (BREEAM) is a measurementrating for green buildings, developed inthe UK. Our development at St AndrewSquare, Edinburgh, is being targeted at aBREEAM Excellent rating. We will continueto seek formal BREEAM assessments of allcompleted development projects.TRINITIOur new office development in NorthRyde, Triniti, has been designed to achievea 4.5 Star NABERS Energy rating andhas been registered for a Green Starrating. This development is being built intwo stages with Buildings A and B beingsubmitted for their first round Green Starin early FY10, whilst Building C will becompleted in December <strong>2009</strong>.The builder, Baulderstone, is its majortenant in Building A, occupying 6,000square metres. This development allowsBaulderstone to showcase their buildingcapabilities whilst creating its new home.We have worked with Baulderstone ona number of developments includingthe award-winning Optus development,the Triniti development, and theredevelopment of the Edmund BartonBuilding in Canberra.66 WATERLOO ROAD66 Waterloo Road is a 10,000m 2 officebuilding located in Sydney’s MacquariePark. It was built as a ‘typical’ officebuilding with a standard variable airvolume air-conditioning system rather thanchilled beams or a tri-generation system,and was originally designed to achieve a4 Star NABERS Energy rating. Half waythrough design, the targets were changedto achieve a 4.5 Star NABERS Energyrating.In the first 12 months of occupation, thebuilding surpassed 4.5 Star performanceand, with some further building tuningto improve operational performance,achieved 5 Star performance in January<strong>2009</strong>. 66 Waterloo Road demonstrateshow a typical office building can betransformed into an energy efficientand well run building through goodcommissioning, controls and management.66 Waterloo Road, Macquarie Park, New South Wales52<strong>Stockland</strong> Corporate Responsibility & Sustainability <strong>Report</strong> 30 June <strong>2009</strong>
Climate change and energy – Energy MetricsGREENHOUSE GAS EMISSIONS (absolute)Global <strong>Stockland</strong> emissions FY09 (kgCO 2) 158,516,562Australia (including Residential) 145,326,882UK 13,189,680Total <strong>Stockland</strong> Australia greenhouse gas emissions NGERS boundary FY09 (kgCO 2) 145,368,987TOTAL GREENHOUSE GAS EMISSIONS – AUSTRALIA (kgCO 2) excluding ResidentialGlobal <strong>Stockland</strong> emissions FY09 (kgCO 2 )Australia145,326,882UK 13,189,680Scope 1 and Scope 2 emissions.FY09 total 158,516,562Greenhouse gas emissions – Australia (kgCO 2 )FY06 FY07 FY08 FY09Scope 1 + Scope 2 139,279,841 139,385,591 132,439,692 123,016,882*Scope 1 3,500,090 3,323,881 3,201,338 3,016,281Scope 2 135,779,751 136,061,710 129,238,354 120,000,601* Notes: Scope 1 and Scope 2 emissions (excluding Residential and Retirement Living). Correction from Shareholder Review <strong>2009</strong>.FY09FY08FY07FY06Excluding ResidentialScope 1 and Scope 2123,016,882132,439,692139,385,591139,279,841SCOPE 1 EMISSIONS (kgCO 2) FY06 FY07 FY08 FY09Office gas 2,549,324 2,489,555 1,937,412 1,759,961Industrial gas Not reported Not reported Not reported 20,597Retail gas 517,766 262,932 262,380 40,455Vehicle fleet 433,000 571,395 1,001,546 287,548Refrigerants Not reported Not reported Not reported 907,720Total 3,500,090 3,323,881 3,201,338 3,016,281SCOPE 2 EMISSIONS (kgCO 2) FY06 FY07 FY08 FY09Corporate tenancies Not reported Not reported Not reported 1,558,899Office 68,134,207 69,544,494 66,238,591 62,487,006Industrial 5,030,872 5,223,895 2,878,686 99,391Retail 62,312,820 61,293,321 60,121,076 55,855,304Electricity Total 135,779,751 136,061,710 129,238,354 120,000,601SCOPE 3 EMISSIONS (kgCO 2) FY06 FY07 FY08 FY09Total transmission and production lossesfrom purchased electricity and gas andfuel for vehicle fleet22,749,024 22,702,571 21,248,048 19,718,223Car hire Not recorded 66,572 79,460 42,105Air travel 783,400 1,099,714 1,078,377 1,070,393Total 23,532,424 23,868,857 22,405,885 20,830,721Notes: All data excludes Residential and Retirement Living Scope 1, 2 and 3 emissions, unless otherwise stated.Scope 1 greenhouse gas emissions (kgCO 2 )FY093,016,281FY083,201,338FY073,323,881FY06 3,500,090Excluding ResidentialScope 2 greenhouse gas emissions (kgCO 2 )FY09120,000,601FY08129,238,354FY07136,061,710FY06135,779,751Excluding ResidentialScope 3 greenhouse gas emissions (kgCO 2 )FY0920,830,721FY0822,405,885FY0723,868,857FY0623,532,424Excluding Residential<strong>Stockland</strong> Corporate Responsibility & Sustainability <strong>Report</strong> 30 June <strong>2009</strong> 53
CLIMATE CHANGEAND ENERGYResidentialEmission estimates (kg CO 2-e)Residential Development 19,728,000Retirement Living 2,582,000Methodology: This report uses the Australian Government’s Department of Climate Change National Greenhouse Accounts (NGA) Factors Workbook(November 2008) to calculate Scope 1, 2 and 3 emissions from the following sources:The <strong>2009</strong> WRI Workbook CO 2Mobile (version 1.3) has been used to calculate emissions from air travel. The 2003 Workbook was used to derive the mediumhaul emissions factor.Scope 1 incorporates fuel use in our vehicle fleet, gas burned in our office, industrial and retail assets and refrigerant emissions.Scope 2 covers base-building electricity purchased for our office, industrial and retail assets and our corporate tenancies.Scope 3 covers transmission and production losses from purchased electricity, gas and fuel and emissions from employee travel (flights and car hire).Emissions from <strong>Stockland</strong>’s UK operations are calculated according to the UK Government’s DEFRA / DECC Greenhouse Gas Conversion Factors forCompany <strong>Report</strong>ing. We have used 2007 grid factors for electricity, and 2007 GCV factors for gas.Emissions boundaryNotes: All figures are Australian operations only, unless otherwise stated. For FY09 we are reporting according to our ‘operational control’ boundary under theNational Greenhouse and Energy <strong>Report</strong>ing Act (NGERA). We report on the base-building electricity and gas consumption and the resulting greenhouse gasemissions from the office, industrial and retail assets for which <strong>Stockland</strong> has operational control. Tenant usage is not included, except where <strong>Stockland</strong> is thetenant. The GHG emissions from <strong>Stockland</strong>’s four largest office tenancies were 1,621,578 kg of CO 2for calendar year 2007. This figure has not been includedin the above totals. <strong>Stockland</strong>’s tenancy consumption for FY09 has been included in the above data. A number of industrial properties with immaterial energyconsumption have been excluded from this report. These properties are included in our NGERA boundary and will be reported on in our NGERA report.<strong>Stockland</strong>’s UK emissions and energy data is collected for assets whose energy budget is greater than $5000 a year. Data is from invoices, and is 85 per centcomplete for electricity and 77 per cent complete for gas. We have extrapolated 12 months worth of data from those figures.IntensityThe most appropriate measure of emissions intensity is on a per square metre basis for the individual asset classes.54<strong>Stockland</strong> Corporate Responsibility & Sustainability <strong>Report</strong> 30 June <strong>2009</strong>
INTENSITYThe most appropriate measure of emissions intensity is on a per square metre basis for the individual asset classes.GHG EMISSIONS INTENSITY (kgCO 2/m 2 ) FY06 FY07 FY08 FY09Office 136.6 127.8 113.3 103.8– Floor area (NLA) of buildings in intensity metric (m 2 ) 524,618 570,091 527,511 508,342– Floor area in intensity metric (%) 76%Retail 88.6 82.3 77.2 74.6– Floor area (GLA) of buildings in intensity metric (m 2 ) 709,490 748,437 784,846 735,733– Floor area in intensity metric (%) 97%Boundary: We use the same ‘operational control’ boundary for our intensity figures as we use for our total figures.Electricity and gas consumption for those assets for which <strong>Stockland</strong> has operational control are divided by the floorarea of those assets. Only assets with a full 12 month data set for electricity consumption are included. Due to thelimited number of industrial properties under our NGERA operational control boundary, we have not included anintensity metric for our industrial portfolio.OFFICE GHGEMISSIONSINTENSITYFY08-098 %RETAIL GHGEMISSIONSINTENSITYFY08-093 %Office greenhouse gas emissionsintensity (kgCO 2 /m2)FY09FY08FY07FY06FY09FY08FY07FY06103.8113.3GHG emissions for office assets dividedby the leased floor area of these assetsRetail greenhouse gas (GHG)emissions intensity (kgCO 2 /m2)74.5GHG emissions for retail assets dividedby the leased floor area of these assets127.877.2136.682.288.6GHG INTENSITY REDUCTION (%) FY06-07 FY07-08 FY08-09 FY06-09Office 6% 11% 8% 24%Retail 7% 6% 3% 16%PURCHASED ELECTRICITY (kWh) FY06 FY07 FY08 FY09Corporate tenancies Not reported Not reported Not reported 1,655,224Office 75,460,030 77,526,965 73,337,524 68,639,145Industrial 5,030,872 4,928,202 2,715,742 108,900Retail 67,071,111 66,085,690 64,762,680 60,110,466Total 147,562,013 148,540,858 140,815,946 130,513,736Boundary: Data is from Australian operations only. This data captures 100 per cent of base-building electricitypurchased for all office, industrial and retail assets owned and managed by <strong>Stockland</strong> for FY06, FY07 and FY08.For FY09 we have reported against an ‘operational control’ boundary. We report on the base-building electricityconsumption of the office, industrial and retail assets for which <strong>Stockland</strong> has operational control. Tenant usage isnot included, except where <strong>Stockland</strong> is the tenant. The electricity consumption of our four largest office tenancieswas 1,701,058 kWh in calendar year 2007. This figure has not been included in the above totals. <strong>Stockland</strong>’s tenancyconsumption for FY09 has been included in the above data.ELECTRICITYCONSUMPTIONPurchased electricity (kWh)FY09130,513,735FY08140,815,946FY07148,540,858FY06147,562,013Base building electricity for office, industrialand retail assets and corporate tenancies7 % <strong>Stockland</strong> Corporate Responsibility & Sustainability <strong>Report</strong> 30 June <strong>2009</strong> 55
ELECTRICITY INTENSITY (kWh/m 2 ) FY06 FY07 FY08 FY09Office 144.0 135.9 121.8 109.8– Floor area (NLA) of buildings in intensity metric (m 2 ) 524,618 570,091 527,511 508,342– Portfolio covered in intensity metric (%) 76%Retail 94.5 88.3 82.8 80.1– Floor area (GLA) of buildings in intensity metric (m 2 ) 709,490 748,437 784,846 735,733– Portfolio covered in intensity metric (%) 97%Boundary: We use the same ‘operational control’ boundary for our intensity figures as we use for our absolutefigures. Electricity consumption for those assets for which <strong>Stockland</strong> has operational control is divided by the floorarea of those assets. Only assets with a full 12 month data set are included.ELECTRICITY INTENSITY REDUCTION (%) FY06-07 FY07-08 FY08-09 FY06-09Office 6% 10% 10% 24%Retail 7% 6% 3% 15%OFFICEELECTRICITYINTENSITY10 %RETAILELECTRICITYINTENSITY3 %Office electricity intensity (kWh/m²)FY09109.8FY08121.8FY07135.9FY06144.0Floor Area (NLA) of buildings in intensity metric (m²)Retail electricity intensity (kWh/m²)FY0980.12FY0882.8FY0788.3FY0694.5Floor Area (GLA) of buildings in intensity metric (m²)GAS CONSUMPTION – TOTAL AUSTRALIAN (MJ) FY06 FY07 FY08 FY09Office 49,278,237 48,300,919 37,766,323 34,287,190Industrial Not reported Not reported Not reported 401,271Retail 9,977,497 5,114,614 5,114,614 788,136Total 59,255,734 53,415,533 42,880,937 35,476,597Boundary: We report on gas purchased for all office, industrial and retail assets owned over which <strong>Stockland</strong> hasoperational control. We report this data as a total for <strong>Stockland</strong>, as well as totals for our office, industrial and retailportfolios, to enable comparison of the performance of the different asset classes over time.Gas consumption (MJ)FY09 35,476,597FY0842,880,937FY0753,415,533FY0659,255,734UK RESOURCE CONSUMPTION (kWh) FY08 FY09Electricity 18,382,509 21,342,126Gas Not reported 8,713,933Electricity and gas consumption data is collected for assets whose energy budget is greater than £5,000 a year.Data is from invoices, and is 85 per cent complete for electricity and 77 per cent complete for gas. We haveextrapolated 12 months worth of data from those figures. Our electricity data has a confidence factor of 61.25 per centfor FY08.56<strong>Stockland</strong> Corporate Responsibility & Sustainability <strong>Report</strong> 30 June <strong>2009</strong>
Energy data for Commercial PropertyThe creation of Commercial Propertyresulting from the consolidation of our retail,office and industrial businesses has providedus with the opportunity to streamline ourdata processes. Harmonisation has beenundertaken to produce a single CommercialProperty data report for data submission.The assets are still benchmarked separately,which is appropriate due to their natureand usage profiles. However, the reportingundertaken for operational assets has beensimplified, and is accessible to the entireCommercial Property business. The energyratings for our office portfolio has becomea particular market focus, and businessstrategies based on the energy data havebeen created for critical sites showing greaterimplementation of environmental data intobusiness decision making.Energy data for Residential andRetirement LivingFY09 is the first year that we have collectedand reported greenhouse and energy datafor our residential assets. This has beendriven by our responsibility to report underthe National Greenhouse and Energy<strong>Report</strong>ing (NGER) Act. The estimatesprovided have included a combination ofsite sampling, emissions assumptions andestimates and extrapolation. We recognisethat we need to significantly improve theaccuracy of our emissions reporting.Emissions estimates for FY09 by businessare outlined in the table opposite. Insummary, our total emissions for theResidential business in the current financialyear is approximately 19,700 tonnes ofCO 2-e (carbon dioxide equivalent). Thetotal emissions from the four RetirementLiving properties that we have determinedoperational control for is 2,582 tonnesof CO 2-e.Residential emission estimates (kgCO 2 )ResidentialBusiness unitRESIDENTIALRETIREMENT LIVING19,728,000Retirement Living 2,582,000Data collectionData collected at Lakewood, North Lakes,St Augustine and Newhaven for our ownactivities and for contractor operations.Average emissions per lot from these sites havebeen used to extrapolate across remainingassets. Calculated on number of lots registeredas being developed for FY09 in our contracttracking system.Data collected from invoices and contractorsfor each of the four sites.Emissionestimates(kgCO 2-e)19,728,0002,582,000FY10 reporting improvementsEmissions from our contractors will becaptured via monthly health, safety andenvironment (HS&E) reporting. We have runa pilot with civil contractors from Queenslandand NSW for the monthly HS&E reportingin June and will use the outcomes of thispilot to inform the roll-out of reporting to allprojects and contractors for which we have areporting obligation in July <strong>2009</strong>. Contractorsare required to report all NGER data includingelectricity, gas, fuel and use of explosivesas well as reporting on water use and wastemanagement.Our own emissions on projects will becollected through our accounts managementtool. Our electricity, gas and fuel invoices willrequire consumption figures to be enteredbefore payment is approved. This is likely tobe implemented by early 2010.<strong>Stockland</strong> Corporate Responsibility & Sustainability <strong>Report</strong> 30 June <strong>2009</strong> 57
ContentsNatural resources 58Biodiversity 60Water 62NABERS Office Energy and Water ratings 65Waste 67NATURALRESOURCESOur approach to natural resourcesmanagement includes treeprotection and bush regeneration,water and ground-water monitoringand protection, biodiversity offsetsand construction environmentalmanagement.58<strong>Stockland</strong> Corporate Responsibility & Sustainability <strong>Report</strong> 30 June <strong>2009</strong>
Natural resources – Progress and prioritiesPastLast year, we said we would:PresentThis past year, we have:FutureIn the coming year, our prioritiesare to:<strong>Stockland</strong> Corporate Responsibility & Sustainability <strong>Report</strong> 30 June <strong>2009</strong> 59
NATURALRESOURCESNATURAL RESOURCESThe effective management of our use of, andimpact on, natural resources is one of the keypillars of our CR&S strategy. This includes:consumption,on biodiversity,We have been focusing on these areas byimplementing specific initiatives as well asbuilding internal and external understandingof our consumption of natural resources.Our Residential and Retirement Livingbusinesses spent over $54 million onenvironmental protection and managementmeasures in FY09, with the majority of spendgoing towards natural resource management.Measures include tree protection and bushregeneration, water and ground-watermonitoring and protection, biodiversityoffsets and construction environmentalmanagement.Natural resources informationin this reportThe water section describes our progresstowards reducing water consumptionacross all our projects.The biodiversity section explores some ofthe biodiversity challenges we face in ourprojects, and describes the approach weare taking to mitigate our impact.The waste and materials section describesthe way we are working with our buildersand suppliers to minimise the environmentalimpact of the materials we use in our projects.NABERS Energy and Water ratings are alsoincluded on pages 65 and 66 in this report.BIODIVERSITYBiodiversity is important to us as we developgreenfield sites that can vary from farms andagricultural lands to sites that include forestand bushland. Some of these sites contain,or are adjacent to, areas with high levels ofbiodiversity. Our Residential business, whichtends to have the most significant biodiversityimpacts, has developed SustainableGuidelines for Acquisition.The guidelines include a requirement toconsider the impact on ecology by identifyingareas of significance for biodiversity orprotected species and investigating howwe can enhance biodiversity value throughdevelopment of the site.In FY09, we worked with local and stategovernments to ensure our developmentsmeet relevant planning and regulationrequirements for biodiversity management.We are interested in developing residentialcommunities that maintain or enhancebiodiversity in the local area. This hasincluded regenerating degraded grazingland into vegetated open spaces (see NorthShore case study) and developing residentialcommunities that are close to nativebushlands and parks.Environmental Impact AssessmentsAssessing the impacts on biodiversity of ourdevelopments and engaging with the localcommunity is critical to ensuring projectsare granted approval both by regulatoryauthorities and by community stakeholders.Local government often requires anEnvironmental Impact Assessment(EIA) when considering approvals fordevelopments. For example, we needto prepare an EIA:(a site that has not been built on before,usually in rural areas) or a brownfield site(a site that has been built on before,usually in urban areas),conservation value.Where required for development approval,we conduct an EIA. Assessing the impactof biodiversity may incorporate stakeholderconsultation with groups including localgovernment, local communities andresidents, environmental action groupsand ecological experts.Biodiversity planningTHREATENED OR ENDANGEREDSPECIES OR COMMUNITIES ResidentialIMPACTED BY PROJECTS CommunitiesProjects that impact threatenedor endangered species (%)Total area of land that impactsspecies habitat or makes upcommunity (ha)Projects with a biodiversity planapproved by relevant approvalauthority (%)Total projects that partnered withor involved community and nongovernmentorganisations in naturalresource managementApartmentsRetirementLivingTotal24 9 0 211,075 2 0 1,07724 9 0 217 0 0 760<strong>Stockland</strong> Corporate Responsibility & Sustainability <strong>Report</strong> 30 June <strong>2009</strong>
NATURAL RESOURCESCASE STUDIESNorth Shore Biodiversity, Townsville QLDA review of 81 properties and projects in ourResidential (Residential Communities andApartments) business identified that 21 percent have threatened species or communitieslocated on, or nearby, the project. The totalarea of land that impacts the species habitat,is 1,077 hectares. Of these projects, halfhave biodiversity management plans in placeand these have generally been required byapproval authorities. In total, around a fifthof the projects reviewed have biodiversityplans in place with some approval authoritiesrequiring biodiversity management plansregardless of whether there are threatenedor endangered species or impactedcommunities.In our 2008 CR&S report, we said we wouldpilot biodiversity indicators at a number ofsites in FY09. We began work on this but didnot progress it due to changes in structureand personnel in the Residential sustainabilityteam. However, biodiversity has beenidentified as a focus area in the Residentialbusiness’ new sustainability strategy. Weaim to gain a better understanding of ourbiodiversity holdings in FY10 by refiningour register of threatened and endangeredspecies and communities nationally.TOWNSVILLE, QUEENSLANDNorth Shore is North Queensland’slargest masterplanned community,incorporating over 5,200 new homesacross more than 1,000 hectares ofland. The project was launched inSeptember 2008 and is 5 per centcomplete. The community will includeschools, retail and commercial space,community facilities and naturalbushland and parklands.North Shore is located alongside theBohle River on land previously usedfor grazing. The site is an importanthabitat for the endangered BlackThroated Finch and the vulnerableStriped Tailed Delma (a legless lizard).In the planning phase we consideredhow best to protect and enhancethe habitat of these species, managestormwater runoff in a way thatenhances the water quality of thereceiving ecosystems, regeneratedegraded grazing property andenhance the site’s natural biodiversity.We implemented a range of initiativesincluding:practice stormwater treatmentsystem which includes constructedwetlands,the site, and preventative works tostop further erosion,to Saunders and Stoney Creeks(tributaries of the Bohle River) andthe creation of additional waterholesand ponds in the open spacecorridor for native wildlife. We alsocommitted $50,000 per annum forfive years to establish the BlackThroated Finch Trust to researchand conserve this species.These initiatives have resulted in therehabilitation of over 40 hectares ofnative bushland adjacent to the BohleRiver, making it a suitable habitat fornative flora and fauna. The initiativeshave also led to the constructionof Townsville’s first large scale bioretentionbasin (over one hectare) ata cost of approximately $1 million.A bio-retention basin is a landscapeddepression used to slow and treatonsite stormwater runoff.Our stakeholders, including residents,community groups, council andprospective buyers, have respondedpositively to the project to dateand to our approach. The positivestakeholder sentiment toward theproject is evidenced by the fact thatthe project has managed to achieve265 sales during a period where theland sales market in Townsville hashalved.MIBA SOUTH PARKLAND,QUEENSLANDThe MIBA South Parkland area is thefirst of a number of urban parklandsin the North Lakes Western Precinct.This area, which was establishedin late 2008, incorporates a rangeof water-sensitive urban designstrategies to protect the localenvironment and achieve bestpractice in community development.MIBA South Parkland also plays animportant role in water flow mitigationand has been designed to help controlflooding in the local area and protectlocal neighbourhoods from inundationand stormwater damage.Stormwater harvesting systems willprovide the irrigation supply to twohectares of landscape. This equatesto a reduction of up to 20 million litresof potable water use per year. Theelectricity used for the irrigation willbe offset by a 4kW solar photovoltaicsystem that will be located in the park.The stormwater harvesting will alsoprovide additional benefits such as areduction in the load of stormwaterpollutants to downstream ecosystems.<strong>Stockland</strong> Corporate Responsibility & Sustainability <strong>Report</strong> 30 June <strong>2009</strong> 61
NATURALRESOURCESNATURAL RESOURCESCASE STUDYThe Pines, Doncaster VictoriaWATERCONSUMPTIONWATERDrought is a common feature of theAustralian landscape. Water restrictions are inplace in many regions of Australia due to thechronic shortage of water resulting from lowrainfall levels. We recognise that in the longtermwe need to reduce water consumptionand maximise water efficiency. To improvewater efficiency we:Environment Rating System (NABERS) tomeasure water consumption in our existingoffice buildings. For the 2008 calendaryear we achieved our 3.5 Star NABERSWater portfolio average target for<strong>Stockland</strong> managed properties with a3.6 Star average. Our medium-term targetis to achieve 4.0 Star NABERS Waterportfolio average rating by 2013,16 of our retail shopping centres in FY09to identify water-saving opportunities,and water quality for our Residential andRetirement Living projects, with a focuson appropriate water-sensitive urbandesign to manage our impacts on waterflow and quality.12 % <strong>Stockland</strong> Corporate Responsibility & Sustainability <strong>Report</strong> 30 June <strong>2009</strong>Water usage in our office portfolioIn FY09, our office sites reduced waterconsumption by 28 per cent compared to ourFY06 benchmark. This has been achievedthrough the implementation of sub-metering,water-efficient fittings and waterless urinalsthroughout our properties. In FY09 wereceived grants from Sydney Water to modifytaps and toilets at 110 Walker Street,133 Castlereagh Street, 75 George Street,77 Pacific Highway and 222 Pitt Street.Water usage in our shopping centresIn early 2008, we examined water efficiencyat 16 of our retail shopping centres. Each sitewas independently assessed by Ecosave, awater conservation organisation, and watersavingsolutions were proposed for eachsite. The predicted target water saving was78,927kL or 16.6 per cent against the usagerecorded in FY07. The project commencedin FY08 and verification of the savings wasfinalised in FY09.The water reduction from March 2008to March <strong>2009</strong> was 14.5 per cent. Whena full year has passed we expect to meetour target.Smart water metersWe have installed an online data loggingsystem that records water usage everyfive minutes, 24 hours per day. These‘smart’ water meters are connected toevery main billing meter for our retailsites, plus a number of <strong>Stockland</strong>-ownedsub-meters, at 33 <strong>Stockland</strong> retail sites.Overall, 148 meters are connected tothe ‘smart metering’ systems. In FY10,meters will be extended to six additionaloffice assets where sub-metering forwater is not already in place (a portfolio ofbuildings had sub-metering implementedin FY07 and all new office developmentsare fitted with third party managedmetering).Alarms are set off when water usageexceeds a selected amount during certainhours of the night, as high water usagewhen the building is unoccupied in mostcases signals a leak.A high water usage alarm went off at<strong>Stockland</strong> Nowra shopping centre inNew South Wales on 21 February <strong>2009</strong>when water usage exceeded 150 litresbetween 10-11pm. An investigation founda leak in a cooler connection and theproblem was rectified on 23 February.If this leak had gone undetected,2,600 litres of water an hour wouldhave been wasted.THE PINES, EAST DONCASTER,VICTORIATo reduce water consumption atThe Pines shopping centre in EastDoncaster, we implemented a numberof measures in FY09. These included:minimal flush as per AS3500National Plumbing Code,where they were leaking,with four litre flow control valves,two litre vandal proof aerators inpublic areas,Tap spindles were lubricatedwhere required,for 100 per cent operationalefficiency.We reduced our water consumptionat The Pines by 3,493kL in FY09compared to FY08.62
COMMERCIAL PROPERTY WATER METRICSWATER CONSUMPTION (kL) FY06 FY07 FY08 FY09Office and Industrial 695,217 772,048 683,964 552,248WATERCONSUMPTIONWater consumption (kL)FY091,298,733Retail 863,491 864,647 788,304 746,485FY081,472,267Total 1,558,708 1,636,695 1,472,267 1,298,733The water we use is sourced from municipal or city water supplies.Boundary: For FY09 we are reporting according to our ‘operational control’ boundary underthe National Greenhouse and Energy <strong>Report</strong>ing Act (NGERA). For FY06, the figures excludeour industrial site at Yennora. Figures include tenant use.12 %FY07FY06Water consumption of office, industrial andretail assets1,636,6951,558,708Reviewing water consumption metricsin our Commercial Property businessOur Commercial Property business reducedits water usage substantially between FY06and FY09. This was a result of ‘easy-wins’being made with the introduction of waterlessurinals, low flow tap reviews, sub-meteringand bathroom upgrades in a large part ofthe portfolio.Retail sites reduced their usage and theirintensity by over 5 per cent. Our officeportfolio met its NABERS Water portfolioaverage target, but did not reduce its financialyear intensity. We have restated the intensityfigures for our office portfolio to includewater consumption associated with retailareas within our office buildings. We believethat its inclusion best represents the trueperformance of our portfolio. Due to the lowproportion of our office portfolio included inour FY09 intensity metric, we anticipate thatwe will restate this figure in our FY10 report,when we have more complete data for ourentire portfolio. The sharp drop in the overallwater consumption of our office portfolio canbe partially attributed to the sale of a numberof properties over the year.WATER INTENSITY (kL/m 2 ) FY06 FY07 FY08 FY09Office 1.12 1.05 0.89 0.89– Floor area (Net Lettable Area) of 522,621 556,710 592,723 343,348buildings in intensity metric (m 2 )– Percentage portfolio covered 93% 77% 80% 49%Retail 1.21 1.16 1.00 0.93– Floor area (Gross Lettable Area) of 714,700 748,520 790,064 775,565buildings in intensity metric (m 2 )– Percentage portfolio covered (%) 92% 97% 100% 100%Boundary: We report against the same operational control boundary for our intensity figuresas for our absolute figures. Intensity figures are derived from the total water consumption foreach asset class over the year, divided by the total floor area. Only assets with a full 12 monthdata set are included. We measure against area in m 2 as this is the metric used by NABERSto benchmark office property efficiency.WATER INTENSITYREDUCTIONS (%) FY06-FY07 FY07-FY08 FY08-FY09 FY06-FY09Office 6% 15% 0% 21%Retail 4% 14% 7% 23%OFFICEWATERINTENSITY0 %RETAILWATERINTENSITYOffice water intensity (kL/m²)FY090.89FY080.89FY071.05FY061.12Floor Area (NLA) of buildings in intensity metric (m²)Retail water intensity (kL/m²)FY080.93FY071.00FY061.16FY01.21Floor Area (GLA) of buildings in intensity metric (m²)7 % <strong>Stockland</strong> Corporate Responsibility & Sustainability <strong>Report</strong> 30 June <strong>2009</strong> 63In future we will set intensity and overalltargets.
NATURALRESOURCESNATURAL RESOURCESCASE STUDYPacific Pines stormwater management, QueenslandWATER USAGE IN DEVELOPING OUR RESIDENTIAL COMMUNITIESAND IN OUR RETIREMENT VILLAGESWe have collected data on water use from our projects (44 per cent) in ResidentialCommunities, Apartments and in the four Retirement Living projects where we have controlover water use for the first time this year. The total potable water consumed across the yearwas 73,066 kL, while 279,771 kL of non-potable water was used. Potable water thereforemakes up 26 per cent of total reported water use.Water in Residential Communities is typically used by civil and landscape contractors duringsite development and construction. This includes water for site dust management, road layingand landscape watering. This is typically where non-potable water would be used but whenthis is not available, or too expensive, potable water will be used. There are also project siteand sales offices that use potable water. Apartment projects will typically access municipalor city water suppliers for construction usage. The exception to this was our Islands projectin Western Australia which was able to source over 90 per cent of its requirements fromnon-potable sources. We collected data on water use for three of the four Retirement Livingprojects where we control water use and the majority of water used (97 per cent) was potablevia the city water supply in Melbourne.We will improve data accuracy in FY10 by including water reporting requirements in themonthly health, safety and environment report that is completed by contractors on our sitesand by improving the accuracy of data collected for direct <strong>Stockland</strong> activities.RESIDENTIAL AND RETIREMENT LIVING WATER METRICSWATER CONSUMPTION (kL) Potable Non-potable TotalPercentagepotableResidential Communities 46,967 259,215 306,182 15%Apartments 12,127 20,196 32,323 38%Retirement Living 13,972 360 14,332 97%Total 73,066 279,771 352,837 26%Boundary: Water use data is a mix of data supplied by contractors and water consumeddirectly by <strong>Stockland</strong> operations. Data is obtained through a combination of invoices andestimates. Data has been reported for 44 per cent of projects.STORMWATER MANAGEMENTIN OUR RESIDENTIALCOMMUNITIESIncreasing urban densities make theneed to manage water and reduceour impact on the environment evermore pressing. We have introducednew water treatment methodologiesto capture stormwater runoff in ourresidentials at Pacific Pines andRiverstone Crossing in Queensland.Pacific PinesProviding open space is often arequirement for our residentialcommunities. However, the provisionof larger active recreation areas canconflict with community expectationsfor better stormwater treatment. In FY09our Residential business constructed anaquifer for stormwater management atour Pacific Pines residential in Gaven inQueensland. The aquifer meets requiredstormwater objectives and provides aviable source of water for irrigating theopen space areas in the vicinity.Riverstone CrossingSet on 194 hectares, RiverstoneCrossing in the northern Gold Coast willcomprise approximately 718 allotments.In developing this community ouraim was to provide an alternate watersupply to maintain the parklands andplaygrounds, whilst improving thequality of stormwater runoff from thedevelopment.To achieve these objectives, wedesigned the development to includeswales, bio-retention, householdrainwater tanks, and gross pollutanttraps. We also included a 1 MLRainVault community system tocapture the three-month flow and retainthe treated runoff for irrigation.Incorporating these systems reducesthe development’s reliance uponpotable supply for irrigation purposesand reduces the ongoing long-termimpacts of urban runoff on waterways.The installed 1ML RainVault systemis designed to conserve 21.1 ML ofstormwater runoff that will be usedfor irrigation.64<strong>Stockland</strong> Corporate Responsibility & Sustainability <strong>Report</strong> 30 June <strong>2009</strong>
NABERS ratingsAVERAGENABERSENERGYRATING3.4 starsAVERAGENABERSWATERRATINGNABERS OFFICE ENERGY ANDWATER RATINGSNABERS is a performance-based ratingssystem that measures existing buildings’environmental performance during operation.We use NABERS to undertake energyand water ratings on our portfolio of officebuildings.We set a NABERS Energy office portfolioaverage target of 3.5 Stars for the 2008calendar year. We achieved a 3.4 Staraverage. A challenge for us has beenmaintaining the improvements in our portfolioaverage whilst increasing the size of theportfolio we are measuring. We originally setthis target for a small portfolio of buildings,which have since achieved a 3.6 StarNABERS Energy portfolio average. Webroadened our targets in last year’s reportto include all <strong>Stockland</strong> managed buildings.Average NABERS energy rating (stars)20082007200620052.52.92.9Average NABERS water rating (stars)20082007200620051.22.23.03.43.6NABERS OFFICE ENERGY AND WATER RATINGSPropertyNetLettableArea (m 2 )NABERSEnergyRating2008 (stars)NABERSEnergyRating2007 (stars)NABERSEnergyRating2006 (stars)NABERSWaterRating2008 (stars)NABERSWaterRating2007 (stars)NABERSWaterRating2006 (stars)NSW110 Walker St, North Sydney 4,532 4.0 3.5 3.5 4.0 3.5 3.0118-120 Pacific Hwy, St Leonards 5,131 3.5 3.0 3.0 4.5 4.0 3.5Piccadilly Tower, 133 Castlereagh St, Sydney 29,876 3.5 4.0 N/A 4.0 3.0 N/APiccadilly Court, 222 Pitt St, Sydney 9,724 4.0 4.5 4.0 3.5 4.0 3.5135 King St, Sydney 3 27,056 2.0 N/A 1.5 2.5 1.5 N/A175 Castlereagh St, Sydney 11,984 4.0 2.5 3.5 3.5 3.0 1.09 Castlereagh Street, Sydney # 21,185 3 # N/A N/A 3 # N/A N/A234 Sussex St, Sydney 11,071 4.5 4.0 4.0 4.0 1.0 0.0333 Kent St, Sydney 1 8,938 N/A 2.5 N/A N/A 3.5 N/A52 Martin Place, Sydney 3 39,071 3.0 N/A N/A 1.5 N/A N/A601 Pacific Hwy, St Leonards 12,690 4.0 3.5 2.0 3.5 3.5 2.07 Macquarie Place, Sydney 3 13,641 3.0 N/A N/A 1.0 N/A N/A72 Christie St, St Leonards 2 11,221 N/A N/A N/A N/A N/A N/A75 George St, Parramatta 4 9,545 2.5 3.0 1.5 N/A 0.0 N/A77 Pacific Hwy, North Sydney 4 9,337 N/A 2.5 2.0 N/A 3.5 2.53 Byfield Street, North Ryde 1 2,695 N/A N/A N/A N/A N/A N/A16 Giffnock Ave, North Ryde 11,701 2.0 1.5 N/A 1.5 2.0 N/A60 Waterloo Road, North Ryde 1 8,167 N/A N/A N/A N/A N/A N/A66 Waterloo Road, North Ryde 10,082 5.0 N/A N/A 4.0 N/A N/A11-17 Khartoum Road, North Ryde 4,212 4.5 4.0 N/A 4.0 N/A N/A33-39 Talavera Road, North Ryde 2 10,931 N/A N/A N/A N/A N/A N/ACentrecourt Estate, North Ryde 84,194 N/A N/A N/A N/A N/A N/A# Waiting for certification from DECC.1 Not classified as an “Office” building so no rating can be obtained.2 <strong>Stockland</strong> does not have operational control over this building, tenant controls utility data.3 JV building, not managed by <strong>Stockland</strong> Facility Managers.4 Problem with utility company providing correct data, so no rating can be achieved.3.6 stars <strong>Stockland</strong> Corporate Responsibility & Sustainability <strong>Report</strong> 30 June <strong>2009</strong> 65
NABERS ratingsNow, in response to the National Greenhouseand Energy Rating System (NGERS), we arebroadening targets to include all buildings forwhich we have ‘operational control’ underthe NGERS legislation. In the 2008 calendaryear we achieved our 3.5 Star NABERSWater portfolio average target for <strong>Stockland</strong>managed properties with a 3.6 star average.Only 49 per cent of the buildings withinour NGERS operational control boundaryhave achieved ratings. Ratings have to dateonly been achieved by <strong>Stockland</strong> managedproperties. This means that propertiesowned by <strong>Stockland</strong> but managed by athird party, which make up 20 per cent of<strong>Stockland</strong>’s portfolio under NGERS, arenot yet rated. We are waiting on NABERSratings for a further 24 per cent of theportfolio. Three per cent of the portfolio is notclassified as ‘office buildings’ under NABERSdefinitions and a further 8 per cent havingbilling estimates that have prevented us fromfinalising ratings.We have set the following targets:by FY14,for all key assets at risk,rating by FY14.NABERS OFFICE ENERGY AND WATER RATINGSPropertyNetLettableArea (m 2 )NABERSEnergyRating2008 (stars)NABERSEnergyRating2007 (stars)NABERSEnergyRating2006 (stars)NABERSWaterRating2008 (stars)NABERSWaterRating2007 (stars)NABERSWaterRating2006 (stars)ACT15 Mort Street, Cox Building, Canberra 3,701 4.0 3.0 3.0 4.5 3.5 4.017 Mort Street, Todd Building, Canberra 1,765 3.0 3.0 N/A N/A N/A N/A68 Northbourne Ave, Canberra 9,786 1.5 0.0 N/A 2.0 1.0 N/A70 Northbourne Ave, Drakeford Building 3,811 3.5 3.0 3.0 N/A 2.5 0.072 Northbourne Ave, Trace Building, Canberra 5,196 3.0 2.5 2.5 N/A N/A N/AEdmund Barton Building, CanberraN/A N/A N/A N/A N/A N/A N/A(Under development)40 Cameron Street, Belconnen 15,506 2.5 3.5 N/A N/A N/A N/AVIC452 Flinders St, Melbourne 38,496 3.5 2.0 2.0 3.0 3.0 3.0541 St Kilda Rd, Melbourne 8,208 4.0 4.0 4.0 3.5 4.5 2.5QLDWaterfront Place, 1 Eagle St, Brisbane 59,166 4.0 3.5 3.0 4.0 3.5 3.5Garden Square, 643 Kessels Rd,12,681 1.0 1.0 N/A 4.0 4.0 N/AUpper Mount Gravatt150 Charlotte Street, Brisbane 2 N/A N/A N/A N/A N/A N/A N/A80-88 Jephson Street, Toowong 6,397 1.5 1.5 N/A 4.5 4.5 N/AWAExchange Plaza, 2 The Esplanade, Perth 3 34,178 4.5 # N/A N/A N/A N/A N/ADurack Centre, 263 Adelaide Terrace, Perth 17,312 N/A 3.0 N/A N/A 2.0 N/A45 St Georges Terrace, Perth 9,876 N/A 3.0 N/A N/A 2.5 N/ABankwest Tower 3 39,360 N/A N/A N/A N/A N/A N/A181 Great Eastern Hwy, Belmont 2 4,036 N/A N/A N/A N/A N/A N/A1 Havelock Street, West Perth 5,087 N/A N/A N/A N/A N/A N/A267 St Georges Terrace, Perth 3,484 N/A N/A N/A N/A N/A N/A255 St Georges Terrace, Perth 590 N/A N/A N/A N/A N/A N/A# Waiting for certification from DECC.1 Not classified as an “Office” building so no rating can be obtained.2 <strong>Stockland</strong> does not have operational control over this building, tenant controls utility data.3 JV building, not managed by <strong>Stockland</strong> Facility Managers.4 Problem with utility company providing correct data, so no rating can be achieved.66<strong>Stockland</strong> Corporate Responsibility & Sustainability <strong>Report</strong> 30 June <strong>2009</strong>
WASTE AND MATERIALSWaste management is an importantdimension of eco-efficiency, particularly forour Commercial Property operations wherewe have a high degree of influence in helpingto manage and reduce waste. We anticipatethat waste fees will increase when carbonstarts to be accounted for and, therefore,implementing waste reduction measures nowwill help reduce costs later.A management challenge has been a lackof completeness in our waste data. In FY08,for example, we had accurate waste datafor only 26 per cent of our office portfolio. InFY09, we improved our waste data collectionsystems. In December 2008 we completed atender for waste management services to ouroffice and retail sites. This included minimumperformance requirements for wastediversion from landfill (including mandating80 per cent recycling in our New SouthWales office properties) and monthlyreporting to a set format.Complementing this process in FY08 wecommitted to implement waste recyclingfacilities at all of our retail centres to therecycling level available with the centre’s localcouncil area by FY10. We are progressingwell against this target. Currently over 81 percent of our retail centre has waste reportingin place. Fifteen per cent of retail waste iscurrently diverted from landfill. We have seta 20 per cent diversion target from landfill forretail sites in FY10. We have set a target of70 per cent diversion from landfill for ouroffice portfolio in FY10.Using a single national approach for wasteallows for consistency across states andasset classes and leads to more meaningfulmetrics, and waste management outcomes.Our minimum performance requirementsalso allow for waste audits to the standard ofNABERS Waste ratings (using independentassessors) to validate outcomes.OPERATIONAL WASTE (tonnes) FY07 FY08 FY09OfficeTotal waste 989 1,047 4,038Total waste to landfill 1,046Total waste recycled 2,637Percentage diversion from landfill 65%Percentage of portfolio reporting 27.6% 26% 90%RetailTotal waste 9,352 10,124 8,546Total waste to landfill 7,203Total waste recycled 1,343Percentage diversion from landfill 15%Percentage of portfolio reporting 85% 85% 81%Boundary: We are reporting against the same National Greenhouse and Energy <strong>Report</strong>ingAct (NGERA) ‘operational control’ boundary that we use for energy and water. We report onall properties within this boundary, with the exception of some properties where our tenantsrun their own waste contracts. We also report on a small number of additional propertiesthat fall out of our NGERA boundary, but where we have taken on management of the wastecontract for service provision purposes.DEVELOPMENT WASTE FY09 (tonnes) Office RetailTotal waste 12,120 656Waste recycled 10,581 577Waste to landfill 1,884 79Diversion from landfill 87% 88%Percentage of the developments included 100% 20%Boundary: Calculated based on total number of projects for which <strong>Stockland</strong> is thedeveloper. Active waste is tracked through the builders as for these sites the principalcontractor has operational control.Waste in the development of newbuildingsWe are a signatory to the Green BuildingCouncil of Australia’s Green BusinessPartnership. Under this agreement allnew office assets are required to meet aminimum 4 Star Green Star rating. The ratingframework enables us to consider aspectssuch as waste and material selection in thedevelopment of new office buildings. Forretail buildings we either complete GreenStar ratings or use our retail charter, bothof which have equivalent requirements fordevelopment waste.Green Star awards points for constructionwaste diverted from landfill, with targets of60 and 80 per cent, and for allowing suitablespace for recycling.We also target material selection credits byincorporating low volatile organic compoundpaints and carpets, low formaldehyde woodand recycled content in structural materials.We have received two 6 Star Green Starratings (classified as ‘World Leadership’)in FY09 for our Sydney office, Stockhome,and 2 Victoria Avenue in Perth. Our EdmundBarton Building redevelopment and Trinitibuildings A and B are currently registeredfor certification.Working with suppliers to managewaste at our shopping centresWe are working with our preferred wastemanagement suppliers to introduce recycledwaste bins in our shopping centres. As afirst step we are holding a pilot recyclingproject at four of our retail centres in NewSouth Wales – Wetherill Park, Merrylands,Baulkham Hills and Green Hills. The projectwill be extended to all retail centres. Ourwaste management suppliers are identifyingwaste-sorting facilities to meet the needsof the business and to manage all wastestreams, including general waste, co-mingled(plastics, aluminium cans and glass), paper,cardboard and organic waste.Our Commercial Property team monitorswaste management with suppliers submittingmonthly reports on the waste streams.<strong>Stockland</strong> Corporate Responsibility & Sustainability <strong>Report</strong> 30 June <strong>2009</strong> 67
Global <strong>Report</strong>ing Initiative (GRI) indexGRI INDICATORRESPONDED POSITION IN <strong>2009</strong> REPORTTO IN <strong>2009</strong>1. STRATEGY AND ANALYSIS1.2 Statement from the most senior decision maker of the organisation about the relevance Yes page 2 – 3of sustainability to the organisation and its strategy.1.2 Description of key impacts, risks and opportunities. Yes page 2 – 3, 6 – 9, 15 – 20, 22 – 52, 57 – 64, 672. ORGANISATIONAL PROFILE2.1 Name of the organisation. Yes <strong>Stockland</strong> Corporation Limited2.2 Primary brands, products, and/or services. Yes page 52.3 Operational structure of the organisation, including main divisions, operatingYes page 5companies, subsidiaries, and joint ventures.2.4 Location of organisation’s headquarters. Yes back cover2.5 Number of countries where the organisation operates, and names of countries witheither major operations or that are specifically relevant to the sustainability issuescovered in the report.Yes page 52.6 Nature of ownership and legal form. Yes page 52.7 Markets served (including geographic breakdown, sectors served, and types of Yescustomers/beneficiaries).2.8 Scale of the reporting organisation. Yes page 52.9 Significant changes during the reporting period regarding size, structure, or ownership. Yes page 5Shareholder Review <strong>2009</strong> page 42.10 Awards received in the reporting period. Yes page 1168<strong>Stockland</strong> Corporate Responsibility & Sustainability <strong>Report</strong> 30 June <strong>2009</strong>
GRI INDICATORRESPONDED POSITION IN <strong>2009</strong> REPORTTO IN <strong>2009</strong>3. REPORT PARAMETERS REPORT PROFILE3.1 <strong>Report</strong>ing period for information provided. Yes page 143.2 Date of the most recent previous report (if any). Yes page 143.3 <strong>Report</strong>ing cycle. Yes page 143.4 Contact point for questions regarding the report or its contents. Yes back cover3.5 Process for defining report content. Yes page 143.6 Boundary of the report. Yes page 143.7 State any specific limitations on the scope or boundary of the report. Yes page 143.8 Basis for reporting in joint ventures, subsidiaries, leased facilities, outsourcedoperations, and other entities that can significantly affect comparability from period toperiod and/or between organisations.Yes page 14, 54 – 573.9 Data measurement techniques and the bases of calculations, including assumptionsand techniques underlying estimations applied to the compilation of the Indicators andother information in the report.3.10 Explanation of the effects of any re-statements of information provided in earlierreports, and the reasons for such re-statement.3.11 Significant changes from previous reporting periods in the scope, boundary, ormeasurement methods applied in the report.YesTechniques footnoted as appropriate.page 24 – 26, 29, 31, 50, 53 – 57, 63 – 67Yes page 29 – 30, 53 – 56Yes page 14, 53 – 563.12 Table identifying the location of the Standard Disclosures in the report. Yes GRI Index page 68 – 753.13 Policy and current practice with regard to seeking external assurance for the report.If not included in the assurance report accompanying the sustainability report, explainthe scope and basis of any external assurance provided. Also explain the relationshipbetween the reporting organisation and the assurance provider(s).Yes page 14Assurance statement page 76 – 77<strong>Stockland</strong> Corporate Responsibility & Sustainability <strong>Report</strong> 30 June <strong>2009</strong> 69
Global <strong>Report</strong>ing Initiative (GRI) indexGRI INDICATOR4. GOVERNANCE, COMMITMENTS AND ENGAGEMENT: GOVERNANCE4.1 Governance structure of the organisation, including committees under the highestgovernance body responsible for specific tasks, such as setting strategy ororganisational oversight.4.2 Indicate if the Chair of the highest governance body is also an executive officer (andif so, their function within the organisation’s management and the reasons for thisarrangement).4.3 For organisations that have a unitary board structure, state the number of members ofthe highest governance body that are independent and/or non-executive members.4.4 Mechanisms for shareholders and employees to provide recommendations or directionto the highest governance body.4.5 Linkage between compensation for members of the highest governance body, seniormanagers, and executives (including departure arrangements), and the organisation’sperformance (including social and environmental performance).4.6 Processes in place for the highest governance body to ensure conflicts of interest areavoided.4.7 Process for determining the qualifications and expertise of the members of the highestgovernance body for guiding the organisation’s strategy on economic, environmental,and social topics.4.8 Internally developed statements of mission or values, codes of conduct, and principlesrelevant to economic, environmental, and social performance and the status of theirimplementation.4.9 Procedures of the highest governance body for overseeing the organisation’sidentification and management of economic, environmental, and social performance,including relevant risks and opportunities, and adherence or compliance withinternationally agreed standards, codes of conduct, and principles.4.10 Processes for evaluating the performance of the highest governance body’s ownperformance, particularly with respect to economic, environmental, and socialperformance.RESPONDEDTO IN <strong>2009</strong>POSITION IN <strong>2009</strong> REPORTYes page 9 – 10, 12Financial <strong>Report</strong> <strong>2009</strong>Yes Shareholder Review <strong>2009</strong> page 7Yes Shareholder Review <strong>2009</strong> page 7Yes page 13Yes page 28Financial <strong>Report</strong> <strong>2009</strong> page 10 – 11Yes Financial <strong>Report</strong> <strong>2009</strong> page 9 – 11Yes Financial <strong>Report</strong> <strong>2009</strong> page 11Directors are selected such that the Board has a balance of skills andexperience. As such, the Board has extensive experience of the social andenvironmental context in which the business operates.YesYes page 8, 12 – 19http://www.stockland.com.au/about/mission.htmYes Financial <strong>Report</strong> <strong>2009</strong> page 11 – 12The process for evaluating the performance of the Board is primarilyfocused on the relationship between the Board and management, and theeffectiveness of the Board itself. This process includes the performance ofCommittees, encompassing the Board CR&S Committee.70<strong>Stockland</strong> Corporate Responsibility & Sustainability <strong>Report</strong> 30 June <strong>2009</strong>
GRI INDICATOR4.11 Explanation of whether and how the precautionary approach or principle is addressedby the organisation.4.12 Externally developed economic, environmental, and social charters, principles, orother initiatives to which the organisation subscribes or endorses.4.13 Memberships in associations (such as industry associations) and/or national/international advocacy organisations.RESPONDEDTO IN <strong>2009</strong>YesYes page 11, 14Yes page 11, 15POSITION IN <strong>2009</strong> REPORTNo. Sustainability for the organisation is defined in Our CR&S approachpage 12 – 204.14 List of stakeholder groups engaged by the organisation. Yes page 164.15 Basis for identification and selection of stakeholders with whom to engage. Yes page 15 – 174.16 Approaches to stakeholder engagement, including frequency of engagement by type Yes page 6 – 7, 13 – 17, 34 – 37, 40 – 43and by stakeholder group.4.17 Key topics and concerns that have been raised through stakeholder engagement,and how the organisation has responded to those key topics and concerns, includingthrough its reporting.Yes page 12 – 17, 24 – 27, 29 – 31, 34 – 37MANAGEMENT DISCLOSURESEconomic Yes Financial <strong>Report</strong> <strong>2009</strong> page 17Shareholder Review <strong>2009</strong> page 1 – 4Environmental Yes page 44 – 67Labour Practices Yes page 22 – 31Human Rights Yes page 29 – 30, 37Society Yes page 38 – 43Product Responsibility Yes page 34 – 39<strong>Stockland</strong> Corporate Responsibility & Sustainability <strong>Report</strong> 30 June <strong>2009</strong> 71
Global <strong>Report</strong>ing Initiative (GRI) indexGRI INDICATORECONOMIC PERFORMANCE INDICATORSEconomic PerformanceEC1. Direct economic value generated and distributed, including revenues, operating costs,employee compensation, donations and other community investments, retainedearnings, and payments to capital providers and governments. (Core)EC2. Financial implications and other risks and opportunities for the organisation’s activitiesdue to climate change. (Core)RESPONDEDTO IN <strong>2009</strong>POSITION IN <strong>2009</strong> REPORTYes page 42 – 43Shareholder Review <strong>2009</strong> page 1Yes page 44 – 52, 57Carbon Disclosure Project <strong>Report</strong> 7EC3. Coverage of the organisation’s defined benefit plan obligations. (Core) Yes Superannuation contributions are made in accordance with legislativerequirements.EC4. Significant financial assistance received from government. (Core) Yes page 10, 41, 50, 60EC8. Development and impact of infrastructure investments and services provided primarily Partial page 42 – 43for public benefit through commercial, in-kind, or pro bono engagement. (Core)EC9. Understanding and describing significant indirect economic impacts, including theextent of impacts.Partial page 6 – 7, 34 – 37ENVIRONMENTAL PERFORMANCE INDICATORSEnergyEN3. Direct energy consumption by primary energy source. (Core) Yes page 55 – 56EN4. Indirect energy consumption by primary source. (Core) Yes page 55 – 56EN5. Energy saved due to conservation and efficiency improvements. Yes page 45, 50 – 52, 55 – 56EN6. Initiatives to provide energy-efficient or renewable energy based products andservices, and reductions in energy requirements as a result of these initiatives.Yes page 47, 50 – 57WaterEN8. Total water withdrawal by source. (Core) Yes page 63 – 6472<strong>Stockland</strong> Corporate Responsibility & Sustainability <strong>Report</strong> 30 June <strong>2009</strong>
GRI INDICATORRESPONDED POSITION IN <strong>2009</strong> REPORTTO IN <strong>2009</strong>BiodiversityEN11. Location and size of land owned, leased, managed in, or adjacent to, protected Yes page 60areas and areas of high biodiversity value outside protected areas. (Core)EN12. Description of significant impacts of activities, products, and services on biodiversity Partial page 60 – 61value outside protected areas. (Core)EN13. Habitats protected or restored. Partial page 61EN14. Strategies, current actions, and future plans for managing impacts on biodiversity. Partial page 60 – 61Emissions, Effluents and WasteEN16. Total direct and indirect greenhouse gas emissions by weight. (Core) Yes page 53 – 54EN17. Other relevant indirect greenhouse has emissions by weight. (Core) Partial page 53 – 54EN18. Initiatives to reduce greenhouse gas emissions and reductions achieved. Yes page 45, 47, 50 – 57EN19. Emissions of ozone-depleting substances by weight. (Core) Yes page 53 – 54, 57EN22. Total weight of waste by type and disposal method. (Core) Partial page 67EN23. Total number and volume of significant spills. (Core) Yes There were no spills in the reporting period.Products and ServicesEN26. Initiatives to mitigate environmental impacts of products and services, and extentof impact mitigation. (Core)Yes page 45, 47, 50 – 52, 59 – 64, 67ComplianceEN28. Monetary value of significant fines and total number of non-monetary sanctionsfor non-compliance with environmental laws and regulations. (Core)TransportEN29. Significant environmental impacts of transporting products and other goodsand materials used for the organisation’s operations, and transporting membersof the workforce.YesNilPartial page 53OverallEN30. Total environmental protection expenditures and investments by type. Yes page 60<strong>Stockland</strong> Corporate Responsibility & Sustainability <strong>Report</strong> 30 June <strong>2009</strong> 73
Global <strong>Report</strong>ing Initiative (GRI) indexGRI INDICATORRESPONDED POSITION IN <strong>2009</strong> REPORTTO IN <strong>2009</strong>LABOUR PRACTICES AND DECENT WORKEmploymentLA1. Total workforce by employment type, employment contract, and region. (Core) Yes page 24LA2. Total number and rate of employee turnover by age group, gender and region. (Core) Yes page 31LA3. Benefits provided to full-time employees that are not provided to temporary or parttimeemployees, by major operations.Yes page 27Labour/Management RelationsLA4. Percentage of employees covered by collective bargaining agreements. (Core) Yes All of our employees are on individual contracts.Occupational Health and SafetyLA7. Rates of injury, occupational diseases, lost days, and absenteeism, and number ofwork-related fatalities by region. (Core)Partial page 29Training and EducationLA10. Average hours of training per year per employee by employee category. (Core) Partial page 27We don’t measure training per year by employee category.LA11. Programs for skills management and lifelong learning that support the continued Partial page 27employability of employees and assist them in managing career endings.LA12. Per cent of employees receiving regular performance and career development reviews. Yes page 27 – 28Diversity and Equal OpportunityLA13. Composition of governance bodies and breakdown of employees per categoryaccording to gender, age group, minority group membership, and other indicators ofdiversity. (Core)Yes page 25 – 26LA14. Ratio of basic salary of men to women by employee category. (Core) Yes page 26HUMAN RIGHTSInvestment and Procurement PracticesHR2. % of significant suppliers and contractors that have undergone screening on humanrights and actions taken. (Core)Partial page 37Non-discriminationHR4. Total number of incidents of discrimination and actions taken. (Core) Yes There were 2 serious incidents. These were investigated and in bothcases the allegations were proven and the accused employees had theiremployment terminated for serious misconduct.74<strong>Stockland</strong> Corporate Responsibility & Sustainability <strong>Report</strong> 30 June <strong>2009</strong>
GRI INDICATORSOCIETYCommunitySO1. Nature, scope, and effectiveness of any programs and practices that assess andmanage the impacts of operations on communities, including entering, operating andexiting. (Core)RESPONDEDTO IN <strong>2009</strong>Yes page 38 – 43POSITION IN <strong>2009</strong> REPORTCorruptionSO3. Percentage of employees trained in organisation’s anti-corruption policies andprocedures. (Core)YesNo employees underwent Trade Practices training in FY09. Relevantemployees are enrolled to complete this training in early FY10.SO4. Actions taken in response to incidents of corruption. (Core) Yes Nil aspects of corruptionPublic policySO5. Public policy positions and participation in public policy development and lobbying.(Core)SO6. Total value of financial and in-kind contributions to political parties, politicians, andrelated institutions by country.Anti-Competitive BehaviourSO7. Total number of legal actions for anti-competitive behaviour, anti-trust and monopolypractices and their outcomes.ComplianceSO8. Monetary value of significant fines and total number of non-monetary sanctions fornon-compliance with laws and regulations. (Core)PRODUCT RESPONSIBILITYProduct and Service LabellingPR5. Practices related to customer satisfaction, including results of surveys measuringcustomer satisfaction.Marketing CommunicationsPR6. Programs for adherence to laws, standards, and voluntary codes related to marketingcommunications, including advertising, promotion, and sponsorship. (Core)PR7. Total number of incidents of non-compliance with regulations and voluntary codesconcerning marketing communications, including advertising, promotion, andsponsorship by type of outcomes.Customer PrivacyPR8. Total number of substantiated complaints regarding breaches of customer privacyand losses of customer data.CompliancePR9. Monetary value of significant fines for non-compliance with laws and regulationsconcerning the provision and use of products and services. (Core)Yes page 8Yes page 8YesYesNilNilYes page 13 – 17, 33 – 37Partial page 16YesYesYesNilNilNil<strong>Stockland</strong> Corporate Responsibility & Sustainability <strong>Report</strong> 30 June <strong>2009</strong> 75
Independent Assurance Statement76STOCKLAND CORPORATERESPONSIBILITY & SUSTAINABILITY(CR&S) REPORT <strong>2009</strong>To <strong>Stockland</strong>’s stakeholders,Banarra Sustainability Assurance andAdvice (Banarra) was commissioned by<strong>Stockland</strong> to assure its CR&S <strong>Report</strong> <strong>2009</strong>(the <strong>Report</strong>) against the AA1000 AssuranceStandard (AA1000AS) 2008. Banarra wasalso commissioned to validate the <strong>Report</strong>against the Global <strong>Report</strong>ing Initiative(GRI) Sustainability <strong>Report</strong>ing Guidelines.This is Banarra’s third reporting cycle with<strong>Stockland</strong>, so we have built on our previousunderstanding of the organisation and itsprogress.ASSURANCE SCOPEThe assurance scope is a Type 2 engagementunder AA1000AS (2008)and the scope includes:1) Assessing, to a high level of assurance,the nature and extent to which <strong>Stockland</strong>adheres to AA1000APS (2008) principles ofInclusivity, Materiality and Responsivenessand how it communicates this adherence inthe <strong>Report</strong>.2) Verification of the performance informationwithin the following material issue areas:high level of assurance; and<strong>Stockland</strong> Corporate Responsibility & Sustainability <strong>Report</strong> 30 June <strong>2009</strong>climate change, community development,community investment 1 , employeeengagement, employee profile, employeehealth & safety, engaging with suppliers,housing affordability, NABERS energy& water ratings, political donations, wasteand water to a moderate level of assurance.The performance information was verifiedusing the criteria in the Guide to CorporateResponsibility <strong>Report</strong>ing in the PropertySector, Draft, February <strong>2009</strong> and, forperformance information not included in thisguidance, the GRI Guidelines. In addition, theNGERS Technical Guidelines 2008 were alsoused as criteria for verification of greenhousegas emissions.BANARRA ASSURANCE METHODOLOGYWithin the above scope, our methodologyincluded:Committee and Board, includingMatthew Quinn, Graham Bradley andNick Greiner, concerning sustainabilityperformance and governance; b) 40<strong>Stockland</strong> staff at corporate, divisionaland site levels concerning sustainabilityperformance, strategy, policies for materialissues, implementation of responsesand performance data verification; andc) 12 external stakeholders concerningstakeholder engagement and sustainabilityperformance.CR&S Board Minutes as well as sustainabilitymanagement systems and documentation.and accuracy of all quantitative performanceinformation and the processes for capturing,aggregating and reporting this data, throughinterviews and document review, comparisonwith the assurance criteria, re-calculation andcross-checks with corroborative evidence,including sample testing of source data.qualitative performance information (such asmanagement assertions and case studies),through interviews and document review.NSW and three <strong>Stockland</strong> sites: North Lakes(residential, retirement living and commercialdevelopments), Qld; Merrylands (retail centreand development), NSW; and Sydney Officedevelopments (Optus and Triniti), NSW.material issues and stakeholder views onthese issues, including analysis of peerreports, media articles on <strong>Stockland</strong> inFY09, <strong>Stockland</strong>’s own documentation andengagement records and issues identifiedfrom Banarra’s interviews.with the GRI application level requirementsof B+ and that it is consistent with the natureand extent of <strong>Stockland</strong>’s adherence to theAA1000 AccountAbility Principles.FINDINGS AND RECOMMENDATIONSWe believe <strong>Stockland</strong> has appropriatelycommunicated the nature and extent ofits adherence to the AA1000APS (2008)principles in the <strong>Report</strong>. Findings andrecommendations on the nature andextent of <strong>Stockland</strong>’s adherence to theprinciples are provided below.Inclusivity – has <strong>Stockland</strong> a stakeholderengagement and participation process?<strong>Stockland</strong> has made a commitment to engagewith its stakeholders and Banarra foundstrong support of this commitment within theExecutive team and other staff interviewed.<strong>Stockland</strong> has identified its key stakeholdersand developed stakeholder engagementprocesses at the corporate and project level.<strong>Stockland</strong> acknowledges that the qualityof engagement processes varies betweenprojects and we are pleased that <strong>Stockland</strong>has started to develop a framework to enablemore consistent stakeholder engagementacross projects.1 Banarra only verified qualitative community investment data. Quantitative data was verifiedby the London Benchmarking Group and was outside of Banarra’s assurance scope.
Banarra identified the following areas forimprovement:sustainability decision-making at both aproject and corporate level is limited andthis should be reviewed;proactively identify and manage conflictingviews between stakeholders at both aproject and corporate level;stakeholder engagement at operationalRetirement Living sites that reflects theunique stakeholder relationships that<strong>Stockland</strong> has in this part of the business;and& Retirement Living customers throughmarketing and satisfaction surveys. It shouldtake this engagement further and providefeedback to these stakeholders on theresults of the surveys.Materiality – has <strong>Stockland</strong> identified itsmost important sustainability issues?We were pleased that <strong>Stockland</strong> hasdeveloped a formal materiality process toidentify its most important sustainability issues.All material issues identified for FY09 areincluded in the <strong>Report</strong>. In addition, Banarra’sindependent materiality review did not identifyany further material issues or issues of highstakeholder interest for inclusion in the <strong>Report</strong>.Banarra identified the following areas forimprovement:integrated within <strong>Stockland</strong>’s businessprocesses and we recommend that it isaligned with <strong>Stockland</strong>’s other risk andopportunity systems; andfrom a relatively narrow range of stakeholderviews. <strong>Stockland</strong> should develop a methodto capture and consolidate stakeholderviews from existing, broader engagementfor use in the materiality processes.Responsiveness – has <strong>Stockland</strong>responded to these issues?<strong>Stockland</strong> has developed a corporateCR&S Strategy outlining responses for itsmost important sustainability areas. Someprogress has been made in the developmentof divisional strategies and guidance althoughthere is still more to do in this area. Fromour site visits, whilst we found evidence thatsite level sustainability management wascongruent with corporate strategies, we foundthat this was mostly due to project basedinitiatives rather than the result of implementingcorporate strategies or guidelines.<strong>Stockland</strong> has developed comprehensiveresponses to the majority of its materialissues. In particular we are pleased tosee that it has developed monitoring anda greater understanding of sustainabilityperformance in the Residential business. Weencourage <strong>Stockland</strong> to use this informationand understanding to further improve itssustainability responses in Residential.We believe there are some areaswhere <strong>Stockland</strong> could develop a morecomprehensive response to its materialissues. In particular, The sustainable supplychain program should have greater reachwithin the organisation. Group Procurementmanages the program and has limited visibilityof procurement across the divisions. Althoughsome gaps are being closed, <strong>Stockland</strong> wouldbenefit from a more coordinated effort toensure consistent sustainable procurementpractices.<strong>Stockland</strong> has made good progressthrough development of some quantitativeenvironmental targets. Nevertheless, webelieve that <strong>Stockland</strong> could do more anddevelop quantitative targets for all materialissues. <strong>Stockland</strong> should also ensure thatcommitments are specific and measurableand progress against these should be clearlydescribed in the <strong>Report</strong>.Performance Information VerificationBased on our methodology we conclude:for Australian energy and greenhouse gasemissions is correct in all material aspectsand is a fair representation of <strong>Stockland</strong>’sperformance in this area in FY09;information for biodiversity, capabilitydevelopment, climate change, communitydevelopment, community investment1,employee engagement, employee profile,employee health & safety, engaging withsuppliers, housing affordability, NABERSenergy & water ratings, political donations,waste and water is not correct in all materialaspects and is not a fair representation of<strong>Stockland</strong>’s performance in these areas inFY09; andthe accuracy of the UK greenhouse gasemissions and energy data. This is due to alack of transparency on the boundary of thedata-set and the lack of complete energybilling information.Banarra has a number of findings andrecommendations to improve the datamanagement and reporting process.These findings are not considered materialrelative to <strong>Stockland</strong>’s performance:greenhouse gas emissions reportingsystems with the implementation of theCCAP tool. However, some of <strong>Stockland</strong>’sother environmental data reporting systemslack rigour and it is recommended thatimprovements are made to contractordata management, version control andinternal data checking.for each of its environmental data-sets.We believe this is confusing to stakeholders.Whilst <strong>Stockland</strong> have provided a broaddescription of each boundary in the <strong>Report</strong>,we recommend that boundaries be reviewedso that all environmental data-sets accountfor the same group of properties.the Draft PCA <strong>Report</strong>ing Guidelines once theyare finalised. In particular we recommendthat <strong>Stockland</strong> report on developments withsignificant community complaints and hectaresof land with high biodiversity value lost todevelopment.Global <strong>Report</strong>ing InitiativeWe concur with <strong>Stockland</strong>’s own assessmentthat they have achieved GRI application level B+.RESPONSIBILITIES & INDEPENDENCE<strong>Stockland</strong> was responsible for preparationof the <strong>Report</strong>, stakeholder identificationand engagement as well as material issueidentification and response. Banarra’sresponsibility was to provide an independentassurance opinion of the <strong>Report</strong> usingAA1000AS. This opinion is provided to<strong>Stockland</strong> Management and any reliance thirdparties may place on this statement is entirely attheir own risk. Banarra has provided <strong>Stockland</strong>a management report containing more detailson the findings and recommendations in thisstatement.Banarra was paid by <strong>Stockland</strong> to conductthis assignment. Other than this payment,the assurance team declares itself independentin relation to <strong>Stockland</strong> and its stakeholders.There is a detailed statement on ourindependence, impartiality and competenciesat www.banarra.com.Certified Lead Sustainability AssurancePractitioner IRCA No. 1188527Principal Environmental Auditor, IEMABanarra Sustainability Assurance and AdviceSydney, Australia19 October <strong>2009</strong><strong>Stockland</strong> Corporate Responsibility & Sustainability <strong>Report</strong> 30 June <strong>2009</strong> 77