Photosynthesis and Respiration - Vernier Software & Technology
Photosynthesis and Respiration - Vernier Software & Technology
Photosynthesis and Respiration - Vernier Software & Technology

You also want an ePaper? Increase the reach of your titles
YUMPU automatically turns print PDFs into web optimized ePapers that Google loves.
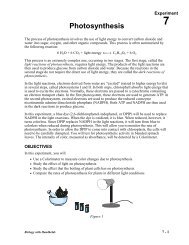
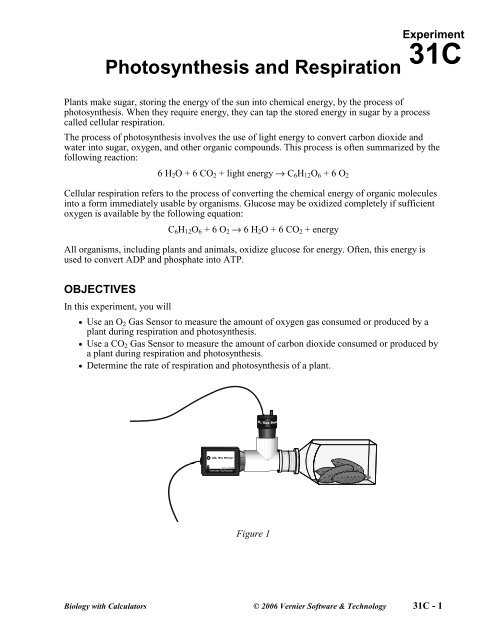
<strong>Photosynthesis</strong> <strong>and</strong> <strong>Respiration</strong>Experiment31CPlants make sugar, storing the energy of the sun into chemical energy, by the process ofphotosynthesis. When they require energy, they can tap the stored energy in sugar by a processcalled cellular respiration.The process of photosynthesis involves the use of light energy to convert carbon dioxide <strong>and</strong>water into sugar, oxygen, <strong>and</strong> other organic compounds. This process is often summarized by thefollowing reaction:6 H 2 O + 6 CO 2 + light energy → C 6 H 12 O 6 + 6 O 2Cellular respiration refers to the process of converting the chemical energy of organic moleculesinto a form immediately usable by organisms. Glucose may be oxidized completely if sufficientoxygen is available by the following equation:C 6 H 12 O 6 + 6 O 2 → 6 H 2 O + 6 CO 2 + energyAll organisms, including plants <strong>and</strong> animals, oxidize glucose for energy. Often, this energy isused to convert ADP <strong>and</strong> phosphate into ATP.OBJECTIVESIn this experiment, you will• Use an O 2 Gas Sensor to measure the amount of oxygen gas consumed or produced by aplant during respiration <strong>and</strong> photosynthesis.• Use a CO 2 Gas Sensor to measure the amount of carbon dioxide consumed or produced bya plant during respiration <strong>and</strong> photosynthesis.• Determine the rate of respiration <strong>and</strong> photosynthesis of a plant.Figure 1Biology with Calculators © 2006 <strong>Vernier</strong> <strong>Software</strong> & <strong>Technology</strong> 31C - 1
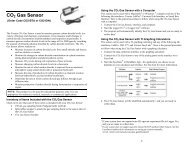
Experiment 31CMATERIALSTI-83 Plus or TI-84 Plus graphing calculatorEasyData applicationdata-collection interface<strong>Vernier</strong> O 2 Gas Sensor<strong>Vernier</strong> CO 2 Gas SensorCO2–O2 Tee250 mL respiration chamberplant leaves500 mL tissue culture flasklampaluminum foilforcepsPROCEDURE1. Turn on the calculator <strong>and</strong> connect it to the data-collection interface. Connect the O 2 GasSensor to Channel 1 of the interface <strong>and</strong> the CO 2 Gas Sensor to Channel 2.2. Set up EasyData for data collection.a. Start the EasyData application if it is not already running.b. Select from the Main screen, <strong>and</strong> then select New to reset the application.c. Select from the Main screen, then select Time Graph…d. Select on the Time Graph Settings screen.e. Enter 15 as the time between samples in seconds <strong>and</strong> select .f. Enter 40 as the number of samples <strong>and</strong> select (data will be collected for 10 minutes).g. Select to return to the Main screen.3. Obtain several leaves from the resource table <strong>and</strong> blot them dry, if damp, between two piecesof paper towel.4. Place the leaves into the respiration chamber, using forceps if necessary. Wrap the respirationchamber in aluminum foil so that no light reaches the leaves.5. Insert the CO 2 –O 2 Tee into the neck of the respiration chamber. Place the O 2 Gas Sensor intothe CO 2 –O 2 Tee as shown in Figure 1. Insert the sensor snugly into the Tee. The O 2 GasSensor should remain vertical throughout the experiment. Place the CO 2 Gas Sensor into theTee directly across from the respiration chamber as shown in Figure 1. Gently twist thestopper on the shaft of the CO 2 Gas Sensor into the chamber opening. Do not twist the shaftof the CO 2 Gas Sensor or you may damage it.6. Wait two minutes, then select to begin data collection. Data will be collected for10 minutes. Note: The graph may not show the slight change in O 2 level that occurs duringthe experiment.7. When data collection has finished, remove the aluminum foil from around the respirationchamber.8. Fill the tissue culture flask with water <strong>and</strong> place it between the lamp <strong>and</strong> the respirationchamber. The flask will act as a heat shield to protect the plant leaves.9. Turn the lamp on. Place the lamp as close to the leaves as reasonable. Do not let the lamptouch the tissue culture flask.31C - 2Biology with Calculators
<strong>Photosynthesis</strong> <strong>and</strong> <strong>Respiration</strong>10. When data collection is complete, a graph of O 2 vs. time will be displayed. Sketch a copy ofyour graph in the Graph section below. When finished, select , then select CH2:CO2Gas(ppm) vs time to view the graph of CO 2 vs. time. Sketch a copy of your graph in theGraph section below.11. Perform a linear regression to calculate the rate of respiration/photosynthesis.a. View the O 2 vs. time again by selecting , then CH1:O2 Gas(ppm) vs time.b. Select , <strong>and</strong> then select Linear Fit.c. The linear-regression statistics for these two lists are displayed for the equation in theform:y=ax+bd. Enter the value of the slope, a, as the rate of respiration/photosynthesis in Table 1.e. Select to view a graph of the data <strong>and</strong> the regression line.f. Select , select CH2:CO2 Gas(ppm) vs time, then repeat Steps 11b–11e to calculate therespiration/photosynthesis rate using the data from the CO 2 Gas Sensor.12. Select to return to the Main screen, then repeat Steps 6–11 to collect data with the plantexposed to light. Note: After selecting , select to start collecting data. Your storeddata will not be overwritten.13. Remove the plant leaves from the respiration chamber, using forceps if necessary. Clean <strong>and</strong>dry the respiration chamber.DATATable 1LeavesIn the darkIn the lightO 2 rate ofproduction/consumption(ppt/s)CO 2 rate ofproduction/consumption(ppt/s)Biology with Calculators 31C - 3
Experiment 31CGRAPHSDarknessLightO 2 Gas vs. TimeCO 2 Gas vs. TimeO 2 Gas vs. TimeCO 2 Gas vs. TimeQUESTIONS1. Were either of the rate values for CO 2 a positive number? If so, what is the biologicalsignificance of this?2. Were either of the rate values for O 2 a negative number? If so, what is the biologicalsignificance of this?3. Do you have evidence that cellular respiration occurred in leaves? Explain.4. Do you have evidence that photosynthesis occurred in leaves? Explain.5. List five factors that might influence the rate of oxygen production or consumption in leaves.Explain how you think each will affect the rate?EXTENSIONS1. Design <strong>and</strong> perform an experiment to test one of the factors that might influence the rate ofoxygen production or consumption in Question 5.2. Compare the rates of photosynthesis <strong>and</strong> respiration among various types of plants.31C - 4Biology with Calculators
TEACHER INFORMATION<strong>Photosynthesis</strong> <strong>and</strong> <strong>Respiration</strong>Experiment31C1. This activity can be performed with calculators from the TI-83 Plus or TI-84 Plus families<strong>and</strong> a LabPro or CBL 2. It can not be performed with Easy products because the CO 2 GasSensor is not supported by EasyLink.2. Spinach leaves purchased from a grocery store work very well <strong>and</strong> are readily available anytime of the year. For best results, keep the leaves cool until they are to be used. Just beforeuse, expose the leaves to bright light for 5 minutes.3. A fluorescent ring lamp works very well since it bathes the plant in light from all sides <strong>and</strong> itgives off very little heat. When using a ring lamp as shown below, it is not necessary to use aheat shield.4. If tissue culture flasks are not available, a beaker or flask of water will also work. The tissueculture flask is very thin, however, <strong>and</strong> will allow leaves to receive much more light from thesame lamp.5. To extend the life of the O 2 Gas Sensor, always store the sensor upright in the box in which itwas shipped.6. The waiting time before taking data may need to be adjusted depending on the rate ofdiffusion of the oxygen gas <strong>and</strong> the carbon dioxide gas. Monitor the gas concentrations <strong>and</strong>start collecting data when the levels of gas begin to move in the correct direction.7. The stopper included with the CO 2 Gas Sensor is slit to allow easy application <strong>and</strong> removalfrom the probe. When students are placing the probe in the CO 2 –O 2 Tee, they should gentlytwist the stopper into the adapter opening. Warn the students not to twist the probe shaft orthey may damage the sensing unit.8. To conserve battery power, we suggest that AC Adapters be used to power the interfacesrather than batteries when working with the CO 2 Gas Sensor. An AC Adapter is shipped witheach LabPro interface at the time of purchase. If you are using the CBL 2, you can purchase a<strong>Vernier</strong> AC Adapter (order code: IPS).Biology with Calculators31C - 1 T
Experiment 31CSAMPLE RESULTSLeavesTable 1O 2 rate ofproduction/consumption(ppt/s)CO 2 rate ofproduction/consumption(ppt/s)In the dark xxxx xxxxIn the light xxxx xxxxGRAPHSDarknessLightO 2 Gas vs. TimeCO 2 Gas vs. TimeO 2 Gas vs. TimeCO 2 Gas vs. TimeANSWERS TO QUESTIONSAnswers have been removed from the online versions of <strong>Vernier</strong>curriculum material in order to prevent inappropriate student use.Graphs <strong>and</strong> data tables have also been obscured. Full answers <strong>and</strong>sample data are available in the print versions of these labs.31C - 2 TBiology with Calculators