2.12 Work File: Climate and Weather; What's the Difference
2.12 Work File: Climate and Weather; What's the Difference 2.12 Work File: Climate and Weather; What's the Difference
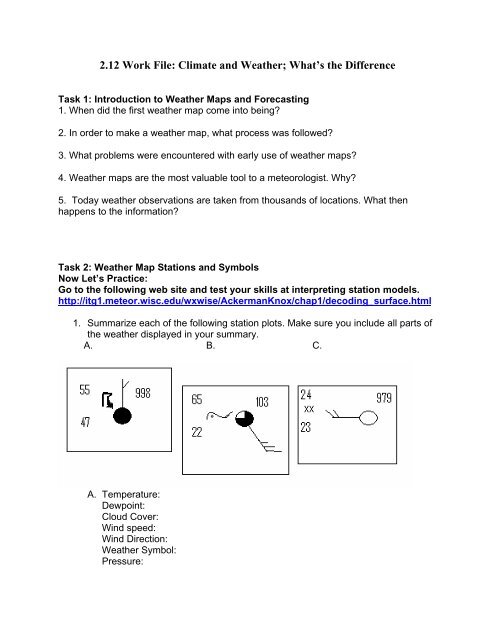
2.12 Work File: Climate and Weather; What’s the DifferenceTask 1: Introduction to Weather Maps and Forecasting1. When did the first weather map come into being?2. In order to make a weather map, what process was followed?3. What problems were encountered with early use of weather maps?4. Weather maps are the most valuable tool to a meteorologist. Why?5. Today weather observations are taken from thousands of locations. What thenhappens to the information?Task 2: Weather Map Stations and SymbolsNow Let’s Practice:Go to the following web site and test your skills at interpreting station models.http://itg1.meteor.wisc.edu/wxwise/AckermanKnox/chap1/decoding_surface.html1. Summarize each of the following station plots. Make sure you include all parts ofthe weather displayed in your summary.A. B. C.A. Temperature:Dewpoint:Cloud Cover:Wind speed:Wind Direction:Weather Symbol:Pressure:
<strong>2.12</strong> <strong>Work</strong> <strong>File</strong>: <strong>Climate</strong> <strong>and</strong> <strong>Wea<strong>the</strong>r</strong>; What’s <strong>the</strong> <strong>Difference</strong>Task 1: Introduction to <strong>Wea<strong>the</strong>r</strong> Maps <strong>and</strong> Forecasting1. When did <strong>the</strong> first wea<strong>the</strong>r map come into being?2. In order to make a wea<strong>the</strong>r map, what process was followed?3. What problems were encountered with early use of wea<strong>the</strong>r maps?4. <strong>Wea<strong>the</strong>r</strong> maps are <strong>the</strong> most valuable tool to a meteorologist. Why?5. Today wea<strong>the</strong>r observations are taken from thous<strong>and</strong>s of locations. What <strong>the</strong>nhappens to <strong>the</strong> information?Task 2: <strong>Wea<strong>the</strong>r</strong> Map Stations <strong>and</strong> SymbolsNow Let’s Practice:Go to <strong>the</strong> following web site <strong>and</strong> test your skills at interpreting station models.http://itg1.meteor.wisc.edu/wxwise/AckermanKnox/chap1/decoding_surface.html1. Summarize each of <strong>the</strong> following station plots. Make sure you include all parts of<strong>the</strong> wea<strong>the</strong>r displayed in your summary.A. B. C.A. Temperature:Dewpoint:Cloud Cover:Wind speed:Wind Direction:<strong>Wea<strong>the</strong>r</strong> Symbol:Pressure:
B. Temperature:Dewpoint:Cloud Cover:Wind speed:Wind Direction:<strong>Wea<strong>the</strong>r</strong> Symbol:PressureC. Temperature:Dewpoint:Cloud Cover:Wind speed:Wind Direction:<strong>Wea<strong>the</strong>r</strong> Symbol:Pressure:Task 3: Your Current <strong>Wea<strong>the</strong>r</strong>1. Copy <strong>and</strong> paste a picture of your state from <strong>the</strong> wea<strong>the</strong>r map you were directedto in <strong>the</strong> lesson into paint. Using your paint program, draw an arrow to your city.Save your image <strong>and</strong> insert your map image here.2. Use <strong>the</strong> information provided on <strong>the</strong> wea<strong>the</strong>r station model for your city from <strong>the</strong>map you created above. Write a summary of your wea<strong>the</strong>r for today. Be sure toinclude all of <strong>the</strong> information provided by <strong>the</strong> model such as wind speed <strong>and</strong>direction, temperature, percipitation, cloud cover, dew point <strong>and</strong> pressure.


