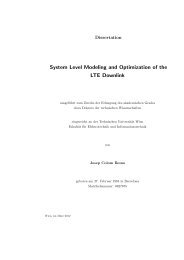
46 4. SEARCH PRUNING IN VIDEO SURVEILLANCE SYSTEMS ̷ ̷ 10987654ρ = 3, p 1= 0.1ρ = 8, p 1= 0.130 0.05 0.1 0.15 0.2 0.25 0.3 0.35Figure 4.2: Pruning gain, as a function <strong>of</strong> the confusability probability ɛ, for the uniform errorsetting, and for p 1 = 0.1. Plotted for ρ = 3 and ρ = 8.whether searching for a rare looking subject renders the search performance more sensitive toincreases in confusability, than searching for common looking subjects. We then present nine differents<strong>of</strong>t biometric systems, and describe how the employed categorization algorithms (eye colordetector, glasses and moustache detector) are applied on a characteristic database <strong>of</strong> 646 people.In Section 4.6.1 we provide simulations that reveal the variability and range <strong>of</strong> the pruning benefits<strong>of</strong>fered by different SBSs. In Section 4.7 we provide concise closed form expressions on themeasures <strong>of</strong> pruning gain and goodput, provide simulations, as well as derive and simulate aspectsrelating to the complexity costs <strong>of</strong> different s<strong>of</strong>t biometric systems <strong>of</strong> interest.Before proving the aforementioned results we hasten to give some insight, as to what is tocome. In the setting <strong>of</strong> large n, Section 4.5.1 easily tells us that the average pruning gain takesthe form <strong>of</strong> the inverse <strong>of</strong> ∑ ρf=1 p fɛ f , which is illustrated in an example in Figure 4.2 for different(uniform) confusability probabilities, for the case where the search is for an individual thatbelongs to a category that occurs once every ten people, and for the case <strong>of</strong> two different systemsthat can respectively distinguish 3 or 8 categories. The atypical analysis in Section 4.5 is moreinvolved and is better illustrated with an example, which asks what is the probability that a systemthat can identify ρ = 3 categories, that searches for a subject <strong>of</strong> the first category, that has 80percent reliability, that introduces confusability parameters ɛ 2 = 0.2,ɛ 3 = 0.3 and operates over apopulation with statistics p 1 = 0.4,p 2 = 0.25,p 3 = 0.35, will prune the search to only a fraction<strong>of</strong> τ = |S|/n. We note that here τ is the inverse <strong>of</strong> the pruning gain. We plot in Figure 4.3 theasymptotic rate <strong>of</strong> decay for this probability,logJ(τ) := − lim P(|S| > τn) (4.1)N→∞ n/ρfor different values <strong>of</strong> τ. From the J(τ) in Figure 4.3 we can draw different conclusions, such as:– Focusing on τ = 0.475 where J(0.475) = 0, we see that the size <strong>of</strong> the (after pruning) setS is typically (most commonly - with probability that does not vanish withn)47.5% <strong>of</strong> theoriginal size n. In the absence <strong>of</strong> errors, this would have been equal to p 1 = 40%, but theerrors cause a reduction <strong>of</strong> the average gain by about 15%.– Focusing onτ = 0.72, we note that the probability that pruning removes less than1−0.72 =28% <strong>of</strong> the original set is approximately given by e −n , whereas focusing on τ = 0.62, we
472.52rate <strong>of</strong> decay <strong>of</strong> P(τ)1.510.500.4 0.5 0.6 0.7 0.8 0.9τ = (remaining size)/nFigure 4.3: Asymptotic rate <strong>of</strong> decay <strong>of</strong> P(|S| > τn), for ρ = 3, reliability 0.8, populationstatistics p 1 = 0.4,p 2 = 0.25,p 3 = 0.35 and confusability parameters ɛ 2 = 0.2,ɛ 3 = 0.3.note that the probability that pruning removes less than 1−0.62 = 38% <strong>of</strong> the original set,is approximately given by e −n/2 . The probability that pruning removes less than half theelements is approximately P(τ > 0.5) ≈ e −n/10 .The expressions from the above graphs will be derived in detail later.4.3 Gain vs. reliability in s<strong>of</strong>t biometric systemsAs an intermediate measure <strong>of</strong> efficiency we consider the (instantaneous) pruning gain, definedhere asG(v) := n|S| , (4.2)which simply describes 1 the size reduction, from v to S, and which can vary from 1 (no pruninggain) to n. In terms <strong>of</strong> system design, one could also consider the relative gain,r(v) := 1− |S|n∈ [0,1], (4.3)describing the fraction <strong>of</strong> people in v that was pruned out.It is noted here that G(v), and by extension r(v), vary randomly with, among other things, therelationship between v and v ′ , the current estimation conditions as well as the error capabilities<strong>of</strong> the system. For example, we note that if v and v ′ are such that v ′ belongs in a category inwhich very few other members <strong>of</strong>v belong to, then the SBS-based pruning is expected to producea very smallS and a high gain. If though, at the same time, the estimation capabilities (algorithmsand hardware) <strong>of</strong> the system result in the characteristics <strong>of</strong> v ′ being easily confusable with thecharacteristics <strong>of</strong> another populous category in v, then S will be generally larger, and the gainsmaller.As a result, any reasonable analysis <strong>of</strong> the gain-reliability behavior must be <strong>of</strong> a statisticalnature and must naturally reflect the categorization refinement, the corresponding estimation errorcapabilities <strong>of</strong> the system, as well as the statistics <strong>of</strong> the larger population.1. We here assume that the SBS is asked to leave at least one subject inS.
- Page 1: FACIAL SOFT BIOMETRICSMETHODS, APPL
- Page 5: AcknowledgementsThis thesis would n
- Page 8: 6hair, skin and clothes. The propos
- Page 11 and 12: 97 Practical implementation of soft
- Page 13 and 14: 11Notations used in this workE : st
- Page 15 and 16: 13Chapter 1IntroductionTraditional
- Page 17 and 18: 15event of collision, which is of s
- Page 19 and 20: 17ric. In Section 6.6 we employ the
- Page 21 and 22: 19Chapter 2Soft biometrics: charact
- Page 23 and 24: 21is the fusion of soft biometrics
- Page 25 and 26: 23plied on low resolution grey scal
- Page 27 and 28: 25Chapter 3Bag of facial soft biome
- Page 29 and 30: 27In this setting we clearly assign
- Page 31 and 32: 29Table 3.1: SBSs with symmetric tr
- Page 33 and 34: 31corresponding to p(n,ρ). Towards
- Page 35 and 36: the same category (all subjects in
- Page 37 and 38: 3.5.2 Analysis of interference patt
- Page 39 and 40: an SBS by increasing ρ, then what
- Page 41 and 42: 39Table 3.4: Example for a heuristi
- Page 43 and 44: 41for a given randomly chosen authe
- Page 45 and 46: 43Chapter 4Search pruning in video
- Page 47: 45Figure 4.1: System overview.SBS m
- Page 51 and 52: 49to be the probability that the al
- Page 53 and 54: 51The following lemma describes the
- Page 55 and 56: 534.5.1 Typical behavior: average g
- Page 57 and 58: 55n = 50 subjects, out of which we
- Page 59 and 60: 5710.950.9pruning Gain r(vt)0.850.8
- Page 61 and 62: 59for one person, for trait t, t =
- Page 63 and 64: 61Chapter 5Frontal-to-side person r
- Page 65 and 66: 63Figure 5.1: Frontal / gallery and
- Page 67 and 68: 6510.90.80.7Skin colorHair colorShi
- Page 69 and 70: 6710.90.80.70.6Perr0.50.40.30.20.10
- Page 71 and 72: 69Chapter 6Soft biometrics for quan
- Page 73 and 74: 71raphy considerations include [BSS
- Page 75 and 76: 73Figure 6.3: Example image of the
- Page 77 and 78: 75A direct way to find a relationsh
- Page 79 and 80: 77- Pearson’s correlation coeffic
- Page 81 and 82: 79shown to have a high impact on ou
- Page 83 and 84: 81Chapter 7Practical implementation
- Page 85 and 86: 834) Eye glasses detection: Towards
- Page 87 and 88: 857.2 Eye color as a soft biometric
- Page 89 and 90: 87Table 7.5: GMM eye color results
- Page 91 and 92: 89and office lights, daylight, flas
- Page 93 and 94: 917.5 SummaryThis chapter presented
- Page 95 and 96: 93Chapter 8User acceptance study re
- Page 97 and 98: 95Table 8.1: User experience on acc
- Page 99 and 100:
97scared of their PIN being spying.
- Page 101 and 102:
99Table 8.2: Comparison of existing
- Page 103 and 104:
101ConclusionsThis dissertation exp
- Page 105 and 106:
103Future WorkIt is becoming appare
- Page 107 and 108:
105Appendix AAppendix for Section 3
- Page 109 and 110:
107- We are now left withN −F = 2
- Page 111 and 112:
109Appendix BAppendix to Section 4B
- Page 113 and 114:
111Blue Green Brown BlackBlue 0.75
- Page 115 and 116:
113Appendix CAppendix for Section 6
- Page 117 and 118:
115Appendix DPublicationsThe featur
- Page 119 and 120:
117Bibliography[AAR04] S. Agarwal,
- Page 121 and 122:
119[FCB08] L. Franssen, J. E. Coppe
- Page 123 and 124:
121[Ley96] M. Leyton. The architect
- Page 125 and 126:
123[RN11] D. Reid and M. Nixon. Usi
- Page 127 and 128:
125[ZG09] X. Zhang and Y. Gao. Face
- Page 129:
2Rapporteurs:Prof. Dr. Abdenour HAD
- Page 132 and 133:
Biométrie faciale douce 2Les terme
- Page 134 and 135:
Biométrie faciale douce 4une perso
- Page 136 and 137:
Couleur depeauCouleur descheveuxCou
- Page 138 and 139:
Biométrie faciale douce 8Nous nous
- Page 140 and 141:
Biométrie faciale douce 103. Proba
- Page 142 and 143:
Biométrie faciale douce 12l’entr
- Page 144 and 145:
Biométrie faciale douce 14Figure 6
- Page 146 and 147:
Biométrie faciale douce 16pages 77
- Page 148 and 149:
Reviewers:Prof. Dr. Abdenour HADID,
- Page 150 and 151:
3hair, skin and clothes. The propos
- Page 152 and 153:
person in the red shirt”. Further
- Page 154 and 155:
7- Not requiring the individual’s
- Page 156 and 157:
9Probability of Collision10.90.80.7
- Page 158 and 159:
11the color FERET dataset [Fer11] w
- Page 160 and 161:
13Table 2: Table of Facial soft bio
- Page 162 and 163:
15Chapter 1PublicationsThe featured
- Page 164 and 165:
17Bibliography[ACPR10] D. Adjeroh,
- Page 166 and 167:
19[ZESH04] R. Zewail, A. Elsafi, M.