255 - Frederiksen
255 - Frederiksen
255 - Frederiksen
- No tags were found...

Create successful ePaper yourself
Turn your PDF publications into a flip-book with our unique Google optimized e-Paper software.
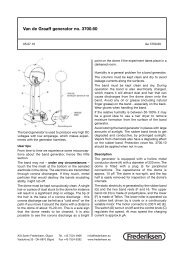
16EDVO-Kit #<strong>255</strong>Purification & Size Determination of gfp & bfpDetermination of Molecular WeightsIf measurements are taken directly from the gel, skip steps 1 and 2.1. Take a transparent sheet, such as cellulose acetate (commonly used withoverhead projectors) and lay it over the wrapped gel.The ExperimentMolecular Weight1098765432198765432198765432100,00010,000Phosphorylase2. With a felt-tip pen, carefully trace the outlines of the sample wells.Then trace over all the protein bands on the gel.Bovine Serum AlbuminOvalbuminLactate Dehydrogenase3. Measure the migration distance, incentimeters (to the nearest millimeter)of every major band in thegel. (Ignore the faint bands, refer toIdealized Schematic.) All measurementsshould be from the bottom ofthe sample well to the bottom of theprotein band.4. Using semilog graph paper, plot themigration distance or Rf of each standardprotein on the non-logarithmicx-axis versus its molecular weight onthe logarithmic y-axis. Choose yourscales so that the data points are wellspread out. Assume the second cycleon the y-axis represents 10,000 to100,000 (see example at left).5. Draw the best average straight linethrough all the points. This lineshould roughly have an equal numberof points scattered on each sideof the line. As an example, refer tothe figure at left. This method is alinear approximation.15 6 7 8 9 10CentimetersIn the example shown above, the standard molecular weights are:94,000 43,000 67,000 36,0006. Using your standard graph, determinethe molecular weight of thethree unknown proteins. This canbe done by finding the Rf (or migrationdistance) of the unknown bandon the x-axis and drawing a straightvertical until the standard line isintersected. A straight line is thenmade from the intersection acrossto the y-axis where the approximatemolecular weight can be determined.Duplication of this document, in conjunction with use of accompanying reagents, is permitted for classroom/laboratoryuse only. This document, or any part, may not be reproduced or distributed for any other purpose without thewritten consent of EDVOTEK, Inc. Copyright © 1998, 2000, 2001, 2005, 2007 EDVOTEK, Inc., all rights reservedEVT 005097KThe Biotechnology Education Company® • 1-800-EDVOTEK • www.edvotek.com