Ecology and Development Series No. 10, 2003 - ZEF
Ecology and Development Series No. 10, 2003 - ZEF
Ecology and Development Series No. 10, 2003 - ZEF
- No tags were found...

You also want an ePaper? Increase the reach of your titles
YUMPU automatically turns print PDFs into web optimized ePapers that Google loves.
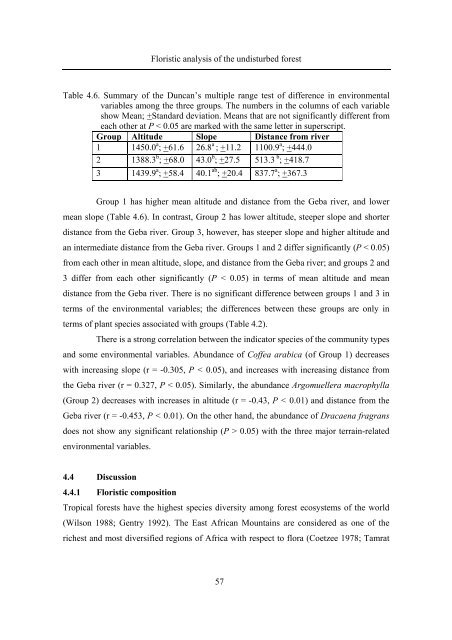
Floristic analysis of the undisturbed forestTable 4.6. Summary of the Duncan’s multiple range test of difference in environmentalvariables among the three groups. The numbers in the columns of each variableshow Mean; +St<strong>and</strong>ard deviation. Means that are not significantly different fromeach other at P < 0.05 are marked with the same letter in superscript.Group Altitude Slope Distance from river1 1450.0 a ; +61.6 26.8 a ; +11.2 1<strong>10</strong>0.9 a ; +444.02 1388.3 b ; +68.0 43.0 b ; +27.5 513.3 b ; +418.73 1439.9 a ; +58.4 40.1 ab ; +20.4 837.7 a ; +367.3Group 1 has higher mean altitude <strong>and</strong> distance from the Geba river, <strong>and</strong> lowermean slope (Table 4.6). In contrast, Group 2 has lower altitude, steeper slope <strong>and</strong> shorterdistance from the Geba river. Group 3, however, has steeper slope <strong>and</strong> higher altitude <strong>and</strong>an intermediate distance from the Geba river. Groups 1 <strong>and</strong> 2 differ significantly (P < 0.05)from each other in mean altitude, slope, <strong>and</strong> distance from the Geba river; <strong>and</strong> groups 2 <strong>and</strong>3 differ from each other significantly (P < 0.05) in terms of mean altitude <strong>and</strong> me<strong>and</strong>istance from the Geba river. There is no significant difference between groups 1 <strong>and</strong> 3 interms of the environmental variables; the differences between these groups are only interms of plant species associated with groups (Table 4.2).There is a strong correlation between the indicator species of the community types<strong>and</strong> some environmental variables. Abundance of Coffea arabica (of Group 1) decreaseswith increasing slope (r = -0.305, P < 0.05), <strong>and</strong> increases with increasing distance fromthe Geba river (r = 0.327, P < 0.05). Similarly, the abundance Argomuellera macrophylla(Group 2) decreases with increases in altitude (r = -0.43, P < 0.01) <strong>and</strong> distance from theGeba river (r = -0.453, P < 0.01). On the other h<strong>and</strong>, the abundance of Dracaena fragransdoes not show any significant relationship (P > 0.05) with the three major terrain-relatedenvironmental variables.4.4 Discussion4.4.1 Floristic compositionTropical forests have the highest species diversity among forest ecosystems of the world(Wilson 1988; Gentry 1992). The East African Mountains are considered as one of therichest <strong>and</strong> most diversified regions of Africa with respect to flora (Coetzee 1978; Tamrat57