Grade 8 Science and Technology/Engineering Test
Grade 8 Science and Technology/Engineering Test Grade 8 Science and Technology/Engineering Test
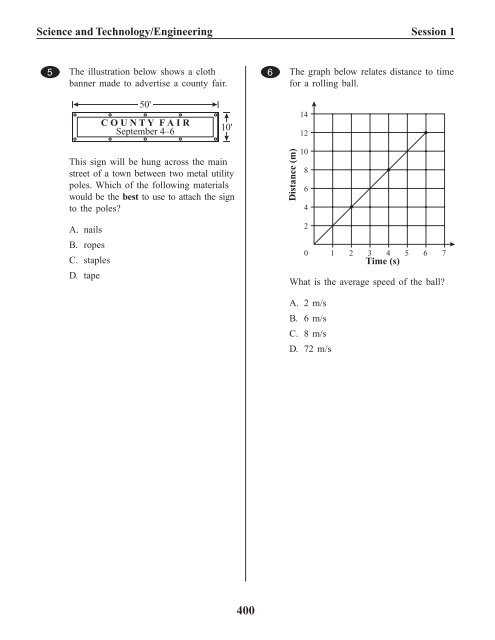
Science and Technology/Engineering Session 1ID:229461 3189002_AR1.eps B CommonID:229444 3227121_AR1.eps A Common● 5 The illustration below shows a cloth ● 6 The graph below relates distance to timebanner made to advertise a county fair.for a rolling ball.50'C O U N T Y F A I RSeptember 4–610'1412This sign will be hung across the mainstreet of a town between two metal utilitypoles. Which of the following materialswould be the best to use to attach the signto the poles?Distance (m)10864A. nailsB. ropesC. staplesD. tape20 1 2 3 4 5 6 7Time (s)What is the average speed of the ball?A. 2 m/sB. 6 m/sC. 8 m/sD. 72 m/s400
Science and Technology/Engineering Session 1ID:229372 3189018_AR1.eps B Common● 7The diagram below shows what occurredwhen a can of diet soda and a can ofregular soda were dropped into a containerof water.ID:229376 3227054_AR1.eps A Common● 8The diagram below shows thechromosomes from a cell after theywere photographed under a microscope.DietRegularThe can of regular soda sank to the bottomof the container, but the can of diet sodafloated. Which of the following statementsbest explains this observation?A. The can of regular soda is less densethan the can of diet soda.B. The can of regular soda is more densethan the can of diet soda.C. The can of regular soda has a largervolume than the can of diet soda.D. The can of regular soda has a smallervolume than the can of diet soda.Which of the following questionsmay best be answered by studyingan organism’s chromosomes?A. What sex is the organism?B. Is the organism endangered?C. Where is the organism’secosystem?D. How does the organism obtainits food?401
- Page 1 and 2: XVII. Science and Technology/Engine
- Page 3: Science and Technology/EngineeringS
- Page 11: Science and Technology/Engineering
- Page 14 and 15: Science and Technology/EngineeringS
- Page 16 and 17: Science and Technology/EngineeringS
- Page 18 and 19: Science and Technology/EngineeringS
- Page 20 and 21: Science and Technology/EngineeringS
- Page 22 and 23: Science and Technology/EngineeringS
- Page 24: Grade 8 Science and Technology/Engi
<strong>Science</strong> <strong>and</strong> <strong>Technology</strong>/<strong>Engineering</strong> Session 1ID:229461 3189002_AR1.eps B CommonID:229444 3227121_AR1.eps A Common● 5 The illustration below shows a cloth ● 6 The graph below relates distance to timebanner made to advertise a county fair.for a rolling ball.50'C O U N T Y F A I RSeptember 4–610'1412This sign will be hung across the mainstreet of a town between two metal utilitypoles. Which of the following materialswould be the best to use to attach the signto the poles?Distance (m)10864A. nailsB. ropesC. staplesD. tape20 1 2 3 4 5 6 7Time (s)What is the average speed of the ball?A. 2 m/sB. 6 m/sC. 8 m/sD. 72 m/s400


