Consolidated Financial Results of the year ended March 31 ... - Nikon
Consolidated Financial Results of the year ended March 31 ... - Nikon
Consolidated Financial Results of the year ended March 31 ... - Nikon
- No tags were found...

Create successful ePaper yourself
Turn your PDF publications into a flip-book with our unique Google optimized e-Paper software.
MAY 10, 2012<strong>Consolidated</strong> <strong>Financial</strong> <strong>Results</strong> <strong>of</strong> <strong>the</strong> <strong>year</strong> <strong>ended</strong> <strong>March</strong> <strong>31</strong>, 2012 (Japanese Standards)Company name: NIKON CORPORATIONCode number: 77<strong>31</strong>; Stock listings: Tokyo Stock ExchangeURL http://www.nikon.co.jp/Representative: Makoto Kimura, Representative Director and PresidentContact: Masayuki Hatori, General Manager, Corporate Communications & IR DepartmentTEL: +81-3-3216-1032Date for <strong>the</strong> annual shareholders’ meeting: June 28, 2012Date for <strong>the</strong> filing <strong>of</strong> <strong>the</strong> consolidated financial statements: June 28, 2012Date <strong>of</strong> <strong>year</strong>-end dividend payout: June 29, 2012Preparation <strong>of</strong> supplementary materials for financial results: YesInformation meeting for financial results to be held: Yes (for institutional investors and analysts)― 1 ―Note: Amounts less than 1 million yen are omitted.1. <strong>Consolidated</strong> <strong>Results</strong> <strong>of</strong> <strong>the</strong> <strong>year</strong> <strong>ended</strong> <strong>March</strong> <strong>31</strong>, 2012 (From April 1, 2011 to <strong>March</strong> <strong>31</strong>, 2012)(1) <strong>Financial</strong> <strong>Results</strong> (Percentage represents comparison change to <strong>the</strong> corresponding previous period)Net Sales Operating Income Ordinary Income Net IncomeMillion yen % Million yen % Million yen % Million yen %Year <strong>ended</strong> <strong>March</strong> <strong>31</strong>, 2012 918,651 3.5 80,080 48.2 89,383 60.2 59,305 117.1Year <strong>ended</strong> <strong>March</strong> <strong>31</strong>, 2011 887,512 13.0 54,052 - 55,811 - 27,<strong>31</strong>2 -(Note) Comprehensive Income: Year <strong>ended</strong> <strong>March</strong>, 2012; 55,748 million yen ( 174.3%)Year <strong>ended</strong> <strong>March</strong>, 2011; 20,323 million yen ( -%)Net Income per Net Income per Ratio <strong>of</strong> Ratio <strong>of</strong> Ratio <strong>of</strong>Share <strong>of</strong> Common Share <strong>of</strong> Common Net Income to Ordinary Income Operating IncomeStock Stock after Dilution Shareholders’ Equity to Total Assets to Net SalesYen Yen % % %Year <strong>ended</strong> <strong>March</strong> <strong>31</strong>, 2012 149.57 149.41 14.4 10.6 8.7Year <strong>ended</strong> <strong>March</strong> <strong>31</strong>, 2011 68.90 68.83 7.2 7.1 6.1(Reference) Equity in Earning <strong>of</strong> non-consolidated subsidiaries and affiliates: Year <strong>ended</strong> <strong>March</strong>, 2012; 1,535 million yenYear <strong>ended</strong> <strong>March</strong>, 2011; 1,2<strong>31</strong> million yen(2) <strong>Financial</strong> PositionTotal Assets Net Assets Equity RatioNet Assets per Share <strong>of</strong>Common StockMillion yen Million yen % YenYear <strong>ended</strong> <strong>March</strong> <strong>31</strong>, 2012 860,230 433,616 50.3 1,091.98Year <strong>ended</strong> <strong>March</strong> <strong>31</strong>, 2011 829,909 389,220 46.8 980.62(Reference) Equity: Year <strong>ended</strong> <strong>March</strong> <strong>31</strong>, 2012: 433,011 million yenYear <strong>ended</strong> <strong>March</strong> <strong>31</strong>, 2011: 388,793 million yen(3) Cash FlowsCash Flows fromOperating ActivitiesCash Flows fromInvesting ActivitiesCash Flows fromFinancing ActivitiesCash and Cash Equivalentsat end <strong>of</strong> <strong>year</strong>Million yen Million yen Million yen Million yenYear <strong>ended</strong> <strong>March</strong> <strong>31</strong>, 2012 15,073 (49,144) (15,150) 1<strong>31</strong>,711Year <strong>ended</strong> <strong>March</strong> <strong>31</strong>, 2011 123,613 (23,589) (20,122) 181,0612. DividendsDividend per shareFirst Quarter Second Quarter Third Quarter<strong>ended</strong><strong>ended</strong><strong>ended</strong>Year-end AnnualYen Yen Yen Yen YenYear <strong>ended</strong> <strong>March</strong> <strong>31</strong>, 2011 - 5.00 - 14.00 19.00Year <strong>ended</strong> <strong>March</strong> <strong>31</strong>, 2012 - 17.00 - 21.00 38.00Year ending <strong>March</strong> <strong>31</strong>, 2013(Forecast)19.00 22.00 41.00Total Annual Cash DividendPaidDividend Payout Ratio(<strong>Consolidated</strong>)Dividend Payout to NetAssets Ratio (<strong>Consolidated</strong>)Million yen % %Year <strong>ended</strong> <strong>March</strong> <strong>31</strong>, 2011 7,532 27.6 2.0Year <strong>ended</strong> <strong>March</strong> <strong>31</strong>, 2012 15,067 25.4 3.7Year ending <strong>March</strong> <strong>31</strong>, 2013(Forecast)25.0
As a result <strong>of</strong> <strong>the</strong> foregoing compounded by effects <strong>of</strong> a strong yen, net sales decreased by 1.6% from <strong>the</strong> previousfiscal <strong>year</strong> to 587,127 million yen, with operating income posted at 53,971 million yen.3) Instruments BusinessOf <strong>the</strong> markets related to <strong>the</strong> business, <strong>the</strong> bioscience-related markets faced a challenging environment due to <strong>the</strong>effects <strong>of</strong> deferred government budget implementation in <strong>the</strong> United States, Europe, and o<strong>the</strong>rs. In <strong>the</strong> industrialinstruments-related markets, although capital investment related to smart-phone/tablet terminals was robust, <strong>the</strong>markets were affected by restraint in capital investment related to semiconductors and electronic components.Under <strong>the</strong>se circumstances, <strong>the</strong> Group strove to expand sales in <strong>the</strong> bioscience business by introducing new itemsthat will become core products, such as <strong>the</strong> ECLIPSE Ni/Ci series <strong>of</strong> upright biological microscopes that are widelyused in research and clinical fields, in addition to system products targeting <strong>the</strong> cutting-edge research fields.In <strong>the</strong> industrial instruments business, <strong>the</strong> Group worked to expand sales <strong>of</strong> existing products such as measuringmicroscopes, as well as focusing its efforts on development and sales <strong>of</strong> non-contact 3D metrology devices includingX-ray devices.As a result <strong>of</strong> <strong>the</strong> foregoing, net sales decreased by 2.5% from <strong>the</strong> previous fiscal <strong>year</strong> to 56,000 million yen, whileoperating loss was 3,166 million yen.4) O<strong>the</strong>r BusinessesIn <strong>the</strong> customized products business, <strong>the</strong> Group strived to expand sales <strong>of</strong> space-related products and solid-statelasers, and saw significant growth in sales. In <strong>the</strong> Glass Business, <strong>the</strong> Group made efforts to expand sales <strong>of</strong> LCDphotomask substrates and optical components.As a result <strong>of</strong> <strong>the</strong> foregoing, net sales <strong>of</strong> <strong>the</strong>se businesses increased by 11.7% from <strong>the</strong> previous fiscal <strong>year</strong> to27,379 million yen, with operating income reaching 4,180 million yen.(2) Forecast for <strong>the</strong> fiscal <strong>year</strong> ending <strong>March</strong> <strong>31</strong>, 2013As regards <strong>the</strong> business segments <strong>of</strong> <strong>the</strong> <strong>Nikon</strong> Group, <strong>the</strong> Precision Equipment Business is expected to be affectedby rapidly constricting capital investment by manufacturers in <strong>the</strong> semiconductor market and liquid crystal panelmarket. In <strong>the</strong> Instruments Business, <strong>the</strong> outlook for <strong>the</strong> bioscience market and industrial instruments market isexpected to remain uncertain. In <strong>the</strong> Imaging Products Business, however, <strong>the</strong> digital camera market is predicted tocontinue growing.Under <strong>the</strong>se circumstances, <strong>the</strong> <strong>Nikon</strong> Group will endeavor to expand its main businesses and improve pr<strong>of</strong>itabilitythrough <strong>the</strong> timely market launch <strong>of</strong> competitive products that can <strong>of</strong>fer new value, while broadening <strong>the</strong> scope <strong>of</strong> <strong>the</strong><strong>Nikon</strong> Brand by cultivating new businesses using <strong>Nikon</strong>’s core technologies in fields such as health and medicine. Inaddition, <strong>the</strong> Group will strive to optimize <strong>the</strong> overall business process by streng<strong>the</strong>ning coordination among <strong>the</strong>business functions, create a corporate structure capable <strong>of</strong> dealing with environmental changes with flexibility and asense <strong>of</strong> speed, and deploy its business activities globally with constant attention to CSR. Fur<strong>the</strong>rmore, <strong>the</strong> Groupwill make efforts to fur<strong>the</strong>r reinforce <strong>the</strong> risk-management system, while endeavoring to minimize damage in adisaster.Through <strong>the</strong>se measures, <strong>the</strong> <strong>Nikon</strong> Group is committed to continued growth, and continually <strong>of</strong>fering new value.Current forecast for <strong>the</strong> fiscal <strong>year</strong> ending <strong>March</strong> <strong>31</strong>, 2013 is as below.(From April 1, 2012 to <strong>March</strong> <strong>31</strong>, 2013)Net sales Operating income Ordinary income Net incomeMillion yen % Million yen % Million yen % Million yen %Full <strong>year</strong> 1,030,000 12.1 90,000 12.4 94,000 5.2 65,000 9.6The above forecast is based on <strong>the</strong> following foreign currency exchange rate:1 US dollar = 80 yen, 1 Euro = 105 yen*Forecasts in this disclosure are made by management in light <strong>of</strong> information currency available.A number <strong>of</strong> factors could cause actual results to differ materially from disclosed as above.― 6 ―
2. Analysis <strong>of</strong> financial position<strong>Financial</strong> position as <strong>of</strong> <strong>March</strong> <strong>31</strong>, 2012 as compared with <strong>the</strong> end <strong>of</strong> <strong>the</strong> previous fiscal <strong>year</strong> is as follows.The balance <strong>of</strong> current assets as <strong>of</strong> <strong>March</strong> <strong>31</strong>, 2012 increased by 18,519 million yen to 609,474 million yen(590,954 million yen at <strong>the</strong> end <strong>of</strong> <strong>the</strong> previous fiscal <strong>year</strong>). This is due mainly to <strong>the</strong> increase in notes and accountsreceivable-trade and inventories.The balance <strong>of</strong> noncurrent assets as <strong>of</strong> <strong>March</strong> <strong>31</strong>, 2012 increased by 11,801 million yen to 250,755 million yen(compared to 238,954 million yen at <strong>the</strong> end <strong>of</strong> <strong>the</strong> previous fiscal <strong>year</strong>) mainly due to <strong>the</strong> purchase <strong>of</strong> substituteequipment due to flood damage in Thailand.The balance <strong>of</strong> current liabilities as <strong>of</strong> <strong>March</strong> <strong>31</strong>, 2012 decreased by 286 million yen to 342,009 million yen(compared to 342,295 million yen at <strong>the</strong> end <strong>of</strong> <strong>the</strong> previous fiscal <strong>year</strong>) largely due to <strong>the</strong> decrease in notes andaccounts payable-trade in spite <strong>of</strong> <strong>the</strong> increase in accounts payable related to <strong>the</strong> purchase <strong>of</strong> substitute equipment.The balance <strong>of</strong> noncurrent liabilities as <strong>of</strong> <strong>March</strong> <strong>31</strong>, 2012 decreased by 13,789 million yen to 84,604 million yen(98,393 million yen at <strong>the</strong> end <strong>of</strong> <strong>the</strong> previous fiscal <strong>year</strong>). This is attributable mainly to a reduction in <strong>the</strong> provisionfor retirement benefits as a result <strong>of</strong> lump-sum pension contributions.The balance <strong>of</strong> net assets as <strong>of</strong> <strong>March</strong> <strong>31</strong>, 2012 increased by 44,396 million yen to 433,616 million yen (389,220million yen at <strong>the</strong> end <strong>of</strong> <strong>the</strong> previous fiscal <strong>year</strong>). This is attributable mainly to <strong>the</strong> posting <strong>of</strong> 59,305 million yen innet income.During <strong>the</strong> <strong>year</strong> <strong>ended</strong> <strong>March</strong> <strong>31</strong>, 2012, cash flows from operating activities amounted to 15,073 million yen as aresult mainly <strong>of</strong> <strong>the</strong> posting <strong>of</strong> 86,168 million yen in income before income taxes, <strong>the</strong> increase by 18,681 million yenin notes and accounts receivable-trade and <strong>the</strong> increase by 27,703 million yen in inventories, and decrease by 15,530million yen in notes and accounts payable-trade. Cash flows from investing activities resulted in an expenditure <strong>of</strong>49,144 million yen mainly as a result <strong>of</strong> an expenditure <strong>of</strong> 35,773 million yen for <strong>the</strong> purchase <strong>of</strong> property, plant andequipment. Cash flows from financing activities resulted in an expenditure <strong>of</strong> 15,150 million yen due mainly because<strong>of</strong> 12,278 million yen in cash dividents paid.(Reference) Changes in Cash Flow-Related Indices<strong>March</strong> <strong>31</strong>,2008<strong>March</strong> <strong>31</strong>,2009<strong>March</strong> <strong>31</strong>,2010<strong>March</strong> <strong>31</strong>,2011<strong>March</strong> <strong>31</strong>,2012Equity ratio (%) 47.9 50.5 50.2 46.8 50.3Equity ratio based on marketvalue (%)129.2 58.5 109.2 81.9 115.8Cash flow to interest-bearingdebt ratio (<strong>year</strong>s)0.6 11.4 1.0 0.7 5.7Interest coverage ratio (times) 80.7 8.3 89.5 128.0 14.2(Notes) Equity ratio: Equity/Total assetsEquity ratio based on market value: Total market value <strong>of</strong> shares/Total assetsCash flow to interest-bearing debt ratio: Interest-bearing debt/Operating cash flowsInterest coverage ratio: Operating cash flows/Interest payments*All indices are calculated based on consolidated financial data.*The total market value <strong>of</strong> shares is calculated in accordance with <strong>the</strong> formula: final share price as <strong>of</strong> <strong>the</strong>end <strong>of</strong> <strong>the</strong> fiscal <strong>year</strong> x numbers <strong>of</strong> shares issued (after deducting treasury stock).*Operating cash flows are <strong>the</strong> cash flows from operating activities as indicated in <strong>the</strong> consolidated cash flowstatement. Interest-bearing debts include <strong>the</strong> short-term and long-term loans payable as posted in <strong>the</strong>consolidated balance sheet. As regards interest payments, <strong>the</strong> amount <strong>of</strong> interest paid as shown in <strong>the</strong>consolidated cash flow statement is used.3. Shareholder returns policy and dividends<strong>Nikon</strong>’s basic dividend policy is to improve <strong>the</strong> reflection <strong>of</strong> business performance based on paying a steady,continuous dividend, as well as expanding <strong>the</strong> investment for <strong>the</strong> future growth and streng<strong>the</strong>ning <strong>of</strong> competitiveness.More specifically, its present goal is to provide a total return ratio <strong>of</strong> 25% or more.The Group set <strong>the</strong> <strong>year</strong>-end dividends at 21 yen per share, an increase <strong>of</strong> 7 yen from previous fiscal <strong>year</strong>, due to <strong>the</strong>increase in both revenue and pr<strong>of</strong>it. As a result, cash dividends for <strong>the</strong> fiscal <strong>year</strong> <strong>ended</strong> <strong>March</strong> <strong>31</strong>, 2012 will be 38yen per share including 17 yen <strong>of</strong> interim dividend.As for <strong>the</strong> dividends <strong>of</strong> <strong>the</strong> fiscal <strong>year</strong> ending <strong>March</strong> <strong>31</strong>, 2013, <strong>the</strong> Group plans to pay 41 yen per share including 19yen <strong>of</strong> interim dividend.― 7 ―
<strong>of</strong> a new technology, which may impact pr<strong>of</strong>it.In <strong>the</strong> Imaging Products Business, given <strong>the</strong> rapid technological advances in and increasing sophistication anddiversification <strong>of</strong> digital cameras, continual investment is required for <strong>the</strong> development <strong>of</strong> new technologies andnew products. However, <strong>the</strong>re is a conceivable possibility that a technology or a product that was developed willnot lead to an increase in pr<strong>of</strong>it should <strong>the</strong> investment fail to produce adequate results or should <strong>the</strong>re be anabrupt shift in demand to higher functioning digital equipment. As with <strong>the</strong> Precision Equipment Business,should a competitor acquire a patent on a new technology, <strong>the</strong>re is a danger that <strong>the</strong> production and/or sale <strong>of</strong> aproduct will be susp<strong>ended</strong> or <strong>of</strong> a decrease in pr<strong>of</strong>it margin due to <strong>the</strong> payment <strong>of</strong> royalty, which may impactpr<strong>of</strong>it.(5) Intensification <strong>of</strong> price competitionCompetition is intensifying with respect to digital cameras, which are <strong>the</strong> leading products <strong>of</strong> <strong>the</strong> ImagingProducts Business, with both Japanese and overseas electrical equipment manufacturers entering <strong>the</strong> market inaddition to <strong>the</strong> traditional camera manufacturers. As <strong>the</strong> product life cycle is short, particularly in <strong>the</strong> case <strong>of</strong>compact digital cameras, all companies have <strong>the</strong> tendency to try to sell mass-produced products within a shortperiod, with <strong>the</strong> slowing market growth fur<strong>the</strong>r spurring price competition.As for IC steppers and scanners, while <strong>the</strong> development <strong>of</strong> cutting-edge technologies is progressing, <strong>the</strong>re is apossibility that competitors will launch an <strong>of</strong>fensive with low-priced steppers and scanners.In <strong>the</strong> Instruments business, <strong>the</strong> maturing <strong>of</strong> <strong>the</strong> microscope market is fur<strong>the</strong>r promoting <strong>the</strong> competition todifferentiate products, while fanning price competition in <strong>the</strong> mid- and low-range markets. There is a possibilitythat <strong>the</strong> <strong>Nikon</strong> Group's pr<strong>of</strong>it and financial position will be affected adversely, should <strong>the</strong>re be a sharp and suddendecrease in prices.(6) Overseas business operationsThe <strong>Nikon</strong> Group is dependent on foreign countries for a significant portion <strong>of</strong> its production and salesactivities. Hence, it is affected by changes in various import and export laws, tax systems, and regulation in Japanand o<strong>the</strong>r countries in which <strong>the</strong> Group operates. Fur<strong>the</strong>r, in conducting business operations overseas, <strong>the</strong>re is apossibility that major problems will be encountered and/or losses will be incurred in conducting businessactivities, due to such risks as changes in political regimes or economic climate; social chaos caused by riots,terrorism, wars, infectious diseases, etc.; problems with such infrastructures or logistics-related functions as water,electricity, and communications network due to natural disaster; and difficulty hiring human resources or loss<strong>the</strong>re<strong>of</strong>. There is a possibility that <strong>the</strong> <strong>Nikon</strong> Group's pr<strong>of</strong>it and financial status will be affected adversely as aresult <strong>of</strong> production and sales being limited by <strong>the</strong> foregoing.(7) Risk <strong>of</strong> fluctuations in exchange rateThe <strong>Nikon</strong> Group is highly dependent on overseas market, with overseas sales accounting for as much as85.8% <strong>of</strong> net sales. While <strong>the</strong> Group is appropriately hedging foreign exchange risks in accordance with salesvolumes and <strong>the</strong> sales region, <strong>the</strong> net sale <strong>of</strong> and pr<strong>of</strong>it from products and services subject to foreign currencytransactions, or <strong>the</strong> yen values <strong>of</strong> <strong>the</strong> income, losses, assets and liabilities <strong>of</strong> overseas consolidated subsidiarieswill be affected should <strong>the</strong>re be a sharp fluctuation in foreign exchange rates.(8) Fund procurement riskWhile <strong>the</strong> <strong>Nikon</strong> Group is procuring funds as <strong>the</strong> need arises with due consideration for <strong>the</strong> balance betweenlong-term and short-term funds, as well as between direct and indirect financing, <strong>the</strong>re is a possibility that sucheffects as an increase in interest rates on <strong>the</strong> fund procured or limitation <strong>of</strong> <strong>the</strong> means for procuring fund mayarise should <strong>the</strong> financial market climate deteriorate fur<strong>the</strong>r. There is a possibility that fund procurement by <strong>the</strong>Group will also be impacted should <strong>the</strong> rating <strong>of</strong> <strong>the</strong> Company's bond be revised downward due to a decline inbusiness performance.(9) Risk relating to <strong>the</strong> protection <strong>of</strong> and litigations on intellectual property rightsThe <strong>Nikon</strong> Group acquires and holds numerous intellectual property rights as it develops products. In somecases, <strong>the</strong> Group licenses such intellectual property rights to o<strong>the</strong>r companies. Although utmost efforts are beingmade for <strong>the</strong> maintenance and protection <strong>of</strong> <strong>the</strong>se intellectual property rights, <strong>the</strong>re is a possibility thatconsiderable litigation expenses will be incurred should a lawsuit be filed in connection with an unlicensed use <strong>of</strong><strong>the</strong> Group's intellectual property rights by ano<strong>the</strong>r company.Fur<strong>the</strong>r, <strong>the</strong>re is a possibility that o<strong>the</strong>r companies, individuals, or entities will file a complaint against <strong>the</strong><strong>Nikon</strong> Group for an alleged infringement on <strong>the</strong>ir intellectual property rights, although <strong>the</strong> Group is payingadequate attention to avoiding infringing third-party intellectual property rights in conducting productdevelopment. Should such a situation occur, <strong>the</strong>re is a possibility that <strong>the</strong> Group's pr<strong>of</strong>it and financial positionwill be affected significantly.(10) Securing key personnel and outflow <strong>of</strong> human resources and know-howThe <strong>Nikon</strong> Group is supported by its employees, who possess advanced technical and o<strong>the</strong>r expertise andabilities, and securing such human resources is becoming increasingly more important in order to win throughintense competitions in <strong>the</strong> market. However, should labor fluidity increase fur<strong>the</strong>r for some reason, <strong>the</strong>re is a― 9 ―
possibility that such key personnel will resign, taking <strong>the</strong>ir expertise and know-how with <strong>the</strong>m. In order tominimize such outflow <strong>of</strong> expertise and know-how, <strong>the</strong> internal transmission, standardization and sharing <strong>of</strong>proprietary technologies and skills are being promoted. While it is important to secure competent humanresources locally overseas, it is believed that <strong>the</strong> possibility <strong>of</strong> an outflow <strong>of</strong> human resources is particularly highin regions with high labor fluidity.Since long-term education and training are essential in order to foster human resources given <strong>the</strong> rapidtechnological renovations in <strong>the</strong> business that <strong>the</strong> Group is engaged in, replacing key personnel that depart maybe difficult at times and may thus adversely affect <strong>the</strong> Group's future growth, pr<strong>of</strong>it and financial position.(11) Information LeaksThe <strong>Nikon</strong> Group retains such important information as technical information, corporate information, and <strong>the</strong>personal information <strong>of</strong> its customers and o<strong>the</strong>r persons concerned. Among o<strong>the</strong>r things, <strong>the</strong> Group is enhancingits internal regulations on <strong>the</strong> handling <strong>of</strong> information and educating its employees, while thoroughly controllingexternal access to such information and improving <strong>the</strong> level <strong>of</strong> storage security. However, in <strong>the</strong> rare event <strong>of</strong>leakage <strong>of</strong> <strong>the</strong> Company's confidential information, including technical information, <strong>the</strong>re is a possibility that <strong>the</strong>corporate value <strong>of</strong> <strong>the</strong> <strong>Nikon</strong> Group will be damaged. Fur<strong>the</strong>r, should corporate or personal information leak out,<strong>the</strong> Group would not only suffer damages to its credibility, but would also be subject to claims for compensationfrom such entities as business partners, customers, employees or o<strong>the</strong>r entities suffering <strong>the</strong> effect <strong>of</strong> <strong>the</strong> leak.Should this occur, <strong>the</strong>re is a possibility that <strong>the</strong> Group's pr<strong>of</strong>it and financial position will be affected adversely astremendous costs will be necessary for various activities related to <strong>the</strong> recovery <strong>of</strong> trust, compensation to subjectcompanies and individuals, implementation <strong>of</strong> measures to prevent recurrence, and o<strong>the</strong>r necessities.(12) Defects in products and servicesAs concerns <strong>the</strong> <strong>Nikon</strong> Group's products and services, advanced quality assurance systems are in place withinJapanese and overseas Group companies, as well as production contractors, in order to provide customers withhighly trustable and sophisticated products. However, in <strong>the</strong> rare event that a customer suffers a loss due to adefect in a product or service, <strong>the</strong>re is a possibility that pr<strong>of</strong>it and financial position will be adversely affected,<strong>the</strong>re being <strong>the</strong> risk that large amounts will be incurred in repair expenses and costs related to liability, recall,disposal <strong>of</strong> products and <strong>the</strong> like, in addition to <strong>the</strong> decreased desire <strong>of</strong> customers to purchase <strong>the</strong> Group'sproducts and services due to a decrease in customer trust in <strong>the</strong> <strong>Nikon</strong> brand.(13) Occurrence <strong>of</strong> natural disasters, etc.Due attention is being paid to measures relating to such natural disasters as earthquakes, fires and flood, andmeasures to counter <strong>the</strong> expansion <strong>of</strong> such infectious diseases as new strains <strong>of</strong> influenza, giving priority inparticular to <strong>the</strong> promotion <strong>of</strong> <strong>the</strong> business continuity plan (BCP), which was formulated as a part <strong>of</strong> earthquakecountermeasures. However, <strong>the</strong>re is <strong>the</strong> risk that operations will be susp<strong>ended</strong> and production and shipment willbe delayed, should <strong>the</strong> Group's development or productions sites, suppliers or o<strong>the</strong>r relevant parties suffer criticaldamage. There is a possibility that <strong>the</strong> Group's pr<strong>of</strong>it and financial position will be adversely affected, should netsales decrease and considerable expenses be incurred for business recovery as a result <strong>the</strong>re<strong>of</strong>.(14) Damages to brand valueThe <strong>Nikon</strong> Group is making utmost efforts to protect and enhance <strong>the</strong> '<strong>Nikon</strong> Brand,' which was fostered over<strong>year</strong>s <strong>of</strong> corporate management marked with integrity and provision <strong>of</strong> products and services that are worthy <strong>of</strong>customer trust. However, <strong>the</strong>re is a possibility that <strong>the</strong> Group's pr<strong>of</strong>it and financial position will be adverselyaffected should trust in <strong>the</strong> brand decline and <strong>the</strong> value <strong>of</strong> <strong>the</strong> <strong>Nikon</strong> brand be damaged, as a result <strong>of</strong> <strong>the</strong>circulation <strong>of</strong> negative reputation or evaluation <strong>of</strong> <strong>the</strong> Group's technologies, products or services.― 10 ―
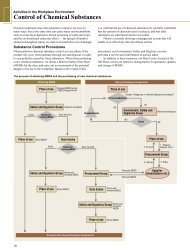
2. Status <strong>of</strong> <strong>Nikon</strong> GroupThe <strong>Nikon</strong> Group is comprised <strong>of</strong> <strong>Nikon</strong> Corporation (<strong>the</strong> Company), its 86 subsidiaries, and 11 affiliates. While <strong>the</strong>principal operations <strong>of</strong> <strong>the</strong> Group are manufacturing and sales relating to <strong>the</strong> precision equipment, imaging product,instruments, and o<strong>the</strong>r businesses, it is also engaged in o<strong>the</strong>r operations and activities incidental <strong>the</strong>reto, such asservices.Flow <strong>of</strong> products (outsourced processing)Flow <strong>of</strong> manufacturing componentsFlow <strong>of</strong> productsCustomers* Company engaged in precision equipment business** Company engaged in imaging products business*** Company engaged in instruments business****Company engaged in o<strong>the</strong>r business+ Company engaged in multiple businessesSubsidiaries** <strong>Nikon</strong> Imaging Japan Inc.*** <strong>Nikon</strong> Instech Co., Ltd.** <strong>Nikon</strong> Vision Co., Ltd.* <strong>Nikon</strong> Tec Corporationand three o<strong>the</strong>r companiesAffiliates**** <strong>Nikon</strong>-Essilor Co., Ltd.**** <strong>Nikon</strong>-Trimble Co., Ltd.and one o<strong>the</strong>r companySubsidiaries** <strong>Nikon</strong> Inc.*** <strong>Nikon</strong> Instruments Inc.+ <strong>Nikon</strong> Canada Inc.* <strong>Nikon</strong> Precision Inc.and five o<strong>the</strong>r companiesAffiliate one companySubsidiaries** <strong>Nikon</strong> Europe B.V.*** <strong>Nikon</strong> Instrument Europe B.V.+ <strong>Nikon</strong> AG+ <strong>Nikon</strong> GmbH+ <strong>Nikon</strong> France S.A.S.+ <strong>Nikon</strong> U.K. Ltd.* <strong>Nikon</strong> Precision Europe GmbH** <strong>Nikon</strong> Nordic AB** <strong>Nikon</strong> Polska Sp.z.o.o.and seven o<strong>the</strong>r companiesSubsidiaries** <strong>Nikon</strong> Hong Kong Ltd.** <strong>Nikon</strong> Singapore Pte Ltd* <strong>Nikon</strong> Precision Korea Ltd.* <strong>Nikon</strong> Precision Taiwan Ltd.** <strong>Nikon</strong> Imaging (China) Sales Co., Ltd.** <strong>Nikon</strong> Imaging Korea Co., Ltd.and nine o<strong>the</strong>r companies(Japanese sales & services companies) (North American sales & services companies)(European sales & services companies)(Asian and Oceanian sales & services companies)〔 <strong>Nikon</strong> Corporation 〕Precision Equipment Business Imaging Products Business Instruments Business O<strong>the</strong>r BusinessSubsidiaries** Tochigi <strong>Nikon</strong> Corporation* Tochigi <strong>Nikon</strong> Precision Co., Ltd.** Sendai <strong>Nikon</strong> Corporation* Miyagi <strong>Nikon</strong> Precision Co., Ltd.**** Hikari Glass Co., Ltd.and three o<strong>the</strong>r companiesSubsidiaries** <strong>Nikon</strong> (Thailand) Co., Ltd.** <strong>Nikon</strong> Imaging (China) Co., Ltd.and six o<strong>the</strong>r companiesAffiliates two companies(Japanese manufacturing companies)(Overseas manufacturing companies)Subsidiaries**** <strong>Nikon</strong> Systems Inc.**** <strong>Nikon</strong> Business Services Co., Ltd.*** <strong>Nikon</strong> Metrology NVand seventeen o<strong>the</strong>r companiesAffiliates five companies(O<strong>the</strong>r)― 11 ―Subsidiaries**** <strong>Nikon</strong> Americas Inc.**** <strong>Nikon</strong> Holdings Europe B.V.**** <strong>Nikon</strong> Holdings Hong Kong Limited(Overseas holding companies)
3. Management Policies(1) Company’s Basic Management PoliciesThe Company’s management vision, under <strong>the</strong> business philosophy <strong>of</strong> “Trustworthiness and Creativity,” is “OurAspirations.”Our Philosophy“Trustworthiness and Creativity”Our Aspirations“Meeting needs. Exceeding expectations.”・ Providing customers with new value that exceeds <strong>the</strong>ir expectations.・ Sustaining growth through a break with <strong>the</strong> past and a passionate commitment by one and all.・ Maximizing our understanding <strong>of</strong> light to lead <strong>the</strong> way towards transformation and a new future.・ Maintaining integrity in order to contribute to social prosperity(2) Targeted management indicesThe Group made a unified effort to vigorously progress for <strong>the</strong> achievement <strong>of</strong> its goal, as set out in <strong>the</strong> MediumTerm Management Plan announced in June 2010, to realize “<strong>the</strong> <strong>Nikon</strong> Group that keeps on providing customerswith new values and generates sustainable growth.”A new Medium Term Management Plan is announced in May 2012, with a performance target toward <strong>March</strong> <strong>31</strong>,2015. Under <strong>the</strong> plan, we aim to achieve 1,250 billion yen in net sales and 150 billion yen in operating income for <strong>the</strong>fiscal <strong>year</strong> ending <strong>March</strong> <strong>31</strong>, 2015.(3) Medium and long-term management strategies and issues to be addressedFor <strong>the</strong> <strong>Nikon</strong> Group to continuously provide new value, its medium- and long-term management will be effectedby focusing on <strong>the</strong> following measures.・ To constantly provide customers with new value, and fur<strong>the</strong>r grow <strong>the</strong> <strong>Nikon</strong> brand.・ To realize a <strong>Nikon</strong> Group with a strong corporate structure to deal with environmental changes withflexibility and a sense <strong>of</strong> speed.・ To achieve a solid leading position for existing businesses.・ To move ahead with advances into new domains, and discover businesses that will be pillars <strong>of</strong> <strong>the</strong> <strong>Nikon</strong>Group within <strong>the</strong> fiscal <strong>year</strong>s <strong>of</strong> <strong>the</strong> plan.・ To recognize <strong>the</strong> importance <strong>of</strong> Corporate Social Responsibility (CSR), and contribute to <strong>the</strong> sustainabledevelopment <strong>of</strong> society.Fur<strong>the</strong>rmore, in light <strong>of</strong> <strong>the</strong> Great East Japan Earthquake and Thai flood, <strong>the</strong> entire Group is making efforts torevise and streng<strong>the</strong>n <strong>the</strong> BCP (Business Continuity Plan) to prepare for major earthquakes or o<strong>the</strong>r disasters that areanticipated in <strong>the</strong> future.― 12 ―
4. <strong>Consolidated</strong> <strong>Financial</strong> Statements(1) <strong>Consolidated</strong> Balance Sheets(Million yen)As <strong>of</strong> <strong>March</strong> <strong>31</strong>, 2011 As <strong>of</strong> <strong>March</strong> <strong>31</strong>, 2012AssetsCurrent assetsCash and deposits 181,077 132,404Notes and accounts receivable-trade 123,077 137,533Inventories 236,407 263,033Deferred tax assets 42,640 47,110O<strong>the</strong>r 15,118 34,061Allowance for doubtful accounts (7,365) (4,667)Total Current Assets 590,954 609,474Noncurrent assetsProperty, plant and equipmentBuildings and structures, net 43,362 37,807Machinery, equipment and vehicles, net 34,003 35,200Land 14,777 14,609Lease assets, net 5,794 4,901Construction in progress 7,566 23,809O<strong>the</strong>r, net 13,511 14,615Total property, plant and equipment 119,016 130,943Intangible assetsTotal intangible assets 39,473 33,085Investments and o<strong>the</strong>r assetsInvestment securities 56,303 55,355Deferred tax assets 17,604 13,293O<strong>the</strong>r 6,817 18,284Allowance for doubtful accounts (260) (207)Total investments and o<strong>the</strong>r assets 80,465 86,727Total noncurrent assets 238,954 250,755Total assets 829,909 860,230― 13 ―
(Million yen)As <strong>of</strong> <strong>March</strong> <strong>31</strong>, 2011 As <strong>of</strong> <strong>March</strong> <strong>31</strong>, 2012LiabilitiesCurrent liabilitiesNotes and accounts payable-trade 171,735 155,338Short-term loans payable 16,732 18,350Lease obligations 2,422 2,163Accrued expenses 54,545 54,751Income taxes payable 2,520 15,076Advances received 63,626 54,214Provision for product warranties 7,296 7,594O<strong>the</strong>r 23,415 34,519Total current liabilities 342,295 342,009Noncurrent liabilitiesBonds payable 40,000 40,000Long-term loans payable 24,700 22,900Lease obligations 3,620 2,953Provision for retirement benefits 14,951 3,700Provision for directors' retirement benefits 606 -Asset retirement obligations 2,324 2,365O<strong>the</strong>r 12,191 12,684Total noncurrent liabilities 98,393 84,604Total liabilities 440,689 426,613Net assetsShareholders' equityCapital stock 65,475 65,475Capital surplus 80,711 80,711Retained earnings 272,227 <strong>31</strong>9,823Treasury stock (13,173) (12,992)Total shareholders' equity 405,241 453,017Accumulated o<strong>the</strong>r comprehensive incomeValuation difference on available-for-sale securities 4,450 3,061Deferred gains or losses on hedges (696) (1,592)Foreign currency translation adjustment (20,201) (21,474)Total accumulated o<strong>the</strong>r comprehensive income (16,448) (20,005)Subscription rights to shares 427 604Total net assets 389,220 433,616Total liabilities and net assets 829,909 860,230― 14 ―
(2) <strong>Consolidated</strong> Statements <strong>of</strong> Income and Statements <strong>of</strong> Comprehensive Income1<strong>Consolidated</strong> Statements <strong>of</strong> Income(Million yen)Year <strong>ended</strong> <strong>March</strong> <strong>31</strong>, 2011 Year <strong>ended</strong> <strong>March</strong> <strong>31</strong>, 2012Net sales 887,512 918,651Cost <strong>of</strong> sales 575,535 567,000Gross pr<strong>of</strong>it <strong>31</strong>1,977 351,651Selling, general and administrative expenses 257,924 271,570Operating income 54,052 80,080Non-operating incomeInterest income 632 941Dividends income 1,061 1,130Foreign exchange gains 2,995 4,079Equity in earnings <strong>of</strong> affiliates 1,2<strong>31</strong> 1,535O<strong>the</strong>r 3,939 4,230Total non-operating income 9,860 11,917Non-operating expensesInterest expenses 945 1,037O<strong>the</strong>r 7,156 1,576Total non-operating expenses 8,101 2,614Ordinary income 55,811 89,383Extraordinary incomeGain on sales <strong>of</strong> noncurrent assets 91 159Gain on sales <strong>of</strong> investment securities 30 65Insurance income - 15,920Total extraordinary income 121 16,144Extraordinary lossLoss on retirement <strong>of</strong> noncurrent assets 1,000 250Loss on sales <strong>of</strong> noncurrent assets 47 4Impairment loss 397 6,502Loss on sales <strong>of</strong> investment securities 82 96Loss on valuation <strong>of</strong> investment securities 4,512 0Loss on adjustment for changes <strong>of</strong> accountingstandard for asset retirement obligations1,073 -Loss on disaster 2,<strong>31</strong>3 12,505Total extraordinary losses 9,427 19,360Income before income taxes 46,505 86,168Income taxes 19,193 26,862Income before minority interests 27,<strong>31</strong>2 59,305Net income 27,<strong>31</strong>2 59,305― 15 ―
2<strong>Consolidated</strong> Statements <strong>of</strong> Comprehensive Income(Million yen)Year <strong>ended</strong> <strong>March</strong> <strong>31</strong>, 2011 Year <strong>ended</strong> <strong>March</strong> <strong>31</strong>, 2012Income before minority interests 27,<strong>31</strong>2 59,305O<strong>the</strong>r comprehensive incomeValuation difference on available-for-sale securities (1,595) (1,398)Deferred gains or losses on hedges (666) (895)Foreign currency translation adjustment (4,230) (1,272)Share <strong>of</strong> o<strong>the</strong>r comprehensive income <strong>of</strong> associatesaccounted for using equity method(496) 9Total o<strong>the</strong>r comprehensive income (6,989) (3,557)Comprehensive income 20,323 55,748(Breakdown)Comprehensive income attributable to owners <strong>of</strong><strong>the</strong> parent20,323 55,748― 16 ―
(3) <strong>Consolidated</strong> Statements <strong>of</strong> Changes in Net Assets Year <strong>ended</strong> <strong>March</strong> <strong>31</strong>, 2011(Million yen)Shareholders’ equityCapital stock Capital surplus Retained earnings Treasury stockTotal shareholders’equityBalance <strong>of</strong> April 1, 2010 65,475 80,711 248,368 (13,353) 381,202Changes <strong>of</strong> items during <strong>the</strong> periodDividents from surplus (1,585) (1,585)Dividents from surplus(interim dividents)(1,982) (1,982)Net income or loss 27,<strong>31</strong>2 27,<strong>31</strong>2Purchase <strong>of</strong> treasury stock (12) (12)Disposal <strong>of</strong> treasury stock (115) 192 77Changes in <strong>the</strong> number <strong>of</strong>consolidated subsidiaries229 229Net changes <strong>of</strong> items o<strong>the</strong>rthan shareholders’ equityTotal changes <strong>of</strong> items during<strong>the</strong> period- - 23,858 180 24,039Balance <strong>of</strong> <strong>March</strong> <strong>31</strong>, 2011 65,475 80,711 272,227 (13,173) 405,241Valuationdifference onavailable-for-salesecuritiesValuation and translation adjustmentsDeferred gains orlosses on hedgesForeigncurrencytranslationadjustmentsTotal valuationand translationadjustmentsSubscriptionrights tosharesTotal netassetsBalance <strong>of</strong> April 1, 2010 6,060 (30) (15,489) (9,459) 326 372,069Changes <strong>of</strong> items during <strong>the</strong> periodDividents from surplus (1,585)Dividents from surplus(interim dividents)(1,982)Net income or loss 27,<strong>31</strong>2Purchase <strong>of</strong> treasury stock (12)Disposal <strong>of</strong> treasury stock 77Changes in <strong>the</strong> number <strong>of</strong>consolidated subsidiariesNet changes <strong>of</strong> items o<strong>the</strong>rthan shareholders’ equityTotal changes <strong>of</strong> items during<strong>the</strong> period(1,610) (666) (4,712) (6,989) 100 (6,888)(1,610) (666) (4,712) (6,989) 100 17,150229Balance <strong>of</strong> <strong>March</strong> <strong>31</strong>, 2011 4,450 (696) (20,201) (16,448) 427 389,220― 17 ―
<strong>Consolidated</strong> Statements <strong>of</strong> Changes in Net Assets Year <strong>ended</strong> <strong>March</strong> <strong>31</strong>, 2012(Million yen)Shareholders’ equityCapital stock Capital surplus Retained earnings Treasury stockTotal shareholders’equityBalance <strong>of</strong> April 1, 2011 65,475 80,711 272,227 (13,173) 405,241Changes <strong>of</strong> items during <strong>the</strong> periodDividents from surplus (5,550) (5,550)Dividents from surplus(interim dividents)(6,740) (6,740)Net income or loss 59,305 59,305Purchase <strong>of</strong> treasury stock (6) (6)Disposal <strong>of</strong> treasury stock (111) 186 75Changes in <strong>the</strong> number <strong>of</strong>consolidated subsidiaries692 692Net changes <strong>of</strong> items o<strong>the</strong>rthan shareholders’ equityTotal changes <strong>of</strong> items during<strong>the</strong> period- - 47,595 180 47,776Balance <strong>of</strong> <strong>March</strong> <strong>31</strong>, 2012 65,475 80,711 <strong>31</strong>9,823 (12,992) 453,017Valuationdifference onavailable-for-salesecuritiesValuation and translation adjustmentsDeferred gains orlosses on hedgesForeigncurrencytranslationadjustmentsTotal valuationdifference onavailable-for-salesecuritiesSubscriptionrights tosharesTotal netassetsBalance <strong>of</strong> April 1, 2011 4,450 (696) (20,201) (16,448) 427 389,220Changes <strong>of</strong> items during <strong>the</strong> periodDividents from surplus (5,550)Dividents from surplus(interim dividents)(6,740)Net income or loss 59,305Purchase <strong>of</strong> treasury stock (6)Disposal <strong>of</strong> treasury stock 75Changes in <strong>the</strong> number <strong>of</strong>consolidated subsidiariesNet changes <strong>of</strong> items o<strong>the</strong>rthan shareholders’ equityTotal changes <strong>of</strong> items during<strong>the</strong> period(1,388) (895) (1,272) (3,557) 177 (3,379)(1,388) (895) (1,272) (3,557) 177 44,396692Balance <strong>of</strong> <strong>March</strong> <strong>31</strong>, 2012 3,061 (1,592) (21,474) (20,005) 604 433,616― 18 ―
(4) <strong>Consolidated</strong> Statements <strong>of</strong> Cash Flows(Million yen)Year <strong>ended</strong> <strong>March</strong> <strong>31</strong>, 2011 Year <strong>ended</strong> <strong>March</strong> <strong>31</strong>, 2012Cash flows from operating activitiesIncome before income tax 46,505 86,168Depreciation and amortization 34,033 32,570Impairment loss 399 12,127Increase (decrease) in allowance for doubtful accounts (602) (2,424)Increase (decrease) in provision for product warranties 1,042 366Increase (decrease) in provision for retirement benefits (2,134) (11,186)Increase (decrease) in provision for directors' retirement benefits 3 (606)Interest and dividends income (1,694) (2,072)Equity in (earnings) losses <strong>of</strong> affiliates (1,2<strong>31</strong>) (1,535)Interest expenses 945 1,037Loss (gain) on sales <strong>of</strong> noncurrent assets (43) (155)Loss on retirement <strong>of</strong> noncurrent assets 1,007 1,022Loss (gain) on sales <strong>of</strong> investment securities 52 30Loss (gain) on valuation <strong>of</strong> investment securities 4,512 0Decrease (increase) in notes and accounts receivable-trade (14,843) (18,681)Decrease (increase) in inventories (34,032) (27,703)Increase (decrease) in notes and accounts payable-trade 47,027 (15,530)Increase (decrease) in advances received 29,303 (9,608)O<strong>the</strong>r, net 23,451 (16,862)Subtotal 133,701 26,959Interest and dividends income received 2,465 3,275Interest expenses paid (965) (1,063)Income taxes (paid) refund (11,587) (14,098)Net cash provided by (used in) operating activities 123,613 15,073Cash flows from investing activitiesPurchase <strong>of</strong> property, plant and equipment (22,885) (35,773)Proceeds from sales <strong>of</strong> property, plant and equipment 722 1,303Purchase <strong>of</strong> investment securities (433) (789)Proceeds from sales <strong>of</strong> investment securities 685 392Decrease (increase) in loans receivable 398 (1,225)Proceeds from compensation for expropriation 2,<strong>31</strong>7 -O<strong>the</strong>r, net (4,392) (13,053)Net cash provided by (used in) investing activities (23,589) (49,144)Cash flows from financing activitiesNet increase (decrease) in short-term loans payable 121 (1,548)Proceeds from long-term loans payable 10,000 2,900Repayment <strong>of</strong> long-term loans payable (10,530) (1,760)Proceeds from issuance <strong>of</strong> bonds 19,892 -Redemption <strong>of</strong> bonds (32,900) -Cash dividends paid (3,573) (12,278)O<strong>the</strong>r, net (3,1<strong>31</strong>) (2,463)Net cash provided by (used in) financing activities (20,122) (15,150)Effect <strong>of</strong> exchange rate change on cash and cash equivalents (3,741) (665)Net increase (decrease) in cash and cash equivalents 76,160 (49,886)Cash and cash equivalents at beginning <strong>of</strong> period 104,669 181,061Increase in cash and cash equivalents from newly consolidatedsubsidiary2<strong>31</strong> 536Cash and cash equivalents at end <strong>of</strong> period 181,061 1<strong>31</strong>,711― 19 ―
(5) Note on assumptions for going concernNot applicable(6) Basis <strong>of</strong> Presenting <strong>Consolidated</strong> <strong>Financial</strong> Statements1. Scope <strong>of</strong> Consolidation(1)Number <strong>of</strong> <strong>Consolidated</strong> subsidiaries: 68 companiesPrincipal subsidiaries:Tochigi <strong>Nikon</strong> Corporation , Tochigi <strong>Nikon</strong> Precision Co., Ltd., Sendai <strong>Nikon</strong> Corporation , Miyagi <strong>Nikon</strong>Precision Co., Ltd., <strong>Nikon</strong> Imaging Japan Inc., <strong>Nikon</strong> Instech Co., Ltd., <strong>Nikon</strong> (Thailand) Co., Ltd., <strong>Nikon</strong> Imaging(China) Co., Ltd., <strong>Nikon</strong> Hong Kong Ltd., <strong>Nikon</strong> Inc., <strong>Nikon</strong> Precision Inc., <strong>Nikon</strong> Europe B.V. and o<strong>the</strong>rs.[Additions: 2 companies]<strong>Nikon</strong> Staff Service Corporation, <strong>Nikon</strong> India Pvt. Ltd.[Exclusions: 2 companies]Two subsidiaries <strong>of</strong> <strong>Nikon</strong> Metrology NV (Completion <strong>of</strong> liquidation)(2)Non-consolidated subsidiaries: 18 companiesMajor company name : Nanjing <strong>Nikon</strong> Jiangnan Optical Instrument Co., Ltd.Since <strong>the</strong>se companies are small in scale, <strong>the</strong>ir combined assets, net sales, net income(<strong>the</strong> company’s interestshare) and retained earnings(<strong>the</strong> company’s interest share) have a minimal effect on <strong>the</strong> company’s consolidatedfinancial statements, and <strong>the</strong>y are insignificant in general, <strong>the</strong>y are not included in <strong>the</strong> scope <strong>of</strong> consolidation.2. Scope <strong>of</strong> Equity Method(1)Number <strong>of</strong> Associated Company accounted for by Equity Method : 2 companiesCompany name : <strong>Nikon</strong>-Essilor Co., Ltd. , <strong>Nikon</strong>-Trimble Co., Ltd.(2)Number <strong>of</strong> Non-consolidated company not accounted for by Equity Method : 18 companiesMajor company name : Nanjing <strong>Nikon</strong> Jiangnan Optical Instrument Co., Ltd.(3) Number <strong>of</strong> Associated company not accounted for by Equity Method : 9 companiesMajor company name : Nihon System Seigyo K.K.Since <strong>the</strong>se companies are small in scale, net income(<strong>the</strong> company’s interest share) and retained earnings(<strong>the</strong>company’s interest share) have a minimal effect on <strong>the</strong> company’s consolidated financial statements, and <strong>the</strong>y areinsignificant in general.(7) Changes in Basis <strong>of</strong> Presenting <strong>Consolidated</strong> <strong>Financial</strong> StatementsAdditional Information(Application <strong>of</strong> “Accounting Standard for Accounting Changes and Error Corrections,” etc.)The Group applies <strong>the</strong> “Accounting Standard for Accounting Changes and Error Corrections” (ASBJ StatementNo. 24 <strong>of</strong> December 4, 2009) and <strong>the</strong> “Guidance on Accounting Standard for Accounting Changes and ErrorCorrections” (ASBJ Guidance No. 24 <strong>of</strong> December 4, 2009) for accounting changes and corrections <strong>of</strong> prior perioderrors which are made from <strong>the</strong> beginning <strong>of</strong> <strong>the</strong> current fiscal <strong>year</strong>.Retirement benefitsDuring <strong>the</strong> current fiscal <strong>year</strong>, <strong>the</strong> sum <strong>of</strong> 14,600 million yen was contributed to <strong>the</strong> retirement benefit trust witha view to streng<strong>the</strong>ning <strong>the</strong> financial soundness <strong>of</strong> its retirement benefits plan.― 20 ―
(8) Notes to <strong>Consolidated</strong> <strong>Financial</strong> Statements1) <strong>Consolidated</strong> Statements <strong>of</strong> Income1. Principal Items and Amounts under Selling, General and Administrative ExpensesFiscal <strong>year</strong> <strong>ended</strong><strong>March</strong> <strong>31</strong>,2011(From April 1 2010to <strong>March</strong> <strong>31</strong>, 2011)Fiscal <strong>year</strong> <strong>ended</strong><strong>March</strong> <strong>31</strong>,2012(From April 1 2011to <strong>March</strong> <strong>31</strong>, 2012)Advertising expenses 65,824 million yen 74,388 million yenProvision for doubtful debts 65 million yen 34 million yenProvision for product warranties 4,833 million yen 2,966 million yenSalary and allowances 30,597 million yen 30,478 million yenRetirement benefit expenses 3,446 million yen 3,519 million yenO<strong>the</strong>r personnel expenses 15,923 million yen 16,583 million yenResearch and development 60,767 million yen 68,701 million yen2. Insurance income<strong>Nikon</strong> (Thailand) Co., Ltd., which incurred by flood damage in Thailand in October 2011, posted <strong>the</strong> settledamount <strong>of</strong> insurance income in connection with part <strong>of</strong> <strong>the</strong> losses <strong>of</strong> noncurrent assets and inventories affected by<strong>the</strong> disaster.3. Impairment lossThe <strong>Nikon</strong> Group classifies by business segment <strong>the</strong> smallest units that create generally independent cash flowsas well as important idle assets.For <strong>the</strong> industrial instruments sector <strong>of</strong> our Instruments Business, <strong>the</strong> Group drafted a business plan that factorsin lower total cash flow estimates for <strong>the</strong> initial period forecasted <strong>the</strong>rein due to measures such as a narrowing <strong>of</strong>our product line following greater business selection and concentration efforts, as well as a revision <strong>of</strong> marketgrowth rates, in response to changes in market conditions and business climate during <strong>the</strong> fiscal <strong>year</strong> underreview. Consequently, goodwill relating to this business saw a decrease <strong>of</strong> book values to recoverable amountsresulting in <strong>the</strong> posting <strong>of</strong> a 6,497 million yen impairment loss.Please note that recoverable amounts were measured based on value in use and future cash flows werediscounted by 6.6%.4. Loss on DisasterThe loss incurred in connection with <strong>the</strong> flood in Thailand, which took place in October, 2011, was posted asextraordinary loss.The extraordinary loss mainly includes disposal and imparement loss <strong>of</strong> fixed assets <strong>of</strong> 6,790 million yen,disposal and write-down <strong>of</strong> inventory <strong>of</strong> 2,117 million yen, and restoration cost and o<strong>the</strong>rs <strong>of</strong> 1,578 million yen.― 21 ―
2) Segment Information1. Outline <strong>of</strong> business segments reportedThe business segments <strong>the</strong> Group reports are <strong>the</strong> business units for which <strong>the</strong> Company is able to obtain respectivefinancial information separately in order for <strong>the</strong> Board <strong>of</strong> Directors to conduct periodic investigation to determinedistribution <strong>of</strong> management resources and evaluate <strong>the</strong>ir business results.The Group introduces company-based organization. Each operating division addresses <strong>the</strong> creation <strong>of</strong> consistentresponsibility system and thoroughness <strong>of</strong> decentralized operation. Each Company is composed <strong>of</strong> segments byproducts and services based on operating division. Therefore, <strong>the</strong> Group has three reportable segments: <strong>the</strong> PrecisionEquipment Business, <strong>the</strong> Imaging Products Business and <strong>the</strong> Instruments Business.The precision equipment business provides products and services <strong>of</strong> IC steppers and LCD steppers. The imagingproducts business provides products and services <strong>of</strong> imaging products and its peripheral domain, like digital SLRcameras, compact digital cameras and interchangeable camera lenses. The instruments business provides productsand services <strong>of</strong> microscopes, measuring instruments and inspection equipments.2. Method for calculating <strong>the</strong> sales, income (loss), assets, and o<strong>the</strong>r items for reporting segmentsThe accounting methods for <strong>the</strong> reporting business segments are generally those set forth in “Material Items WhichForm <strong>the</strong> Basis for Preparation <strong>of</strong> <strong>the</strong> <strong>Consolidated</strong> <strong>Financial</strong> Statements.” Figures for income <strong>of</strong> reporting segmentsare on an operating income basis. Inter-segment sales or transfer are based on current market price.3. Information on <strong>the</strong> amounts <strong>of</strong> sales, income (loss), assets, and o<strong>the</strong>r items by reporting segmentsFiscal <strong>year</strong> <strong>ended</strong> <strong>March</strong> <strong>31</strong>, 2011 (From April 1 2010 to <strong>March</strong> <strong>31</strong>, 2011)(Million <strong>of</strong> yen)Business segments reportedConsolidatePrecision ImagingO<strong>the</strong>r 1 Total Adjustment 2 StatementInstruments TotalEquipment Products<strong>of</strong> income 3SalesOutside customers 208,613 596,928 57,451 862,994 24,518 887,512 - 887,512Inter-segment sales or transfer 749 1,065 1,801 3,615 17,706 21,321 (21,321) -Total 209,362 597,993 59,253 866,609 42,225 908,834 (21,321) 887,512Segment income (loss) 2,711 53,558 (5,247) 51,022 3,051 54,073 (20) 54,052Segment assets 215,076 214,735 53,382 483,194 63,202 546,396 283,512 829,909O<strong>the</strong>r itemsDepreciation and amortization 12,524 12,465 2,045 27,035 6,998 34,033 - 34,033Increase in7,596 18,101 1,599 27,298 2,478 29,776 - 29,776tangible/intangible fixed assetsNotes: 1. The “O<strong>the</strong>r Business” category incorporates operations not included in business segments reported,including <strong>the</strong> glass bussiness and <strong>the</strong> customized products business.2. Segment income or loss adjustment includes elimination <strong>of</strong> intersegment transactions <strong>of</strong> minus 20 millionyen. In addition, segment assets adjustment includes corporate assets not allocated to <strong>the</strong> respectivereportable segments <strong>of</strong> 294,026 million yen and elimination <strong>of</strong> intersegment transactions <strong>of</strong> minus 10,513million yen. Principal components <strong>of</strong> corporate assets are surplus funds (cash and deposits) held by <strong>the</strong>Company and its consolidated subsidiaries, long-term investments (investment securities) and deferred taxassets.3. Segment income is adjusted with reported operating income on <strong>the</strong> consolidated financial statements.4. From <strong>the</strong> three months <strong>ended</strong> June 30, 2011, <strong>the</strong> sport optics products business, formerly included in“O<strong>the</strong>r Business,” was transferred to <strong>the</strong> “Imaging Products Business.” Due to this change, <strong>the</strong> segmentinformation for <strong>the</strong> fiscal <strong>year</strong> <strong>ended</strong> <strong>March</strong> <strong>31</strong>, 2011 was prepared according to <strong>the</strong> revised businesssegment. As a result <strong>of</strong> revising <strong>the</strong> business segments, sales to outside customers, intersegment sales ortransfer, segment income, segment assets, depreciation and amotization, increase in tangible/intangiblefixed assets for <strong>the</strong> Imaging Products Business increased by 552 million yen, 14 million yen, 1,226 millionyen, 655 million yen, 266 million yen, and 150 million yen respectively.― 22 ―
SalesFiscal <strong>year</strong> <strong>ended</strong> <strong>March</strong> <strong>31</strong>, 2012 (From April 1 2011 to <strong>March</strong> <strong>31</strong>, 2012)PrecisionEquipmentBusiness segments reportedImagingProductsInstrumentsTotalO<strong>the</strong>r 1(Million <strong>of</strong> yen)<strong>Consolidated</strong>Total Adjustment 2 Statement<strong>of</strong> income 3Outside customers 248,145 587,127 56,000 891,272 27,379 918,651 - 918,651Inter-segment sales or transfer 855 1,350 1,637 3,843 <strong>31</strong>,575 35,419 (35,419) -Total 249,001 588,477 57,637 895,116 58,954 954,071 (35,419) 918,651Segment income (loss) 42,723 53,971 (3,166) 93,529 4,180 97,709 (17,629) 80,080Segment assets 200,632 251,955 49,860 502,448 109,551 612,000 248,229 860,230O<strong>the</strong>r itemsDepreciation and amortization 9,024 12,585 1,476 23,086 6,586 29,673 2,897 32,570Increase in7,341 33,298 1,233 41,873 9,058 50,932 4,982 55,914tangible/intangible fixed assetsNotes: 1. The “O<strong>the</strong>r Business” category incorporates operations not included in business segments reported,including <strong>the</strong> glass business and <strong>the</strong> customized products business.2. Segment income or loss adjustment includes elimination <strong>of</strong> intersegment transactions <strong>of</strong> 664 million yenand corporate expenses <strong>of</strong> minus 18,294 million yen. From <strong>the</strong> three months <strong>ended</strong> June 30, 2011, <strong>the</strong>Group has revised its method <strong>of</strong> performance management regarding headquarter division-relatedexpenses; and among such headquarter division-related expenses, research and development expenses anda portion <strong>of</strong> expenses relating to <strong>the</strong> provision <strong>of</strong> services, which had previously been allocated to eachsegment, have been accounted for as corporate expenses. The impact <strong>of</strong> this change on segment incomehas been 6,306 million yen in <strong>the</strong> Precision Equipment Business, 10,103 million yen in <strong>the</strong> ImagingProducts Business, 1,<strong>31</strong>4 million yen in <strong>the</strong> Instruments Business, and 570 million yen in O<strong>the</strong>r Business.The net sales <strong>of</strong> each segment and <strong>the</strong> net sales and operating income under corporate have not beenimpacted by this change.Segment assets adjustment includes coorporate assets not allocated to <strong>the</strong> respective reportable segments<strong>of</strong> 268,272 million yen and elimination <strong>of</strong> intersegment transactions <strong>of</strong> minus 20,043 million yen. Thegroup also revised its method <strong>of</strong> cooperate assets management with <strong>the</strong> revision <strong>of</strong> performancemanagement method regarding headquarter division-related expenses. The impact <strong>of</strong> this change onsegment assets has been minus 13,601 million yen in <strong>the</strong> Precision Equipment Business, minus 16,261million yen in <strong>the</strong> Imaging Products Business, munis 1,073 million yen in <strong>the</strong> Instruments Business, and5,436 million yen in O<strong>the</strong>r Business. Impact <strong>of</strong> this change on depreciation and amortization has beenminus 1,515 million yen, minus 3,321 million yen, minus 186 million yen, and 2,125 million yen in <strong>the</strong>Precision Equipment Business, <strong>the</strong> Imaging Products Business, <strong>the</strong> Instruments Business and O<strong>the</strong>rBusiness, respectively. The impact <strong>of</strong> this change on increase in tangible/intangible fixed assets has beenminus 2,678 million yen in <strong>the</strong> Precision Equipment Business, minus 8,026 million yen in <strong>the</strong> ImagingProducts Business, minus 577 million yen in <strong>the</strong> Instruments Business, and 6,351 million yen in O<strong>the</strong>rBusiness.3. Segment income is adjusted with reported operating income on <strong>the</strong> consolidated financial statements.― 23 ―
[Related Information]Fiscal <strong>year</strong> <strong>ended</strong> <strong>March</strong> <strong>31</strong>, 2011 (From April 1 2010 to <strong>March</strong> <strong>31</strong>, 2011)1. Information by geographical area(1) Net Sales(Million yen)Japan USA Europe China O<strong>the</strong>r Total127,162 237,611 202,854 96,956 222,927 887,512(Note) Sales information is based on <strong>the</strong> geographical location <strong>of</strong> customers, and it is classified by region.(2) Property, plant and equipment(Million yen)Japan North America Europe Asia/Oceania Total91,084 5,053 3,619 19,258 119,016Fiscal <strong>year</strong> <strong>ended</strong> <strong>March</strong> <strong>31</strong>, 2012 (From April 1 2011 to <strong>March</strong> <strong>31</strong>, 2012)1. Information by geographical area(1) Net Sales(Million yen)Japan USA Europe China O<strong>the</strong>r Total130,517 221,768 225,739 126,302 214,325 918,651(Note) Sales information is based on <strong>the</strong> geographical location <strong>of</strong> customers, and it is classified by region.(2) Property, plant and equipment(Million yen)Japan North America Europe China O<strong>the</strong>r Total95,509 5,160 3,334 13,929 13,009 130,943― 24 ―
[Information for amortization <strong>of</strong> goodwill and balance <strong>of</strong> goodwill by business segments reported]Fiscal <strong>year</strong> <strong>ended</strong> <strong>March</strong> <strong>31</strong>, 2011 (From April 1 2010 to <strong>March</strong> <strong>31</strong>, 2011)(Million yen)Amortization <strong>of</strong> goodwill for<strong>the</strong> current fiscal <strong>year</strong>Balance <strong>of</strong> goodwill at fiscal<strong>year</strong> <strong>ended</strong> <strong>March</strong> <strong>31</strong>, 2011PrecisionEquipmentImagingProductsInstrumentsTotalO<strong>the</strong>rCorporate orEliminationsTotal- - 1,581 1,581 - - 1,581- - 13,235 13,235 - - 13,235Fiscal <strong>year</strong> <strong>ended</strong> <strong>March</strong> <strong>31</strong>, 2012 (From April 1 2011 to <strong>March</strong> <strong>31</strong>, 2012)(Million yen)Amortization <strong>of</strong> goodwill for<strong>the</strong> current fiscal <strong>year</strong>Impairment loss for <strong>the</strong>current fiscal <strong>year</strong>Balance <strong>of</strong> goodwill at fiscal<strong>year</strong> <strong>ended</strong> <strong>March</strong> <strong>31</strong>, 2012PrecisionEquipmentImagingProductsInstrumentsTotalO<strong>the</strong>rCorporate orEliminationsTotal- - 1,581 1,581 - - 1,581- - 6,497 6,497 - - 6,497- - 5,157 5,157 - - 5,1573)Per-Share InformationFiscal Year Ended <strong>March</strong> 2011(From April 1, 2010 to <strong>March</strong> <strong>31</strong>, 2011)Fiscal Year Ended <strong>March</strong> 2012(From April 1, 2011 to <strong>March</strong> <strong>31</strong>, 2012)(Yen)Net assets per share 980.62 Net assets per share 1,091.98Net income per share 68.90 Net income per share 149.57Net income per share(fully diluted) 68.83 Net income per share(fully diluted) 149.41(Note) The basis for calculating net income per share and fully diluted net income par share is shown below.Fiscal Year Ended<strong>March</strong> 2011(From April 1, 2010to <strong>March</strong> <strong>31</strong>, 2011)Fiscal Year Ended<strong>March</strong> 2012(From April 1, 2011to <strong>March</strong> <strong>31</strong>, 2012)Net income per shareNet income (loss) (million yen) 27,<strong>31</strong>2 59,305Amount not belonging to common(Yen)- -stockholders (million yen)Net income (loss) related to common stock(million yen)27,<strong>31</strong>2 59,305Average shared outstanding (1,000 shares) 396,434 396,502Net income per share (fully diluted)Increase in common stock (1,000 shares) 355 439(Subscription rights to shares) (1,000 shares) (355) (439)Latent shares not included in fully dilutednet income per share calculation due to lack<strong>of</strong> dilution effect.2007 stock options(99 new share subscription rights):99,000 shares <strong>of</strong> common stock2007 stock options(99 new share subscription rights):99,000 shares <strong>of</strong> common stock4) Significant subsequent eventsNot applicable― 25 ―
5. Non-<strong>Consolidated</strong> <strong>Financial</strong> Statements(1) Non-<strong>Consolidated</strong> Balance Sheets(Million yen)As <strong>of</strong> <strong>March</strong> <strong>31</strong>, 2011 As <strong>of</strong> <strong>March</strong> <strong>31</strong>, 2012AssetsCurrent assetsCash and deposits 120,006 71,378Notes receivable-trade 12,147 6,249Accounts receivable-trade 73,095 89,904Merchandise and finished goods 41,662 53,204Work in process 97,098 96,084Raw materials and supplies 12,430 13,589Deferred tax assets 34,222 35,628Short-term loans receivable from subsidiaries and affiliates 19,2<strong>31</strong> 29,145Accounts receivable-o<strong>the</strong>r 10,925 18,093O<strong>the</strong>r 1,083 2,240Allowance for doubtful accounts (240) (214)Total current assets 421,662 415,305Noncurrent assetsProperty, plant and equipmentBuildings, net 21,365 19,960Structures, net 941 879Machinery and equipment, net 23,263 22,383Vehicles, net 136 140Tools, furniture and fixtures, net 6,176 5,792Land 9,872 9,872Lease assets, net 4,544 3,885Construction in progress 5,716 13,673Total property, plant and equipment 72,016 76,588Intangible assetsPatent right 6,461 6,680Leasehold right 4 4Right <strong>of</strong> trademark 27 21S<strong>of</strong>tware 16,742 18,162Lease assets 2 0O<strong>the</strong>r 94 89Total intangible assets 23,332 24,958Investments and o<strong>the</strong>r assetsInvestment securities 46,747 44,866Stocks <strong>of</strong> subsidiaries and affiliates 47,468 47,583Investments in capital 2 1Investments in capital <strong>of</strong> subsidiaries and affiliates 13,6<strong>31</strong> 14,918Long-term loans receivable from subsidiariesand affiliates 10,772 11,870Long-term loans receivable from employees 14 10Long-term prepaid expenses 258 645Prepaid pension cost - 8,852Deferred tax assets 17,141 14,307O<strong>the</strong>r 2,721 2,702Allowance for doubtful accounts (9) (9)Total investments and o<strong>the</strong>r assets 138,748 145,751Total noncurrent assets 234,097 247,298Total assets 655,760 662,603― 26 ―
(Million yen)As <strong>of</strong> <strong>March</strong> <strong>31</strong>, 2011 As <strong>of</strong> <strong>March</strong> <strong>31</strong>, 2012LiabilitiesCurrent liabilitiesNotes payable-trade 1,012 917Accounts payable-trade 137,536 118,506Short-term loans payable 13,600 13,600Current portion <strong>of</strong> long-term loans payable 1,760 4,700Lease obligations 1,845 1,733Accounts payable-facilities 8,719 20,803Accrued expenses 25,347 25,261Income taxes payable 530 14,977Advances received 45,472 40,089Deposits received 30,938 29,926Provision for product warranties 3,975 3,619O<strong>the</strong>r 2,503 4,087Total current liabilities 273,240 278,223Noncurrent liabilitiesBonds payable 40,000 40,000Long-term loans payable 24,700 22,900Lease obligations 2,824 2,269Provision for retirement benefits 10,756 -Provision for directors' retirement benefits 606 -Suspense receipt by land expropriation 10,490 10,490Asset retirement obligations 1,399 1,423O<strong>the</strong>r 724 1,301Total noncurrent liabilities 91,500 78,384Total liabilities 364,741 356,608Net assetsShareholders' equityCapital stock 65,475 65,475Capital surplusLegal capital surplus 80,711 80,711Total capital surplus 80,711 80,711Retained earningsLegal retained earnings 5,565 5,565O<strong>the</strong>r retained earningsReserve for special depreciation 28 22Reserve for research and development 2,056 2,056Reserve for reduction entry <strong>of</strong> replaced property 5,1<strong>31</strong> 5,072Reserve for reduction entry - 18General reserve 111,211 111,211Retained earnings brought forward 29,866 46,828Total retained earnings 153,858 170,774Treasury stock (13,173) (12,992)Total shareholders' equity 286,872 303,969Valuation and translation adjustmentsValuation difference on available-for-sale securities 4,446 3,047Deferred gains or losses on hedges (727) (1,626)Total valuation and translation adjustments 3,718 1,421Subscription rights to shares 427 604Total net assets 291,018 305,995Total liabilities and net assets 655,760 662,603― 27 ―
(2) Non-<strong>Consolidated</strong> Statements <strong>of</strong> Income(Million yen)Year <strong>ended</strong> <strong>March</strong> <strong>31</strong>,2011 Year <strong>ended</strong> <strong>March</strong> <strong>31</strong>,2012Net sales 677,661 688,781Cost <strong>of</strong> sales 544,353 527,234Gross pr<strong>of</strong>it 133,307 161,547Selling, general and administrative expenses 117,917 127,835Operating income 15,390 33,712Non-operating incomeInterest income 419 525Dividends income 7,132 8,224Rent income on noncurrent assets 2,938 2,890Royalty income 712 615Foreign exchange gains 2,928 3,942O<strong>the</strong>r 1,522 2,800Total non-operating income 15,653 18,999Non-operating expensesInterest expenses 519 474Interest on bonds 336 538Rent expenses on noncurrent assets 3,011 2,590O<strong>the</strong>r 1,872 532Total non-operating expenses 5,739 4,136Ordinary income 25,303 48,575Extraordinary incomeGain on sales <strong>of</strong> noncurrent assets 26 65Gain on sales <strong>of</strong> investment securities 30 44Total extraordinary income 56 109Extraordinary lossLoss on retirement <strong>of</strong> noncurrent assets 8<strong>31</strong> 182Loss on sales <strong>of</strong> noncurrent assets 5 0Impairment loss 322 4Loss on sales <strong>of</strong> investment securities 82 95Loss on valuation <strong>of</strong> investment securities 4,512 -Loss on adjustment for changes <strong>of</strong> accountingstandard for asset retirement obligations592 -Loss on disaster 1,040 2,787Total extraordinary losses 7,387 3,070Income before income taxes 17,973 45,614Income taxes-current (1,<strong>31</strong>0) 13,815Income taxes-deferred 6,404 2,481Total income taxes 5,094 16,296Net income 12,879 29,<strong>31</strong>8― 28 ―
- 29 -
- 30 -