

Rare Earth Elements: A Review of Production, Processing ...
Rare Earth Elements: A Review of Production, Processing ...
Rare Earth Elements: A Review of Production, Processing ...

Create successful ePaper yourself
Turn your PDF publications into a flip-book with our unique Google optimized e-Paper software.
<strong>Rare</strong> <strong>Earth</strong> <strong>Elements</strong> <strong>Review</strong> Section 2 – Introduction to <strong>Rare</strong> <strong>Earth</strong> <strong>Elements</strong><br />
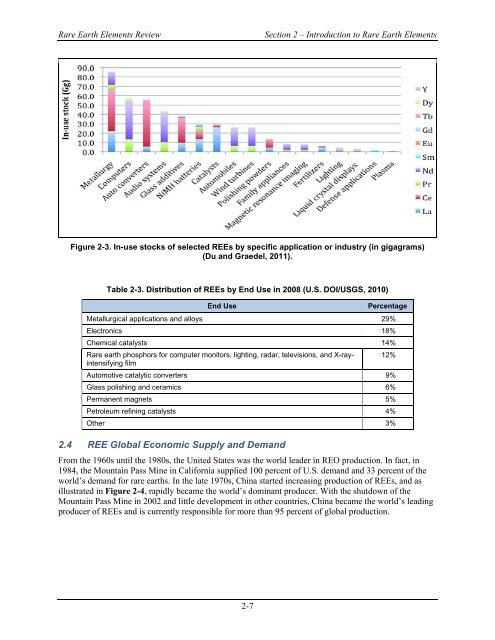
Figure 2-3. In-use stocks <strong>of</strong> selected REEs by specific application or industry (in gigagrams)<br />
(Du and Graedel, 2011).<br />
Table 2-3. Distribution <strong>of</strong> REEs by End Use in 2008 (U.S. DOI/USGS, 2010)<br />
End Use Percentage<br />
Metallurgical applications and alloys 29%<br />
Electronics 18%<br />
Chemical catalysts 14%<br />
<strong>Rare</strong> earth phosphors for computer monitors, lighting, radar, televisions, and X-rayintensifying<br />
film<br />
Automotive catalytic converters 9%<br />
Glass polishing and ceramics 6%<br />
Permanent magnets 5%<br />
Petroleum refining catalysts 4%<br />
Other 3%<br />
2.4 REE Global Economic Supply and Demand<br />
From the 1960s until the 1980s, the United States was the world leader in REO production. In fact, in<br />
1984, the Mountain Pass Mine in California supplied 100 percent <strong>of</strong> U.S. demand and 33 percent <strong>of</strong> the<br />
world’s demand for rare earths. In the late 1970s, China started increasing production <strong>of</strong> REEs, and as<br />
illustrated in Figure 2-4, rapidly became the world’s dominant producer. With the shutdown <strong>of</strong> the<br />
Mountain Pass Mine in 2002 and little development in other countries, China became the world’s leading<br />
producer <strong>of</strong> REEs and is currently responsible for more than 95 percent <strong>of</strong> global production.<br />
2-7<br />
12%


