Mock Report - FPG Child Development Institute
Mock Report - FPG Child Development Institute
Mock Report - FPG Child Development Institute
- No tags were found...

Create successful ePaper yourself
Turn your PDF publications into a flip-book with our unique Google optimized e-Paper software.
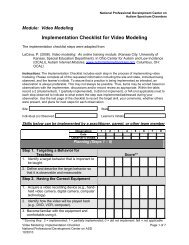
What Do These Numbers Say to You?Hands On Workshop on Data UseMarch 2007Topic 1: Status or Snapshot Data: Using Item Level Data at One Time Point toPlan for Individual <strong>Child</strong>renExample:Tool: “SHELLS”5 items on SHELLSProgram has entered NY, E, or A for each of these items:NY = Not YetE = EmergingA = Achieved<strong>Child</strong>ren in Blue Bell Preschool are assessed with the SHELLS.Table 1: Item Results for 6 <strong>Child</strong>ren1<strong>Child</strong> initiatesan interactionwith an adult2<strong>Child</strong> initiatesan interactionwith anotherchildItems3<strong>Child</strong> comfortsanother child4Plays well withother children5FollowsclassroomrulesNameCarlos A E E A AGeeta NY NY NY NY NYEileen E NY A A AMing E NY E NY AShaniqua E NY E E APaul A A A A ADiscussion questions:1. What are Carlos’ strengths? What are the areas for which he needs support?2. What are Ming’s strengths? What areas for which she needs support?3. What can you say about Geeta?4. What can you say about Paul?5. What actions could follow from this information?The Early <strong>Child</strong>hood Outcomes Center - 3/26/20071
Topic 2: Status or Snapshot Data: Using Data at One Time Point to Plan fora Group of <strong>Child</strong>renUse the information in Table 1.Discussion questions:1. Is there an area where this group is especially strong?2. What analysis did you do to decide this? (i.e., How did you aggregate the data?) Didyou need the children’s names?3. Is there an area where this group is especially weak?4. What analysis did you do to decide this? (i.e., How did you aggregate the data?)5. What actions could follow from this information?Table 1b: Status of <strong>Child</strong>ren at Time 1 on each item(Example of Aggregated Data)Item % Achieved % Emerging % Not Yet1 <strong>Child</strong> initiates an interaction with 72 22 6an adult2 <strong>Child</strong> initiates an interaction with 67 30 3another child3 <strong>Child</strong> comforts another child 55 37 84 Plays well with other children 81 14 55 Follows classroom rules 85 8 7The Early <strong>Child</strong>hood Outcomes Center - 3/26/20072
Topic 3: Status or Snapshot Data: Using Data at One Time Point to Provide theData for OSEP in February 2007States were required in February 2007 to submit entry data for children newly enrolled in 2005-06 (July 1, 2005 to June 30, 2006):% of children who entered early intervention functioning at a level comparable to same agepeers for each outcome:• Positive social-emotional skills (including social relationships)• Acquisition and use of knowledge and skills (including early language/communication [andearly literacy])• Use of appropriate behaviors to meet their needsNote: This is a one time data requirement.Process of Getting from Assessment Items to OSEP Data:1. Items on the assessment were cross walked to the each outcome area by the ECO Center.2. Assessment publishers use various methods to determine what level of performanceconstituted “functioning comparable to same age peers.” ECO Center recommended thatchildren in the bottom 10% be considered as not functioning comparable to same agepeers.3. Publishers produced reports based on these methods.Table 2: Percentages of <strong>Child</strong>ren Functioning and Not Functioning Comparable to SameAge Peers in Each Outcome AreaOutcome 1 Outcome 2 Outcome 3N % N % N %<strong>Child</strong>ren who entered comparable to 26 72 27 75 16 44same aged peers<strong>Child</strong>ren who entered who were not 10 28 9 25 20 56comparable to same aged peersTotals 36 100 36 100 36 100Discussion questions:1. How many children are in the class?2. Which outcome area was the most challenging for this group?3. Are these status data or progress data?4. What else can you say about these numbers?The Early <strong>Child</strong>hood Outcomes Center - 3/26/20073
The Creative Curriculum <strong>Development</strong>al Continuum for Ages 3-5:Crosswalk to <strong>Child</strong> OutcomesOutcome 1:Positive social relationshipsSense of self:1. Shows ability to adjust to new situations3. Recognizes feelings and managesappropriatelyResponsibility for self and others:7. Cares for classroom environment8. Follows classroom routines9. Follows classroom rulesPro-social behavior:10. Plays well with other children11. Recognizes feelings of others12. Shares and respects rights13. Uses thinking skills to resolve conflictsListening and speaking:43. Actively participates in conversationsOutcome 2:Acquires and uses knowledge and skillsFine motor:21. Uses tools for writing and drawingLearning and problem solving:22. Observes objects and events with curiosity23. Approaches problems flexibly24. Shows persistence in approaching tasks25. Explores cause and effect26. Applies knowledge or experience to a newsituationLogical thinking:27. Classifies objects28. Compares/measures29. Arranges objects in a series30. Recognizes patterns and can repeat them31. Shows awareness of time and spaceconcepts and sequence32. Shows awareness of position in space33. Uses one-to-one correspondence34. Uses numbers and countingOutcome 3:Takes appropriate action to meet needsSense of self:2. Demonstrates appropriate trust in adults4. Stands up for rightsResponsibility for self and others:5. Demonstrates self direction and independence6. Takes responsibility for own well-beingGross motor:14. Demonstrates basic locomotor skills*15. Shows balance while moving*16. Climbs up and down*Fine motor:19. Controls small muscles in hands*20. Coordinates eye-hand movement*21. Uses tools for writing and drawingLearning and problem solving:24. Shows persistence in approaching tasksListening and speaking:42. Asks questions* Precursor skills for functional behaviors. These skills may not be appropriate or expected for some children, including those with sensory, motor, or other impairments.Note: Areas that are not precursor to or components of any of the three outcomes, and therefore not included in the crosswalk, were:17. Pedals and steers a tricycle18. Throwing, kicking, and catching skillsThe Early <strong>Child</strong>hood Outcomes Center - 3/26/2007 4
Topic 4. Change over Time: Progress Data for Individual <strong>Child</strong>renTable 3: <strong>Child</strong> Level <strong>Report</strong>s at Time 1 and Time 2 Data for Each Item1<strong>Child</strong> initiates aninteraction with anadult2<strong>Child</strong> initiates aninteraction withanother child3<strong>Child</strong> comfortsanother childName Fall Spring Fall Spring Fall SpringCarlos A A E A E AGeeta NY NY NY NY NY EEileen E A NY E A AMing E E NY E E AShaniqua E A NY A E APaul A A A A A ADiscussion questions:1. What can you say about Ming’s progress between spring and fall?2. What can you say about Carlos’s progress?3. What can you say about Geeta’s progress?4. What can you say about Paul’s progress?Table 4 : Percent of Objectives Accomplished at Time 1 and Time 2 by Domain(Example of <strong>Report</strong> Aggregated by Domains)Social Emotional Thinking andClass<strong>Development</strong> Reasoning MotorTime 1 Time 2 Time 1 Time 2 Time 1 Time 2Carlos 45 70 35 51 32 40Geeta 3 6 0 5 38 65Eileen 47 75 58 67 64 78Ming 25 35 41 45 64 75Shaniqua 45 64 58 76 49 65Paul 85 100 92 100 64 75Discussion questions:1. What can you say about Ming’s progress between spring and fall?2. What can you say about Carlos’s progress?3. What can you say about Geeta’s progress?4. What can you say about Paul’s progress?5. What can you say about the 3 OSEP outcome areas?The Early <strong>Child</strong>hood Outcomes Center - 3/26/20075
Topic 5. Change over Time: Aggregated Progress Data for Time 1 and Time 2Table 5: Percentage of <strong>Child</strong>ren Mastering 70% or More Objectives by Class(Example of an Aggregated <strong>Report</strong> for Program)Social Emotional<strong>Development</strong>Thinking andReasoningMotorClassroom Time 1 Time 2 Time 1 Time 2 Time 1 Time 21 65 70 50 51 49 522 55 53 62 61 87 883 47 70 51 75 65 704 76 84 78 85 78 835 97 98 95 97 95 100Discussion question:As the Program Director, what are your thoughts about these 5 classrooms?Notes:• There are many different ways to report aggregated progress data at the classroom orprogram level, e.g., % who gained at least 5 new objectives, % who moved at least onelevel, average number of objectives achieved at each time point, average number ofobjectives gained between time 1 and time 2, etc.• The data above are shown by classroom but the same data can be shown by many otherinteresting and useful variables, e.g., number of hours of services (half day vs. full day);location of service (home vs. center based); number of years in program (1, 2, 3, etc.),age of child (3s vs. 4s), IEP vs. no IEP, English language learners vs. English speakers,etc.The Early <strong>Child</strong>hood Outcomes Center - 3/26/20076
Topic 6. Change over Time: Understanding and Using the OSEP <strong>Report</strong>ingCategoriesStates must report on the progress of all children between entry and exit who receivedat least 6 months of service. For each outcome, states report the percentage ofchildren who:a. Did not improve functioningb. Improved functioning, but not sufficient to move nearer to functioningcomparable to same-aged peersc. Improved functioning to a level nearer to same-aged peers but did notreach itd. Improved functioning to reach a level comparable to same-aged peerse. Maintained functioning at a level comparable to same-aged peersNote: Trajectories above the dotted line are age expected development.Key Concepts:1. <strong>Child</strong>ren acquire new skills and behaviors at different rates (<strong>Development</strong>al trajectories).2. If children acquire skills at a rate slower than their same age peers, they will fall behind.The gap will widen with each successive year.3. The best predictor of where a child will be without intervention is his or her currenttrajectory. A child in trajectory 3 at 36 months is likely to be in trajectory 3 (or lower) at48 months.4. Quality programs try to keep young children on track or if children are already behind,they try to help them catch up (“close the gap”).5. OSEP categories capture information about changes in trajectories.The Early <strong>Child</strong>hood Outcomes Center - 3/26/20077
Table 6: Percentage of <strong>Child</strong>ren in Different Progress CategoriesCategoryMaintained ageappropriatefunctioningAchieved ageappropriatefunctioningMoved closer toage-appropriatefunctioning2007N=13452008N=14092009N=148018 17 1527 29 2945 46 50Made progress 8 6 5Did not makeprogress2 2 1Table 7: Percentage of <strong>Child</strong>ren Who Maintained or Moved Closer to Typical<strong>Development</strong>, 2007-20092007N=13452008N=14092009N=148090 92 94Discussion questions:1. What do you make of the year-to-year trends?2. What do these data mean? How do you interpret them?The Early <strong>Child</strong>hood Outcomes Center - 3/26/20078
Summary and Take Away Messages• There are many ways to display data on a group. The data need to be presented in away that is useful to the user. You will be constrained by what reports can generated fora given assessment.• Teachers and providers who work with groups of children will want to look at:o How each individual child is doing on each “item” (status).o How the group is doing on each item (status).o How the child changed between Time 1 and Time 2 (3, 4, etc.) (progress).o How the group changed on each item (progress).o In which areas did the group make the most progress?o In which did they make the least?o Which children made the most progress in each item/ outcome area/domain?o Which children made the least progress in each item/ outcome area/domain (andhow can they be helped to make more progress the next time?)• Program directors or administrators who have responsibility for groups of teachers orproviders will want to:o Work with teachers and providers to make sure they know how to interpret anduse their data.o Scan data at the individual child level:• Ensure teachers and providers are using the assessment appropriately(ongoing monitoring of data quality).• Look for anomalies that suggest data problems or merit furtherinvestigation.• Look for outliers, i.e., children who are scoring very low or very high;show an unusual pattern.o Review data aggregated to the group level• Are teachers/providers working with comparable groups of children? (ifnot, is that a problem?)• Do the groups show comparable levels of progress overall? (if not, whynot? Is that a problem?)• Do the groups show comparable levels of progress in each outcomearea/domain? If not, why not? Are some teachers/providers especiallyskilled in helping children in some areas? What are they doing? Arethere weak areas? How can they be improved?• Are stakeholders satisfied with the extent of progress and the level ofperformance that children are showing? In all areas?For more information about the Early <strong>Child</strong>hoodOutcomes (ECO) Center,Visit: www.the-eco-center.org.The Early <strong>Child</strong>hood Outcomes Center - 3/26/20079