Fast Choices - NSW Food Authority - NSW Government
Fast Choices - NSW Food Authority - NSW Government
Fast Choices - NSW Food Authority - NSW Government
- No tags were found...

You also want an ePaper? Increase the reach of your titles
YUMPU automatically turns print PDFs into web optimized ePapers that Google loves.
FAST CHOICES:An evaluation of energypurchased and consumerinformationReport: Findings from Waves1, 2 & 3Prepared For:<strong>NSW</strong> <strong>Food</strong> <strong>Authority</strong> &<strong>NSW</strong> HealthTNS Consultants:Laurette DouglasSandra EichhornDate: January 2013TNS Reference:233100270 & 263100513
TABLE OF CONTENTSPage1. EXECUTIVE SUMMARY ........................................................ 11.1 Background and approach .................................................... 11.2 Key findings ......................................................................... 31.3 Conclusions .......................................................................... 62. BACKGROUND AND APPROACH........................................... 72.1 Research purpose and objectives ......................................... 72.2 Methodology ....................................................................... 102.2.1 Qualitative developmental research ......................................... 112.2.2 Intercept surveys at standard food outlets (Waves 1-3) ............ 112.2.3 General Population Online Surveys (Waves 1-3) ........................ 132.2.4 18 to 24 year old Online Surveys (Waves 1-3) .......................... 142.3 Interpreting this report ...................................................... 163. MAIN FINDINGS ............................................................... 173.1 Current consumption patterns ............................................ 173.1.1 Frequency and means of purchase........................................... 173.1.2 Reasons for purchase............................................................. 183.1.3 Variation in items purchased ................................................... 193.2 Understanding of kJ and other indicators ........................... 203.2.1 Unprompted understanding of kilojoules .................................. 203.2.2 Prompted understanding of kilojoules ...................................... 213.2.3 Reported confidence in knowledge of nutritional information ....... 223.2.4 Actual knowledge of kilojoules / energy ................................... 233.2.5 Understanding of „average daily intake‟ .................................... 243.2.6 Awareness of daily energy (kJ) intake levels ............................. 253.2.7 Awareness of daily intake levels of fat and sodium .................... 273.2.8 Average and median kJs purchased at outlet – Intercept only ..... 293.2.9 Estimating the kilojoule content of items purchased –Intercept only ....................................................................... 303.3 Salience and use of nutritional information in outlets ........ 313.3.1 Frequency of menu use .......................................................... 313.3.2 Menu information use ............................................................ 323.3.3 Nutritional considerations when purchasing fast food anddrinks .................................................................................. 333.4 Role of information on behaviour & perceived impact of<strong>Fast</strong> <strong>Choices</strong> legislation ...................................................... 34The Intercept Surveys ..................................................................... 343.4.1 Awareness of nutritional information at outlet ........................... 341
3.4.2 Location of nutritional information in outlets ............................. 353.4.3 Prompted recall of specific nutritional information at outlet ......... 363.4.4 Reported influence of nutritional information on site .................. 37The Online Surveys ......................................................................... 383.4.5 Awareness of nutritional information at outlet ........................... 383.4.6 Location of nutritional information observed ............................. 403.4.7 Prompted recall of specific nutritional information observed ........ 413.4.8 Reported influence of nutritional information on choice .............. 433.4.9 Anticipated impact of menu labelling changes ........................... 443.4.10 Reactions to the kilojoule labelling – likes & dislikes .................. 463.5 The Communications Campaign ........................................... 483.5.1 Primary purchase locations ..................................................... 483.5.2 Spontaneous Awareness – Perceived location of advertising ....... 493.5.3 Spontaneous Awareness – Recalled content of advertising .......... 503.5.4 Prompted Awareness – Seen / heard elements of thecampaign ............................................................................. 513.5.5 Prompted campaign message takeout ...................................... 523.5.6 Prompted impressions of the campaign .................................... 533.5.7 Reported impact of the campaign ............................................ 54APPENDIX - METHODOLOGY ................................................... 55A1. Developmental qualitative phase ....................................... 55A1.1 Sampling and recruitment ...................................................... 55A1.2 Fieldwork ............................................................................. 56A2. Quantitative intercept survey ............................................. 57A2.1 Sampling approach ................................................................ 57A2.2 Survey design and fieldwork ................................................... 59A2.3 Data processing and analysis .................................................. 60A3. Quantitative online survey: general population .................. 61A3.1 Sampling approach ................................................................ 61A3.2 Survey design and fieldwork ................................................... 61A3.3 Data processing and analysis .................................................. 62A4. Quantitative online survey: 18-24 year olds ....................... 63A4.1 Sampling approach ................................................................ 63A4.2 Survey design and fieldwork ................................................... 63A4.3 Data processing and analysis .................................................. 642
1. EXECUTIVE SUMMARY<strong>Fast</strong> <strong>Choices</strong>1.1 Background and approachOn 1 February 2011, the <strong>NSW</strong> <strong>Government</strong> introduced legislation that requires standardfood outlets to display nutritional information on menus at point of sale by 1 February2012. Review of this legislation was also mandated. To inform the review, the <strong>NSW</strong> <strong>Food</strong><strong>Authority</strong> and <strong>NSW</strong> Health developed an evaluation framework, which identified desirableoutcomes of the legislation. This project aims to measure and assess two keyoutcomes for the evaluation;whether consumers have awareness and increased understanding of energy(particularly kJ values displayed in qualifying outlets), andwhether consumers purchase fewer kJs from qualifying outlets and/or makedifferent food choices with other meals.In late 2011, the <strong>NSW</strong> <strong>Food</strong> <strong>Authority</strong> received funding to support the implementation ofthe <strong>Fast</strong> <strong>Choices</strong> legislation through an expanded communications campaign targetingthe primary audience (18-24 year olds). Additional research was subsequently requiredto measure the impact of the consumer campaign, and specifically amongst thisaudience. This project aims to provide a measure for another key outcome for theevaluation;whether the consumer education program supports the regulation.TNS Social Research (TNS) was commissioned to conduct research as part of theevaluation of the <strong>Fast</strong> <strong>Choices</strong> initiative, and focusing on evaluating the above. Thefollowing program of research was designed and subsequently undertaken:• In July 2011 research commenced with a small scale developmental qualitativephase, to inform quantitative questionnaire design.• In September 2011, prior to the appearance of menu labels in stores, the first twoquantitative baseline surveys were conducted to facilitate measuring impact ofthe initiative. This comprised:ooAn online general population survey of approximately 500 <strong>NSW</strong> residents whohad consumed food from at least one of the standard food outlets in the pastmonth (providing a series of baseline measures in terms of awareness andunderstanding of nutritional labelling and average daily intake levels), andA face-to-face intercept survey with over 800 participants at 14 selectedstandard food outlets in <strong>NSW</strong>, with surveys being administered after purchaseand / or consumption (focusing in particular on consumption and awareness ofmenu labelling at the site, informing kJ consumption levels).1
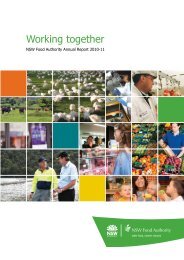
Legislation in forceCampaign launchSchool holidaysCampaign revisions<strong>Fast</strong> <strong>Choices</strong>• In February 2012, when menu labels were introduced in stores but immediatelyprior to the launch of the consumer campaign in March 2012, a baseline measurewas established for the primary target audience. This comprised an online surveyamongst 18-24 year old Greater Sydney residents (n=200).• In April 2012, this was followed with a tracking stage of all three surveys i.e.the General Population Online Survey, the face to face Intercept Survey and the18-24 year old Online Survey. This was in order to test any shift in awareness,understanding and/or behaviours since implementation of legislation and launchof the consumer campaign.• In August 2012 the final wave of tracking was implemented for the face to faceIntercept Survey, and in October 2012 the same was implemented for the GeneralPopulation Online Survey as well as the 18-24 year old Online Survey. This was toestablish whether any further shifts in awareness, understanding and/orbehaviours had occurred, as legislation had by then been in place for a fewmonths.A summary of the methodology, sample and timing of all surveys is outlined below:Figure 1.1: Research program timelineSepOctNovDecJanFebMarAprMayJunJulAugSepOct111111111212212121212121212CAMPAIGNEVALUATION18 TO 24 YEAR OLDONLINE SURVEYn=200, GreaterSydneyW1W2W3FAST CHOICESGENERAL POPULATIONONLINE SURVEYn=500, <strong>NSW</strong>W1W2W3FAST CHOICESINTERCEPT SURVEYn=800, <strong>NSW</strong>W1W2W3ESTABLISHMENT OFBASELINE MEASURESTRACKING OFMEASURES2
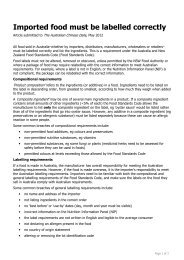
1.2 Key findings<strong>Fast</strong> <strong>Choices</strong>Below we summarise the key take-outs observed across Waves 1, 2 and 3 of the varioussurveys.Sample General Population Online SurveyKEY FINDING Wave 1 Wave 2 Wave 3% % %Frequency of purchase (% purchase fastfood at least once a week)61 56 59Awareness of daily intake value (%indicated 8700 kJs)3 5 9Notice of kJ info on menu (% whonoticed kJ on menu)46 49 52Prompted recall of kJ info (% whorecalled kJs)54 79 75Approval of initiative (% who saidcampaign is „very‟ necessary)n/a 38 49Sample 18 to 24 year old Online SurveyKEY FINDING Wave 1 Wave 2 Wave 3% % %Frequency of purchase (% purchase fastfood at least once a week)81 74 76Awareness of daily intake value (%indicated 8700 kJs)8 16 19Notice of kJ info on menu (% whonoticed kJ on menu)59 65 63Prompted recall of kJ info (% whorecalled kJs)77 76 74Approval of initiative (% who saidcampaign is „very‟ necessary)n/a 46 53SampleIntercept SurveyKEY FINDING Wave 1 Wave 2 Wave 3% % %Awareness of daily intake value (%indicated 8700 kJs)1 9 8Kjs purchased at outlet (Median) 3355 3192 2836Notice of kJ info on menu (% whonoticed kJ on menu)15 40 36Prompted recall of kJ info (% whorecalled kJs)28 80 813
<strong>Fast</strong> <strong>Choices</strong>Consumption patterns and habitsConsumption in fast food outlets is a regular activity for many <strong>NSW</strong> residents, with themajority of General Population Online Participants indicating that they consume suchproducts once a week or more. Younger participants (i.e. 18 to 24 year old OnlineParticipants) have a particularly high purchase rate, with over three-quarters visitingsuch outlets more than once a week. There were no significant changes across waves.When making their decisions, consumers mostly refer to menus for prices andinformation on special offers. However, since its introduction, the kilojoule labelling isbeing increasingly used to inform their choices. Among the General Population OnlineParticipants 15% used it in making their decisions in Wave 2 (carried out two monthsafter the introduction of the legislation) while this figure significantly rose, to 24% inWave 3, six months later. 18 to 24 year old Online Participants are consistently utilisingkilojoule labelling when making their decisions, with just under a quarter stating soduring all three waves of the survey (all of which occurred post legislation).Salience of nutrient labelling in outletsConsumers are more likely to notice nutritional information in fast food outlets since theintroduction of the legislation.The proportion noticing any such information in the intercept survey jumped significantlyfrom 15% in Wave 1, to 36% in Wave 3. The General Population Online Survey and 18to 24 year old Online Survey also showed a rise in consumers noticing nutritionalinformation on menu boards, posters and information boards, and on take-away menussince the introduction of the legislation (i.e. up from 46% in Wave 1 to 53% in Wave 3for the General Population Online Participants and up from 50% in Wave 1 to 63% inWave 3 for 18 to 24 year old Online Participants).Kilojoules have become the most salient nutrient information in fast food outlets; in theGeneral Population Online Survey 75% of consumers noticed kilojoule information inWave 3 compared with only 54% in Wave 1 – and representing a significant increase (incontrast, the relative salience of all other nutrient information has significantly reducedsince the introduction of the legislation). Salience of kilojoules amongst 18 to 24 year oldOnline Participants has remained consistent, with around three-quarters mentioning itacross all three Waves of the study.Overall kilojoule consumptionThere was a significant decrease in the median kilojoule content of items purchasedbetween Waves 1 and 3 of the Intercept survey. The median kilojoule purchase in Wave1 – carried out in September 2011, prior to the introduction of the <strong>Fast</strong> <strong>Choices</strong>legislation – was 3355kJs. In Wave 3 – carried out in August 2012, post <strong>Fast</strong> <strong>Choices</strong>legislation – the median kilojoule purchase significantly decreased to 2836kJs.4
<strong>Fast</strong> <strong>Choices</strong>Estimating kilojoule content of items purchasedOverall, consumers found it difficult to estimate the kilojoule content of the items theyhad purchased. The majority of consumers were unable to make an estimate, but thisproportion declined significantly and favourably during subsequent waves (i.e. downfrom 76% at Wave 1, to 66% at Waves 2 and 3).Of those who made an estimate, the majority underestimated their kilojoule purchasesby more than 10%. However, there were signs of improvements in consumers‟estimates: while only 7% of the estimates in Wave 1 were within 10% of the actualkilojoule content of their purchase, this significantly increased to 13% in Wave 2 and to14% in Wave 3.Understanding of kilojoulesJust under half of the General Population Online Participants stated correctly thatkilojoules refer to „energy‟, with no significant changes observed across the three waves(W1, 48%; W2, 48%; W3, 47%). Of the remainder, around one in five did not to know;while around two in five offered erroneous responses or equated kilojoules with calories.Conversely, the majority of 18 to 24 year old Online Participants understood broadly thatkilojoules refer to „energy‟, with levels improving over time (W1, 69%; W2, 62%; W3,71%) and around one in six did not know. So whilst consumer‟s awareness of kilojouleshas increased significantly since the introduction of the legislation it appears that theirunderstanding thereof has not.Understanding and awareness of ‘average daily food intake’There was better understanding of the term „average daily intake‟ with over half ofparticipants – across both online surveys and all 3 waves – reporting it to be the„average daily food intake‟. There were also some positive indications of more detailedunderstanding of the term, with a significant rise of those referring to it as the „healthyamount needed for the body‟ in the general population (W1, 3%; W2, 12%; W3, 7%).There was progressive and significant improvement in awareness that 8700kJs is theaverage daily adult intake; the proportion estimating it to be between 8000-8999kJssignificantly increased in all surveys, with precise estimates of 8700kJs significantlyrising (i.e. from 3% in Wave 1 of the General Population Online Survey, to 9% in Wave3; and from 8% in Wave 1 of the 18 to 24 year old Online Survey, to 19% in Wave 3,and from only 1% in Wave 1 of the intercept survey to 8% in Wave 3).Support for menu labelling and perceived impactWhen informed of the <strong>Fast</strong> <strong>Choices</strong> legislation, participants‟ verbatim commentsindicated a general acceptance of the initiative; with the vast majority (over 75% acrossall surveys and waves) not expressing any objections.5
2. BACKGROUND AND APPROACH<strong>Fast</strong> <strong>Choices</strong>On 1 February 2011, the <strong>NSW</strong> <strong>Government</strong> introduced legislation that required standardfood outlets to display nutritional information on menus at point of sale. The new lawscame into effect from 1 February 2011, allowing business twelve months to complybefore penalties come into force. The initiative is part of the <strong>NSW</strong> <strong>Government</strong>‟s broadset of responses to assist in reducing the rates of overweight and obesity in thecommunity. The laws mandate the display of average energy content for standard menuitems of unpackaged ready-to-eat food sold at qualifying food outlets, as labelled onmenus in-store, on drive-thru menus, on internet ordering websites, and distributed bymail. The laws affect those outlets selling standard food items with twenty or morelocations in <strong>NSW</strong> and 50 or more locations nationally.2.1 Research purpose and objectivesThe legislation mandated for a review of the new laws which is to be partly informed bythe <strong>Fast</strong> <strong>Choices</strong> (menu labelling) evaluation. The evaluation, administered through the<strong>NSW</strong> <strong>Food</strong> <strong>Authority</strong>, serves to provide evidence on consumer awareness, understandingand use, and the effect menu labelling has on nutrients purchased. In all, sevenoutcomes have been identified for evaluation purposes, as detailed in the table below:Intermediate outcomes of specific relevance to the regulatory intervention:1. Businesses understand the regulatory requirement2. Businesses comply with the regulation3. Regulatory agencies manage and enforce the regulation4. <strong>NSW</strong> <strong>Food</strong> <strong>Authority</strong> implements a consumer education program5. Consumers have information to make healthier choices at fast food and snack foodchains6. Consumers have awareness and increased understanding of energy (particularly kJvalues displayed in qualifying outlets), and7. Consumers purchase fewer kJs from qualifying outlets and/or make different foodchoices with other meals.In order to assess these outcomes, a series of activities were being implemented, someof which are ongoing including on-site inspections, laboratory analysis, and qualitativeand quantitative data collection and analysis. This includes the commissioning of TNSSocial Research (TNS) to undertake quantitative benchmarking and tracking viaconsumer surveys, with measures specifically focused on intermediate evaluationoutcomes 6 and 7:7
<strong>Fast</strong> <strong>Choices</strong>Intermediate outcome 6: Consumers have awareness and increased understanding ofenergy (particularly kJ values displayed in qualifying outlets). Assessment of thisoutcome is to determine:whether the legislative requirements and supporting activities have increasedconsumer awareness and understanding of energy in respect to food, andwhether consumers noticed and report taking account of the kJ information displayedat outlets.The assessment of this outcome will be complete through the collection of the followingtypes of data before and after implementation:customer understanding of energy and kilojoules in food,customer understanding of energy and kilojoules for the type of menu items that willbe required to display the nutrition information,customer attitudes, beliefs and diet motivations regarding energy and kilojoules, fatsand salts,whether customers sought out or required other material for further information.And, after implementation of new menus, additional data to be collected will include:whether customers noticed the kilojoules labelling for menu items purchased prior topurchaseto what extent customers understood what the value meantto what extent the labelling of standard menu items influenced their choice of menuitemto what extent have customer attitudes, beliefs and diet motivations regardingenergy and kilojoules, fats and salts changed since the introduction of food labellingto what extent the information influenced their eating patterns for the rest of the dayto what extent the information would influence future purchases at the outletIntermediate outcome 7: Consumers purchase fewer kJs from qualifying outletsand/or make different food choices with other meals.This information will be used to calculate the average number of kilojoules, grams of fat,saturated fat, sugar and salt per customer transaction before and after implementationof the new menus.8
<strong>Fast</strong> <strong>Choices</strong>Communications campaignIn late 2011, the <strong>NSW</strong> <strong>Food</strong> <strong>Authority</strong> secured further funding to support theimplementation of the <strong>Fast</strong> <strong>Choices</strong> legislation through an expanded communicationscampaign involving digital resources, community engagement activity and paid media.<strong>Fast</strong> <strong>Choices</strong> campaign seeks to inform <strong>NSW</strong> consumers about the new legislated foodlabelling requirement to display kJ information on quick service restaurant menus,enabling them to understand this information and put it into context for themselves andtheir families, empowering healthy, balanced and informed food choices.The campaign was targeted at the heaviest consumers of fast and snack foods, namely18-24 year olds with a slight male skew. This audience accounts for around 68% of the883,000 <strong>NSW</strong> consumers who eat fast and snack foods frequently (i.e. 10 times permonth or more). Campaign placement was concentrated in Sydney metropolitan areaswith selected regional activity.During the launch phase, March-April 2012, a mix of advertising, digital resources andengagement activities was used. Similar activities (excluding radio advertising) wererepeated in September 2012.Advertising was placed in food court illuminated displays „Shopalites‟ and tabletops,selected radio outlets reaching the primary target audience and selected non-Englishspeaking stations, search marketing, Facebook and mobile phone advertising. Otherbursts of campaign activity included community engagement events in June andSeptember 2012, and a fresh round of paid advertising in September-October 2012.Social media activity has been maintained since the launch of the communicationscampaignResources included a website (8700.com.au) containing information on kJ, a smartphoneapp, a Facebook page, and a searchable, interpretive fast food database. Communityengagement activity generated 260 articles and 34 million impressions between Marchand June and 31 media articles and 22 million impressions during September-October2012. The objectives of the campaign have been follows:Consumer campaign objectives:To build awareness that menu displays show energy in terms of kilojoulesTo build awareness of the average adult daily intake of 8,700 kilojoulesTo build awareness of individual kilojoule requirements to maintain a balance ofenergy and activity, maintain a healthy weight, and how the requirements can varydepending on age, activity and other factorsTo provide a path for deeper engagement with campaign messages through accessto more information using website, mobile site, mobile app, Facebook page and app.This will include information about how many kilojoules consumers require each dayand to support balanced choices9
Legislation in forceCampaign launchSchool holidaysCampaign revisions2.2 Methodology<strong>Fast</strong> <strong>Choices</strong>TNS, in collaboration with the <strong>NSW</strong> <strong>Food</strong> <strong>Authority</strong>, developed a multi-methodapproach. The research commenced with a small-scale developmental qualitativecomponent to shape quantitative measurement. The first round of quantitative researchconducted by TNS was instigated prior to the new menu labelling legislation becomingmandatory, thereby providing benchmark data from which to measure the impact andoutcomes of the new laws. This was followed by two tracking stages to gauge any shiftsin awareness, attitudes and behaviours, both immediately post implementation andagain a few months after implementation.In addition, a targeted pre- and post measure was introduced to gauge reaction to theconsumer campaign (as outlined earlier). Although the target audience for the campaignencompasses all <strong>NSW</strong> consumers who purchase food from applicable outlets, the primaryaudience has been identified as those aged 18-24 years, and an additional componentwas introduced to assess the effectiveness of the campaign on young people specifically(whilst gaining impressions only from the broader <strong>NSW</strong> population).In summary, the benchmark and tracker surveys comprised (and are referred to as):a) face-to-face intercepts at standard food outlets located in <strong>NSW</strong> (InterceptSurvey),b) general population online surveys from <strong>NSW</strong> (General Population OnlineSurvey), andc) online surveys amongst the primary target audience of the consumer campaign,namely 18-24 year olds from the Greater Sydney region (18 to 24 year oldOnline Survey).Figure 1.1: Research program timelineSepOctNovDecJanFebMarAprMayJunJulAugSepOct111111111212212121212121212CAMPAIGNEVALUATION18 TO 24 YEAR OLDONLINE SURVEYn=200, GreaterSydneyW1W2W3FAST CHOICESGENERAL POPULATIONONLINE SURVEYn=500, <strong>NSW</strong>W1W2W3FAST CHOICESINTERCEPT SURVEYn=800, <strong>NSW</strong>W1W2W3ESTABLISHMENT OFBASELINE MEASURESTRACKING OFMEASURES10
The following section summarises the approach adopted for each of the surveys.<strong>Fast</strong> <strong>Choices</strong>Figure 1.2: Overview of approachIntercept Survey<strong>Fast</strong> food purchasersGeneral populationOnline Survey 16+ years(purchased items inoutlets in last month)18 to 24 year old OnlineSurvey(purchased items inoutlets in last month)Wave 17 min f-t-f survey with n=815 ,conducted at 14 outlets15 min survey with n=506 <strong>NSW</strong>residents18 min survey with n=217Greater Sydney residentsWave 27 min f-t-f survey with n=80722 minute survey with n=528<strong>NSW</strong> residents22 min survey with n=213 GreaterSydney residentsWave 37 min f-t-f survey with n=80522 min survey with n=531<strong>NSW</strong> residents22 min survey with n-206 GreaterSydney residentsSamplingandweightingStratified sampling approach tooutlet selection, (x 14)encompassing a range of outlettypes, locales and SEScustomer basePost weighting to ensurerepresentativeness of <strong>NSW</strong>residents (Gender, age andlocation)Post weighting to ensurerepresentativeness of targetaudience (Gender)2.2.1 Qualitative developmental researchA small phase of qualitative research was conducted, principally to informdevelopment of quantitative survey tools. This exercise consisted of twelve faceto-facein depth interviews facilitated by TNS researchers. Interviews were conductedwith a range of <strong>NSW</strong> residents who had eaten food sourced from a fast or snack foodoutlet at least twice in the previous month. Engagement of participants was guided by arecruitment structure, ensuring a mix of people were consulted, on the basis ofsocioeconomic status, age, gender, location, body mass index, living arrangements, andcultural background.Interviews lasted approximately one hour each. To assist in the conduct of interviews, aninterview guide was developed by TNS in collaboration with the <strong>NSW</strong> <strong>Food</strong> <strong>Authority</strong>.This included question areas and prompts to explore consumer understanding ofnutritional content, including energy and kilojoules, attitudes and beliefs towardsconsumption and nutritional content, attitudes towards fast food and drink consumption,and decision-making factors underpinning consumption.2.2.2 Intercept surveys at standard food outlets (Waves 1-3)Three Waves of face-to-face intercept surveys were conducted with customers at 14outlets in <strong>NSW</strong>. The surveys lasted an average of seven minutes. A total of n=815participants completed the survey during Wave 1 (7 September to 9 October 2011).n=807 participants completed it during Wave 2 (20 April to 18 May 2012) and n=80511
<strong>Fast</strong> <strong>Choices</strong>participants completed it during Wave 3 (27 August to 23 September 2012 i.e. immediatelyprior to <strong>NSW</strong> School holidays).The demographic profile of participants completing the survey is set out in Table 1below. No post-survey weighting was applied to the intercept survey data due to thepurposive sampling approach in place.Table 1: Profile of Intercept Survey participantsFace-to-face interceptsurveysWave 1Unweighted%Wave 2Unweighted%Wave 3Unweighted%<strong>NSW</strong>Population*%LocationGender<strong>NSW</strong> Metro 71 72 71 63<strong>NSW</strong>Regional23 25 24 37Male 53 53 54 50Female 47 47 46 50Age16-25 yearsold26-45 yearsold34 30 30 1741 44 43 3646 years oldand above25 25 27 47*ABS 2006 Census Data (Wave 1, 2 & 3 were all unweighted)As well as examining consumer awareness and understanding, the intercept surveysplaced particular focus on consumption, providing the means to feed into the assessmentof intermediate outcome 7 by recording participants‟ consumption at the outlet at thetime of visit, and subsequently using this to establish kJ (and other nutrient levels)consumed.The intercept surveys employed a targeted and specific approach, the frame of referencefor participants being their experiences in one particular outlet at one particular point intime. While it is not necessarily a fully representative survey, a stratified clustersampling approach was instigated to capture the broadest range of locations andencompass a spread of customer demographic and situational factors which mayinfluence results. In particular, this approach took into account the need for a mix ofoutlet types, chains, metropolitan and regional locations, and areas with low, medium,and high socio-economic profiles. These sample points were revisited in Waves 2 and 3of the survey to ensure valid and reliable comparison over time (Only 1 outlet needed tobe replaced during Wave 3, as the outlet had become inaccessible since Waves 1 and 2.It was however, replaced with an outlet from the same chain and representing a similarequivalent demographic breakdown).12
<strong>Fast</strong> <strong>Choices</strong>Within each outlet, trained interviewers were placed and recruited participants at randomas they were leaving the site. Interviewers then administered the paper survey, witharound 60 interviews being completed in each of the 14 sites.Surveys were collated and the data entered, with a series of logic checks made, andquality control of 10% of surveys that were entered. A major activity at this stageincluded coding of food and drink items consumed to establish their relevant kJ, fat,sugar and sodium values. This was based on nutritional values for standard food itemscollated by the <strong>NSW</strong> <strong>Food</strong> <strong>Authority</strong> from the information available on the websites of theparticipating chains. In some cases, the nutritional content of items could not beestablished and participants for whom this was the case are excluded from calculationsfor average intake levels presented in this report.2.2.3 General Population Online Surveys (Waves 1-3)Three Waves of online survey were completed. Wave 1 comprised n=506 <strong>NSW</strong>residents, Wave 2 comprised 528 <strong>NSW</strong> residents and Wave 3 comprised n=531<strong>NSW</strong> residents. Waves 1 and 2 ran concurrent with the aforementioned interceptsurveys (i.e. 7 September to 9 October 2011 and 20 April to 18 May 2012 respectively)whereas Wave 3 ran from 15 October 2012 to 22 October 2012 (shortly after launch ofthe revised communication campaign).The unweighted and weighted profile of those responding to the surveys is set out inTable 2 below.Table 2: Profile of General population Online Survey ParticipantsGeneral population <strong>NSW</strong>Online surveysWave 1Unweighted%Wave 2Unweighted%Wave 3Unweighted%<strong>NSW</strong>Population*Weighted%LocationGender<strong>NSW</strong> Metro 63 54 52 63<strong>NSW</strong> Regional 37 46 48 37Male 43 48 49 50Female 57 52 51 5016-25 years old 14 12 8 17Age 26-45 years old 32 31 29 3646 years old andabove55 57 63 47*ABS 2006 Census Data (All of Waves 1, 2 & 3 were weighted to these percentages)The surveys were used to obtain key measures related primarily to intermediateoutcome 6. This included measures of fast food and drink purchase behaviour,awareness and understanding of nutritional information and their influence on purchasedecisions, and feedback about the initiative and likely impact on future food choices. The13
<strong>Fast</strong> <strong>Choices</strong>online surveys were used to establish a series of overall ‘population measures’ ofconsumer awareness and understanding, without the specificity of a particularexperience at a particular point in time as measured in the corresponding interceptsurvey.Wave 1 lasted approximately 15 minutes, whereas Waves 2 and 3 increased to 22minutes, in order to incorporate pre-and post testing measures for the consumercommunications campaign. Although not the primary aim of the surveys, or targetaudience of the campaign, it was considered of interest to gauge general populationrecall of, and response to, the campaign.The surveys were administered using the MyOpinions panel. Invitations to participatewere sent to a random sample of known <strong>NSW</strong> residents on the panel (fresh sample wasutilised across Wave 1, 2 and 3), and screening questions implemented to ensure theywere in scope and that responses were captured across the breadth of the populationbased on age, gender and location. Participants were „screened out‟ from the survey ifthey had not purchased food at least once from at least one standard food outletin the past month, if they were no longer resident in <strong>NSW</strong>, or if quotas were alreadyattained on targets for gender, age and location.Following completion of the surveys, data was weighted to the <strong>NSW</strong> adult population(using the same weighting process and weights across Wave 1, 2 and 3), ensuringestablishment of a comparable survey population between Waves of the survey.Weighting was applied on age, gender, and location, using ABS Population Counts astarget weights. Validation of unweighted and weighted data indicated there wasnegligible impact of weighting on survey data.2.2.4 18 to 24 year old Online Surveys (Waves 1-3)Three Waves of online survey were completed amongst the primary target audience ofthe consumer communications campaign, namely those aged 18-24 years. Wave 1comprised n=217 Greater Sydney residents, Wave 2 comprised 213 GreaterSydney residents and Wave 3 comprised n=206 Greater Sydney residents. Wave1 was conducted from 20 to 29 February 2012, one week immediately prior to launch ofthe campaign but at a point in time when menu labelling was in place at outlets. Wave 2ran concurrent with Wave 2 of the aforementioned intercept and general populationonline surveys (i.e. 20 April to 18 May 2012) and Wave 3 ran concurrent with Wave 2 ofthe general population online survey, commencing on 16 October 2012 and closing on 25October 2012The unweighted and weighted profile of those responding to the survey is set out inTable 3 overleaf.14
Table 3: Profile of 18-24 year old online survey participants<strong>Fast</strong> <strong>Choices</strong>18 – 24 year old GreaterSydney online surveyWave 1Unweighted%Wave 2Unweighted%Wave 3Unweighted%<strong>NSW</strong>Population*Weighted%LocationGender<strong>NSW</strong> Metro 100 100 100 63<strong>NSW</strong> Regional - - - 37Male 43 36 38 50Female 57 64 62 5018-24 years old 100 100 100 17Age 26-45 years old - - - 3646 years old and - - - 47above*ABS 2006 Census Data (All of Waves 1, 2 & 3 were weighted to these percentages)The surveys were used to obtain pre- and post measures relating to the campaign. Thisincluded spontaneous and prompted awareness of campaign element, as well asreported impact on attitudes and future behaviour. Again, although not the primaryfocus of this study, it was considered of interest to include the measures for the generalpopulation survey in order to draw comparisons (i.e. consumer awareness andunderstanding, measures of fast food and drink purchase behaviour, awareness andunderstanding of nutritional information and their influence on purchase decisions, andfeedback about the initiative and likely impact on future food choices).Wave 1 lasted approximately 18 minutes (and included only spontaneous awareness),whereas Waves 2 and 3 increased to 22 minutes (and included both spontaneous andprompted awareness).The survey was administered using the MyOpinions panel. Invitations to participate weresent to a random sample of known Greater Sydney residents on the panel (fresh samplewas utilised across Waves 1, 2 and 3), and screening questions implemented to ensurethey were in scope and that responses were captured across the breadth of thepopulation based on age, gender and location. Participants were „screened out‟ from thesurvey if they had not purchased food at least once from at least one standardfood outlet in the past month, if they were no longer resident in Greater Sydney, or ifquotas were already attained on targets for gender, age and location.Following completion of the survey, data was weighted (using the same weightingprocess and weights across Wave1 1, 2 and 3), ensuring establishment of a comparablesurvey population between Waves of the survey. Weighting was applied only on gender,using ABS Population Counts as target weights. Validation of unweighted and weighteddata indicated there was negligible impact of weighting on survey data.15
<strong>Fast</strong> <strong>Choices</strong>A detailed account of the methodology employed for each research component, alongwith technical materials, is appended.2.3 Interpreting this reportThis report presents detailed results from the three survey elements outlined earlier –and focusses on differences between Waves, and to a lesser extent across surveys.Results are presented in text and / or chart format. In some cases data in chartsmay not add up to 100%. This is a result of rounding of individual data items, or forsome question types, where multiple responses were allowed.Any variations that are statistically significant have been noted using pink directionalarrows. Significance testing was tested at the 95% confidence level.Significance testing involves testing whether a metric (a mean or a proportion) of thesample/ segment is significantly different from another sample/ segment in the previouswave. This involves specifying a confidence level (usually 95%) which means that 95%of the time the result will hold true, if the result is found to be statistically significant.The test uses the mean, standard deviation and sample sizes of the samples/ segmentsto compute a test statistic, which is compared against a standard value (determined bythe confidence level specified). This comparison determines whether there is a significantdifference between the 2 samples / waves at the specified confidence level.Please note that these differences are calculated relative to the samples/ figures beingcompared; i.e. the differences between two samples/ figures are relative to their samplesize and the standard deviation of the sample. TNS practice is to test statisticaldifferences at the 95% confidence level (so we are 95% confident that there is adifference), which is in line with Australian and international market research standards.Any statistically significant differences have been noted in the text as „significantdifferences‟.Please note, the distribution of the Q1C data – for all three waves – was examined andfound not to be modelled by the normal distribution 1 . This ruled out the use ofparametric tests – such as the Student‟s t-test – to assess statistical differences betweenthe means across waves. The, non-parametric, median test (k samples) was thereforeemployed to test significant differences between the medians for Q1C.1 Kolmogorov-Smirnov Normality Tests: Wave 1, Statistic = 0.665, Sig. = .000; Wave 2, Statistic = 0.64, Sig. = .000; Wave 3,Statistic = 0.89, Sig. = .00016
3. MAIN FINDINGS<strong>Fast</strong> <strong>Choices</strong>3.1 Current consumption patterns3.1.1 Frequency and means of purchaseAcross both online surveys, the majority of participants stated that they purchase itemsfrom fast food outlets at least once a week – although with higher proportions occurringamongst young people.When looking across waves, the proportion of participants purchasing items weeklyreduced slightly during Waves 2 and 3 (relative to Wave 1), but not significantly.Interestingly however, young people were significantly less likely to purchase items oncea day and significantly more likely to purchase items once every 2 to 3 weeks.Figure 3.1 below gives the detailed response breakdown across Waves 1, 2 and 3 of boththe General Population Online Survey and the 18 to 24 year old Online Survey.(Note: Percentages shown are based on weighted data, whereas base sizes quotedreflect unweighted figures. This principle has been applied throughout)Figure 3.1: Frequency of purchase from standard food outlets (Online W1-W3)17
3.1.2 Reasons for purchase<strong>Fast</strong> <strong>Choices</strong>The convenience of fast food outlets is a highly significant factor in people‟s choice.The majority of participants (in both the General Population Online Survey and the 18 to24 year old Online Survey) mentioned this as a factor. Following this, familiarity andcomfort, food taste & quality, treat or reward and value for money are all importantfactors in choosing to purchase fast food for both the general population and youngpeople alike. Yet, while 18 to 24 year old Online Participants focus more on the tastesand flavours, as well as the perceived value for money, General Population OnlineParticipants place greater emphasis on quality.Results remained relatively consistent across Waves however, amongst 18 to 24 year oldOnline Participants there was a significant decline in mentions of „price/ value for money‟during Wave 3.Below, Figure 3.2 gives the detailed breakdown of reasons for purchase.(Note: Participants could select up to five responses and therefore the results do not add up to 100%)Figure 3.2: Main reasons for purchasing from outlets (Online W1-3)18
3.1.3 Variation in items purchased<strong>Fast</strong> <strong>Choices</strong>Looking at how often participants vary their choice of items when in standard foodoutlets, just over two thirds often or always buy the same items. Only very few varytheir choice of items in fast food and drink outlets.Findings were very consistent across survey audiences (both the General PopulationOnline Survey and the 18 to 24 year old Online Survey) and across all three Waves,indicating entrenched and habitual behaviours in this regard.The proportions in detail are found in Figure 3.3.Figure 3.3: Frequency of varying items purchased (Online W1-3)19
3.2 Understanding of kJ and other indicators3.2.1 Unprompted understanding of kilojoules<strong>Fast</strong> <strong>Choices</strong>„Energy value of food‟ remained the most commonly understood meaning of kilojoules.Around half of the General Population Online Participants and almost two thirds of 18 to24 year old Online Participants correctly and spontaneously stated that kilojoules are ameasure of energy. Around a further fifth of the General Population Online Participantsand a tenth of the 18 to 24 year old Online Participants refer to it as the calorie contentof food and drinks.Overall, 18 to 24 year old Online Participants were more likely to state an appropriateresponse than General Population Online Participants, but low levels of inappropriateassociation are still observed across both audiences.Figure 3.4: Unprompted understanding of kilojoules (Online W1-3)20
3.2.2 Prompted understanding of kilojoules<strong>Fast</strong> <strong>Choices</strong>On prompting, there were increased levels of those stating the preferred response thatkilojoules measure energy.There was limited change across waves amongst the General Population OnlineParticipants, whereas there was a dip in mentions of „Energy‟ amongst 18 to 24 year oldOnline Participants during Wave 2, together with a temporary increase in uncertainty(i.e. „don‟t knows‟).Figure 3.5: Prompted understanding of kilojoules (Online W1-3)21
3.2.3 Reported confidence in knowledge of nutritional information<strong>Fast</strong> <strong>Choices</strong>Participants were asked to rate their level of confidence regarding knowledge across arange of nutrients.For Wave 1 General Population Online Participants confidence in knowledge of kJs rankedlow, with only 45% claiming that they felt confident. The proportion feeling confidentincreased slightly, but not significantly, in Wave 2 before declining marginally in Wave 3.Slightly larger proportions were confident in their understanding of energy and calorieswith highest levels of confidence in relation to fat and sugar.Among 18 to 24 year old Online Participants, reported knowledge levels for Wave 1 weresimilar to that expressed by the general population, although knowledge levels generallydropped off slightly during Wave 2, before increasing during Wave 3. Confidence levelsregarding energy dropped off significantly during Wave 2, but recovered during Wave 3.Figure 3.6: Reported confidence in knowledge of nutritional information (OnlineW1-W3)% Nett very/ quite confidentGeneral Wave Wave Wave 18-24 years Wave Wave WavePopulation 1 2 31 2 3Fat 58 61 57 Fat 56 47 47Sugar 57 61 59 Sugar 55 46 49Salt 51 53 52 Saturated fat 50 42 42Nutrients 51 52 54 Energy 48 38 42Energy 49 48 48 Salt 47 39 41Calories (Cal) 48 52 50 Nutrients 46 42 46Protein 48 48 47 Calories (Cal) 45 42 42Carbohydrates 47 50 47 Kilojoules 45 41 45(kJ)Fibre 47 50 47 Carbohydrates 42 35 42Kilojoules 45 50 46 Fibre 41 37 40(kJ)Saturated Fat 42 52 51 Protein 41 39 46Online C5. Thinking about the contents of the food and drinks you consume in your everyday life, how confident are you inyour knowledge of...Base: (All participants), W1 Gen. Pop. n=506; W2 Gen. Pop. n=528; W3 Gen. Pop. n=531; W1 18-24 yr. olds n=217; W218-24 yr. olds n=213; W3 18-24 yr. olds n=20622
3.2.4 Actual knowledge of kilojoules / energy<strong>Fast</strong> <strong>Choices</strong>Participants‟ knowledge and understanding of kilojoules and energy was tested furtherusing a series of true and false statements. However, a general lack of knowledgepersisted and there still appears to be some confusion about what high kilojoule valuesmean.In all three Waves of the General Population Online Survey, just over half statedcorrectly that kilojoules are not a measurement of fat and that food and drink with highnumbers of kilojoules have high energy content. In both cases there was a slight, butnot significant increase in correct answers from Wave 1 to Waves 2 and 3.The 18 to 24 year old Online Participants more often stated the correct answers.However, from Wave 1 to Wave 2, fewer participants cited the correct answers inresponse to the statement “unused energy turns into fat”, although this recovered andcorrected itself again in Wave 3. Similarly, the statement “kilojoules are a measure of fatcontent” attracted significantly higher levels of don‟t know during Wave 2, but thisuncertainty declined during Wave 3.Figure 3.7: Actual knowledge of kilojoules / energy (Online W1-W3)Online C8. Here are some statements about nutritional information. Please indicate whether they are true or falseBase: (All participants), W1 Gen pop n=506; W2 Gen pop n=528, W3 Gen Pop. n=531Base: (All participants), W1 18-24 n=217; W2 18-24 n=213, W3 18-24 n=20623
3.2.5 Understanding of ‘average daily intake’<strong>Fast</strong> <strong>Choices</strong>There appeared to be broad, but not unanimous, understanding of the term „averagedaily intake‟. Over half of the General Population Online Participants and around twothirdsof 18 to 24 year old Online Participants described it as „the mean amount of dailyfood intake‟.Amongst the General Population Online Survey there was a significant increase betweenWaves 1, 2 and 3 in those stating that this refers to the “healthy amount for properfunctioning of the body”. Responses from 18 to 24 year old Online Participants remainedlargely consistent across Waves.Figure 3.8: Understanding of ‘average daily intake’ (Online W1-W3)24
3.2.6 Awareness of daily energy (kJ) intake levels<strong>Fast</strong> <strong>Choices</strong>When asked to identify the average daily intake of kilojoules, there were strongindications that knowledge levels have improved across Waves.At Wave 1, three-quarters of General Population Online Participants stated not knowingwhat the daily intake of kJs is. This figure subsequently declines slightly during Waves 2and 3 (a positive shift). Amongst 18 to 24 year old Online Participants, levels of don‟tknow commenced at 58% during Wave 1, but reduced significantly down to 45% duringWave 3 (another positive shift).Of those who put forward a kJ figure, most under-estimated rather than over estimated,with a median response of 4,500 achieved at Wave 1 for the General Population OnlineSurvey, and 6,119 for the 18-24 year old survey. These figures do however, becomeincreasingly accurate (and in line with the correct figure of 8700) during Waves2 and 3, with the median increasing to 7993 and 8161 respectively.Also, the proportion of those specifying the correct ‘ballpark’ of between 8000-8999 kJs increased significantly across both audiences from Wave 1 to Wave 3.Even more encouragingly, the percentage of those specifying the correct/ exactamount of 8700 kJs increased significantly amongst both audiences and fromWave 1 to Wave 3,Figure 3.9: Awareness of daily energy (kJ) intake levels (Online W1-3)25
<strong>Fast</strong> <strong>Choices</strong>A similar question was asked of Intercept Participants and an equally favourable outcomewas noted. So when asked whilst in the outlet for the average adult daily intake, themajority were uncertain, whereas this proportion reduced significantly at both Waves 2and 3.Of those who put forward a response, the median was initially given as 2,500 at Wave 1(notably lower than median responses given in the online survey), and a very lowproportions estimated between 8000-8999kJs or quoted the correct figure of 8700kJs.However, Waves 2 and 3 saw a significant improvement in accuracy, with themeans and medians increasing in line with the correct figure. Also the proportioncorrectly identifying the correct ballpark of 8000-8999kJs and the proportion correctlyidentifying the exact figure of 8700 kJ increased significantly.Figure 3.10: Awareness of daily energy (kJ) intake levels (Intercept W1-W3)26
3.2.7 Awareness of daily intake levels of fat and sodium<strong>Fast</strong> <strong>Choices</strong>When questioned as to their awareness of average adult daily intakes of fat and salt,most were unsure. The majority were either incorrect or did not know, with littlevariance across Waves or across and across both audiences (General Population OnlineParticipants and the 18 to 24 year old Online Participants).Figure 3.11: Awareness of daily intake levels of fat and sodium (Online W1-W3)27
<strong>Fast</strong> <strong>Choices</strong>Similarly, when asked to specify what the average daily intake was for fat, sodium andsugar, the overwhelming majority said that they did not know, with few major shiftsoccurring between Wave 1 and 3 and across both audiences (General Population OnlineParticipants and the 18 to 24 year old Online Participants).Figure 3.12: Awareness of daily intake levels – fat, sodium and sugar (OnlineW1-W3)QC7. What do you think the average daily intake of the following is?Base: (All participants), W1 Gen pop n=506; W2 Gen pop n=528; W3 Gen pop. n=531 - W1 18-24 n=217; W2 18-24 n=213, W3 18-24 n=20628
3.2.8 Average and median kJs purchased at outlet – Intercept only<strong>Fast</strong> <strong>Choices</strong>Figure 3.13 below sets out the data derived from Waves 1 to 3 of the Intercept Surveyfor the average and median Energy (kJ) content of fast food purchases, as well as thesefigures for a number of other nutrients.The figures indicate a reduction in the mean and median of kJs purchased from Wave 1to Wave 2, and again from Wave 2 to Wave 3 (as well as across almost all other nutrientindicators).The mean kJ quantity purchased per person in Wave 1 was 3770kJ compared with3231kJ for Wave 2 and 3196kJ for Wave 3. Similarly, the median kJ purchased perperson in Wave 1 was 3355kJ, compared to 3192kJ in Wave 2 and 2836kJ inWave 3 – a significant decline relative to Wave 1.The values recorded ranged from 5 to 24,368 for Wave 1, from 2 to 18,455 for Wave 2and from 9 to 15,960 in Wave 3.Figure 3.13: Average kJs purchased at outlet (Intercept W1-W3)Figures are based on Wave 3 codeframes (each chain’s nutrient informationrecords as at September 2012) to provide a final set of fully comparablepurchase figures.29
<strong>Fast</strong> <strong>Choices</strong>3.2.9 Estimating the kilojoule content of items purchased – Intercept onlyWhen asked to estimate the total kilojoules of the items participants had purchased forthemselves there was initially great uncertainty and underestimation. The majority ofIntercept Participants were unable to estimate the kJ content of their purchases.Reassuringly however, the proportion not able to do this declined significantlyacross Waves 2 and 3 (down from 76% to 66% respectively).Those who did specify an amount typically underestimated, rather than overestimated,what they had consumed – and the large differences between actual and estimatedfigures highlighted the lack of understanding of kilojoule content. Positively however,the proportion who underestimated reduced significantly during Wave2 and 3.Also, those whose estimate was accurate to within +/-10% of the actual figureincreased significantly from Wave 1 to Waves 2 and 3 (and from 7% to 13% and 14%respectively).Figure 3.14: Estimated kilojoule content of items purchased (Intercept W1-W3)30
3.3 Salience and use of nutritional information in outlets<strong>Fast</strong> <strong>Choices</strong>3.3.1 Frequency of menu useMost fast food consumers use menus when making their decision, with just under half ofboth General Population Online Participants and the 18 to 24 year old Online Participantsalways or often doing so.Responses remained largely unchanged across all three Waves.Figure 3.15: Frequency of menu use (Online W1-W3)31
3.3.2 Menu information use<strong>Fast</strong> <strong>Choices</strong>Looking at the menu information used by fast food consumers, prices and special offerinformation are used most, whereas nutrition and kilojoule labelling is used less often(see Figure 3.16 below).However, the use of kilojoule information has increased significantly amongst GeneralPopulation Online Participants in Waves 2 and 3.The proportion of 18 to 24 year old Online Participants using the menu for kilojouleinformation commenced on a higher level than for General Population OnlineParticipants, but remained relatively similar across Waves 1, 2 and 3 (although it isworth noting that legislation was already in place during Wave 1).Figure 3.16: Information used off menu for purchase choices (Online W1-W3)32
<strong>Fast</strong> <strong>Choices</strong>3.3.3 Nutritional considerations when purchasing fast food and drinksIn terms of nutritional items considered at purchase, fat and sugar consistently mergedin pole position – and across both audience groups. This was followed by Saturated Fatand Calories for General Population Online Participants, and the same two but in reverseorder for 18 to 24 year old Online Participants.Around a quarter of participants always or often considered the kilojoule content of itemspurchased. No significant differences were observed across Waves for any of thenutrients. However, slight increases were noted for Energy, Protein and kJs amongst 18to 24 year old Online Participants during Wave 3.Figure 3.17: Nutritional considerations when purchasing fast food and drinks(Online W1-W3)% Nett always/ often considerGeneral Wave Wave Wave 18-24 years Wave Wave WavePopulation 1 2 31 2 3Fat 33 37 34 Fat 32 32 31Sugar 31 37 33 Sugar 32 27 28Saturated fat 31 32 30 Calorie 31 25 29Calorie 27 27 27 Saturated fat 30 27 30Salt 27 28 27 Kilojoule 26 24 28Kilojoule 24 24 24 Carbohydrate 23 20 24Energy 22 22 23 Nutritional 23 23 24Nutritional 22 24 25 Salt 22 22 21Carbohydrate 19 22 22 Energy 21 22 26Fibre 17 20 19 Protein 20 19 24Protein 17 20 19 Fibre 16 15 19Online C4. Now, thinking about the food and drink purchases you make for yourself only in fast food and drink outlets, how often do youconsider the following things when making your choice?Base: (All participants), W1 Gen. Pop. n=506; W2 Gen. Pop. n=528; W3 Gen. Pop n= 531; W1 18-24 yr. olds n=217; W2 18-24 yr. oldsn=213; 18-24 yr. olds n=20633
<strong>Fast</strong> <strong>Choices</strong>3.4 Role of information on behaviour & perceived impact of <strong>Fast</strong><strong>Choices</strong> legislationThe Intercept Surveys3.4.1 Awareness of nutritional information at outletOf the people interviewed for Wave 1 of the Intercept Survey only 15% indicated thatthey had noticed any nutritional information during their visit. Of these, two thirds(67%) reported that they had actually read this nutritional information.During Waves 2 and 3 of the survey there was a significant increase in thosenoticing nutritional information (W2 40%, W3 36%) relative to Wave 1. There was aslight increase in readership at Wave 2, before dropping back at Wave 3, as shown inFigure 3.18 below.Figure 3.18: Awareness of nutritional information at outlet (Intercept W1-3)34
3.4.2 Location of nutritional information in outlets<strong>Fast</strong> <strong>Choices</strong>In Wave 1 of the Intercept Survey, a quarter of participants noticed nutritionalinformation on the packaging/ wrapper/ box, while only slightly fewer (23%) reportedthat they had seen the information on the menu board alongside the price.Waves 2 and 3 saw a significant increase in mentions of the menu board labellingand resultant decreases in mentions of all other locations.Figure 3.19: Location of nutritional information observed (Intercept W1-W3)35
3.4.3 Prompted recall of specific nutritional information at outlet<strong>Fast</strong> <strong>Choices</strong>When asked to recall which specific nutrients Intercept Participants had seen informationfor, the most salient, in Wave 1 of the Intercept Survey, was fat content (55%).However, recall of kilojoule content increased significantly from 28% in Wave 1, to80% in Wave 2 and 81% in Wave 3, together with a significant reduction in mentions offat and other nutrients.Figure 3.20: Nutritional information recalled (Intercept W1-W3)In summary, during Wave 2 n=807 Intercept Participants were asked whether theynoticed any information about nutritional contents of the food or drinks items, of thesen=321 (40%) confirmed they had. Of these 82% mentioned noticing it on the menuboard, and in terms of what nutrients it was about, 80% mentioned kilojoulesspecifically. So when crossing location by nutrient (amongst those who had noticedinformation i.e. n=321), n=159 (50%) correctly identified ‘kilojoules’ specificallyon the menu board.During Wave 3 n=805 Intercept Participants were asked whether they noticed anyinformation about nutritional contents of the food or drinks items, of these n=293 (36%)confirmed they had. Of these 81% mentioned noticing it on the menu board, and interms of what nutrients it was about, 81% mentioned kilojoules specifically. So when36
<strong>Fast</strong> <strong>Choices</strong>crossing location by nutrient (amongst those who had noticed information i.e. n=293),n=156 (53%) correctly identified ‘kilojoules’ specifically on the menu board.3.4.4 Reported influence of nutritional information on siteAmongst Intercept Participants, the reported influence of nutritional information onpurchases appears to vary with time. Findings suggest that the value of providingnutritional information is not in fact influencing food choices there and then but that itmight have a more indirect impact on food choices in a longer term and on-going sense.So, although just over a third of Intercept Participants said that it had influenced theirfood and drink choice „in store today‟, this proportion remained relatively consistentacross all three Waves. However, just over a third also stated that it had influenced theirchoice of food and drinks „later that day‟ during Wave 1 but this proportion increasedduring Waves 2 and 3. Also, just under half indicated that it had influenced their choiceof food and drinks „in the chain in the future‟ during Wave 1 whereas this proportion alsoincreased during Waves 2 and 3.Figure 3.21: Influence of nutritional information on site (Intercept W1-3)37
The Online Surveys<strong>Fast</strong> <strong>Choices</strong>3.4.5 Awareness of nutritional information at outletAmongst the General Population Online Participants there has been a progressiveincrease in those who have noticed nutritional information in fast food / drinkoutlets from Waves 1 to 3.Of those who had ever noticed information, there was an increase in nutrient informationreadership from Wave 1 to Wave 2, and a significant increase from Wave 1 to Wave 3.Figure 3.22: Awareness of nutritional information at outlet – Noticed/ read(Online W1-3)38
<strong>Fast</strong> <strong>Choices</strong>B1. Online. Have you ever noticed nutritional information when making a purchase from fast food and drink outlets?Base: (All participants), Gen pop W1 n=506; W2 n=528, W3 n=531; 18-24 W1 n=217; W2 n=213, W3 n=206B3. Online. Did you read this nutritional information?Base: Participants who noticed this nutritional information, Gen pop W1 n=233, W2 n=257, w3 n=254: 18-24 W1 n=128, W2 n=138, W3n=130For the 18 to 24 year old Online Survey, higher levels of observation were recordedrelative to the General Population Online Survey, and similarly, there was an increase inoverall nutrient observation during Waves 2 and 3. Subsequent readership levelshowever, remained relatively static, with a slight dip during Wave 2 before returning tolevels observed during Wave 1.Overall however, greater numbers are at least noticing the information.39
3.4.6 Location of nutritional information observed<strong>Fast</strong> <strong>Choices</strong>When asked the location of nutritional information in the online studies, just over half ofparticipants initially (at Wave 1) reported seeing it on the packaging, with mentions ofthis declining at Waves 2 and 3 (and significantly so amongst General Population OnlineParticipants).There was further a significant jump in those noticing nutritional information onthe menu amongst General Population Online Participants. Although equally highlevels of menu labelling observation were noted within the 18 to 24 year old OnlineSurvey, a less significant increase in observations was detected - likely due to the factthat legislation was already in place during Wave 1 and a shorter time-span between theconduct of Waves 1 and 2.Figure 3.23: Location of nutritional information observed (Online W1-3)40
3.4.7 Prompted recall of specific nutritional information observed<strong>Fast</strong> <strong>Choices</strong>As with the intercept findings, the online surveys showed fat to be one of the mostsalient nutrients expressed during Wave 1.However, in Waves 2 and 3 the salience of kilojoules jumped significantlyamongst General Population Online Participants (together with a decrease in salience ofall other nutrients).Amongst 18 to 24 year old Online Participants kilojoules were by far the most salientnutrient, with around three-quarters recalling seeing this information, and a proportionconsistent across all 3 Waves. These findings are however, unsurprising seeing thatfieldwork for Wave 1 of the 18-24 survey was completed just prior to kJ labellingbecoming mandatory – with most outlets having already introduced it.Figure 3.24: Prompted recall of specific nutritional information observed(Online W1-3)41
<strong>Fast</strong> <strong>Choices</strong>In summary, when crossing location of where nutritional information was noticed (i.e.menu board) by specific nutrient (i.e. kJs) - amongst those who stated ever noticing andreading nutritional information when making a purchase from fast food and drink outlets- the following figures emerged:General Population Online SurveyDuring Wave 1 n=5 (5%) participants correctly identified „kilojoules‟ specificallyon the menu board (of n=189 who noticed and read nutritional information).During Wave 2 n=75 (46%) participants correctly identified „kilojoules‟ specificallyon the menu board (of n=204 who noticed and read nutritional information).During Wave 3 n=70 (44%) participants correctly identified „kilojoules‟ specificallyon the menu board (of n=212 who noticed and read nutritional information).18-24 year old Online SurveyDuring Wave 1 n=28 (33%) correctly identified „kilojoules‟ specifically on themenu board (of n=110 who noticed and read nutritional information at an outlet).During Wave 2 n=39 (43%) correctly identified „kilojoules‟ specifically on themenu board (of n=118 who noticed and read nutritional information).During Wave 3 n=42 (50%) correctly identified „kilojoules‟ specifically on themenu board (of n=114 who noticed and read nutritional information).42
3.4.8 Reported influence of nutritional information on choice<strong>Fast</strong> <strong>Choices</strong>Just over half of all survey participants stated that nutritional information influencedtheir choice of items „a little‟ or „a great deal‟ during their last purchase. Proportionsremained fairly similar across all three Waves and both audience segments (GeneralPopulation Online Participants and the 18 to 24 year old Online Participants).Amongst those participants who agreed that nutritional information influenced theirchoice, there was a significant increase in General Population Online Participantsand a slight increase in 18 to 24 year old Online Participants, reporting thatkilojoule information most influenced their choice.Figure 3.25: Reported influence of nutritional information on choice (OnlineW1-3)43
3.4.9 Anticipated impact of menu labelling changes<strong>Fast</strong> <strong>Choices</strong>Amongst General Population Online Participants, and during Waves 2 and 3, there was asignificant increase in those reporting that the kilojoule labelling would ‘verylikely’ impact their choice relative to Wave 1. This was however, largely offset by asignificant decline in those reported that it was only „likely‟ to impact their choice.Overall, there was therefore only a slight increase in those who reported that the menulabelling would influence their choice at all.18 to 24 year old Online Participants were slightly more likely to report that the menulabelling would impact their decision-making, with this likelihood increasing progressivelyfrom Waves 1 to 3.For those who reported that they would be influenced by labelling changes, the majoritystated they would use the labelling to purchase items with lower kilojoulecontent – this response increased significantly in Waves 2 and 3 for the GeneralPopulation Online Participants and the 18 to 24 year old Online Participants.Figure 3.26: Anticipated impact of menu labelling changes (Online W1-W3)44
<strong>Fast</strong> <strong>Choices</strong>Online D2. Is this change in labelling likely to impact your decisions regarding the fast food and drink you order?Base: (All participants), Gen pop W1 n=506; W2 n=528, W3 n=531; 18-24 W1 n=217; W2 n=213, W3 n=206Online D3. In what ways is this change in menu labelling likely to impact your decisions regarding the fast food and drink you order?Base: All who consider it very likely or likely changes will impact their decisions, Gen pop W1 n=151, W2 n=201, W3 n=232; 18-24 W1 n=81,W2 n=96, W3 n=9045
3.4.10 Reactions to the kilojoule labelling – likes & dislikes<strong>Fast</strong> <strong>Choices</strong>Online participants were asked what they thought of the changes to legislation. Overall,this provoked a fairly ambivalent response, with just under half, from both cohorts(General Population Online Participants and the 18 to 24 year old Online Participants)and across all three Waves, not having any particular likes.Those who gave positive responses broadly praised the legislation and noted thatkilojoule information would allow people to make good decisions.Figure 3.27: Reactions to the kilojoule labelling – likes (Online W1-W3)Positively, however, the vast majority of both cohorts did not express any dislikes aboutthe initiative – this response increased significantly in Wave 2 of the general populationsurvey. This indicates continuing acceptance of the kilojoule labelling legislation, withfew dislikes.46
Figure 3.28: Reactions to the kilojoule labelling – dislikes (Online W1-W3)<strong>Fast</strong> <strong>Choices</strong>47
3.5 The Communications Campaign3.5.1 Primary purchase locations<strong>Fast</strong> <strong>Choices</strong>The vast majority of participants place their order in person – primarily in the outletitself, otherwise at the drive through, or in a food courts. Ordering by telephone, via thewebsite or smart phone occurred considerably less frequently.Results were reasonable consistent across all three Waves, although 18 to 24 year oldOnline Participants indicated a decrease in ordering in outlets together with an increasein ordering in food courts, whereas General Population Online Participants indicated adecreased incidence of ordering at drive-thrus.Figure 3.29: Primary purchase locations (Online W1-3)48
3.5.2 Spontaneous Awareness – Perceived location of advertising<strong>Fast</strong> <strong>Choices</strong>Post launch of the campaign, in Wave 2, all online participants were asked to recall thelocation of any recent advertising regarding kilojoule food and drink labelling. Whilst thecampaign did not specifically target the general population, participants in this surveywere also asked this question.Across both cohorts, the highest mentions were achieved for advertising in the outletsthemselves, followed by claimed TV advertising and then advertising in shoppingcentres / food courts. This latter proportion remaining steady amongst 18 to 24 yearold Online Participants, but declined amongst General Population Online Participants.Figure 3.30: Spontaneous Awareness – Perceived location of advertising(Online W1-W3)49
3.5.3 Spontaneous Awareness – Recalled content of advertising<strong>Fast</strong> <strong>Choices</strong>All online participants were then asked to describe any advertising they had seen orheard.Around two thirds of participants did not recall any advertising. Of those who diddescribe an advert, most mentioned the kilojoule labelling itself, including mentionsof the menu board and 8700.com.au website. Others simply referred to the outletsspecifically e.g. McDonalds, Subway.Figure 3.31: Spontaneous Awareness – Recalled content of advertising (OnlineW1-W3)50
<strong>Fast</strong> <strong>Choices</strong>3.5.4 Prompted Awareness – Seen / heard elements of the campaignIn Waves 2 and 3 of each online survey, participants were prompted with campaignstimuli and asked whether they had seen or heard different elements of the campaign –the posters, search engine ads, web banners, radio ads, Facebook and mobile ads.Participants were also prompted with functional elements of the campaign – the website,Facebook page and mobile apps – and asked if they had seen or used them.In line with the targeted nature of the campaign, 18 to 24 year old Online Participantsmore often stated being aware of each of the campaign elements than the GeneralPopulation Online Participants. The poster ads were seen by around a quarter ofthis audience during Wave 2, with recall increasing to just under a third duringWave 3. This was followed by recall of the Online Facebook ads and then, to a lesserextent, the Website, search engine ads and radio ads.In total, one in ten (9%) of 18-24 year-olds reported using the website, with a further5% aware of it. Interestingly, just over a fifth (21%) had seen the Facebook ads,but only 1% had used them. In terms of raising awareness at least, Facebook seems tobe a useful tool.Although the vast majority of the General Population Online Participants had not seenthe campaign elements, cut through had been greatest for the Poster ads and searchengine ads.Figure 3.32: Prompted Awareness – Seen / heard elements of the campaign(Online W1-W3)% YesGeneral Population Wave Wave 18-24 years Wave Wave2 32 3Poster ads 9 9 Poster ads 23 31Online Facebook ads 3 5 Online Facebook ads 22 16Website 4 4 Website 14 9Search engine ads 3 10 Search engine ads 13 16Radio ads 2 NA Radio ads 13 NAWeb banner 3 5 Web banner 6 10Mobile app 1 3 Mobile app 5 9Mobile ads 1 2 Mobile ads 5 8Facebook page 1 3 Facebook page 4 6Online Y2a-g. Have you seen/ heard any of these ads before?Base: (All participants), W2 Gen. Pop. n=528; W3 Gen. Pop. n=531Base: (All participants), W2 18-24 yr. olds n=213; W3 18-24 yr. olds n=20651
3.5.5 Prompted campaign message takeout<strong>Fast</strong> <strong>Choices</strong>After viewing all the campaign stimuli, participants were prompted for the main messageof the campaign.The target audience, 18 to 24 year old Online Participants, most often stated it was to‘monitor the energy you intake daily’ and/or ‘8700kJ recommended dailyintake’. Other mentions included „find your personal RDI‟, „how many kilojoules are infood‟, and „eat more health‟/ „healthy food choices‟. Although responses were relativelyconsistent across Waves 2 and 3, and simply an interchange of proportions across mainmentions, there was an additional mention noted, namely the „amount of daily kJsallowed‟.Amongst General Population Online Participants a similar range and ordering of mentionswas achieved, with most mentions achieved for „8700kJ recommended daily intake‟(32%) and to „monitor your own daily intake‟ (23%), and with an increased number ofmentions to „eat more healthy‟.Figure 3.33: Prompted campaign message takeout (Online W1-W3)52
3.5.6 Prompted impressions of the campaign<strong>Fast</strong> <strong>Choices</strong>Online participants were prompted for their impressions of the campaign via a variety ofagreement statements.Reassuringly, the vast majority, in both cohorts, saw the campaign as „informative‟,„necessary‟, „believable‟ and „relevant to them‟ – over three-quarters agreeing to each ofthese statements.Results remained relatively consistent across Waves, although amongst GeneralPopulation Online Participants there was a significant increase in those describing thecampaign as „very‟ necessary as opposed to only „somewhat‟ necessary from Wave 2 toWave 3.Figure 3.34: Prompted impressions of the campaign (Online W1-W3)53
3.5.7 Reported impact of the campaign<strong>Fast</strong> <strong>Choices</strong>Finally, when prompted about the impact of the campaign, participants were most likelyto agree that it had provided them with new information on kilojoule values. Thiswas followed by mentions that it had motivated them to use kJ values displayed at thepoint of sale and that it influenced their food choices. Fewer participants agreed that itwould influence their level of physical activity.Order of agreement was consistent across General Population Online Participants and 18to 24 year old Online Participants although younger participants were slightly more likelyto agree that the campaign had influenced them.Figure 3.35: Reported impact of the campaign (Online W1-W3)Online Y5. Here are some things other people have said about this campaign. How strongly do you agree or disagree with them?Base: (All participants), W2 Gen pop n=528; W3 Gen pop n=531, W2 18-24 yr olds n=213; W3 18-24 yr olds n=20654
APPENDIX - METHODOLOGY<strong>Fast</strong> <strong>Choices</strong>In order to more fully address the research objectives a multi-method approach wastaken with a qualitative phase prior to the pre-intervention and post intervention wavesof the quantitative research. The resultant findings from the qualitative phase feddirectly into the construction of both the online and intercept questionnaire. The surveydesign enables the collection and identification of benchmark measures related toconsumer awareness, understanding, use and behaviour and two subsequent waves oftracking of key measures and indicators to assess the influence and outcome of thelegislation changes. Waves 1 and 2 are now complete, and Wave 3 is scheduled forSeptember 2012.A1. Developmental qualitative phaseThe qualitative phase was exploratory in nature and principally designed to inform anddevelop the intercept and online survey questionnaires.A1.1 Sampling and recruitmentTwelve in-depth interviews were conducted with consumers who had eaten food sourcedfrom a fast or snack food outlet at least twice in the previous month. Recruitment wasundertaken to achieve interviews with a broad spread of participants, on the basis ofsocioeconomic status, age and location, as indicated in the following table:Table 4: Qualitative Sample DistributionLocation vs. Age bracket18-25 yrs 26-45 yrs 46+ yrs TotalSydney Inner 1 x low income1 x highincome 1 x high income 4 depths1 x mid incomeSydney Outer 1 x mid income 1 x low income1 x mid income1 x low income4 depthsNewcastle1 depthCessnock 1 x high1 depthMaitland income; 1x high income 1 x mid income 1 depthLake 1 x low incomeMacquarie1 depthTotal 4 depths 4 depths 4 depths 12 DepthsOther key quotas were placed on the twelve interviews to ensure there wasrepresentation from a diverse spread of the <strong>NSW</strong> population, including:• Gender (6 male, 6 female),• Body Mass Index Scores (4 „Healthy‟ Weight, 4 „Overweight‟, 4 „Obese‟),• Living arrangements (a mix of those living alone & living with others), and55
<strong>Fast</strong> <strong>Choices</strong>• Cultural background (a mix with a maximum of 10 who describe themselves asAnglo-Celtic).Recruitment of participants was conducted by a professionally accredited recruitmentagency and undertaken principally by telephone. To aid this process, TNS researchersprovided a verbal and written briefing, including recruitment specifications and screeningquestions.A1.2 FieldworkInterviews were conducted face-to-face by TNS researchers at suitable venues forparticipants (typically at home / work or another neutral location). Each interview lastedapproximately one hour, with researchers using an interview guide developed inconjunction with the <strong>NSW</strong> <strong>Food</strong> <strong>Authority</strong> to help frame and direct the discussion. Theareas of enquiry included:• Consumers‟ understanding of energy and kilojoules,• Consumers‟ understanding of other nutritional content,• Consumers‟ understanding of average daily requirements of energy and kilojoules,• Consumers‟ attitudes, beliefs and diet motivation regarding energy and kilojoules,fats and salts,• Consumers‟ attitudes towards the consumption of fast food and different types offast food,• The „path to purchase‟ i.e. the decision making process made by consumers before,during and after fast food purchase and consumption,• Attitudes to menu labelling at fast food outlets, and• The perceived impact of energy labelling on fast food choices.Participants were provided with $80 upon completion of the interview in gratitude fortheir time and input.56
A2. Quantitative intercept survey<strong>Fast</strong> <strong>Choices</strong>The primary objective of the intercept survey was to obtain a baseline measure on thequantity of kilojoules, salt and fat consumed by patrons of standard food outlets. Shorterin length than the online survey, the design of the intercept questionnaire thereforefocused on recording the standard food items which patrons had bought for themselvesduring their visit to the outlet. Follow up questions concerned fast food / drink purchasebehaviour, awareness and understanding of nutritional labelling at the outlet, and theimpact of this on purchase decisions. Fundamentally, the intercept survey employed atargeted and specific approach, the frame of reference for participants being theirexperiences in one particular outlet at one particular point in time.A2.1 Sampling approach1) Outlet sampling pointsThe intercept methodology employed a purposive, stratified cluster sampling approach,operating within the confines of study design and budget parameters. Essentially, thiswas developed to minimise bias or skewing of data as a result of demographic andsituational factors, such as the socio-economic status of localities, locations(metro/rural), fast food / drink chains, and outlet types. In total, fourteen outlets weresampled which provided a diverse spread of sampling points in relation to demographicand situational factors. These are shown in the following table:Table 5: Outlet sampling pointsSample point Outlet Type Location<strong>NSW</strong> LGA Socioeconomicstatus1 Burger 1 Metro (Inner Sydney) 1 st or 2 nd SES quintile2 Burger 2Regional(Hunter region)1 st or 2 nd SES quintile3 Burger 3 Metro (Inner Sydney) 1 st or 2 nd SES quintile4 Burger 4 Metro (Outer Sydney) 4 th or 5 th SES quintile5 Chicken 1 Metro (Outer Sydney) 4 th or 5 th SES quintile6 Chicken 2 Metro (Outer Sydney) 4 th or 5 th SES quintile7 Chicken 3Regional(Hunter region)3 rd SES quintile8 Chicken 4 Metro (Inner Sydney) 1 st or 2 nd SES quintile9 Ice Cream 1Regional(Hunter region)1 st or 2 nd SES quintile10 Ice Cream 2 Metro (Outer Sydney) 3 rd SES quintile11 Pizza 1 Metro (Inner Sydney) 4 th or 5 th SES quintile12 Sandwich 1 Metro (Outer Sydney) 4 th or 5 th SES quintile13 Beverage 1 Metro (Inner Sydney) 1 st or 2 nd SES quintile14 Beverage 2 Metro (Outer Sydney) 3 rd SES quintile57
<strong>Fast</strong> <strong>Choices</strong>In summary, this sampling approach included the following distribution (along withaccompanying rationale for this distribution):Sample factorOutlet type:4 x burger4 x chicken2 x ice cream1 x pizza1 x sandwich2 x beverageChain:2 x McDonald‟s2 x Hungry Jack‟s1 x KFC1 x Red Rooster1 x Nandos1 x Oporto2 x Wendy‟s1 x Dominos1 x Subway2 x Gloria Jean‟sLocation5 x Inner metro6 x Outer metro3 x Regional <strong>NSW</strong>Socio-economicstatus6 x 1 st or 2 nd quintile3 x 3 rd quintile5 x 4 th or 5 th quintileRationaleA greater emphasis was placed on „burger‟ or „chicken‟ outlets toreflect the concentration of fast food consumption in these outlettypes. It was also anticipated that energy purchase measurementwould be straightforward in such outlets due to the highproportion of standard food items sold. Fewer „pizza‟ and„sandwich‟ outlets were selected in part due to the higherproportion of non-standard food items available to customersmaking measurement more complex. Furthermore, most pizzapurchases were considered to be made online and therefore anintercept survey of this market would require greater resources.Resources therefore were better targeted towards those wherefoods are ordered at the outlet. „Ice Cream‟ and „Beverage‟outlets have been sampled to ensure coverage of thesesignificant markets.A spread of fast food businesses were included in the survey withthe principle fast food chains included where possible. McDonald‟sand Hungry Jack‟s represent the „burger‟ outlets due to their highmarket share. Four different „chicken‟ brands were included torepresent the broader share of chains in this market. The „pizza‟market was represented by Dominos, the largest pizza chain inAustralia. Subway represented the „sandwich‟ market due to itbeing the largest speciality sandwich chain in Australia. The „icecream‟ market was represented by the popular ice cream chain,Wendy‟s. Gloria Jean‟s represented the „beverage‟ outlets, beingAustralia's largest specialty coffee retailer.A good spread of metro and regional outlets in <strong>NSW</strong> wasensured. This encompassed both Inner Sydney LGAs (SydneyCity (2), Marrickville, Randwick & Canterbury), Outer SydneyLGAs (Fairfield, Blacktown, Auburn, Campbelltown. Bankstown &Parramatta) and Regional <strong>NSW</strong> suburbs (Lake Macquarie (2) &Maitland)The <strong>NSW</strong> LGA socio-economic status index (developed by the<strong>NSW</strong> Health Department) has been used to ensure that outletsselected were located in LGAs with a range of socio-economicprofiles.While the sampling approach outlined for outlet selection was carefully designed toencompass a range of demographic and situational profiles in <strong>NSW</strong>, it should be notedthat this does not necessarily provide a truly representative picture of outlets andpopulation profiles in the state. However, more important to the validity of results fromthe intercept survey is the conduct of research at the same sampling points in58
<strong>Fast</strong> <strong>Choices</strong>subsequent Waves of research, so that results can be compared across Waves withoutbeing influenced by a different sampling scheme.2) Participant sampling approachParticipants were recruited to take part in an interview after they had finished their mealand / or made their purchase and were leaving the outlet. Sampling within each outletwas undertaken using a randomised „eyes up‟ approach utilised by interviewers on-site.This involved interviewers being required to look down, look up and approach whoever isdirectly in their line of sight. This ensures that no bias is introduced by interviewers (e.g.only approaching potential participants whom they feel will be more likely to participate).Given the purposive nature of the sample approach to the intercept survey, no quotaswere imposed on participant type, with data collected representing that of a randomsample of customers at each site. The only limitations were that participants were to beaged over 16 years of age, and that only one person per family or peer group wasinterviewed.A2.2 Survey design and fieldworkThe survey questionnaire was developed with input from the qualitative phase and incollaboration with the <strong>NSW</strong> <strong>Food</strong> <strong>Authority</strong>. This comprised a number of questions andresponse codes related to the intermediate evaluation outcomes, structured around thefollowing themes:• Products purchased and consumed on site at this visit,• Influences on purchase decision,• Awareness, readership, and impact of nutritional information at outlet,• Salience of considering nutritional content when making purchase decisions,• Understanding and estimation of kilojoules consumed, and• Demographic information.The approved questionnaire was administered via pen and paper at each outlet by atrained and experienced interviewer from National Field Services (NFS). Interviewersreceived a briefing and instruction prior to commencing fieldwork from TNS researchersand fieldwork managers at NFS, who were also available during the fieldwork period toaddress any problems or concerns. The questionnaire was also subject to a small periodof cognitive and pilot testing, prior to the commencement of the main fieldwork stage.For Wave 1, fieldwork was conducted between 7 September and 9 October 2011 with atotal of n=815 participants.For Wave 2, fieldwork was conducted between 20 April and 18 May 2012 with a total ofn=807 participants.For Wave 3, fieldwork was conducted between 27 August and 23 September 2012 with atotal of n=805 participants.59
For all three Waves, the survey took an average of 7 minutes to complete.<strong>Fast</strong> <strong>Choices</strong>A2.3 Data processing and analysisCompleted questionnaires were processed at NFS, with data validation checks made onthe paper questionnaires before data from these were entered. Further quality and logicchecks were made on at least 10% of surveys entered.A significant component of processing was dedicated to coding of food items purchasedand consumed to derive kilojoule (and other nutritional item) content. Items consumedthat were recorded during the interview were cross-referenced to data provided by the<strong>NSW</strong> <strong>Food</strong> <strong>Authority</strong> listing standard menu items at each outlet and their nutritionalcontent. While not all items were able to be coded, due to absent information on thenutritional content of these, the majority of participants (approximately 80%) wereassigned with total figures for kilojoules, sodium, sugar and fat consumed at their visit tothe outlet. It should be noted that participants for whom these measures could not bederived are excluded from any calculations of average intake made in this report.Following this process, data tabulations and raw data in SPSS were produced, validated,and amended where necessary. The data tabulations included a series of analysisbreaks, and included significance testing (at the 95% confidence level).60
A3. Quantitative online survey: general population<strong>Fast</strong> <strong>Choices</strong>An online survey was developed to obtain key baseline measures on fast food and drinkpurchase behaviour, awareness and understanding of nutritional information and theirinfluence on purchase decisions, and feedback about the initiative and likely impact onfuture food choices. Essentially, this research component was used to provide overall„population measures‟ of consumer awareness and understanding, without the specificityof a particular experience at a particular point in time as measured in the correspondingintercept survey.A3.1 Sampling approachThe sample frame was sourced through the MyOpinions database, one of Australia‟slargest panels of research participants. Importantly, panelists are restricted from thenumber of surveys they can complete and sampling of the panel is conducted in acontrolled manner to ensure participants are representative of the population required.For this survey, <strong>NSW</strong> residents were sampled and an initial screening element of thesurvey questionnaire was conducted to ensure they were in scope. This included therequirement that they had purchased from at least one of the standard food outlets(shown in a list presented to participants) in the last month. Participants were alsoscreened from the survey if they were younger than 16 years or did not reside in <strong>NSW</strong>.Minimum quotas were also set on gender, age, and location (metro / regional), to ensurea representative spread of participants.A3.2 Survey design and fieldworkA hard copy questionnaire was developed on the back of the qualitative phase and incollaboration with the <strong>NSW</strong> <strong>Food</strong> <strong>Authority</strong>. This comprised a number of questions andresponse codes related to the intermediate evaluation outcomes, structured around thefollowing themes:• General purchase and consumption practices and behaviours,• Awareness, use, understanding and impact of (any) nutritional information atoutlets,• Use and influence of menu in food purchase decisions,• Confidence in understanding of nutritional information,• Awareness and understanding of kilojoules and other nutrition indicators,• Reaction to proposed menu changes and perceived future impact on behaviour,and• Demographic information.• (Waves 2 and 3 only) Prompted recall of consumer communications campaignelementsThe approved questionnaire was programmed for the online format and tested by TNSresearchers prior to fieldwork commencing. Initially a small pilot test (n=50) was61
<strong>Fast</strong> <strong>Choices</strong>completed to ensure accurate functionality and logic of the online questionnaire, prior tofull launch.For Wave 1, fieldwork was completed between 7 September and 9 October 2011 with atotal of n=506 participants. The survey took an average of 15 minutes to complete.For Wave 2, fieldwork was completed between 20 April and 18 May 2012 and comprised528 <strong>NSW</strong> residents. The survey took an average of 22 minutes to complete (due toincorporation of communications pre- and post testing component).For Wave 3, fieldwork was completed between 15 October 2012 and 22 October 2012and comprised 531 <strong>NSW</strong> residents. The survey took an average of 22 minutes tocomplete.A3.3 Data processing and analysisIn order to provide a basis for comparison in future Waves of the survey, the data wasweighted to be representative of the <strong>NSW</strong> population aged 16 or older, using ABSpopulation counts for age, gender and location (metro / regional). The weighting schemeis shown in the following table:Table 6: Weighting structureTarget %WeightLocationGender<strong>NSW</strong> Metro 63 1.000<strong>NSW</strong> Regional 37 1.000Male 50 1.163Female 50 0.87716-25 years old 17 1.214Age26-45 years old 36 1.12546 years old and above 47 0.855The same weighting scheme was applied to Waves 1, 2 and 3 of the survey, essentiallyproviding an identical sample population in terms of demographic and location fromwhich to measure trends and change. Validation was undertaken on unweighted andweighted data, with negligible impact observed on data as a result of weighting.Open ended verbatim comments from the survey were reviewed and grouped intothemes or codes, providing a numerical estimation of the type of comments provided byparticipants. Other logic checks, such as missing data and correct skips and filters, werealso made prior to further data processing. Following this, data tabulations and raw datain SPSS were produced, validated, and amended where necessary. The data tabulationsincluded a series of analysis breaks, and included significance testing (at the 95%confidence level) between subgroups (e.g. males and females).62
A4. Quantitative online survey: 18-24 year olds<strong>Fast</strong> <strong>Choices</strong>In late 2011, the <strong>NSW</strong> <strong>Food</strong> <strong>Authority</strong> secured further funding to support theimplementation of the <strong>Fast</strong> <strong>Choices</strong> legislation through a communications campaigntargeting <strong>NSW</strong> consumers. The aim of the campaign is to raise awareness of energy andkilojoules among consumers and further allow them to better understand their personalkilojoule requirements.The stated objectives of the campaign are as follows:• To build awareness that menu displays show energy in terms of kilojoules• To build awareness of the average adult daily intake of 8,700 kilojoules• To build awareness of individual kilojoule requirements to maintain a balance ofenergy and activity, maintain a healthy weight, and how the requirements can varydepending on age, activity and other factors• To provide access to more information using website, mobile site, mobile app,Facebook page and app. This will include information about how many kilojoulesconsumers require each day and to support balanced choicesAdditional research was therefore required to measure the effectiveness of the consumercampaign, and, baseline measures needed to be established for the target audience ofyoung people aged 18-24 years.A4.1 Sampling approachAs for the general population survey, the sample frame was sourced through theMyOpinions database. For this survey, Greater Sydney residents were sampled and aninitial screening element of the survey questionnaire was conducted to ensure they werein scope. This included the requirement that they had purchased from at least one of thestandard food outlets (shown in a list presented to participants) in the last month.Participants were also screened from the survey if they were under 18 or over 24 yearsor did no longer reside in Greater Sydney. No quotas were set.A4.2 Survey design and fieldworkA hard copy questionnaire was developed in collaboration with the <strong>NSW</strong> <strong>Food</strong> <strong>Authority</strong>.This was based on the existing general population survey, and expanded to incorporatespecific pre- and post measures relating to the campaign. This included spontaneous andprompted awareness of campaign elements, as well as reported impact on attitudes andfuture behaviour.The approved questionnaire was programmed for the online format and tested by TNSresearchers prior to fieldwork commencing. Initially a small pilot test (n=20) wascompleted to ensure accurate functionality and logic of the online questionnaire, prior tofull launch.63
<strong>Fast</strong> <strong>Choices</strong>For Wave 1, fieldwork was undertaken from 20 to 29 February 2012, one weekimmediately prior to launch of the campaign, and with a total of n=217 participants. Thesurvey took an average of 15 minutes to completeFor Wave 2, fieldwork was completed between 20 April and 18 May 2012, shortly aftercampaign launch, and comprised n=213 participants. The survey took an average of 18minutes to complete (due to incorporation of a communications pre- testing component).For Wave 3, fieldwork was completed between 16 October 2012 and 25 October 2012,shortly after campaign launch, and comprised n=206 participants. The survey took anaverage of 22 minutes to complete (due to incorporation of a communications posttesting component).A4.3 Data processing and analysisThe data was weighted, but only on gender. The same weighting scheme was applied toWaves 1, 2 and 3 of the survey to maximise comparability.Open ended verbatim comments from the survey were reviewed and grouped intothemes or codes, providing a numerical estimation of the type of comments provided byparticipants. Other logic checks, such as missing data and correct skips and filters, werealso made prior to further data processing. Following this, data tabulations and raw datain SPSS were produced, validated, and amended where necessary. The data tabulationsincluded a series of analysis breaks, and included significance testing (at the 95%confidence level) between subgroups (e.g. males and females).64