Trends in Duck Breeding Populations, 1955--2012 - U.S. Fish and ...
Trends in Duck Breeding Populations, 1955--2012 - U.S. Fish and ...
Trends in Duck Breeding Populations, 1955--2012 - U.S. Fish and ...
- No tags were found...

Create successful ePaper yourself
Turn your PDF publications into a flip-book with our unique Google optimized e-Paper software.
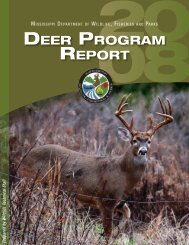
U.S. <strong>Fish</strong> & Wildlife Service<strong>Trends</strong> <strong>in</strong> <strong>Duck</strong>Breed<strong>in</strong>g <strong>Populations</strong><strong>1955</strong>–<strong>2012</strong>June 29, <strong>2012</strong>
<strong>Trends</strong> <strong>in</strong> <strong>Duck</strong> Breed<strong>in</strong>g <strong>Populations</strong>, <strong>1955</strong>–<strong>2012</strong>Nathan L. Zimpfer, Walter E. Rhodes, Emily D. Silverman,Guthrie S. Zimmerman, <strong>and</strong> Ken D. RichkusU.S. <strong>Fish</strong> & Wildlife ServiceDivision of Migratory Bird Management11510 American Holly Dr.Laurel, MD 20708Adm<strong>in</strong>istrative Report—June 29, <strong>2012</strong>This report summarizes <strong>in</strong>formation about the status of duck populations <strong>and</strong> wetl<strong>and</strong> habitatsdur<strong>in</strong>g spr<strong>in</strong>g <strong>2012</strong>, focus<strong>in</strong>g on areas encompassed by the U.S. <strong>Fish</strong> & Wildlife (USFWS) <strong>and</strong>Canadian Wildlife Services’ (CWS) Waterfowl Breed<strong>in</strong>g Population <strong>and</strong> Habitat Survey. We donot <strong>in</strong>clude <strong>in</strong>formation from surveys conducted by state or prov<strong>in</strong>cial agencies. In the traditionalsurvey area, which <strong>in</strong>cludes strata 1–18, 20–50, <strong>and</strong> 75–77 (Figure 1), the total duck populationestimate (exclud<strong>in</strong>g scoters [Melanitta spp.], eiders [Somateria spp. <strong>and</strong> Polysticta stelleri], longtailedducks [Clangula hyemalis], mergansers [Mergus spp. <strong>and</strong> Lophodytes cucullatus], <strong>and</strong> woodducks [Aix sponsa]) was 48.6 ± 0.8 [SE] million birds (Figure 3, Appendix A). This represents a7% <strong>in</strong>crease over last year’s estimate of 45.6 ± 0.8 million, <strong>and</strong> is 43% higher than the long-termaverage a (<strong>1955</strong>–2011; Table 1). Estimated mallard (Anas platyrhynchos) abundance was 10.6 ± 0.3million, which was 15% above the 2011 estimate of 9.2 ± 0.3 million, <strong>and</strong> 40% above the long-termaverage of 7.6 ± 0.04 million (Table 2). Estimated abundance of gadwall (A. strepera; 3.6 ± 0.2million) was similar to the 2011 estimate <strong>and</strong> 96% above the long-term average (1.8 ± 0.02 million;Table 3). The estimate for American wigeon (A. americana; 2.1 ± 0.1 million) was similar to the2011 estimate <strong>and</strong> 17% below the long-term average of 2.6 ± 0.02 million (Table 4). The estimatedabundance of green-w<strong>in</strong>ged teal (A. crecca) was 3.5 ± 0.2 million, which was 20% above the 2011estimate <strong>and</strong> 74% above the long-term average (2.0 ± 0.02 million; Table 5). The estimates ofblue-w<strong>in</strong>ged teal (A. discors; 9.2 ± 0.4 million) <strong>and</strong> northern shoveler (A. clypeata; 5.0 ± 0.3million) were similar to their 2011 estimates <strong>and</strong> 94% <strong>and</strong> 111% above the long-term averages of4.8 ± 0.04 million (Table 6) <strong>and</strong> 2.4 ± 0.02 million (Table 7), respectively. The estimate fornorthern p<strong>in</strong>tails (A. acuta; 3.5 ± 0.2 million) was 22% below the 2011 estimate of 4.4 ± 0.3million <strong>and</strong> 14% below the long-term average of 4.0 ± 0.04 million (Table 8). The estimatedabundance for redheads (Aythya americana; 1.3 ± 0.1 million) <strong>and</strong> canvasbacks (Aythya valis<strong>in</strong>eria;0.8 ± 0.07 million) were similar to their 2011 estimates <strong>and</strong> were 89% <strong>and</strong> 33% above their longtermaverages of 0.7 ± 0.01 million (Table 9) <strong>and</strong> 0.6 ± 0.01 million (Table 10), respectively.Estimated abundance of scaup (A. aff<strong>in</strong>is <strong>and</strong> A. marila comb<strong>in</strong>ed; 5.2 ± 0.3 million) was 21%above the 2011 estimate <strong>and</strong> similar to the long-term average of 5.0 ± 0.05 million (Table 11).Habitat conditions dur<strong>in</strong>g the <strong>2012</strong> Waterfowl Breed<strong>in</strong>g Population <strong>and</strong> Habitat Survey werecharacterized by average to below-average moisture, a mild w<strong>in</strong>ter, <strong>and</strong> an early spr<strong>in</strong>g across thea <strong>Populations</strong> are considered to have changed from the previous year or long-term average if the observed significancevalue associated with change is ≤ 0.10. Actual P-values are presented <strong>in</strong> tables.2
southern portion of the traditional <strong>and</strong> eastern survey areas. Northern habitats of the traditional<strong>and</strong> eastern surveys areas generally received average moisture <strong>and</strong> temperatures. The total pondestimate (Prairie Canada <strong>and</strong> U.S. comb<strong>in</strong>ed) was 5.5 ± 0.2 million (Table 12, Figure 2). Thiswas 32% below the 2011 estimate of 8.1 ± 0.2 million ponds, <strong>and</strong> 9% above the long-term averageof 5.1 ± 0.03 million ponds.Conditions across the Canadian prairies decl<strong>in</strong>ed relative to 2011 (Figure 4). Residual moisturefrom prior years benefitted more permanent wetl<strong>and</strong>s of the coteau <strong>in</strong> Saskatchewan <strong>and</strong> near theSaskatchewan <strong>and</strong> Manitoba border, but temporary wetl<strong>and</strong>s reta<strong>in</strong>ed little moisture ow<strong>in</strong>g to ashallow frost seal <strong>and</strong> below-average precipitation. The <strong>2012</strong> estimate of ponds <strong>in</strong> Prairie Canadawas 3.9 ± 0.1 million. This was 21% below last year’s estimate (4.9 ± 0.2 million) <strong>and</strong> 13% abovethe 1961–2011 average (3.4 ± 0.03 million). Much of the parkl<strong>and</strong> was classified as good; however,habitat conditions decl<strong>in</strong>ed westward toward Alberta. Follow<strong>in</strong>g the completion of the survey, theCanadian prairies received above-average precipitation, which may improve habitat conditions forlate-nest<strong>in</strong>g waterfowl, re-nest<strong>in</strong>g attempts <strong>and</strong> brood rear<strong>in</strong>g.Significant decl<strong>in</strong>es <strong>in</strong> wetl<strong>and</strong> numbers <strong>and</strong> conditions occurred <strong>in</strong> the U.S. prairies dur<strong>in</strong>g<strong>2012</strong>. The <strong>2012</strong> pond estimate for the north-central U.S. was 1.7 ± 0.1 million, which was 49%below last year’s estimate (3.2 ± 0.1 million) <strong>and</strong> similar to the 1974–2011 average. Nearly all ofthe north-central U.S. was rated as good to excellent <strong>in</strong> 2011; however, only the coteau of North <strong>and</strong>South Dakota was rated as good <strong>in</strong> <strong>2012</strong>, <strong>and</strong> no areas were rated as excellent this year. Drasticwetl<strong>and</strong> decl<strong>in</strong>es <strong>in</strong> western South Dakota <strong>and</strong> Montana resulted <strong>in</strong> mostly poor to fair habitatconditions.In the bush regions of the traditional survey area (Alaska, Yukon, Northwest Territories, northernAlberta, northern Manitoba, northern Saskatchewan, <strong>and</strong> western Ontario), spr<strong>in</strong>g breakup wasslightly early <strong>in</strong> <strong>2012</strong>. Average to above-average annual precipitation over much of the bush <strong>and</strong>ice-free habitats benefitted arriv<strong>in</strong>g waterfowl. Drier conditions were observed <strong>in</strong> northern Alberta<strong>and</strong> Saskatchewan <strong>and</strong> habitat was classified as fair. A similar trend was noted <strong>in</strong> western Ontariowhere habitat conditions decl<strong>in</strong>ed from excellent <strong>in</strong> 2011 to good <strong>in</strong> <strong>2012</strong>.Most of the eastern survey area had mild w<strong>in</strong>ter temperatures with below-average precipitation,although northern survey areas <strong>in</strong> Labrador, Newfoundl<strong>and</strong> <strong>and</strong> eastern Quebec experienced morenormal conditions, with some areas receiv<strong>in</strong>g heavy snowfall. While habitat quality decl<strong>in</strong>ed overallrelative to 2011, good conditions persisted over the majority of the eastern survey area. Exceptionswere northwestern Quebec, northern Ma<strong>in</strong>e, <strong>and</strong> New Brunswick, where, despite an early spr<strong>in</strong>g,<strong>in</strong>adequate precipitation caused wetl<strong>and</strong> conditions to deteriorate.In 2005, the USFWS <strong>and</strong> CWS began to <strong>in</strong>tegrate data from two previously <strong>in</strong>dependent waterfowlsurveys conducted <strong>in</strong> eastern North America <strong>in</strong>to a s<strong>in</strong>gle composite estimate us<strong>in</strong>g hierarchicalmodels. Consequently, total <strong>in</strong>dicated bird def<strong>in</strong>itions for American black ducks (Anas rubripes)were modified to provide a common <strong>in</strong>dex across surveys, <strong>and</strong> adjustments were made to the geographicstratification of the eastern survey area. Additional ref<strong>in</strong>ements to analytical methodsare <strong>in</strong>corporated <strong>in</strong> the estimates presented <strong>in</strong> this report. For these reasons, population estimatespresented <strong>in</strong> this report for the eastern survey area (strata 51–72; Table 13) are not directly comparablewith estimates presented <strong>in</strong> reports issued prior to 2006. Specifically, estimates are presentedfor only a portion of the eastern survey area <strong>and</strong> <strong>in</strong>clude data from strata 51, 52, 63, 64, 66–68,<strong>and</strong> 70–72. These 10 strata were chosen for presentation because at least one survey (i.e., eitherthe CWS or USFWS survey) was conducted for each of these strata for the full period of record ofthe eastern survey (1990–<strong>2012</strong>). In cases where the USFWS has traditionally not recorded observationsto the species level, composite estimates are provided only for multiple-species group<strong>in</strong>gs(i.e., mergansers <strong>and</strong> goldeneyes [Bucephala clangula <strong>and</strong> B. isl<strong>and</strong>ica]). The CWS <strong>and</strong> USFWSagreed to use a hierarchical model<strong>in</strong>g approach for all species <strong>in</strong> the east. Currently, the modelsperform well for the six most common species. In previous years, we used design-based estimates3
<strong>and</strong> an overall mean across the two surveys, weighted by their precision, to derive <strong>in</strong>tegrated annualpopulation <strong>in</strong>dices for the less common American wigeon, scaup, bufflehead, <strong>and</strong> scoters until thehierarchical models could adequately analyze the data for these species. These estimates have beendiscont<strong>in</strong>ued because of concerns about (1) the appropriateness of weight<strong>in</strong>g estimates from thesesurveys by precision, <strong>and</strong> (2) whether estimates for some species should be <strong>in</strong>tegrated given thedata quality <strong>and</strong> coverage <strong>in</strong> the eastern survey. Nonetheless, the USFWS will cont<strong>in</strong>ue to exploremethods for deriv<strong>in</strong>g <strong>in</strong>tegrated estimates for some of the less common species <strong>in</strong> the eastern surveyarea. Analytical methods applied to eastern survey area data <strong>and</strong> results will be presented <strong>in</strong>greater detail <strong>in</strong> the <strong>2012</strong> Waterfowl Status Report.Estimated abundance of American black ducks <strong>in</strong> the eastern survey area was 0.6 ± 0.04 million,which was 11% higher than the 2011 estimate <strong>and</strong> similar to the long-term average. The <strong>2012</strong> estimatefor mallards was 0.4 ± 0.1 million, which was similar to the 2011 estimate <strong>and</strong> long-termaverage. Abundance estimates for goldeneyes, green-w<strong>in</strong>ged teal, r<strong>in</strong>g-necked ducks, <strong>and</strong> merganserswere similar to last year’s estimates <strong>and</strong> their 1990–2011 averages (Table 13, Figure 6,Appendix B).4
The data <strong>in</strong> this report were contributed by the follow<strong>in</strong>g <strong>in</strong>dividuals:Alaska, Yukon Territory, <strong>and</strong> Old Crow Flats (Strata 1–12)Air E. Mallek <strong>and</strong> D. GrovesNorthern Alberta, Northeastern British Columbia, <strong>and</strong> Northwest Territories (Strata13–18, 20, <strong>and</strong> 77)Air W. Rhodes <strong>and</strong> C. SpiegelNorthern Saskatchewan <strong>and</strong> Northern Manitoba (Strata 21–23, 24, 25)Air K. Fox <strong>and</strong> M. Rabe bAir stratum 24 R. Spangler <strong>and</strong> J. BredyAir stratum 25 R. Spangler <strong>and</strong> D. Benn<strong>in</strong>g eSouthern <strong>and</strong> Central Alberta (Strata 26–29, 75, <strong>and</strong> 76)Air J. Bredy <strong>and</strong> J. HitchcockGroundG. Raven a , M. Watmough a , R. Wiacek a , J. Caswell b , M. Gillespie c , K. Jones a , <strong>and</strong>L. Smith aSouthern Saskatchewan (Strata 30–33)Air P. Thorpe <strong>and</strong> S. YatesGroundJ.-M. DeV<strong>in</strong>k a , K. Dufour a , K. Warner a , P. Bergen c , S. Leach a , B. Tether a , <strong>and</strong>S. Heap aSouthern Manitoba (Strata 34-40)Air R. Spangler <strong>and</strong> D. Benn<strong>in</strong>g eGround M. Schuster a , J. Asmundson a , G. Ball c , J. Leafloor a , J. Ingram a , K. Renwick a ,R. Buss c , <strong>and</strong> D. Walker cMontana <strong>and</strong> Western Dakotas (Strata 41–44)Air S. Bayless <strong>and</strong> J. KlimstraGroundA. Mohler <strong>and</strong> G. SuleimanEastern Dakotas (Strata 45–49)Air T. Liddick <strong>and</strong> D. FronczakGroundK. Kruse, S. Olson, V. Morgan, <strong>and</strong> J. DowlerWestern Ontario <strong>and</strong> Central Quebec (Strata 50, 55, 69–70)Air J. Wortham <strong>and</strong> G. BoomerEastern Ontario <strong>and</strong> Southern Quebec (Strata 51-54, 56, 68)Air S. Earsom <strong>and</strong> B. BergMa<strong>in</strong>e <strong>and</strong> Maritimes (Strata 62–67)Air M. Koneff <strong>and</strong> H. Obrecht e 5
Canadian Wildlife Service helicopter plot surveyQuebecD. Bordage a , C. Lepage a , C. Marcotte a , <strong>and</strong> S. Orichefsky aOntarioNew Brunswick &Nova ScotiaLabrador &Newfoundl<strong>and</strong>S. Meyer a , C. Sharp a , S. Badz<strong>in</strong>ski a , <strong>and</strong> A. Harasym dR. Hicks a <strong>and</strong> B. Pollard aS. Gillil<strong>and</strong> a , P. Ryan a , <strong>and</strong> R. Wells aa Canadian Wildlife Serviceb State, Prov<strong>in</strong>cial or Tribal Conservation Agencyc <strong>Duck</strong>s Unlimited Canadad Other Organizatione U.S. <strong>Fish</strong> & Wildlife Service RetiredAll others—U.S. <strong>Fish</strong> & Wildlife Service6
7Figure 1: Strata <strong>and</strong> transects of the Waterfowl Breed<strong>in</strong>g Population <strong>and</strong> Habitat Survey (yellow = traditional survey area, green = easternsurvey area).
Table 1: Total duck a breed<strong>in</strong>g population estimates (<strong>in</strong> thous<strong>and</strong>s) for regions <strong>in</strong> the traditionalsurvey area.Change from 2011Change from LTARegion <strong>2012</strong> 2011 % P LTA b % PAlaska–YukonTerritory–Old Crow Flats 4,455 3,756 +19 0.004 3,689 +21
Table 3: Gadwall breed<strong>in</strong>g population estimates (<strong>in</strong> thous<strong>and</strong>s) for regions <strong>in</strong> the traditional surveyarea.Change from 2011Change from LTARegion <strong>2012</strong> 2011 % P LTA a % PAlaska–YukonTerritory–Old Crow Flats 1 1 -53 0.633 2 -68 0.041C. & N. Alberta–N.E. BritishColumbia–NWT 56 41 +37 0.313 51 +10 0.667N. Saskatchewan–N. Manitoba–W. Ontario 31 33 -6 0.829 26 +17 0.489S. Alberta 378 347 +9 0.649 316 +20 0.245S. Saskatchewan 1,144 1,020 +12 0.385 612 +87
Table 5: Green-w<strong>in</strong>ged teal breed<strong>in</strong>g population estimates (<strong>in</strong> thous<strong>and</strong>s) for regions <strong>in</strong> the traditionalsurvey area.Change from 2011Change from LTARegion <strong>2012</strong> 2011 % P LTA a % PAlaska–YukonTerritory–Old Crow Flats 705 641 +10 0.484 399 +77
Table 7: Northern shoveler breed<strong>in</strong>g population estimates (<strong>in</strong> thous<strong>and</strong>s) for regions <strong>in</strong> the traditionalsurvey area.Change from 2011Change from LTARegion <strong>2012</strong> 2011 % P LTA a % PAlaska–YukonTerritory–Old Crow Flats 377 322 +17 0.325 289 +30 0.049C. & N. Alberta–N.E. BritishColumbia–NWT 275 133 +107 0.065 219 +26 0.433N. Saskatchewan–N. Manitoba–W. Ontario 11 7 +61 0.457 40 -72
Table 9: Redhead breed<strong>in</strong>g population estimates (<strong>in</strong> thous<strong>and</strong>s) for regions <strong>in</strong> the traditionalsurvey area.Change from 2011Change from LTARegion <strong>2012</strong> 2011 % P LTA % PAlaska–YukonTerritory–Old Crow Flats 0 1 -100 0.339 2 -100
Table 11: Scaup (greater <strong>and</strong> lesser comb<strong>in</strong>ed) breed<strong>in</strong>g population estimates (<strong>in</strong> thous<strong>and</strong>s) forregions <strong>in</strong> the traditional survey area.Change from 2011Change from LTARegion <strong>2012</strong> 2011 % P LTA a % PAlaska–YukonTerritory–Old Crow Flats 849 847 +0 0.987 920 -8 0.423C. & N. Alberta–N.E. BritishColumbia–NWT 2,839 2,165 +31 0.049 2,531 +12 0.236N. Saskatchewan–N. Manitoba–W. Ontario 338 367 -8 0.666 565 -40
Table 12: Estimated number (<strong>in</strong> thous<strong>and</strong>s) of May ponds <strong>in</strong> portions of Prairie <strong>and</strong> Parkl<strong>and</strong>Canada <strong>and</strong> the north-central U.S.Change from 2011Change from LTARegion <strong>2012</strong> 2011 % P LTA a % PPrairie & Parkl<strong>and</strong> CanadaS. Alberta 807 1,086 -26 0.007 745 +8 0.215S. Saskatchewan 2,678 3,151 -15 0.029 2,033 +32
Table 13: <strong>Duck</strong> breed<strong>in</strong>g population estimates a (<strong>in</strong> thous<strong>and</strong>s) for 6 most abundant species <strong>in</strong> theeastern survey area.% Change from % Change fromSpecies <strong>2012</strong> 2011 2011 Average b averageMallard 395 410 -4 385 +3American black duck 603 544 +11 c 622 -3Green-w<strong>in</strong>ged teal 259 256 +1 257 +1R<strong>in</strong>g-necked duck 488 492 -1 496 -2Goldeneyes (common <strong>and</strong> Barrow’s) 394 401 -2 418 -6Mergansers (common, redbreasted,<strong>and</strong> hooded)421 400 +5 437 -4a Estimates from Bayesian hierarchical analysis us<strong>in</strong>g USFWS <strong>and</strong> CWS data from strata 51, 52, 63, 64, 66–68,70–72.b Average for 1990–2011.c Indicates significant change. Significance determ<strong>in</strong>ed by non-overlap of Bayesian credibility <strong>in</strong>tervals with zero.15
Total ducksMallardMillions25 30 35 40 45 50Millions4 6 8 10 12<strong>1955</strong> 1965 1975 1985 1995 2005YearGadwall<strong>1955</strong> 1965 1975 1985 1995 2005YearAmerican wigeonMillions0 1 2 3 4 5Millions0 1 2 3 4 5<strong>1955</strong> 1965 1975 1985 1995 2005YearGreen−w<strong>in</strong>ged teal<strong>1955</strong> 1965 1975 1985 1995 2005YearBlue−w<strong>in</strong>ged tealMillions0 1 2 3 4Millions0 2 4 6 8 10<strong>1955</strong> 1965 1975 1985 1995 2005Year<strong>1955</strong> 1965 1975 1985 1995 2005YearFigure 3: Breed<strong>in</strong>g population estimates, 95% confidence <strong>in</strong>tervals, <strong>and</strong> North American WaterfowlManagement Plan population goal (dashed l<strong>in</strong>e) for selected species <strong>in</strong> the traditional survey area(strata 1–18, 20–50, 75–77).16
Northern shovelerNorthern p<strong>in</strong>tailMillions0 1 2 3 4 5 6Millions0 2 4 6 8 10 12<strong>1955</strong> 1965 1975 1985 1995 2005<strong>1955</strong> 1965 1975 1985 1995 2005YearYearRedheadCanvasbackMillions0.0 0.5 1.0 1.5 2.0Millions0.0 0.5 1.0 1.5<strong>1955</strong> 1965 1975 1985 1995 2005<strong>1955</strong> 1965 1975 1985 1995 2005YearYearScaupMillions0 2 4 6 8 10<strong>1955</strong> 1965 1975 1985 1995 2005YearFigure 3: Cont<strong>in</strong>ued.17
18Figure 4: Breed<strong>in</strong>g waterfowl habitat conditions dur<strong>in</strong>g the <strong>2012</strong> Waterfowl Breed<strong>in</strong>g Population <strong>and</strong> Habitat Survey, as judged by U.S. <strong>Fish</strong><strong>and</strong> Wildlife Service Flyway Biologists.
19Figure 5: Breed<strong>in</strong>g waterfowl habitat conditions dur<strong>in</strong>g the 2011 Waterfowl Breed<strong>in</strong>g Population <strong>and</strong> Habitat Survey, as judged by U.S. <strong>Fish</strong><strong>and</strong> Wildlife Service Flyway Biologists.
MallardAmerican black duckThous<strong>and</strong>s100 200 300 400 500 600 700Thous<strong>and</strong>s200 400 600 8001990 1995 2000 2005 2010YearGreen−w<strong>in</strong>ged teal1990 1995 2000 2005 2010YearR<strong>in</strong>g−necked duckThous<strong>and</strong>s100 150 200 250 300 350 400Thous<strong>and</strong>s200 400 600 8001990 1995 2000 2005 2010YearGoldeneyes1990 1995 2000 2005 2010YearMergansersThous<strong>and</strong>s200 400 600 800Thous<strong>and</strong>s100 200 300 400 500 600 7001990 1995 2000 2005 20101990 1995 2000 2005 2010YearFigure 6: Breed<strong>in</strong>g population estimates <strong>and</strong> 90% credibility <strong>in</strong>tervals for selected species <strong>in</strong> theeastern survey area (strata 51, 52, 63, 64, 66–68, 70–72).Year20
Appendix A: Breed<strong>in</strong>g population estimates <strong>and</strong> st<strong>and</strong>ard errors (<strong>in</strong> thous<strong>and</strong>s) for 10species of ducks from the traditional survey area (strata 1–18, 20–50, 75–77).Mallard Gadwall American wigeon Green-w<strong>in</strong>ged teal Blue-w<strong>in</strong>ged tealYear̂N ŜE ̂N ŜE ̂N ŜE ̂N ŜE ̂N ŜE<strong>1955</strong> 8,777.3 457.1 651.5 149.5 3,216.8 297.8 1,807.2 291.5 5,305.2 567.61956 10,452.7 461.8 772.6 142.4 3,145.0 227.8 1,525.3 236.2 4,997.6 527.61957 9,296.9 443.5 666.8 148.2 2,919.8 291.5 1,102.9 161.2 4,299.5 467.31958 11,234.2 555.6 502.0 89.6 2,551.7 177.9 1,347.4 212.2 5,456.6 483.71959 9,024.3 466.6 590.0 72.7 3,787.7 339.2 2,653.4 459.3 5,099.3 332.71960 7,371.7 354.1 784.1 68.4 2,987.6 407.0 1,426.9 311.0 4,293.0 294.31961 7,330.0 510.5 654.8 77.5 3,048.3 319.9 1,729.3 251.5 3,655.3 298.71962 5,535.9 426.9 905.1 87.0 1,958.7 145.4 722.9 117.6 3,011.1 209.81963 6,748.8 326.8 1,055.3 89.5 1,830.8 169.9 1,242.3 226.9 3,723.6 323.01964 6,063.9 385.3 873.4 73.7 2,589.6 259.7 1,561.3 244.7 4,020.6 320.41965 5,131.7 274.8 1,260.3 114.8 2,301.1 189.4 1,282.0 151.0 3,594.5 270.41966 6,731.9 311.4 1,680.4 132.4 2,318.4 139.2 1,617.3 173.6 3,733.2 233.61967 7,509.5 338.2 1,384.6 97.8 2,325.5 136.2 1,593.7 165.7 4,491.5 305.71968 7,089.2 340.8 1,949.0 213.9 2,298.6 156.1 1,430.9 146.6 3,462.5 389.11969 7,531.6 280.2 1,573.4 100.2 2,941.4 168.6 1,491.0 103.5 4,138.6 239.51970 9,985.9 617.2 1,608.1 123.5 3,469.9 318.5 2,182.5 137.7 4,861.8 372.31971 9,416.4 459.5 1,605.6 123.0 3,272.9 186.2 1,889.3 132.9 4,610.2 322.81972 9,265.5 363.9 1,622.9 120.1 3,200.1 194.1 1,948.2 185.8 4,278.5 230.51973 8,079.2 377.5 1,245.6 90.3 2,877.9 197.4 1,949.2 131.9 3,332.5 220.31974 6,880.2 351.8 1,592.4 128.2 2,672.0 159.3 1,864.5 131.2 4,976.2 394.61975 7,726.9 344.1 1,643.9 109.0 2,778.3 192.0 1,664.8 148.1 5,885.4 337.41976 7,933.6 337.4 1,244.8 85.7 2,505.2 152.7 1,547.5 134.0 4,744.7 294.51977 7,397.1 381.8 1,299.0 126.4 2,575.1 185.9 1,285.8 87.9 4,462.8 328.41978 7,425.0 307.0 1,558.0 92.2 3,282.4 208.0 2,174.2 219.1 4,498.6 293.31979 7,883.4 327.0 1,757.9 121.0 3,106.5 198.2 2,071.7 198.5 4,875.9 297.61980 7,706.5 307.2 1,392.9 98.8 3,595.5 213.2 2,049.9 140.7 4,895.1 295.61981 6,409.7 308.4 1,395.4 120.0 2,946.0 173.0 1,910.5 141.7 3,720.6 242.11982 6,408.5 302.2 1,633.8 126.2 2,458.7 167.3 1,535.7 140.2 3,657.6 203.71983 6,456.0 286.9 1,519.2 144.3 2,636.2 181.4 1,875.0 148.0 3,366.5 197.21984 5,415.3 258.4 1,515.0 125.0 3,002.2 174.2 1,408.2 91.5 3,979.3 267.61985 4,960.9 234.7 1,303.0 98.2 2,050.7 143.7 1,475.4 100.3 3,502.4 246.31986 6,124.2 241.6 1,547.1 107.5 1,736.5 109.9 1,674.9 136.1 4,478.8 237.11987 5,789.8 217.9 1,305.6 97.1 2,012.5 134.3 2,006.2 180.4 3,528.7 220.21988 6,369.3 310.3 1,349.9 121.1 2,211.1 139.1 2,060.8 188.3 4,011.1 290.41989 5,645.4 244.1 1,414.6 106.6 1,972.9 106.0 1,841.7 166.4 3,125.3 229.821
Appendix A: Cont<strong>in</strong>ued.Mallard Gadwall American wigeon Green-w<strong>in</strong>ged teal Blue-w<strong>in</strong>ged tealYear̂N ŜE ̂N ŜE ̂N ŜE ̂N ŜE ̂N ŜE1990 5,452.4 238.6 1,672.1 135.8 1,860.1 108.3 1,789.5 172.7 2,776.4 178.71991 5,444.6 205.6 1,583.7 111.8 2,254.0 139.5 1,557.8 111.3 3,763.7 270.81992 5,976.1 241.0 2,032.8 143.4 2,208.4 131.9 1,773.1 123.7 4,333.1 263.21993 5,708.3 208.9 1,755.2 107.9 2,053.0 109.3 1,694.5 112.7 3,192.9 205.61994 6,980.1 282.8 2,318.3 145.2 2,382.2 130.3 2,108.4 152.2 4,616.2 259.21995 8,269.4 287.5 2,835.7 187.5 2,614.5 136.3 2,300.6 140.3 5,140.0 253.31996 7,941.3 262.9 2,984.0 152.5 2,271.7 125.4 2,499.5 153.4 6,407.4 353.91997 9,939.7 308.5 3,897.2 264.9 3,117.6 161.6 2,506.6 142.5 6,124.3 330.71998 9,640.4 301.6 3,742.2 205.6 2,857.7 145.3 2,087.3 138.9 6,398.8 332.31999 10,805.7 344.5 3,235.5 163.8 2,920.1 185.5 2,631.0 174.6 7,149.5 364.52000 9,470.2 290.2 3,158.4 200.7 2,733.1 138.8 3,193.5 200.1 7,431.4 425.02001 7,904.0 226.9 2,679.2 136.1 2,493.5 149.6 2,508.7 156.4 5,757.0 288.82002 7,503.7 246.5 2,235.4 135.4 2,334.4 137.9 2,333.5 143.8 4,206.5 227.92003 7,949.7 267.3 2,549.0 169.9 2,551.4 156.9 2,678.5 199.7 5,518.2 312.72004 7,425.3 282.0 2,589.6 165.6 1,981.3 114.9 2,460.8 145.2 4,073.0 238.02005 6,755.3 280.8 2,179.1 131.0 2,225.1 139.2 2,156.9 125.8 4,585.5 236.32006 7,276.5 223.7 2,824.7 174.2 2,171.2 115.7 2,587.2 155.3 5,859.6 303.52007 8,307.3 285.8 3,355.9 206.2 2,806.8 152.0 2,890.3 196.1 6,707.6 362.22008 7,723.8 256.8 2,727.7 158.9 2,486.6 151.3 2,979.7 194.4 6,640.1 337.32009 8,512.4 248.3 3,053.5 166.3 2,468.6 135.4 3,443.6 219.9 7,383.8 396.82010 8,430.1 284.9 2,976.7 161.6 2,424.6 131.5 3,475.9 207.2 6,328.5 382.62011 9,182.6 267.8 3,256.9 196.9 2,084.0 110.1 2,900.1 170.7 8,948.5 418.2<strong>2012</strong> 10,601.5 324.0 3,585.6 208.7 2,145.0 145.6 3,471.2 207.9 9,242.3 425.122
Appendix A: Cont<strong>in</strong>ued.Northern shoveler Northern p<strong>in</strong>tail Redhead Canvasback ScaupYear̂N ŜE ̂N ŜE ̂N ŜE ̂N ŜE ̂N ŜE<strong>1955</strong> 1,642.8 218.7 9,775.1 656.1 539.9 98.9 589.3 87.8 5,620.1 582.11956 1,781.4 196.4 10,372.8 694.4 757.3 119.3 698.5 93.3 5,994.1 434.01957 1,476.1 181.8 6,606.9 493.4 509.1 95.7 626.1 94.7 5,766.9 411.71958 1,383.8 185.1 6,037.9 447.9 457.1 66.2 746.8 96.1 5,350.4 355.11959 1,577.6 301.1 5,872.7 371.6 498.8 55.5 488.7 50.6 7,037.6 492.31960 1,824.5 130.1 5,722.2 323.2 497.8 67.0 605.7 82.4 4,868.6 362.51961 1,383.0 166.5 4,218.2 496.2 323.3 38.8 435.3 65.7 5,380.0 442.21962 1,269.0 113.9 3,623.5 243.1 507.5 60.0 360.2 43.8 5,286.1 426.41963 1,398.4 143.8 3,846.0 255.6 413.4 61.9 506.2 74.9 5,438.4 357.91964 1,718.3 240.3 3,291.2 239.4 528.1 67.3 643.6 126.9 5,131.8 386.11965 1,423.7 114.1 3,591.9 221.9 599.3 77.7 522.1 52.8 4,640.0 411.21966 2,147.0 163.9 4,811.9 265.6 713.1 77.6 663.1 78.0 4,439.2 356.21967 2,314.7 154.6 5,277.7 341.9 735.7 79.0 502.6 45.4 4,927.7 456.11968 1,684.5 176.8 3,489.4 244.6 499.4 53.6 563.7 101.3 4,412.7 351.81969 2,156.8 117.2 5,903.9 296.2 633.2 53.6 503.5 53.7 5,139.8 378.51970 2,230.4 117.4 6,392.0 396.7 622.3 64.3 580.1 90.4 5,662.5 391.41971 2,011.4 122.7 5,847.2 368.1 534.4 57.0 450.7 55.2 5,143.3 333.81972 2,466.5 182.8 6,979.0 364.5 550.9 49.4 425.9 46.0 7,997.0 718.01973 1,619.0 112.2 4,356.2 267.0 500.8 57.7 620.5 89.1 6,257.4 523.11974 2,011.3 129.9 6,598.2 345.8 626.3 70.8 512.8 56.8 5,780.5 409.81975 1,980.8 106.7 5,900.4 267.3 831.9 93.5 595.1 56.1 6,460.0 486.01976 1,748.1 106.9 5,475.6 299.2 665.9 66.3 614.4 70.1 5,818.7 348.71977 1,451.8 82.1 3,926.1 246.8 634.0 79.9 664.0 74.9 6,260.2 362.81978 1,975.3 115.6 5,108.2 267.8 724.6 62.2 373.2 41.5 5,984.4 403.01979 2,406.5 135.6 5,376.1 274.4 697.5 63.8 582.0 59.8 7,657.9 548.61980 1,908.2 119.9 4,508.1 228.6 728.4 116.7 734.6 83.8 6,381.7 421.21981 2,333.6 177.4 3,479.5 260.5 594.9 62.0 620.8 59.1 5,990.9 414.21982 2,147.6 121.7 3,708.8 226.6 616.9 74.2 513.3 50.9 5,532.0 380.91983 1,875.7 105.3 3,510.6 178.1 711.9 83.3 526.6 58.9 7,173.8 494.91984 1,618.2 91.9 2,964.8 166.8 671.3 72.0 530.1 60.1 7,024.3 484.71985 1,702.1 125.7 2,515.5 143.0 578.2 67.1 375.9 42.9 5,098.0 333.11986 2,128.2 112.0 2,739.7 152.1 559.6 60.5 438.3 41.5 5,235.3 355.51987 1,950.2 118.4 2,628.3 159.4 502.4 54.9 450.1 77.9 4,862.7 303.81988 1,680.9 210.4 2,005.5 164.0 441.9 66.2 435.0 40.2 4,671.4 309.51989 1,538.3 95.9 2,111.9 181.3 510.7 58.5 477.4 48.4 4,342.1 291.31990 1,759.3 118.6 2,256.6 183.3 480.9 48.2 539.3 60.3 4,293.1 264.923
Appendix A: Cont<strong>in</strong>ued.Northern shoveler Northern p<strong>in</strong>tail Redhead Canvasback ScaupYear̂N ŜE ̂N ŜE ̂N ŜE ̂N ŜE ̂N ŜE1991 1,716.2 104.6 1,803.4 131.3 445.6 42.1 491.2 66.4 5,254.9 364.91992 1,954.4 132.1 2,098.1 161.0 595.6 69.7 481.5 97.3 4,639.2 291.91993 2,046.5 114.3 2,053.4 124.2 485.4 53.1 472.1 67.6 4,080.1 249.41994 2,912.0 141.4 2,972.3 188.0 653.5 66.7 525.6 71.1 4,529.0 253.61995 2,854.9 150.3 2,757.9 177.6 888.5 90.6 770.6 92.2 4,446.4 277.61996 3,449.0 165.7 2,735.9 147.5 834.2 83.1 848.5 118.3 4,217.4 234.51997 4,120.4 194.0 3,558.0 194.2 918.3 77.2 688.8 57.2 4,112.3 224.21998 3,183.2 156.5 2,520.6 136.8 1,005.1 122.9 685.9 63.8 3,471.9 191.21999 3,889.5 202.1 3,057.9 230.5 973.4 69.5 716.0 79.1 4,411.7 227.92000 3,520.7 197.9 2,907.6 170.5 926.3 78.1 706.8 81.0 4,026.3 205.32001 3,313.5 166.8 3,296.0 266.6 712.0 70.2 579.8 52.7 3,694.0 214.92002 2,318.2 125.6 1,789.7 125.2 564.8 69.0 486.6 43.8 3,524.1 210.32003 3,619.6 221.4 2,558.2 174.8 636.8 56.6 557.6 48.0 3,734.4 225.52004 2,810.4 163.9 2,184.6 155.2 605.3 51.5 617.2 64.6 3,807.2 202.32005 3,591.5 178.6 2,560.5 146.8 592.3 51.7 520.6 52.9 3,386.9 196.42006 3,680.2 236.5 3,386.4 198.7 916.3 86.1 691.0 69.6 3,246.7 166.92007 4,552.8 247.5 3,335.3 160.4 1,009.0 84.7 864.9 86.2 3,452.2 195.32008 3,507.8 168.4 2,612.8 143.0 1,056.0 120.4 488.7 45.4 3,738.3 220.12009 4,376.3 224.1 3,225.0 166.9 1,044.1 106.3 662.1 57.4 4,172.1 232.32010 4,057.4 198.4 3,508.6 216.4 1,064.2 99.5 585.2 50.8 4,244.4 247.92011 4,641.0 232.8 4,428.6 267.9 1,356.1 128.3 691.6 46.0 4,319.3 261.1<strong>2012</strong> 5,017.6 254.2 3,473.1 192.4 1,269.9 99.2 759.9 68.5 5,238.6 296.824
Appendix B: Breed<strong>in</strong>g population estimates <strong>and</strong> 90% confidence <strong>in</strong>tervals or credibility <strong>in</strong>tervals (<strong>in</strong> thous<strong>and</strong>s) for the 6 mostabundant species of ducks <strong>in</strong> the eastern survey area, 1990–<strong>2012</strong> a .Mallard American black duck Green-w<strong>in</strong>ged teal R<strong>in</strong>g-necked duck Goldeneyes b Mergansers cYear ˆN 90% CI ˆN 90% CI ˆN 90% CI ˆN 90% CI ˆN 90% CI ˆN 90% CI1990 312.5 (207.6, 507.3) 597.0 (532.7, 674.2) 249.3 (195.7, 323.6) 496.9 (395.9, 638.6) 368.0 (289.6, 482.8) 380.5 (320.6, 456.6)1991 359.1 (238.4, 575.9) 600.1 (530.0, 687.3) 242.0 (189.2, 317.8) 443.4 (356.2, 565.8) 386.1 (303.3, 507.8) 455.9 (382.7, 552.3)1992 356.9 (235.2, 577.2) 568.7 (504.7, 646.5) 230.4 (178.8, 303.1) 455.2 (363.6, 585.3) 399.3 (312.3, 524.9) 453.1 (374.1, 561.9)1993 362.5 (240.1, 583.0) 551.2 (484.8, 630.2) 210.5 (161.4, 278.5) 425.3 (337.5, 550.1) 385.8 (302.2, 510.4) 431.3 (356.5, 530.9)1994 376.9 (246.8, 608.9) 509.8 (449.7, 581.6) 220.2 (170.1, 293.1) 422.2 (335.2, 544.4) 397.4 (309.3, 523.9) 430.1 (350.0, 549.7)1995 309.9 (203.1, 504.4) 591.4 (522.0, 675.1) 225.4 (173.7, 299.0) 435.7 (345.9, 559.3) 346.8 (269.8, 458.8) 465.3 (382.8, 577.2)1996 339.1 (223.6, 549.2) 715.5 (639.6, 807.8) 296.3 (235.1, 385.4) 555.3 (444.9, 712.7) 420.6 (328.1, 552.5) 418.6 (353.8, 500.9)1997 361.7 (238.8, 588.1) 596.8 (535.6, 669.0) 232.0 (182.3, 300.8) 491.5 (393.4, 626.3) 422.3 (331.0, 555.1) 427.9 (361.5, 513.1)1998 403.4 (266.9, 642.9) 632.5 (568.9, 707.4) 220.6 (174.1, 284.6) 429.5 (344.9, 550.0) 371.0 (290.8, 488.3) 348.6 (295.0, 416.3)1999 409.9 (273.1, 653.0) 719.8 (646.7, 806.3) 256.7 (201.6, 335.0) 511.8 (411.2, 653.9) 457.0 (353.2, 608.5) 412.4 (347.9, 496.0)2000 365.5 (246.7, 585.4) 652.5 (588.8, 726.8) 277.2 (222.0, 353.4) 533.1 (427.7, 681.3) 438.5 (341.0, 579.4) 424.3 (360.4, 504.9)2001 397.6 (268.4, 633.4) 612.5 (551.2, 684.7) 233.8 (185.1, 300.7) 486.6 (392.7, 619.5) 506.7 (392.3, 674.8) 402.9 (342.5, 480.3)2002 391.1 (264.6, 618.4) 710.3 (639.0, 794.9) 279.4 (220.9, 364.6) 490.5 (391.9, 634.3) 569.4 (428.5, 784.3) 557.6 (469.4, 669.0)2003 407.0 (271.1, 648.9) 649.0 (581.9, 727.6) 270.7 (213.8, 352.4) 500.3 (403.2, 637.5) 430.4 (336.5, 565.8) 475.9 (401.5, 572.5)2004 429.0 (288.3, 681.9) 642.4 (577.3, 722.5) 311.9 (245.6, 409.4) 539.6 (436.8, 688.8) 422.1 (333.9, 549.9) 505.5 (428.6, 603.0)2005 416.6 (277.4, 668.5) 617.8 (553.0, 696.3) 248.0 (196.3, 320.7) 507.1 (411.1, 642.2) 387.0 (306.1, 505.4) 471.2 (398.0, 566.7)2006 386.8 (260.3, 614.0) 636.0 (570.1, 714.2) 251.7 (198.6, 326.5) 517.3 (417.4, 654.7) 386.1 (304.6, 503.0) 427.1 (362.0, 509.4)2007 428.8 (288.1, 683.4) 744.3 (665.0, 842.0) 280.5 (221.9, 361.3) 636.8 (511.0, 815.9) 459.6 (358.8, 606.6) 457.2 (385.1, 549.3)2008 423.5 (284.9, 671.7) 642.2 (575.8, 721.6) 298.4 (228.3, 411.2) 514.9 (416.0, 654.1) 433.8 (339.4, 568.5) 435.9 (370.1, 519.2)2009 447.7 (301.5, 708.4) 594.9 (534.2, 667.9) 289.4 (226.3, 384.0) 516.0 (414.9, 658.4) 404.1 (315.9, 530.3) 458.7 (388.1, 550.1)2010 367.4 (247.2, 585.2) 564.6 (505.3, 633.8) 273.4 (217.4, 354.4) 516.9 (416.6, 656.6) 398.1 (311.2, 523.4) 377.2 (319.0, 450.8)2011 410.1 (273.8, 657.8) 544.2 (488.8, 609.6) 255.5 (201.5, 332.3) 491.7 (396.2, 623.7) 401.3 (315.9, 526.8) 399.9 (338.1, 480.0)<strong>2012</strong> 395.4 (266.2, 630.1) 603.1 (539.4, 677.2) 259.3 (205.7, 333.6) 487.8 (393.3, 621.8) 394.0 (310.2, 513.8) 420.9 (357.2, 502.7)a Estimates from Bayesian hierarchical analysis us<strong>in</strong>g FWS <strong>and</strong> CWS data from strata 51, 52, 63, 64, 66–68, 70–72.b Common <strong>and</strong> Barrow’s, comb<strong>in</strong>ed.c Common, red-breasted, <strong>and</strong> hooded, comb<strong>in</strong>ed.25
Division of Migratory Bird Management11510 American Holly Dr.Laurel, MD 20708-4016U.S. <strong>Fish</strong> & Wildlife Servicehttp://www.fws.govFor state transfer relay serviceTTY/Voice: 711