PERIOD ENDED DECEMBER 31, 2005 Annual ... - Peabody Energy
PERIOD ENDED DECEMBER 31, 2005 Annual ... - Peabody Energy
PERIOD ENDED DECEMBER 31, 2005 Annual ... - Peabody Energy
- No tags were found...

Create successful ePaper yourself
Turn your PDF publications into a flip-book with our unique Google optimized e-Paper software.
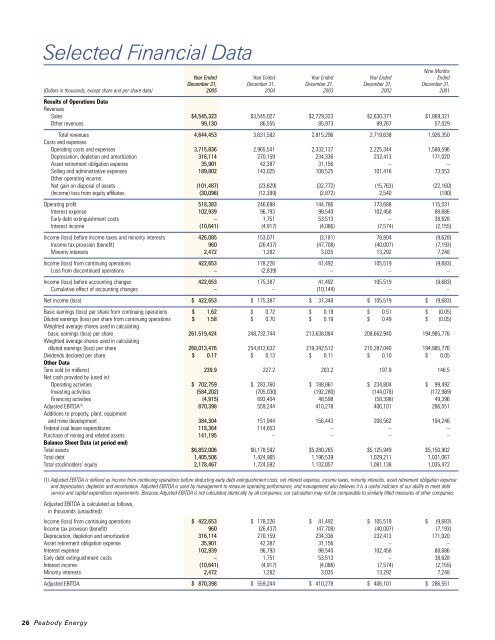
Selected Financial DataNine MonthsYear Ended Year Ended Year Ended Year Ended EndedDecember <strong>31</strong>, December <strong>31</strong>, December <strong>31</strong>, December <strong>31</strong>, December <strong>31</strong>,(Dollars in thousands, except share and per share data) <strong>2005</strong> 2004 2003 2002 2001Results of Operations DataRevenuesSales $4,545,323 $3,545,027 $2,729,323 $2,630,371 $1,869,321Other revenues 99,130 86,555 85,973 89,267 57,029Total revenues 4,644,453 3,6<strong>31</strong>,582 2,815,296 2,719,638 1,926,350Costs and expensesOperating costs and expenses 3,715,836 2,965,541 2,332,137 2,225,344 1,588,596Depreciation, depletion and amortization <strong>31</strong>6,114 270,159 234,336 232,413 171,020Asset retirement obligation expense 35,901 42,387 <strong>31</strong>,156 – –Selling and administrative expenses 189,802 143,025 108,525 101,416 73,553Other operating income:Net gain on disposal of assets (101,487) (23,829) (32,772) (15,763) (22,160)(Income) loss from equity affiliates (30,096) (12,399) (2,872) 2,540 (190)Operating profit 518,383 246,698 144,786 173,688 115,5<strong>31</strong>Interest expense 102,939 96,793 98,540 102,458 88,686Early debt extinguishment costs – 1,751 53,513 – 38,628Interest income (10,641) (4,917) (4,086) (7,574) (2,155)Income (loss) before income taxes and minority interests 426,085 153,071 (3,181) 78,804 (9,628)Income tax provision (benefit) 960 (26,437) (47,708) (40,007) (7,193)Minority interests 2,472 1,282 3,035 13,292 7,248Income (loss) from continuing operations 422,653 178,226 41,492 105,519 (9,683)Loss from discontinued operations – (2,839) – – –Income (loss) before accounting changes 422,653 175,387 41,492 105,519 (9,683)Cumulative effect of accounting changes – – (10,144) – –Net income (loss) $ 422,653 $ 175,387 $ <strong>31</strong>,348 $ 105,519 $ (9,683)Basic earnings (loss) per share from continuing operations $ 1.62 $ 0.72 $ 0.19 $ 0.51 $ (0.05)Diluted earnings (loss) per share from continuing operations $ 1.58 $ 0.70 $ 0.19 $ 0.49 $ (0.05)Weighted average shares used in calculatingbasic earnings (loss) per share 261,519,424 248,732,744 213,638,084 208,662,940 194,985,776Weighted average shares used in calculatingdiluted earnings (loss) per share 268,013,476 254,812,632 219,342,512 215,287,040 194,985,776Dividends declared per share $ 0.17 $ 0.13 $ 0.11 $ 0.10 $ 0.05Other DataTons sold (in millions) 239.9 227.2 203.2 197.9 146.5Net cash provided by (used in):Operating activities $ 702,759 $ 283,760 $ 188,861 $ 234,804 $ 99,492Investing activities (584,202) (705,030) (192,280) (144,078) (172,989)Financing activities (4,915) 693,404 48,598 (58,398) 49,396Adjusted EBITDA (1) 870,398 559,244 410,278 406,101 286,551Additions to property, plant, equipmentand mine development 384,304 151,944 156,443 208,562 194,246Federal coal lease expenditures 118,364 114,653 – – –Purchase of mining and related assets 141,195 – – – –Balance Sheet Data (at period end)Total assets $6,852,006 $6,178,592 $5,280,265 $5,125,949 $5,150,902Total debt 1,405,506 1,424,965 1,196,539 1,029,211 1,0<strong>31</strong>,067Total stockholders’ equity 2,178,467 1,724,592 1,132,057 1,081,138 1,035,472(1) Adjusted EBITDA is defined as income from continuing operations before deducting early debt extinguishment costs, net interest expense, income taxes, minority interests, asset retirement obligation expenseand depreciation, depletion and amortization. Adjusted EBITDA is used by management to measure operating performance, and management also believes it is a useful indicator of our ability to meet debtservice and capital expenditure requirements. Because Adjusted EBITDA is not calculated identically by all companies, our calculation may not be comparable to similarly titled measures of other companies.Adjusted EBITDA is calculated as follows,in thousands (unaudited):Income (loss) from continuing operations $ 422,653 $ 178,226 $ 41,492 $ 105,519 $ (9,683)Income tax provision (benefit) 960 (26,437) (47,708) (40,007) (7,193)Depreciation, depletion and amortization <strong>31</strong>6,114 270,159 234,336 232,413 171,020Asset retirement obligation expense 35,901 42,387 <strong>31</strong>,156 – –Interest expense 102,939 96,793 98,540 102,458 88,686Early debt extinguishment costs – 1,751 53,513 – 38,628Interest income (10,641) (4,917) (4,086) (7,574) (2,155)Minority interests 2,472 1,282 3,035 13,292 7,248Adjusted EBITDA $ 870,398 $ 559,244 $ 410,278 $ 406,101 $ 286,55126 <strong>Peabody</strong> <strong>Energy</strong>
MANAGEMENT’S DISCUSSION AND ANALYSIS OFFinancial Condition and Results of OperationsOVERVIEWWe are the largest private-sector coal company in the world, with majority interestsin 34 active coal operations located throughout all major U.S. coal producing regions andinternationally in Australia. In <strong>2005</strong>, we sold 239.9 million tons of coal that accounted foran estimated 21.5% of all U.S. coal sales, and were more than 69% greater than the sales ofour closest domestic competitor and 49% more than our closest international competitor.Based on <strong>Energy</strong> Information Administration (“EIA”) estimates, demand for coal in the UnitedStates was more than 1.1 billion tons in <strong>2005</strong>. Domestic consumption of coal is expected togrow at a rate of 1.7% per year through 2030 when U.S. coal demand is forecasted to be1.8 billion tons. The EIA expects demand for coal use at coal-to-liquids (“CTL”) plants to growto 190 million tons by 2030. Coal-fueled generation is used in most cases to meet baseloadelectricity requirements, and coal use generally grows at the approximate rate of electricitygrowth, which is expected to average 1.6% annually through 2025. Coal production fromwest of the Mississippi River is projected to provide most of the incremental growth asWestern production increases to a 63% share of total production in 2030. In 2004, coal’sshare of electricity generation was approximately 51%, a share that the EIA projects will growto 57% by 2030.Our primary customers are U.S. utilities, which accounted for 87% of our sales in <strong>2005</strong>.We typically sell coal to utility customers under long-term contracts (those with terms longerthan one year). During <strong>2005</strong>, approximately 90% of our sales were under long-term contracts.As of December <strong>31</strong>, <strong>2005</strong>, our unpriced volumes for 2006 were 15 to 25 million tons onexpected production of 230 to 240 million tons and total sales of 255 to 265 million tons.Our results of operations in the near term could be negatively impacted by poor weatherconditions, unforeseen geologic conditions or equipment problems at mining locations,and by the availability of transportation for coal shipments. On a long-term basis, ourresults of operations could be impacted by our ability to secure or acquire high-quality coalreserves, find replacement buyers for coal under contracts with comparable terms to existingcontracts, or the passage of new or expanded regulations that could limit our ability to mine,increase our mining costs, or limit our customers’ ability to utilize coal as fuel for electricitygeneration. In the past, we have achieved production levels that are relatively consistent withour projections.We conduct business through four principal operating segments: Eastern U.S. Mining,Western U.S. Mining, Australian Mining, and Trading and Brokerage. Our Eastern U.S. Miningoperations consist of our Appalachia and Midwest operations, and our Western U.S. Miningoperations consist of our Powder River Basin, Southwest and Colorado operations. Theprincipal business of the Western U.S. Mining segment is the mining, preparation and saleof steam coal, sold primarily to electric utilities. The principal business of the Eastern U.S.Mining segment is the mining, preparation and sale of steam coal, sold primarily to electricutilities, as well as the mining of some metallurgical coal, sold to steel and coke producers.Geologically, Eastern operations mine bituminous and Western operations minebituminous and subbituminous coal deposits. Our Western U.S. Mining operations arecharacterized by predominantly surface extraction processes, lower sulfur content and Btuof coal, and higher customer transportation costs (due to longer shipping distances). OurEastern U.S. Mining operations are characterized by predominantly underground extractionprocesses, higher sulfur content and Btu of coal, and lower customer transportation costs(due to shorter shipping distances).Our Australian Mining operations consist of our North Goonyella underground mineand our Wilkie Creek, Burton and Eaglefield surface mines. Eaglefield is a surface operationadjacent to, and fulfilling contract tonnages in conjunction with, the North Goonyellaunderground mine. In the first quarter of 2006, we will begin production at the 0.6 million tonper year Baralaba Mine, of which we own a 62.5% interest. The Baralaba Mine will producePCI, a substitute for metallurgical coal, and steam coal. Australian Mining operations areRevenues27
28 <strong>Peabody</strong> <strong>Energy</strong>characterized by both surface and underground extraction processes, mining low-sulfur, highBtu coal sold to an international customer base. Primarily, metallurgical coal is produced fromour Australian mines. Metallurgical coal is approximately 5% of our total sales volume andapproximately 2% of U.S. sales volume.We own a 25.5% interest in Carbones del Guasare, which owns and operates the PasoDiablo Mine in Venezuela. The Paso Diablo Mine produces approximately 6 to 8 million tonsof steam coal annually for export to the United States and Europe.In addition to our mining operations, which comprised 85% of revenues in <strong>2005</strong>, wealso generate revenues from brokering and trading coal (15% of revenues), and by creatingvalue from our vast natural resource position by selling non-core land holdings and mineralinterests to generate additional cash flows as well as other ventures described below.We continue to pursue the development of coal-fueled generating projects in areas ofthe United States where electricity demand is strong and where there is access to land, water,transmission lines and low-cost coal. The projects involve mine-mouth generating plantsusing our surface lands and coal reserves. Our ultimate role in these projects could takenumerous forms, including, but not limited to equity partner, contract miner or coal lessor.The projects we are currently pursuing are as follows: the 1,500-megawatt Prairie State<strong>Energy</strong> Campus in Washington County, Illinois; the 1,500-megawatt Thoroughbred <strong>Energy</strong>Campus in Muhlenberg County, Kentucky; and the 300-megawatt Mustang <strong>Energy</strong> Projectnear Grants, New Mexico. The plants, assuming all necessary permits and financing areobtained and following selection of partners and sale of a majority of the output of each plant,could be operational following a four-year construction phase. The first of these plants wouldnot be operational earlier than mid-2010.In February <strong>2005</strong>, a group of Midwest rural electric cooperatives and municipal jointaction agencies entered into definitive agreements to acquire 47% of the Prairie State <strong>Energy</strong>Campus project. After an initial appeal, the Illinois Environmental Protection Agency reissuedthe air permit on April 28, <strong>2005</strong>. The same parties who filed the earlier permit challenge fileda new appeal on June 8, <strong>2005</strong>. We believe the permit was appropriately issued and expectto prevail in the appeal process. Various other required permits are in process and may alsobe subject to challenge. If successfully completed, the Prairie State <strong>Energy</strong> Campus projectwould utilize approximately six million tons of coal each year.During <strong>2005</strong>, we engaged in several Btu Conversion projects which are designed toexpand the uses of coal through various technologies. We are a founding member ofthe FutureGen Industrial Alliance, a non-profit company that is partnering with the U.S.Department of <strong>Energy</strong> to facilitate the design, construction and operation of the world’sfirst zero-emission coal-fueled power plant. FutureGen will demonstrate advanced coalbasedtechnologies to generate electricity and also produce hydrogen to power fuel cellsfor transportation and other energy needs. The technology also will integrate the capture ofcarbon emissions with carbon sequestration, helping to address the issue of climate changeas energy demand continues to grow worldwide. We also entered into an agreement toacquire a 30% interest in Econo-Power International Corporation (“EPIC TM ”), which owns andmarkets modular coal gasifiers for industrial applications. The EPIC Clean Coal GasificationSystem TM uses air-blown gasifiers to convert coal into a synthetic gas that is ideal forindustrial applications. In late <strong>2005</strong>, we entered into a memorandum of understanding withArcLight Capital Partners, LLC to advance project development of a commercial-scale coalgasification project in Illinois that would transform coal into pipeline-quality synthetic naturalgas. The initial project would be designed with ConocoPhillips’ “E-Gas TM ” Technology. Whencompleted, the plant would be one of the largest coal-to-natural-gas plants in the United Statesand would require at least three million tons of Illinois Basin coal per year to fuel two gasifiertrains that could produce more than 35 billion cubic feet of synthetic natural gas.Effective January 1, 2006, Gregory H. Boyce became our President and Chief ExecutiveOfficer after we completed an orderly succession planning process. Irl F. Engelhardt, ourformer Chief Executive Officer, remains employed as Chairman of the Board. EffectiveMarch 1, <strong>2005</strong>, Mr. Boyce was also elected to the Board of Directors and Chairman of theExecutive Committee of the Board.
Effective March 30, <strong>2005</strong>, we implemented a two-for-one stock split on all shares of ourcommon stock. Subsequently, on February 22, 2006, we implemented another two-for-onestock split on all shares of our then outstanding common stock. All share and per shareamounts in this annual report reflect both stock splits. During July <strong>2005</strong>, we increased ourquarterly dividend 27% to $0.0475 per share and our Board of Directors authorized a sharerepurchase program of up to 5% of the outstanding shares of our common stock. Therepurchases may be made from time to time based on an evaluation of our outlook andgeneral business conditions, as well as alternative investment and debt repayment options.On January 23, 2006, our Board of Directors authorized a 26% increase in our dividend, to$0.06 per share, to shareholders of record on February 7, 2006.In July <strong>2005</strong>, the Board of Directors elected John F. Turner as an independent directorwho serves on the Board’s Nominating and Corporate Governance Committee. Turner isformer U.S. Assistant Secretary of State for Oceans and International Environmental andScientific Affairs (“OES”) within the State Department and is the past President and ChiefExecutive Officer of the Conservation Fund, a national nonprofit organization dedicatedto public-private partnerships to protect land and water resources. He has also served asthe Director of the U.S. Fish and Wildlife Service, with responsibility for increasing wetlandprotection and establishing 55 National Wildlife Refuges, the most of any administration in thenation’s history.Segment AdjustedEBITDARESULTS OF OPERATIONSAdjusted EBITDAThe discussion of our results of operations in <strong>2005</strong> and 2004 below includes referencesto, and analysis of, our segments’ Adjusted EBITDA results. Adjusted EBITDA is defined asincome from continuing operations before deducting early debt extinguishment costs, netinterest expense, income taxes, minority interests, asset retirement obligation expense anddepreciation, depletion and amortization. Adjusted EBITDA is used by management primarilyas a measure of our segments’ operating performance. Because Adjusted EBITDA is notcalculated identically by all companies, our calculation may not be comparable to similarlytitled measures of other companies. Adjusted EBITDA is reconciled to its most comparablemeasure, under generally accepted accounting principles, in Note 27 to our consolidatedfinancial statements included in this report.YEAR <strong>ENDED</strong> <strong>DECEMBER</strong> <strong>31</strong>, <strong>2005</strong> COMPARED TO YEAR <strong>ENDED</strong><strong>DECEMBER</strong> <strong>31</strong>, 2004SummaryOur <strong>2005</strong> revenues of $4.64 billion increased 27.9% over the prior year. Revenueswere driven higher by improved pricing in all of our mining operations and another year ofindustry-record sales volume with 239.9 million tons sold compared to 227.2 million tonsin 2004.For the year, segment Adjusted EBITDA of $1.08 billion was a 39.5% increase over theprior year. Segment Adjusted EBITDA was higher in the current year due to increases in salesvolumes and prices at our U.S. and Australian Mining Operations. Results in our WesternU.S. Mining Operations segment include amounts for our April 15, 2004, acquisition of theTwentymile Mine in Colorado. Results in our Australian Mining Operations segment includeamounts for our April 15, 2004, acquisition of the Burton and North Goonyella Mines as wellas the opening of the Eaglefield Mine adjacent to the North Goonyella Mine in the fourthquarter of 2004. Our Corporate and Other segment includes results from our December 2004acquisition of a 25.5% interest in Carbones del Guasare, which owns and operates the PasoDiablo Mine in Venezuela. In addition, higher gains on property transactions contributed tohigher year over year results.Net income was $422.7 million in <strong>2005</strong>, or $1.58 per share, an increase of 141.0% over2004 net income of $175.4 million, or $0.69 per share. The increase in net income wasprimarily due to improved segment Adjusted EBITDA discussed above.29
Tons SoldThe following table presents tons sold by operating segment for the years endedDecember <strong>31</strong>, <strong>2005</strong> and 2004:Year Ended Year Ended Increase (Decrease)December <strong>31</strong>, December <strong>31</strong>,(Tons in millions) <strong>2005</strong> 2004 Tons %Western U.S. Mining Operations 154.3 142.2 12.1 8.5 %Eastern U.S. Mining Operations 52.5 51.7 0.8 1.5 %Australian Mining Operations 8.3 6.1 2.2 36.1 %Trading and Brokerage Operations 24.8 27.2 (2.4) (8.8)%Total 239.9 227.2 12.7 5.6 %RevenuesThe table below presents revenues for the years ended December <strong>31</strong>, <strong>2005</strong> and 2004:Year Ended Year Ended Increase to RevenuesDecember <strong>31</strong>, December <strong>31</strong>,(Dollars in thousands) <strong>2005</strong> 2004 $ %Sales $4,545,323 $3,545,027 $1,000,296 28.2%Other revenues 99,130 86,555 12,575 14.5%Total revenues $4,644,453 $3,6<strong>31</strong>,582 $1,012,871 27.9%Our revenues increased by $1.01 billion, or 27.9%, to $4.64 billion compared to prioryear. The three mines we acquired in the second quarter of 2004 contributed $365.2 millionof revenue growth due to the additional 105 days of operations in <strong>2005</strong> compared to the prioryear. The remaining $647.7 million of revenue growth was driven by higher sales prices andvolumes across all mining segments and improved volumes in our brokerage operations.Sales increased 28.2% to $4.55 billion in <strong>2005</strong>, reflecting increases in every operatingsegment. Western U.S. Mining sales increased $222.2 million, Eastern U.S. Mining saleswere $224.0 million higher, sales in Australian Mining improved $328.0 million and salesfrom our brokerage operations increased $226.0 million. Sales in every segment increasedon improved pricing, and volumes were higher in every segment other than Trading andBrokerage. Our average sales price per ton increased 17.4% during <strong>2005</strong> due to increaseddemand for all of our coal products, which drove pricing higher, particularly in the regionswhere we produce metallurgical coal. Prices for metallurgical coal and our ultra-low sulfurPowder River Basin coal have been the subject of increasing demand. We sell metallurgicalcoal from our Eastern U.S. and Australian Mining operations. We sell ultra-low sulfur PowderRiver Basin coal from our Western U.S. Mining operations. The sales mix also improved dueto an increase in sales from our Australian Mining segment, where per ton prices are higherthan in domestic markets due primarily to a higher proportion of metallurgical coal productionin the Australian segment sales mix.The increase in Eastern U.S. Mining operations sales was primarily due to improvedpricing for both steam and metallurgical coal from the region. Sales in Appalachia increased$118.6 million, or 17.1%, and sales in the Midwest increased $105.4 million, or 13.6%. Onaverage, prices in our Eastern U.S. Mining operations increased 14.1% to $33.10 per ton.Production increases in the Midwest were partially offset by lower production in Appalachiacompared to the prior year. Most of the decrease in production in Appalachia occurredduring the fourth quarter as our largest metallurgical coal mine worked to develop a newsection and relocate its longwall. Sales increased in our Western U.S. Mining operationsdue to higher demand-driven volumes and prices. Overall, prices in our Western U.S.Mining operations increased 6.6% to $10.45 per ton. In the West, sales increased the mostin the Powder River Basin, which improved $149.8 million due to increased sales pricesand volumes. Powder River Basin production and sales volumes were up as a result ofincreasingly strong demand for the mines’ low-sulfur product, which continues to expand itsmarket area geographically. Powder River Basin operations were able to ship record volumesduring <strong>2005</strong> by overcoming train derailments and weather and track maintenance disruptions30 <strong>Peabody</strong> <strong>Energy</strong>
on the main shipping line out of the basin. Our Twentymile Mine, acquired in April of 2004,helped our Colorado operations contribute an additional $67.3 million to sales compared toprior year due to an additional four months of ownership, higher prices and increased mineproductivity. Sales from our Southwestern operations, where the Black Mesa Mine closed atthe end of <strong>2005</strong>, were comparable to prior year. Sales from our Australian Mining operationswere $328.0 million, or 122.1%, higher than in 2004. The increase in Australian sales wasdue primarily to a 63.3% increase in per ton sales prices largely due to higher internationalmetallurgical coal prices, an increase in volumes which included the opening of our Eaglefieldsurface mine at the end of 2004, and $197.6 million of incremental sales from the two mineswe acquired in April 2004 due to 105 additional days of operations in <strong>2005</strong> compared to 2004.Our Trading and Brokerage operations’ sales increased $226.0 million in <strong>2005</strong> comparedto prior year due to an increase in average per ton prices and higher Eastern U.S. andinternational brokerage volumes.Other revenues increased $12.6 million, or 14.5%, compared to prior year primarily dueto proceeds from a purchase contract restructuring and higher synthetic fuel revenues inthe Midwest.Segment Adjusted EBITDAOur total segment Adjusted EBITDA of $1.08 billion for <strong>2005</strong> was $305.5 million higherthan 2004 segment Adjusted EBITDA of $773.8 million, and was composed of the following:Year Ended Year Ended Increase to Segment Adjusted EBITDADecember <strong>31</strong>, December <strong>31</strong>,(Dollars in thousands) <strong>2005</strong> 2004 $ %Western U.S. Mining $ 459,039 $402,052 $ 56,987 14.2%Eastern U.S. Mining 374,628 280,357 94,271 33.6%Australian Mining 202,582 50,372 152,210 302.2%Trading and Brokerage 43,058 41,039 2,019 4.9%IncomeTotal Segment Adjusted EBITDA $1,079,307 $773,820 $305,487 39.5%Adjusted EBITDA from our Western U.S. Mining operations increased $57.0 million during<strong>2005</strong> due to a margin per ton increase of $0.15, or 5.3%, and a sales volume increase of 12.1million tons. The Twentymile Mine, acquired in April of 2004, contributed $25.4 million moreto Adjusted EBITDA in <strong>2005</strong> than in 2004, due to four months of incremental ownership anda 22.2% increase in per ton margin. The remaining increase in Adjusted EBITDA was drivenby our Powder River Basin operations, which improved by $53.5 million and earned 12.3%higher per ton margins while increasing volumes 8.5% in response to greater demand forour low-sulfur products. Improved revenues overcame increased unit costs that resultedfrom higher fuel costs, lower than anticipated volume due to rail difficulties and an increasein revenue-based royalties and production taxes. Improvements in the Powder River Basinand Colorado overcame a decrease in Adjusted EBITDA of $13.5 million for our Southwestoperations primarily due to lower volume and higher fuel costs. Pricing improvements in thePowder River Basin generally offset higher costs for fuel and explosives.Eastern U.S. Mining operations’ Adjusted EBITDA increased $94.3 million, or 33.6%,compared to prior year primarily due to an increase in margin per ton of $1.71, or <strong>31</strong>.5%.Our Appalachia operations’ Adjusted EBITDA increased $44.2 million, or 29.8%, as a resultof sales price increases, partially offset by lower production at two of our mines and highercosts related to geologic issues, contract mining and roof support. Results in our Midwestoperations were improved $50.1 million, or 37.9%, compared to prior year as benefits ofhigher volumes and prices were partially offset by higher costs due to higher fuel, repair andmaintenance costs and the impact of heavy rainfall on surface operations early in the year.Our Australian Mining operations’ Adjusted EBITDA increased $152.2 million in thecurrent year, a 302.2% increase compared to prior year due to an increase of $16.23, or197.4%, in margin per ton and 2.2 million additional tons shipped. Our Australian operationsproduce mostly (75% to 85%) high margin metallurgical coal. The two mines we acquired inApril 2004 added $87.4 million to Adjusted EBITDA compared to eight months of ownershipin 2004. The remaining increase of $64.8 million was primarily due to an increase in volume,including tonnage from our surface operation opened at the end of the prior year, and anincrease of 63.3% in average per ton sale price. While current year margins benefited from<strong>31</strong>
strong sales prices, margin growth was limited by the impact of port congestion, relateddemurrage costs and higher costs due to geological problems at the underground mine.Trading and Brokerage operations’ Adjusted EBITDA increased $2.0 million from the prioryear primarily due to higher brokerage results. Results in <strong>2005</strong> included a net charge of$4.0 million, primarily related to the breach of a coal supply contract by a producer (see Note 3).Reconciliation of Segment Adjusted EBITDA to Income Before Income Taxes andMinority InterestsYear Ended Year Ended Increase (Decrease) to IncomeDecember <strong>31</strong>, December <strong>31</strong>,(Dollars in thousands) <strong>2005</strong> 2004 $ %Total Segment Adjusted EBITDA $1,079,307 $ 773,820 $305,487 39.5 %Corporate and Other Adjusted EBITDA (208,909) (214,576) 5,667 2.6 %Depreciation, depletion and amortization (<strong>31</strong>6,114) (270,159) (45,955) (17.0)%Asset retirement obligation expense (35,901) (42,387) 6,486 15.3 %Early debt extinguishment costs – (1,751) 1,751 n/aInterest expense (102,939) (96,793) (6,146) (6.3)%Interest income 10,641 4,917 5,724 116.4 %Income before income taxes andminority interests $ 426,085 $ 153,071 $273,014 178.4 %Income before income taxes and minority interests of $426.1 million for the currentyear is $273.0 million, or 178.4%, higher than prior year primarily due to improved segmentAdjusted EBITDA as discussed above. Increases in depreciation, depletion and amortizationexpense and interest expense offset improvements in Corporate and Other Adjusted EBITDA,asset retirement obligation expense, early debt extinguishment costs and interest income.Corporate and Other Adjusted EBITDA results include selling and administrativeexpenses, equity income from our Venezuelan joint venture, net gains on asset disposalsor exchanges, costs associated with past mining obligations and revenues and expensesrelated to our other commercial activities such as coalbed methane, generation developmentand resource management. The $5.7 million improvement in Corporate and Other AdjustedEBITDA (net expense) in <strong>2005</strong> compared to 2004 included:• net gains on asset sales that were $77.7 million higher than prior year primarily dueto a $37.4 million gain from a property exchange related to settlement of a contractdispute with a third-party coal supplier (see Note 3), sales of Penn Virginia ResourcePartners, L.P. (“PVR”) units ($<strong>31</strong>.1 million) (see Note 11), resource sales involvingnon-strategic coal assets and properties ($12.5 million), and an asset exchange inwhich we acquired Illinois Basin coal reserves ($6.2 million). The gain from PVRunit sales in <strong>2005</strong> was from the sale of all of our remaining 0.838 million unitscompared to a gain of $15.8 million on the sale of 0.775 million units in two separatetransactions during 2004. All other gains on asset disposals in <strong>2005</strong> and 2004 were$14.3 million and $8.0 million, respectively;• higher equity income of $18.7 million from our 25.5% interest in Carbones delGuasare (acquired in December 2004), which owns and operates the Paso DiabloMine in Venezuela, and;• lower net expenses related to generation development of $5.1 million, primarily dueto reimbursements from the Prairie State <strong>Energy</strong> Campus partnership group.These improvements were partially offset by:• a $36.0 million increase in past mining obligations expense, primarily related tohigher retiree health care costs. The increase in retiree health care costs wasactuarially driven by higher trend rates, and lower interest discount assumptions andhigher amortization of actuarial losses in <strong>2005</strong>, and;• an increase of $46.8 million in selling and administrative expenses primarily relatedto accruals for higher short-term and long-term performance-based incentive32 <strong>Peabody</strong> <strong>Energy</strong>
plans ($32.2 million). These incentives are principally long-term plans that aredriven by total shareholder returns. Our share price increased 104% during <strong>2005</strong>,significantly outperforming industrial benchmarks and our coal peer group average.The remaining increase in selling and administrative expenses was due to higherpersonnel and outside services costs needed to advance our growth initiativesin areas such as China and Btu Conversion, acquisitions and regulatory costs(e.g. Sarbanes-Oxley), and an increase in advertising costs related to an industryawareness campaign launched in late <strong>2005</strong>.Depreciation, depletion and amortization increased $46.0 million during <strong>2005</strong>.Approximately 56% of the increase was due to acquisitions completed during 2004 and theremainder was from increased volumes at existing mines and operations opened during<strong>2005</strong>. Asset retirement obligation expense decreased $6.5 million in <strong>2005</strong> due to additionalexpenses incurred in 2004 to accelerate the planned reclamation of certain closed mine sites.Interest expense increased $6.1 million primarily related to a full year of interest in <strong>2005</strong> on$250 million of 5.875% Senior Notes issued in late March of 2004 and increases in the costof floating rate debt due to higher interest rates. Interest income improved $5.7 million dueto higher yields on short-term interest rates and an increase in invested balances due toimproved cash flows during <strong>2005</strong>.Net IncomeYear Ended Year Ended Increase (Decrease) to IncomeDecember <strong>31</strong>, December <strong>31</strong>,(Dollars in thousands) <strong>2005</strong> 2004 $ %Income before income taxes andminority interests $426,085 $153,071 $273,014 178.4 %Income tax benefit (provision) (960) 26,437 (27,397) (103.6)%Minority interests (2,472) (1,282) (1,190) (92.8)%Income from continuing operations 422,653 178,226 244,427 137.1 %Loss from discontinued operations — (2,839) 2,839 n/aNet income $422,653 $175,387 $247,266 141.0 %Net income increased $247.3 million, or 141.0%, compared to the prior year due to theincrease in income before income taxes and minority interests discussed above, partiallyoffset by increases in our income tax provision. The income tax benefit in 2004 includeda $25.9 million reduction in the valuation allowance on net operating loss carry-forwards(“NOLs”) and alternative minimum tax credits. The income tax provision in <strong>2005</strong> was higherbased on the increase in pretax income which was partially offset by the higher permanentbenefit of percentage depletion and the partial benefit of tax loss from a deemed liquidationof a subsidiary arising as an indirect consequence of a comprehensive and strategic internalrestructuring we completed during <strong>2005</strong>. This restructuring resulted from efforts to betteralign corporate ownership of subsidiaries on a geographic and functional basis.YEAR <strong>ENDED</strong> <strong>DECEMBER</strong> <strong>31</strong>, 2004 COMPARED TO YEAR <strong>ENDED</strong><strong>DECEMBER</strong> <strong>31</strong>, 2003SummaryIn 2004, our revenues increased to $3.63 billion, 29.0% higher than 2003, led byimproved pricing and an industry-record sales volume of 227.2 million tons. Mines acquiredin April 2004 contributed $335.0 million of sales and 11.0 million tons to our 2004 results.Segment Adjusted EBITDA for 2004 totaled $773.8 million, a 28.1% increase over$603.9 million in the prior year. Segment Adjusted EBITDA was higher in 2004 due toincreased sales volumes and prices.Net income in 2004 was $175.4 million, or $0.69 per share, an increase of 459.5%over 2003 net income of $<strong>31</strong>.3 million, or $0.14 per share. The increase in net income wasprimarily due to improved operating results and acquisitions in 2004, and the impact in 2003of $53.5 million in pretax early debt extinguishment charges and a $10.1 million after taxcharge for the cumulative effect of accounting changes.33
Tons SoldThe following table presents tons sold by operating segment for the years endedDecember <strong>31</strong>, 2004 and 2003:Year Ended Year Ended IncreaseDecember <strong>31</strong>, December <strong>31</strong>,(Tons in millions) 2004 2003 Tons %Western U.S. Mining Operations 142.2 129.6 12.6 9.7%Eastern U.S. Mining Operations 51.7 46.3 5.4 11.7%Australian Mining Operations 6.1 1.3 4.8 369.2%Trading and Brokerage Operations 27.2 26.0 1.2 4.6%Total 227.2 203.2 24.0 11.8%RevenuesThe table below presents revenues for the years ended December <strong>31</strong>, 2004 and 2003:Year Ended Year Ended Increase to RevenuesDecember <strong>31</strong>, December <strong>31</strong>,(Dollars in thousands) 2004 2003 $ %Sales $3,545,027 $2,729,323 $815,704 29.9%Other revenues 86,555 85,973 582 0.7%Total revenues $3,6<strong>31</strong>,582 $2,815,296 $816,286 29.0%Revenues increased by 29.0%, or $816.3 million, over 2003. The acquisition of threemines in April 2004 contributed $335.0 million of total revenue and 11.0 million tons duringthe year. Excluding revenues from acquisitions during 2004, U.S. Mining revenues increased$375.4 million, and revenues from our brokerage operations increased $110.9 million onhigher pricing and volume worldwide. Our average sales price per ton increased 14.6%during 2004 due to increased overall demand, which has driven pricing higher, most notablyin Appalachia, and a change in sales mix. The sales mix has benefited from the increase insales from the Australian segment, where per ton prices are higher than in domestic markets.In addition to geographic mix changes, our 2004 revenues included a greater proportion ofhigher priced metallurgical coal sales. Pricing of metallurgical coal responded to increasedinternational demand for the product. We sell metallurgical coal from our Eastern U.S. andAustralian Mining operations. Other revenues were relatively unchanged from 2003.In our Eastern U.S. Mining operations, revenues increased $302.8 million, or 25.3%, asa result of higher pricing and volumes from strong steam and metallurgical coal demand.Production increases at most eastern mines more than offset lower than expected productionat certain of our mines and from contract sources as a result of geologic difficulties and fromcongestion-related shipping delays and hurricane-related production disruptions and delays torail and export shipments. Appalachian revenues led the Eastern U.S. increase, benefiting themost from price increases while also increasing production and sales volumes. Revenues inAppalachia increased $188.1 million, or 37.0%, while in the Midwest, revenues increasedby $114.7 million, or 16.6%. Revenues in our Western U.S. Mining operations increased$171.6 million, or 14.0%, on both increased volumes and prices. However, the primary driverof increased revenues in the West was a 12.6 million ton increase in sales volume. Growthin volumes were primarily in the Powder River Basin operations, where revenues were up$58.6 million, or 7.5%, and from the addition of the Twentymile Mine in April 2004, whichadded $99.0 million to sales. Powder River Basin production and sales volumes were up as aresult of stronger demand for the mines’ low-sulfur product, which overcame difficulties withrail service, downtime at the North Antelope Rochelle Mine to upgrade the loading facility andpoor weather, which impaired production early in the year. Revenues in our Australian Miningoperations increased $241.5 million compared to 2003 due primarily to the acquisition of twooperating mines during 2004 and benefiting from higher overall pricing for our products there.34 <strong>Peabody</strong> <strong>Energy</strong>
Segment Adjusted EBITDAOur total segment Adjusted EBITDA of $773.8 million for 2004 was $169.9 million higherthan 2003 segment Adjusted EBITDA of $603.9 million, and was composed of the following:Increase (Decrease) toYear Ended Year Ended Segment Adjusted EBITDADecember <strong>31</strong>, December <strong>31</strong>,(Dollars in thousands) 2004 2003 $ %Western U.S. Mining $402,052 $356,898 $ 45,154 12.7 %Eastern U.S. Mining 280,357 198,964 81,393 40.9 %Australian Mining 50,372 2,225 48,147 2163.9 %Trading and Brokerage 41,039 45,828 (4,789) (10.4)%Total Segment Adjusted EBITDA $773,820 $603,915 $169,905 28.1 %Western U.S. Mining operations Adjusted EBITDA increased $45.2 million during 2004,margin per ton increased $0.07, or 2.5%, while sales volume increased 12.6 million tons.The April 2004 acquisition of the Twentymile Mine contributed to $<strong>31</strong>.2 million of AdjustedEBITDA increase and sales volume, adding 6.2 million tons of the volume increase in 2004.An increase of $20.0 million in Adjusted EBITDA in the Powder River Basin, due primarilyto increases in sales volume, contributed most of the remaining improvement in the West.Our Powder River Basin operations continued to benefit from strong demand, leading torecord shipping levels which overcame the effects of a planned outage earlier in the year toincrease throughput at our North Antelope Rochelle Mine, rail service problems throughoutthe year and the shutdown of our Big Sky Mine at the end of 2003. Results in the Southwestapproximated 2003 levels. Pricing improvements generally offset higher costs for fueland explosives.Adjusted EBITDA from our Eastern U.S. Mining operations increased $81.4 million, or40.9%, compared to 2003 due to an increase in margin per ton of $1.11, or 25.8%, and anincrease in volume by 5.4 million, or 11.7%. Improved pricing led to increased marginsin our Eastern operations, despite higher processing costs incurred to upgrade fromsteam to metallurgical quality, the cost of substitute coal purchases to enable productionto be sold in higher-value metallurgical coal markets, hurricane-related transportation andproduction interruption and increased fuel and steel costs. Appalachia operations drove theimprovement in the East with a $101.5 million increase in Adjusted EBITDA. The Appalachiaregion benefited from strong demand driven pricing and volume and increased higher-pricedmetallurgical coal sales. Our operations in Appalachia also benefited during the currentyear from $21.0 million in insurance recoveries, more than offsetting higher costs due toequipment and geologic difficulties at a mine in Kentucky and a $9.6 million increase inearnings from our equity interest in a joint venture. Adjusted EBITDA in the Midwest was$20.1 million less than 2003 as increased production and sales, as well as higher overall salesprices, did not overcome poor geologic conditions at certain mines, higher equipment repaircosts and higher fuel and steel costs.Our Australian Mining operations Adjusted EBITDA increased $48.1 million in 2004. Ouracquisition of two mines in April 2004 added 4.8 million tons and increased overall salesvolume to 6.1 million tons. Most of the increase in sales tonnage was in higher marginmetallurgical coal sales, driving a margin per ton increase of $6.55, or nearly 400%. Theacquisitions in 2004 contributed $43.1 million of Adjusted EBITDA to results for the year.Trading and Brokerage Adjusted EBITDA decreased $4.8 million from 2003 primarily dueto higher brokerage results in 2003. Adjusted EBITDA from trading activities increased over2003 due to improved pricing on our long position, and pure brokerage results improved onhigher pricing and volumes, particularly in international brokerage.35
Reconciliation of Segment Adjusted EBITDA to Income (Loss) Before Income Taxesand Minority InterestsYear Ended Year Ended Increase (Decrease) to IncomeDecember <strong>31</strong>, December <strong>31</strong>,(Dollars in thousands) 2004 2003 $ %Total Segment Adjusted EBITDA $ 773,820 $ 603,915 $169,905 28.1 %Corporate and Other Adjusted EBITDA (214,576) (193,637) (20,939) (10.8)%Depreciation, depletion and amortization (270,159) (234,336) (35,823) (15.3)%Asset retirement obligation expense (42,387) (<strong>31</strong>,156) (11,2<strong>31</strong>) (36.0)%Early debt extinguishment costs (1,751) (53,513) 51,762 96.7 %Interest expense (96,793) (98,540) 1,747 1.8 %Interest income 4,917 4,086 8<strong>31</strong> 20.3 %Income (loss) before income taxes andminority interests $ 153,071 $ (3,181) $156,252 n/aTotal segment Adjusted EBITDA of $773.8 million for 2004 is compared with $603.9 millionfrom 2003 in the discussion above. Corporate and Other Adjusted EBITDA results includeselling and administrative expenses, net gains on asset disposals, costs associated with pastmining obligations and revenues and expenses related to our other commercial activities suchas coalbed methane, generation development, resource management and our Venezuelanmining operations. The increase in Corporate and Other Adjusted EBITDA (net expense) in2004 compared to 2003 was primarily due to:• net gains on asset sales were $8.8 million higher in 2003, which included gains of$18.8 million on the sale of land, coal reserves and oil and gas rights, $6.4 millionof other asset disposals, and $7.6 million from the sale of 1.15 million units of PVR,while 2004 included gains of only $8.0 million from other asset disposals and a$15.8 million gain from the sale of a total of 0.775 million units of PVR in twoseparate transactions;• increased costs in 2004 for generation development ($5.3 million) related to thefurther development of the Prairie State and Thoroughbred <strong>Energy</strong> campuses;• higher selling and administrative expenses of $34.5 million, primarily associated withhigher long-term incentive costs ($17.8 million), pensions, an increase in outsideservices costs (including costs related to compliance with the Sarbanes-Oxley Act)and the impact of acquisitions during 2004; and• a $2.9 million increase in our accrual for future environmental obligations.These increased costs compared to 2003 were partially offset by the gain on sale of PVRunits discussed above and:• lower costs ($29.0 million) in 2004 associated with past mining obligations, primarilylower retiree health care costs from the passage of the Medicare Prescription Drug,Improvement and Modernization Act of 2003 and lower closed and suspended minespending;• contributions ($1.2 million) to Adjusted EBITDA from the December 2004 acquisitionof a 25.5% interest in the Paso Diablo Mine in Venezuela.Depreciation, depletion and amortization increased $35.8 million during 2004 due tohigher volume and acquisitions. Asset retirement obligation expense increased $11.2 millionduring 2004 due to increased or accelerated reclamation work at certain closed mine sites andthe acquisition of additional mining operations.Debt extinguishment costs were $51.8 million higher in 2003 due to the significantprepayment premiums associated with the March 2003 refinancing, discussed in Note 14 toour consolidated financial statements.36 <strong>Peabody</strong> <strong>Energy</strong>
Net IncomeYear Ended Year Ended Increase (Decrease) to IncomeDecember <strong>31</strong>, December <strong>31</strong>,(Dollars in thousands) 2004 2003 $ %Income (loss) before income taxes andminority interests $153,071 $ (3,181) $ 156,252 n/aIncome tax benefit 26,437 47,708 (21,271) (44.6)%Minority interests (1,282) (3,035) 1,753 57.8 %Income from continuing operations 178,226 41,492 136,734 329.5 %Loss from discontinued operations (2,839) – (2,839) n/aIncome before accounting changes 175,387 41,492 133,895 322.7 %Cumulative effect of accounting changes – (10,144) 10,144 n/aNet income $175,387 $ <strong>31</strong>,348 $144,039 459.5 %The increase of $144.0 million in net income from 2003 to 2004 was due to the increasein income (loss) before income taxes and minority interests ($156.3 million) discussed aboveand the impacts of the following:• a $21.3 million lower tax benefit in 2004. The tax benefit recorded in 2004 differsfrom the benefit in 2003 primarily as a result of significantly higher pre-tax income,partially offset by the higher permanent benefit of percentage depletion. The 2004tax benefit also included a net $25.9 million reduction in the valuation allowance onthose NOLs and alternative minimum tax credits. We evaluated and assessed theexpected near-term utilization of NOLs, book and taxable income trends, availabletax strategies and the overall deferred tax position to determine the amount andtiming of valuation allowance adjustments;• a $2.8 million loss, net of tax, from discontinued operations in 2004 due to coststo resolve a contract indemnification claim related to our former CitizensPower subsidiary;• lower minority interests during 2004 due to the acquisition in April 2003 of theremaining 18.3% of Black Beauty Coal Company; and• a charge in 2003 for the cumulative effect of accounting changes, net of incometaxes, of $10.1 million, relating to the adoption of Statement of Financial AccountingStandard (“SFAS”) No. 143, “Accounting for Asset Retirement Obligations” (“SFASNo. 143”), the change in method of amortization of actuarial gains and lossesrelated to net periodic postretirement benefit costs and the effect of the recession ofEmerging Issues Task Force (“EITF”) No. 98-10, “Accounting for Contracts Involvedin <strong>Energy</strong> Trading and Risk Management Activities,” as discussed in Note 7 to theconsolidated financial statements.OUTLOOKEvents Impacting Near-Term OperationsDespite setting new industry records, shipments from our Powder River mines werelower than expected during <strong>2005</strong> due to a remedial maintenance program undertaken by thetwo railroad companies serving the Powder River Basin. The maintenance and repairs areexpected to continue into 2006. We expect these repairs may restrict shipments from ourPowder River operations during 2006, but continue to anticipate higher shipment levelsthan <strong>2005</strong>.Metallurgical coal production from our Appalachia operations is expected to be lowerthan prior year periods through the first quarter of 2006 as a metallurgical coal mine in ourAppalachia segment continues development work and moves to new reserves. The longwallat the existing mine has depleted the final panel of available reserves in its current locationand is relocating to a reserve extension in the first half of 2006. Following the longwall move,production of domestic metallurgical coal is expected to improve and finish the year withproduction equal to, or greater than, that of <strong>2005</strong>.37
Our North Goonyella Mine in Australia has experienced difficult geologic conditions in<strong>2005</strong> and experienced a roof fall that interrupted production for portions of the third andfourth quarters. In the first quarter of 2006, we plan to install new longwall equipment tomaximize operating performance under these adverse geologic conditions. We plan to meetour shipping commitments from this mine by supplementing its output with production fromour newly-opened, adjacent surface operation. In May <strong>2005</strong>, we were notified of a reducedport allocation that is aimed at improving the loading of vessels and reducing demurrage atthe main port for our Australian coal operations. Although port congestion has been reduced,high demurrage costs and unpredictable timing of vessel loading could continue to impactfuture results.Outlook OverviewOur outlook for the coal markets remains positive. We believe strong coal markets willcontinue worldwide, as long as growth continues in the U.S., Asia and other industrializedeconomies that are increasing coal demand for electricity generation and steelmaking. TheU.S. economy grew at an annual rate of 4.1% in the third quarter of <strong>2005</strong> as reported by theU.S. Commerce Department, and China’s economy grew 9.4% as published by the NationalBureau of Statistics of China. Strong demand for coal and coal-based electricity generation inthe U.S. is being driven by the growing economy, low customer stockpiles, favorable weather,capacity constraints of nuclear generation and high prices of natural gas and oil. The highprice of natural gas is leading some coal-fueled generating plants to operate at increasedlevels. The <strong>Energy</strong> Information Administration (“EIA”) projects that the high price of oil willlead to an increase in demand for unconventional sources of transportation fuel, includingcoal-to-liquids (“CTL”), and that coal will begin to displace natural gas-fired generation ofelectricity, including the addition of CTL plants. At year end, U.S. electricity generator coalinventories were at the lowest level in the past five years.Demand for Powder River Basin coal is increasing, particularly for our ultra-low sulfurproducts. The Powder River Basin represents more than half of our production, and thepublished reference price for high-Btu, ultra-low sulfur Powder River Basin coal has increasedsubstantially, tripling during <strong>2005</strong>. We control approximately 3.5 billion tons of proven andprobable reserves in the Southern Powder River Basin and sold 125.7 million tons of coalfrom this region during the year ended December <strong>31</strong>, <strong>2005</strong>. Customers have indicated thatdemand for Powder River Basin coal could increase by 15% or more during 2006, althoughthe railroads expect that they will be able to accommodate only about half of the expectedincrease in demand. Metallurgical coal continues to sell at a significant premium to steamcoal and metallurgical markets remain strong as global steel production grew 6% to 7% in<strong>2005</strong>. We expect to capitalize on the strong global market for metallurgical coal primarilythrough production and sales of metallurgical coal from our Appalachia operations and ourAustralian operations.We are targeting 2006 production of 230 million to 240 million tons and total salesvolume of 255 million to 265 million tons, including 12 to 14 million tons of metallurgical coal.As of December <strong>31</strong>, <strong>2005</strong>, our unpriced volumes for produced tonnage for 2006 were 15 to25 million tons.Management expects strong market conditions and operating performance toovercome external cost pressures, geologic conditions and potentially adverse port and railperformance. We are experiencing increases in operating costs related to fuel, explosives,steel, tires, contract mining and healthcare, and have taken measures to mitigate the increasesin these costs. In addition, historically low long-term interest rates also have a negativeimpact on expenses related to our actuarially determined, employee-related liabilities. Wemay also encounter poor geologic conditions, lower third party contract miner or brokeragesource performance or unforeseen equipment problems that limit our ability to produceat forecasted levels. To the extent upward pressure on costs exceeds our ability to realizesales increases, or if we experience unanticipated operating or transportation difficulties, ouroperating margins would be negatively impacted.CRITICAL ACCOUNTING POLICIESOur discussion and analysis of our financial condition, results of operations, liquidityand capital resources is based upon our financial statements, which have been prepared inaccordance with accounting principles generally accepted in the United States. Generallyaccepted accounting principles require that we make estimates and judgments that affectthe reported amounts of assets, liabilities, revenues and expenses, and related disclosure of38 <strong>Peabody</strong> <strong>Energy</strong>
contingent assets and liabilities. On an on-going basis, we evaluate our estimates. We baseour estimates on historical experience and on various other assumptions that we believeare reasonable under the circumstances, the results of which form the basis for makingjudgments about the carrying values of assets and liabilities that are not readily apparent fromother sources. Actual results may differ from these estimates.Employee-Related LiabilitiesOur subsidiaries have significant long-term liabilities for our employees’ postretirementbenefit costs, workers’ compensation obligations and defined benefit pension plans. Detailedinformation related to these liabilities is included in Notes 16, 17 and 18 to our consolidatedfinancial statements. Liabilities for postretirement benefit costs and workers’ compensationobligations are not funded. Our pension obligations are funded in accordance with theprovisions of federal law. Expense for the year ended December <strong>31</strong>, <strong>2005</strong>, for these liabilitiestotaled $193.8 million, while payments were $147.1 million.Each of these liabilities are actuarially determined and we use various actuarialassumptions, including the discount rate and future cost trends, to estimate the costs andobligations for these items. Our discount rate is determined by utilizing a hypothetical bondportfolio model which approximates the future cash flows necessary to service our liabilities.We make assumptions related to future trends for medical care costs in the estimatesof retiree health care and work-related injuries and illnesses obligations. Our medical trendassumption is developed by annually examining the historical trend of our cost per claimdata. In addition, we make assumptions related to future compensation increases and rates ofreturn on plan assets in the estimates of pension obligations.If our assumptions do not materialize as expected, actual cash expenditures and coststhat we incur could differ materially from our current estimates. Moreover, regulatorychanges could increase our obligation to satisfy these or additional obligations. Our mostsignificant employee liability is postretirement health care, and assumed discount rates andhealth care cost trend rates have a significant effect on the expense and liability amountsreported for health care plans. Below we have provided two separate sensitivity analyses todemonstrate the significance of these assumptions in relation to reported amounts.Net Debt/Net CapitalOne-Percentage- One-Percentage-(Dollars in thousands) Point Increase Point DecreaseHealth care cost trend rate:Effect on total service and interest cost components (1) $ 8,789 $ (6,961)Effect on total postretirement benefit obligation (1) $161,903 $(135,501)One HalfOne Half-Percentage- Percentage-(Dollars in thousands) Point Increase Point DecreaseDiscount rate:Effect on total service and interest cost components (1) $ 1,183 $ (1,563)Effect on total postretirement benefit obligation (1) $(68,900) $ 75,878(1) In addition to the effect on total service and interest cost components of expense, changes in trend and discount rates would also increase ordecrease the actuarial gain or loss amortization expense component. The gain or loss amortization would approximate the increase or decrease inthe obligation divided by 8.99 years at December <strong>31</strong>, <strong>2005</strong>.Asset Retirement ObligationsOur asset retirement obligations primarily consist of spending estimates for surface landreclamation and support facilities at both surface and underground mines in accordancewith federal and state reclamation laws as defined by each mining permit. Asset retirementobligations are determined for each mine using various estimates and assumptions including,among other items, estimates of disturbed acreage as determined from engineering data,estimates of future costs to reclaim the disturbed acreage, the timing of these cash flows, anda credit-adjusted risk-free rate. As changes in estimates occur (such as mine plan revisions,changes in estimated costs, or changes in timing of the reclamation activities), the obligationand asset are revised to reflect the new estimate after applying the appropriate credit-adjustedrisk-free rate. If our assumptions do not materialize as expected, actual cash expenditures39
and costs that we incur could be materially different than currently estimated. Moreover,regulatory changes could increase our obligation to perform reclamation and mine closingactivities. Asset retirement obligation expense for the year ended December <strong>31</strong>, <strong>2005</strong>, was$35.9 million, and payments totaled $33.6 million. See detailed information regarding ourasset retirement obligations in Note 15 to our consolidated financial statements.Income TaxesWe account for income taxes in accordance with SFAS No. 109, “Accounting for IncomeTaxes” (“SFAS No. 109”), which requires that deferred tax assets and liabilities be recognizedusing enacted tax rates for the effect of temporary differences between the book and taxbases of recorded assets and liabilities. SFAS No. 109 also requires that deferred tax assetsbe reduced by a valuation allowance if it is more likely than not that some portion or all of thedeferred tax asset will not be realized. In our annual evaluation of the need for a valuationallowance, we take into account various factors, including the expected level of future taxableincome and available tax planning strategies. If actual results differ from the assumptionsmade in our annual evaluation of our valuation allowance, we may record a change invaluation allowance through income tax expense in the period such determination is made.We establish reserves for tax contingencies when, despite the belief that our tax returnpositions are fully supported, certain positions are likely to be challenged and may not befully sustained. The tax contingency reserves are analyzed on a quarterly basis and adjustedbased upon changes in facts and circumstances, such as the progress of federal and stateaudits, case law and emerging legislation. Our effective tax rate includes the impact of taxcontingency reserves and changes to the reserves, including related interest, as consideredappropriate by management. We establish the reserves based upon management’sassessment of exposure associated with permanent tax differences (i.e. tax depletionexpense, etc.) and certain tax sharing agreements. We are subject to federal audits forseveral open years due to our previous inclusion in multiple consolidated groups and thevarious parties involved in finalizing those years. Additional details regarding the effect ofincome taxes on our consolidated financial statements is available in Note 13.Revenue RecognitionIn general, we recognize revenues when they are realizable and earned. We generated98% of our revenue in <strong>2005</strong> from the sale of coal to our customers. Revenue from coal salesis realized and earned when risk of loss passes to the customer. Coal sales are made toour customers under the terms of supply agreements, most of which are long-term (greaterthan one year). Under the typical terms of these agreements, risk of loss transfers to thecustomers at the mine or port, where coal is loaded to the rail, barge, ocean-going vessels,truck or other transportation source(s) that delivers coal to its destination.With respect to other revenues, other operating income, or gains on asset salesrecognized in situations unrelated to the shipment of coal, we carefully review the facts andcircumstances of each transaction and apply the relevant accounting literature as appropriate,and do not recognize revenue until the following criteria are met: persuasive evidence of anarrangement exists; delivery has occurred or services have been rendered; the seller’s priceto the buyer is fixed or determinable; and collectibility is reasonably assured.Trading ActivitiesWe engage in the buying and selling of coal in over-the-counter markets. Our coaltrading contracts are accounted for on a fair value basis under SFAS No. 133, “Accountingfor Derivative Instruments and Hedging Activities.” To establish fair values for our tradingcontracts, we use bid/ask price quotations obtained from multiple, independent third partybrokers to value coal and emission allowance positions. Prices from these sources are thenaveraged to obtain trading position values. We could experience difficulty in valuing ourmarket positions if the number of third party brokers should decrease or market liquidityis reduced.Ninety-nine percent of the contracts in our trading portfolio as of December <strong>31</strong>, <strong>2005</strong>were valued utilizing prices from over-the-counter market sources, adjusted for coal qualityand traded transportation differentials, and one percent of our contracts were valued basedon similar market transactions. As of December <strong>31</strong>, <strong>2005</strong>, 76% of the estimated future valueof our trading portfolio was scheduled to be realized by the end of 2006. See Note 4 to ourconsolidated financial statements for additional details regarding assets and liabilities from ourcoal trading activities.40 <strong>Peabody</strong> <strong>Energy</strong>
LIQUIDITY AND CAPITAL RESOURCESOur primary sources of cash include sales of our coal production to customers, cashgenerated from our trading and brokerage activities, sales of non-core assets and financingtransactions, including the sale of our accounts receivable through our securitization program.Our primary uses of cash include our cash costs of coal production, capital expenditures,interest costs and costs related to past mining obligations as well as planned acquisitions. Ourability to pay dividends, service our debt (interest and principal) and acquire new productiveassets or businesses is dependent upon our ability to continue to generate cash from theprimary sources noted above in excess of the primary uses. Future dividends, among otherthings, are subject to limitations imposed by our 6.875% Senior Notes, 5.875% Senior Notesand Senior Secured Credit Facility covenants. We typically fund all of our capital expenditurerequirements with cash generated from operations, and during <strong>2005</strong> and 2004 we had noborrowings outstanding under our $900.0 million revolving line of credit, which we useprimarily for standby letters of credit.Net cash provided by operating activities was $702.8 million in <strong>2005</strong>, an increaseof $419.0 million, or 147.6%, from 2004. The increase was primarily driven by strongeroperational performance in <strong>2005</strong>, as net income increased $247.3 million from the prioryear. Also contributing to the increase was lower funding of pension plans in <strong>2005</strong>, as wevoluntarily pre-funded $50.0 million in the prior year. The remainder of the increase wasprimarily due to higher working capital cash flows of $85.5 million.Net cash used in investing activities was $584.2 million during <strong>2005</strong> compared to$705.0 million used in 2004. Total capital expenditures were $643.9 million in <strong>2005</strong>, anincrease of $377.3 million over prior year. In <strong>2005</strong>, we purchased mining and related assetsof $141.2 million, which included $56.5 million for the acquisition of coal reserves in Illinoisand Indiana along with surface property and equipment and $84.7 million for the acquisitionof mining and transportation infrastructure in the Powder River Basin. Our $118.4 million infederal coal lease expenditures in <strong>2005</strong> were similar to the 2004 expenditures. Other capitalexpenditures of $384.3 million were $232.4 million higher than the prior year. The <strong>2005</strong>other capital expenditures included the longwall equipment and mine development at ourAustralian mines, longwall replacement at our Twentymile mine, the opening of new minesand upgrading of existing mines in the Midwest and Appalachia, and expansion equipment.In <strong>2005</strong>, we were able to make several acquisitions of strategic coal reserves and miningassets due to the strong operating results that we experienced in <strong>2005</strong>. Proceeds from thedisposal of assets increased $36.9 million primarily due to higher proceeds in <strong>2005</strong> from thesale of PVR units and non-strategic property, reserves and equipment. In 2004, we acquiredthe Twentymile mine in Colorado and two mines in Australia for $421.3 million and made a$5.0 million earn-out payment related to our April 2003 acquisition of the remaining minorityinterest in Black Beauty Coal Company. In December 2004, we acquired a 25.5% interest inCarbones del Guasare, which owns and manages the Paso Diablo mine in Venezuela, for a netpurchase price of $32.5 million.Net cash used in financing activities was $4.9 million in <strong>2005</strong> compared to cash providedby financing activities of $693.4 million in the prior year, with the decrease primarily relatedto the 2004 issuance of 35.3 million shares of common stock at $11.25 per share, nettingproceeds of $383.1 million; issuance of $250 million of 5.875% Senior Notes due in 2016;and the payment of debt issuance costs of $12.9 million in connection with the acquisitionof the three mines discussed above. During 2004, we also completed a repricing of ourSenior Secured Credit Facility, consisting of an amended $450.0 million Term Loan and the$900 million Revolving Credit Facility. During <strong>2005</strong> and 2004, we made scheduled paymentson our long-term debt of $20.2 and $36.3 million, respectively. Securitized interest inaccounts receivable increased by $25.0 million in <strong>2005</strong> compared to an increase of$110.0 million in 2004. We paid dividends of $44.5 million and $32.6 million in <strong>2005</strong> and2004, respectively. In <strong>2005</strong>, we issued $11.5 million in notes payable as part of an assetexchange in which we acquired additional Illinois Basin coal reserves.41
A detailed discussion of our debt instruments is included in Note 14 to our consolidatedfinancial statements. Dividends are subject to limitations imposed by our 6.875% SeniorNotes, 5.875% Senior Notes and Senior Secured Credit Facility covenants. As of December <strong>31</strong>,<strong>2005</strong> and 2004, our total indebtedness consisted of the following:December <strong>31</strong>, December <strong>31</strong>(Dollars in thousands) <strong>2005</strong> 2004Term Loan under Senior Secured Credit Facility $ 442,500 $ 448,7506.875% Senior Notes due 2013 650,000 650,0005.875% Senior Notes due 2016 239,525 239,525Fair value of interest rate swaps — 6.875% Senior Notes (8,879) 5,1895.0% Subordinated Note 66,693 73,621Other 15,667 7,880Total $1,405,506 $1,424,965On May 9, <strong>2005</strong>, we filed a shelf registration statement on Form S-3 with the SEC, whichwas declared effective in June <strong>2005</strong>. The universal shelf registration statement permits usto offer and sell from time to time up to an aggregate maximum of $3 billion of securities,including common stock, preferred stock, debt securities, warrants and units. Relatedproceeds could be used for general corporate purposes including repayment of other debt,capital expenditures, possible acquisitions and any other purposes that may be stated in anyprospectus supplement. As of December <strong>31</strong>, <strong>2005</strong>, no securities had been issued under theuniversal shelf registration statement, which remains effective.As of December <strong>31</strong>, <strong>2005</strong>, we had letters of credit outstanding under our RevolvingCredit Facility of $406.7 million, leaving $493.3 million available for borrowing. This providesus with available borrowing capacity under the line of credit to fund strategic acquisitionsor meet other financing needs. We were in compliance with all of the covenants of theSenior Secured Credit Facility, the 6.875% Senior Notes and the 5.875% Senior Notes as ofDecember <strong>31</strong>, <strong>2005</strong>.In May 2003, we entered into and designated four interest rate swaps with notionalamounts totaling $100.0 million as a fair value hedge of our 6.875% Senior Notes. Underthe swaps, we pay a floating rate that resets each March 15 and September 15, based uponthe six-month LIBOR rate, for a period of ten years ending March 15, 2013, and receives afixed rate of 6.875%. The average applicable floating rate of the four swaps was 7.09% as ofDecember <strong>31</strong>, <strong>2005</strong>.In September 2003, we entered into two $400.0 million interest rate swaps. One$400.0 million notional amount floating-to-fixed interest rate swap, expiring March 15, 2010,was designated as a hedge of changes in expected cash flows on the term loan under theSenior Secured Credit Facility. Under this swap we pay a fixed rate of 6.764% and receivea floating rate of LIBOR plus 2.5% (6.99% at December <strong>31</strong>, <strong>2005</strong>) that resets each March 15,June 15, September 15 and December 15 based upon the three-month LIBOR rate. Another$400.0 million notional amount fixed-to-floating interest rate swap, expiring March 15, 2013,was designated as a hedge of the changes in the fair value of the 6.875% Senior Notes due2013. Under this swap, we pay a floating rate of LIBOR plus 1.97% (6.46% at December <strong>31</strong>,<strong>2005</strong>) that resets each March 15, June 15, September 15 and December 15 based upon thethree-month LIBOR rate and receive a fixed rate of 6.875%. The swaps will lower our overallborrowing costs on $400.0 million of debt principal by 0.64% over the term of the floatingto-fixedswap. This results in annualized interest savings of $2.6 million over the term of thefixed-to-floating swap.42 <strong>Peabody</strong> <strong>Energy</strong>
CONTRACTUAL OBLIGATIONSThe following is a summary of our significant contractual obligations as ofDecember <strong>31</strong>, <strong>2005</strong>:Payments Due by YearWithinAfter(Dollars in thousands) 1 Year 2-3 Years 4-5 Years 5 YearsLong-term debt obligations (principal and interest) $108,189 $ 252,518 $ 538,730 $1,048,169Capital lease obligations 790 763 – –Operating lease obligations 84,0<strong>31</strong> 139,905 75,435 103,506Unconditional purchase obligations (1) 129,522 8,993 – –Coal reserve lease and royalty obligations 203,840 398,423 149,996 44,094Other long-term liabilities (2) 168,775 327,754 370,093 961,997Total contractual cash obligations $695,147 $1,128,356 $1,134,254 $2,157,766(1) We have purchase agreements with approved vendors for most types of operating expenses. However, our specific open purchase orders(which have not been recognized as a liability) under these purchase agreements, combined with any other open purchase orders, are notmaterial. The commitments in the table above relate to significant capital purchases.(2) Represents long-term liabilities relating to our postretirement benefit plans, work-related injuries and illnesses, defined benefit pension plansand mine reclamation and end of mine closure costs.We had $138.5 million of purchase obligations related to future capital expenditures atDecember <strong>31</strong>, <strong>2005</strong>. Commitments for coal reserve-related capital expenditures, includingFederal Coal Leases, are included in “Coal reserve lease and royalty obligations” in thetable above.Total capital expenditures for 2006 are expected to range from $450 million to$525 million, excluding Federal Coal Lease payments. Approximately 60% of projected 2006capital expenditures relates to replacement, improvement, or expansion of existing mines,particularly in Appalachia and the Midwest. The remainder of the expenditures relate togrowth initiatives such as increasing capacity in the Powder River Basin. We anticipatefunding these capital expenditures primarily through operating cash flow. In addition,cash requirements to fund employee related and reclamation liabilities included above areexpected to be funded from operating cash flow, along with obligations related to longtermdebt, capital and operating leases and coal reserves. We believe the risk of generatinglower than anticipated operating cash flow in 2006 is reduced by our high level of salescommitments, improved pricing and ongoing efforts to improve our operating cost structure.OFF-BALANCE SHEET ARRANGEMENTSIn the normal course of business, we are a party to certain off-balance sheetarrangements. These arrangements include guarantees, indemnifications, financialinstruments with off-balance sheet risk, such as bank letters of credit and performanceor surety bonds and our accounts receivable securitization. Liabilities related to thesearrangements are not reflected in our consolidated balance sheets, and we do not expectany material adverse effects on our financial condition, results of operations or cash flowsto result from these off-balance sheet arrangements.43
We use a combination of surety bonds, corporate guarantees (i.e. self bonds) andletters of credit to secure our financial obligations for reclamation, workers’ compensation,postretirement benefits and coal lease obligations as follows as of December <strong>31</strong>, <strong>2005</strong>:Workers’ RetireeReclamation Lease Compensation Healthcare(Dollars in millions) Obligations Obligations Obligations Obligations Other (1) TotalSelf bonding $ 671.8 $ – $ – $ – $ 2.9 $ 674.7Surety bonds 335.6 258.8 19.2 – 28.4 642.0Letters of credit 0.1 22.7 144.6 120.1 119.7 407.2$1,007.5 $281.5 $163.8 $120.1 $151.0 $1,723.9(1) Includes financial guarantees primarily related to joint venture debt, the Pension Benefit Guarantee Corporation and collateral forsurety companies.We have guaranteed $9.8 million of debt of an affiliate in which we have a 49% equityinvestment. We have also provided guarantees to small coal mining companies in orderto facilitate their efforts to obtain bonding or financing. These guarantees arose as part ofexclusive sales representation agreements with the small coal mining companies and totaled$5.5 million as of December <strong>31</strong>, <strong>2005</strong>. See Note 23 to our consolidated financial statementsfor a more detailed description of guarantees and indemnifications.In March 2000, we established an accounts receivable securitization program. Underthe program, undivided interests in a pool of eligible trade receivables that have beencontributed to our wholly-owned, bankruptcy-remote subsidiary are sold, without recourse,to a multi seller, asset backed commercial paper conduit (“Conduit”). Purchases by theConduit are financed with the sale of highly rated commercial paper. We used proceeds fromthe sale of the accounts receivable to repay long term debt, effectively reducing our overallborrowing costs. The securitization program is scheduled to expire in September 2009,and the maximum amount of undivided interests in accounts receivable that may be sold tothe Conduit is $225.0 million. The securitization transactions have been recorded as sales,with those accounts receivable sold to the Conduit removed from the consolidated balancesheet. The funding cost of the securitization program was $2.5 million and $1.7 million forthe years ended December <strong>31</strong>, <strong>2005</strong> and 2004, respectively. In the third quarter of <strong>2005</strong>, werenegotiated certain terms of the program, including lowering the program pricing, removinga minimum balance requirement and adding the ability to issue letters of credit under theprogram. The amount of undivided interests in accounts receivable sold to the Conduit was$225.0 million and $200.0 million as of December <strong>31</strong>, <strong>2005</strong> and 2004, respectively. A detaileddescription of our $225.0 million accounts receivable securitization is included in Note 5 to ourconsolidated financial statements.The following is a summary of specified types of commercial commitments available tous as of December <strong>31</strong>, <strong>2005</strong>:Expiration Per YearTotal AmountsWithin(Dollars in thousands) Committed 1 Year 2-3 Years 4-5 Years Over 5 YearsLines of credit and/orstandby letters of credit $900,000 — — $900,000 —ACCOUNTING PRONOUNCEMENTS NOT YET IMPLEMENTEDIn March <strong>2005</strong>, the EITF issued EITF Issue No. 04-6, “Accounting for Stripping Costs inthe Mining Industry,” which states “that stripping costs incurred during the production phaseof a mine are variable production costs that should be included in the costs of the inventoryproduced during the period that the stripping costs are incurred.” Advance stripping costsinclude those costs necessary to remove overburden above an unmined coal seam as partof the surface mining process, and are included as the “work-in-process” component of“Inventories” in the consolidated balance sheets ($245.5 million and $197.2 million as ofDecember <strong>31</strong>, <strong>2005</strong>, and December <strong>31</strong>, 2004, respectively - see Note 10). This is consistent44 <strong>Peabody</strong> <strong>Energy</strong>
with the concepts embodied in Accounting Research Bulletin No. 43, “Restatement andRevision of Accounting Research Bulletins,” which provides that “the term inventoryembraces goods awaiting sale..., goods in the course of production (work-in-process), andgoods to be consumed directly or indirectly in production...” At the June 15-16, <strong>2005</strong> EITFmeeting, the Task Force clarified that the intended meaning of “inventory produced” is“inventory extracted.” Based on this clarification, stripping costs incurred during a periodwill be attributed only to the inventory costs of the coal that is extracted during that sameperiod. Due to physical loadout constraints and potential combustion issues, coal in mostof our operations is not removed from the open pit until it is ready to ship; therefore, we willhave little inventory on our balance sheet after implementing this interpretation. We expectthis accounting treatment will introduce volatility in our earnings as costs associated withpreparing coal for sale may be expensed before the coal is sold, and likewise, sales may bemade with little to no cost matched to the sale.EITF Issue No. 04-6 is effective for the first reporting period in fiscal years beginning afterDecember 15, <strong>2005</strong> (January 1, 2006 for us). At the June <strong>2005</strong> EITF meeting, the Task Forcemodified the transition provisions of EITF Issue No. 04-6, indicating that companies that adoptin periods beginning after June 29, <strong>2005</strong> may utilize a cumulative effect adjustment approachwhere the cumulative effect adjustment is recorded directly to retained earnings in the year ofadoption. If we had implemented the cumulative effect adjustment approach at December <strong>31</strong>,<strong>2005</strong>, the reduction to retained earnings, net of tax, would have been $150.6 million. Weadopted EITF Issue No. 04-6 on January 1, 2006.On December 16, 2004, the Financial Accounting Standards Board (“FASB”) issuedSFAS No. 123 (revised 2004), “Share-Based Payment” (“SFAS No. 123(R)), which is a revisionof SFAS No. 123, “Accounting for Stock-Based Compensation” (“SFAS No. 123”). SFAS No. 123(R)supersedes Accounting Principles Board (“APB”) Opinion No. 25, “Accounting for StockIssued to Employees”, and amends FASB Statement No. 95, “Statement of Cash Flows.”Generally, the approach in SFAS No. 123(R) is similar to the approach described in SFAS No. 123.However, SFAS No. 123(R) requires all share-based payments to employees, including grantsof employee stock options, to be recognized in the income statement based on their fairvalues. Pro forma disclosure is no longer an alternative. Income tax benefits from stockoptions exercised will be included in financing activities in the statement of cash flows ratherthan operating activities.In <strong>2005</strong>, the Securities and Exchange Commission deferred the adoption date ofSFAS No. 123(R) to fiscal years beginning after June 15, <strong>2005</strong>. We adopted this standard onJanuary 1, 2006, and used the modified prospective method, in which compensation cost isrecognized beginning with the effective date (a) based on the requirements of SFAS No. 123(R)for all share-based payments granted after the effective date and (b) based on the requirementsof SFAS No. 123 for all awards granted to employees prior to the effective date of SFAS No. 123(R)that remain unvested on the effective date. Based on stock option grants made in <strong>2005</strong> (andyears prior) and currently anticipated for 2006, we estimate we will recognize stock optionexpense for the year ending December <strong>31</strong>, 2006, of $5.6 million, net of tax*es. We beganutilizing restricted stock as part of our equity-based compensation strategy in January <strong>2005</strong>.Based on the restricted stock grants made in <strong>2005</strong> and years prior, we recognized expenserelated to restricted stock of $1.0 million, net of taxes, in <strong>2005</strong>. Accounting for restricted stockawards is not affected by the adoption of SFAS 123(R).QUANTITATIVE AND QUALITATIVE DISCLOSURES ABOUT MARKET RISKThe potential for changes in the market value of our coal trading, interest rate andcurrency portfolios is referred to as “market risk.” Market risk related to our coal tradingportfolio is evaluated using a value at risk analysis (described below). Value at risk analysisis not used to evaluate our non-trading interest rate and currency portfolios. A descriptionof each market risk category is set forth below. We attempt to manage market risks throughdiversification, controlling position sizes, and executing hedging strategies. Due to lackof quoted market prices and the long term, illiquid nature of the positions, we have notquantified market risk related to our non-trading, long-term coal supply agreement portfolio.Coal Trading Activities and Related Commodity Price RiskWe engage in over-the-counter and direct trading of coal. These activities give rise tocommodity price risk, which represents the potential loss that can be caused by an adversechange in the market value of a particular commitment. We actively measure, monitor andadjust traded position levels to remain within risk limits prescribed by management. For45
example, we have policies in place that limit the amount of total exposure, in value at riskterms, that we may assume at any point in time.We account for coal trading using the fair value method, which requires us to reflectfinancial instruments with third parties, such as forwards, options and swaps, at market valuein our consolidated financial statements. Our trading portfolio included forwards at December <strong>31</strong>,<strong>2005</strong>, and included forwards and swaps at December <strong>31</strong>, 2004. Our policy for accounting forcoal trading activities is described in Note 1 to our consolidated financial statements.We perform a value at risk analysis on our coal trading portfolio, which includes overthe-counterand brokerage trading of coal. The use of value at risk allows us to quantifyin dollars, on a daily basis, the price risk inherent in our trading portfolio. Value at riskrepresents the potential loss in value of our mark-to-market portfolio due to adverse marketmovements over a defined time horizon (liquidation period) within a specified confidencelevel. Our value at risk model is based on the industry standard variance/co-varianceapproach. This captures our exposure related to both option and forward positions. Ourvalue at risk model assumes a 15-day holding period and a 95% one-tailed confidenceinterval. This means that there is a one in 20 statistical chance that the portfolio would losemore than the value at risk estimates during the liquidation period.The use of value at risk allows management to aggregate pricing risks across productsin the portfolio, compare risk on a consistent basis and identify the drivers of risk. Due tothe subjectivity in the choice of the liquidation period, reliance on historical data to calibratethe models and the inherent limitations in the value at risk methodology, we perform regularstress and scenario analysis to estimate the impacts of market changes on the value of theportfolio. The results of these analyses are used to supplement the value at risk methodologyand identify additional market-related risks.We use historical data to estimate our value at risk and to better reflect current asset andliability volatilities. Given our reliance on historical data, value at risk is effective in estimatingrisk exposures in markets in which there are not sudden fundamental changes or shifts inmarket conditions. An inherent limitation of value at risk is that past changes in market riskfactors may not produce accurate predictions of future market risk. Value at risk should beevaluated in light of this limitation.During the year ended December <strong>31</strong>, <strong>2005</strong>, the actual low, high and average values atrisk for our coal trading portfolio were $1.2 million, $3.9 million and $2.3 million, respectively.During the year ended December <strong>31</strong>, 2004, the actual low, high and average values at risk forour coal trading portfolio were $0.5 million, $6.1 million and $2.9 million, respectively. As ofDecember <strong>31</strong>, <strong>2005</strong>, the timing of the estimated future realization of the value of our tradingportfolio was as follows:Year ofPercentageExpirationof Portfolio2006 76%2007 23%2008 1%100%We also monitor other types of risk associated with our coal trading activities, includingcredit, market liquidity and counterparty nonperformance.Credit RiskOur concentration of credit risk is substantially with energy producers and marketers andelectric utilities. Our policy is to independently evaluate each customer’s creditworthinessprior to entering into transactions and to constantly monitor the credit extended. In the eventthat we engage in a transaction with a counterparty that does not meet our credit standards,we will protect our position by requiring the counterparty to provide appropriate creditenhancement. When appropriate (as determined by our credit management function), wehave taken steps to reduce our credit exposure to customers or counterparties whose credithas deteriorated and who may pose a higher risk of failure to perform under their contractualobligations. These steps include obtaining letters of credit or cash collateral, requiringprepayments for shipments or the creation of customer trust accounts held for our benefit toserve as collateral in the event of a failure to pay. To reduce our credit exposure related to46 <strong>Peabody</strong> <strong>Energy</strong>
trading and brokerage activities, we seek to enter into netting agreements with counterpartiesthat permit us to offset receivables and payables with such counterparties. Counterparty riskwith respect to interest rate swap and foreign currency forwards and options transactions isnot considered to be significant based upon the creditworthiness of the participatingfinancial institutions.Foreign Currency RiskWe utilize currency forwards to hedge currency risk associated with anticipated Australiandollar expenditures. Our currency hedging program for 2006 involves hedging approximately70% of our anticipated, non-capital Australian dollar-denominated expenditures. As ofDecember <strong>31</strong>, <strong>2005</strong>, we had in place forward contracts designated as cash flow hedgeswith notional amounts outstanding totaling A$915.8 million of which A$434.8 million,A$300.0 million and A$181.0 million will expire in 2006, 2007 and 2008, respectively. Theaccounting for these derivatives is discussed in Note 2 to our consolidated financialstatements. Our current expectation for 2006 non-capital, Australian dollar-denominatedcash expenditures is approximately $633 million. A change in the Australian dollar/U.S. dollarexchange rate of US $0.01 (ignoring the effects of hedging) would result in an increase ordecrease in our “Operating costs and expenses” of $6.3 million per year.Interest Rate RiskOur objectives in managing exposure to interest rate changes are to limit the impact ofinterest rate changes on earnings and cash flows and to lower overall borrowing costs. Toachieve these objectives, we manage fixed rate debt as a percent of net debt through the useof various hedging instruments, which are discussed in detail in Note 14 to our consolidatedfinancial statements. As of December <strong>31</strong>, <strong>2005</strong>, after taking into consideration the effectsof interest rate swaps, we had $860.7 million of fixed-rate borrowings and $544.8 millionof variable-rate borrowings outstanding. A one percentage point increase in interest rateswould result in an annualized increase to interest expense of $5.4 million on our variablerate borrowings. With respect to our fixed rate borrowings, a one percentage point increasein interest rates would result in a $52.1 million decrease in the estimated fair value of theseborrowings.Other Non-trading ActivitiesWe manage our commodity price risk for our non-trading, long-term coal contractportfolio through the use of long-term coal supply agreements, rather than through the useof derivative instruments. We sold 90% of our sales volume under long-term coal supplyagreements during <strong>2005</strong> and 2004. As of December <strong>31</strong>, <strong>2005</strong>, we had 15 to 25 million tons,90 to 100 million tons and 155 to 165 million tons for 2006, 2007 and 2008, respectively, ofexpected production (including steam and metallurgical coal production) available for sale orrepricing at market prices. We have an annual metallurgical coal production capacity of 12 to14 million tons.Some of the products used in our mining activities, such as diesel fuel and explosives,are subject to commodity price risk. To manage this risk, we use a combination of forwardcontracts with our suppliers and financial derivative contracts, primarily swap contracts withfinancial institutions. In addition, we utilize derivative contracts to hedge our commodityprice exposure. As of December <strong>31</strong>, <strong>2005</strong>, we had derivative contracts outstanding thatare designated as cash flow hedges of anticipated purchases of fuel. Notional amountsoutstanding under these contracts, scheduled to expire through 2007, were 44.5 milliongallons of heating oil and 24.4 million gallons of crude oil. Overall, we have fixed prices forapproximately 50% of our anticipated diesel fuel requirements in 2006.We expect to consume 95 to 100 million gallons of fuel per year. On a per gallon basis,based on this usage, a change in fuel prices of one cent per gallon (ignoring the effects ofhedging) would result in an increase or decrease in our operating costs of approximately$1 million per year. Alternatively, a one dollar per barrel change in the price of crude oilwould increase or decrease our annual fuel costs (ignoring the effects of hedging) byapproximately $2.3 million.47
Management ReportOVERVIEWManagement of <strong>Peabody</strong> <strong>Energy</strong> Corporation is responsible for the preparation andpresentation of the financial statements included in this annual report. Management is alsoresponsible for the reasonableness of estimates and judgments inherent in the preparationof the financial statements. These statements have been prepared in conformity with U.S.generally accepted accounting principles and include amounts based on management’s bestestimates and judgments.The financial statements have been audited by Ernst & Young LLP, an independentregistered public accounting firm. Their audit was conducted in accordance with generallyaccepted auditing standards. Ernst & Young also audited our assessment of the effectivenessof our internal control over financial reporting.Management maintains a strong awareness of the importance of full and openpresentation of our financial position and results of operations and utilizes a system ofdisclosure controls and procedures to ensure such presentation. To facilitate this, theCompany maintains a Disclosure Committee, which includes senior executives who possessin-depth knowledge of the Company’s business.The Audit Committee of the Board of Directors, composed of independent directors,meets periodically with the independent registered public accountants, our internal auditorsand management to review accounting, auditing, internal accounting controls and financialreporting matters. The independent certified public accountants and our internal auditors haveaccess to and separately meet on a periodic basis with the Audit Committee.EVALUATION OF DISCLOSURE CONTROLS AND PROCEDURESAs of the end of the period covered by this annual report, we carried out an evaluationof the effectiveness of the design and operation of our disclosure controls and procedurespursuant to Exchange Act Rules 13a-15(e) and 15d-15(e). Based upon that evaluation, theChief Executive Officer and the Chief Financial Officer concluded that our disclosure controlsand procedures were effective in timely alerting them to material information relating to ourcompany and its consolidated subsidiaries required to be included in our periodic SEC filings.48 <strong>Peabody</strong> <strong>Energy</strong>
CHANGES IN INTERNAL CONTROL OVER FINANCIAL REPORTINGThere were no changes in our internal control over financial reporting identified inconnection with the evaluation required by paragraph (d) of Exchange Act Rules 13a-15 or15d-15 that was conducted during the last fiscal quarter that have materially affected, or arereasonably likely to materially affect, our internal control over financial reporting.MANAGEMENT’S REPORT ON INTERNAL CONTROL OVER FINANCIAL REPORTINGManagement is responsible for maintaining and establishing adequate internal control overfinancial reporting. Our internal control framework and processes were designed to providereasonable assurance regarding the reliability of financial reporting and the preparation ofour consolidated financial statements for external purposes in accordance with U.S. generallyaccepted accounting principles.Because of inherent limitations, any system of internal control over financial reporting maynot prevent or detect misstatements. Also, projections of any evaluation of effectiveness tofuture periods are subject to the risk that controls may become inadequate because of changesin conditions, or that the degree of compliance with the policies or procedures may deteriorate.Management conducted an assessment of the effectiveness of our internal control overfinancial reporting using the criteria set by the Committee of Sponsoring Organizations ofthe Treadway Commission (“COSO”) in Internal Control – Integrated Framework. Based onthis assessment, management concluded that the Company’s internal control over financialreporting was effective as of December <strong>31</strong>, <strong>2005</strong>. Our Independent Registered PublicAccounting Firm, Ernst & Young LLP, has audited this assessment of our internal control overfinancial reporting, as stated in their attestation report included herein.Gregory H. BoycePresident and Chief Executive OfficerRichard A. NavarreExecutive Vice President and Chief Financial OfficerFebruary 21, 200649
REPORTS OFIndependent RegisteredPublic Accounting FirmTHE BOARD OF DIRECTORS AND STOCKHOLDERSPEABODY ENERGY CORPORATIONWe have audited management’s assessment, included in the accompanyingManagement’s Report on Internal Controls, that <strong>Peabody</strong> <strong>Energy</strong> Corporation maintainedeffective internal control over financial reporting as of December <strong>31</strong>, <strong>2005</strong>, based oncriteria established in Internal Control – Integrated Framework issued by the Committee ofSponsoring Organizations of the Treadway Commission (the COSO criteria). <strong>Peabody</strong> <strong>Energy</strong>Corporation’s management is responsible for maintaining effective internal control overfinancial reporting and for its assessment of the effectiveness of internal control over financialreporting. Our responsibility is to express an opinion on management’s assessment and anopinion on the effectiveness of the Company’s internal control over financial reporting basedon our audit.We conducted our audit in accordance with the standards of the Public CompanyAccounting Oversight Board (United States). Those standards require that we plan andperform the audit to obtain reasonable assurance about whether effective internal controlover financial reporting was maintained in all material respects. Our audit included obtainingan understanding of internal control over financial reporting, evaluating management’sassessment, testing and evaluating the design and operating effectiveness of internal control,and performing such other procedures as we considered necessary in the circumstances. Webelieve that our audit provides a reasonable basis for our opinion.A company’s internal control over financial reporting is a process designed to providereasonable assurance regarding the reliability of financial reporting and the preparation offinancial statements for external purposes in accordance with generally accepted accountingprinciples. A company’s internal control over financial reporting includes those policies andprocedures that (1) pertain to the maintenance of records that, in reasonable detail, accuratelyand fairly reflect the transactions and dispositions of the assets of the company; (2) providereasonable assurance that transactions are recorded as necessary to permit preparation offinancial statements in accordance with generally accepted accounting principles and thatreceipts and expenditures of the company are being made only in accordance with authorizationsof management and directors of the company; and (3) provide reasonable assuranceregarding prevention or timely detection of unauthorized acquisition, use, or dispositionof the company’s assets that could have a material effect on the financial statements.Because of its inherent limitations, internal control over financial reporting may notprevent or detect misstatements. Also, projections of any evaluation of effectiveness to futureperiods are subject to the risk that controls may become inadequate because of changes inconditions or that the degree of compliance with the policies or procedures may deteriorate.In our opinion, management’s assessment that <strong>Peabody</strong> <strong>Energy</strong> Corporation maintainedeffective internal control over financial reporting as of December <strong>31</strong>, <strong>2005</strong>, is fairly stated,in all material respects, based on the COSO criteria. Also, in our opinion, <strong>Peabody</strong> <strong>Energy</strong>Corporation maintained, in all material respects, effective internal control over financialreporting as of December <strong>31</strong>, <strong>2005</strong>, based on the COSO criteria.We have also audited, in accordance with the standards of the Public CompanyAccounting Oversight Board (United States), the consolidated balance sheets of <strong>Peabody</strong><strong>Energy</strong> Corporation as of December <strong>31</strong>, <strong>2005</strong> and 2004, and the related consolidatedstatements of operations, changes in stockholders’ equity, and cash flows for each of thethree years in the period ended December <strong>31</strong>, <strong>2005</strong>, and our report dated February 21, 2006,expressed an unqualified opinion thereon.St. Louis, MissouriFebruary 21, 200650 <strong>Peabody</strong> <strong>Energy</strong>
THE BOARD OF DIRECTORS AND STOCKHOLDERSPEABODY ENERGY CORPORATIONWe have audited the accompanying consolidated balance sheets of <strong>Peabody</strong> <strong>Energy</strong>Corporation as of December <strong>31</strong>, <strong>2005</strong> and 2004, and the related consolidated statementsof operations, changes in stockholders’ equity, and cash flows of the Company for each ofthe three years in the period ended December <strong>31</strong>, <strong>2005</strong>. These financial statements are theresponsibility of the Company’s management. Our responsibility is to express an opinion onthese financial statements based on our audits.We conducted our audits in accordance with the standards of the Public CompanyAccounting Oversight Board (United States). Those standards require that we plan andperform the audit to obtain reasonable assurance about whether the financial statementsare free of material misstatement. An audit includes examining, on a test basis, evidencesupporting the amounts and disclosures in the financial statements. An audit also includesassessing the accounting principles used and significant estimates made by management,as well as evaluating the overall financial statement presentation. We believe that our auditsprovide a reasonable basis for our opinion.In our opinion, the financial statements referred to above present fairly, in all materialrespects, the consolidated financial position of <strong>Peabody</strong> <strong>Energy</strong> Corporation at December <strong>31</strong>,<strong>2005</strong> and 2004, and the consolidated results of its operations and its cash flows for each ofthe three years in the period ended December <strong>31</strong>, <strong>2005</strong>, in conformity with U.S. generallyaccepted accounting principles.We also have audited, in accordance with the standards of the Public CompanyAccounting Oversight Board (United States), the effectiveness of <strong>Peabody</strong> <strong>Energy</strong>Corporation’s internal control over financial reporting as of December <strong>31</strong>, <strong>2005</strong>, based oncriteria established in Internal Control – Integrated Framework issued by the Committee ofSponsoring Organizations of the Treadway Commission, and our report dated February 21,2006, expressed an unqualified opinion thereon.St. Louis, MissouriFebruary 21, 200651
CONSOLIDATEDStatements of OperationsYear Ended December <strong>31</strong>,(Dollars in thousands, except share and per share data) <strong>2005</strong> 2004 2003RevenuesSales $4,545,323 $3,545,027 $2,729,323Other revenues 99,130 86,555 85,973Total revenues 4,644,453 3,6<strong>31</strong>,582 2,815,296Costs and ExpensesOperating costs and expenses 3,715,836 2,965,541 2,332,137Depreciation, depletion and amortization <strong>31</strong>6,114 270,159 234,336Asset retirement obligation expense 35,901 42,387 <strong>31</strong>,156Selling and administrative expenses 189,802 143,025 108,525Other operating income:Net gain on disposal or exchange of assets (101,487) (23,829) (32,772)Income from equity affiliates (30,096) (12,399) (2,872)Operating Profit 518,383 246,698 144,786Interest expense 102,939 96,793 98,540Early debt extinguishment costs – 1,751 53,513Interest income (10,641) (4,917) (4,086)Income (Loss) From Continuing Operations BeforeIncome Taxes and Minority Interests 426,085 153,071 (3,181)Income tax provision (benefit) 960 (26,437) (47,708)Minority interests 2,472 1,282 3,035Income From Continuing Operations 422,653 178,226 41,492Loss from discontinued operations, net of income tax benefit of $1,893 – (2,839) –Income Before Accounting Changes 422,653 175,387 41,492Cumulative effect of accounting changes, net of income tax benefit of $6,762 – – (10,144)Net Income $ 422,653 $ 175,387 <strong>31</strong>,348Basic Earnings Per ShareIncome from continuing operations $ 1.62 $ 0.72 $ 0.19Loss from discontinued operations – (0.01) –Cumulative effect of accounting changes – – (0.04)Net income $ 1.62 $ 0.71 $ 0.15Weighted Average Shares Outstanding – Basic 261,519,424 248,732,744 213,638,084Diluted Earnings Per ShareIncome from continuing operations $ 1.58 $ 0.70 $ 0.19Loss from discontinued operations – (0.01) –Cumulative effect of accounting changes – – (0.05)Net income $ 1.58 $ 0.69 $ 0.14Weighted Average Shares Outstanding – Diluted 268,013,476 254,812,632 219,342,512Dividends Declared Per Share $ 0.17 $ 0.13 $ 0.11See accompanying notes to consolidated financial statements52 <strong>Peabody</strong> <strong>Energy</strong>
CONSOLIDATEDBalance SheetsDecember <strong>31</strong>,(Dollars in thousands, except share and per share data) <strong>2005</strong> 2004AssetsCurrent assetsCash and cash equivalents $ 503,278 $ 389,636Accounts receivable, net of allowance for doubtful accounts of $10,853 and $1,361at December <strong>31</strong>, <strong>2005</strong> and 2004, respectively 221,541 193,784Inventories 389,771 323,609Assets from coal trading activities 146,596 89,165Deferred income taxes 9,027 15,461Other current assets 54,4<strong>31</strong> 42,947Total current assets 1,324,644 1,054,602Property, plant, equipment and mine developmentLand and coal interests 4,775,126 4,512,893Buildings and improvements 793,254 718,803Machinery and equipment 1,237,184 883,380Less accumulated depreciation, depletion and amortization (1,627,856) (1,333,645)Property, plant, equipment and mine development, net 5,177,708 4,781,4<strong>31</strong>Investments and other assets 349,654 342,559Total assets $ 6,852,006 $ 6,178,592Liabilities and Stockholders’ EquityCurrent liabilitiesCurrent maturities of long-term debt $ 22,585 $ 18,979Liabilities from coal trading activities 132,373 63,565Accounts payable and accrued expenses 867,965 691,600Total current liabilities 1,022,923 774,144Long-term debt, less current maturities 1,382,921 1,405,986Deferred income taxes 338,488 393,266Asset retirement obligations 399,203 396,022Workers’ compensation obligations 237,574 227,476Accrued postretirement benefit costs 959,222 939,503Other noncurrent liabilities 330,658 <strong>31</strong>5,694Total liabilities 4,670,989 4,452,091Minority interests 2,550 1,909Stockholders’ equityPreferred Stock – $0.01 per share par value; 10,000,000 shares authorized, no shares issued or outstandingas of December <strong>31</strong>, <strong>2005</strong> or 2004 – –Series Common Stock – $0.01 per share par value; 40,000,000 shares authorized, no shares issued or outstandingas of December <strong>31</strong>, <strong>2005</strong> or 2004 – –Series A Junior Participating Preferred Stock – 1,500,000 shares authorized, no shares issued or outstandingas of December <strong>31</strong>, <strong>2005</strong> or 2004 – –Common Stock – $0.01 per share par value; 400,000,000 shares authorized, 263,879,762 shares issued and263,357,402 shares outstanding as of December <strong>31</strong>, <strong>2005</strong> and 150,000,000 shares authorized, 259,658,268 sharesissued and 259,135,908 shares outstanding as of December <strong>31</strong>, 2004 2,638 2,596Additional paid-in capital 1,503,397 1,436,021Retained earnings 729,086 350,968Unearned restricted stock awards (5,943) (459)Accumulated other comprehensive loss (46,795) (60,618)Treasury shares, at cost: 522,360 shares as of December <strong>31</strong>, <strong>2005</strong> and 2004 (3,916) (3,916)Total stockholders’ equity 2,178,467 1,724,592Total liabilities and stockholders’ equity $ 6,852,006 $ 6,178,592See accompanying notes to consolidated financial statements53
CONSOLIDATEDStatements of Cash FlowsYear Ended December <strong>31</strong>,(Dollars in thousands) <strong>2005</strong> 2004 2003Cash Flows From Operating ActivitiesNet income $ 422,653 $ 175,387 $ <strong>31</strong>,348Loss from discontinued operations – 2,839 –Cumulative effect of accounting changes, net of taxes – – 10,144Income from continuing operations 422,653 178,226 41,492Adjustments to reconcile income from continuing operations to net cash provided by operating activities:Depreciation, depletion and amortization <strong>31</strong>6,114 270,159 234,336Deferred income taxes (24,962) (<strong>31</strong>,925) (48,259)Early debt extinguishment costs – 1,751 53,513Amortization of debt discount and debt issuance costs 6,938 8,330 8,158Net gain on disposal or exchange of assets (101,487) (23,829) (32,772)Income from equity affiliates (30,096) (12,399) (2,872)Dividends received from equity affiliates 7,552 13,614 4,781Changes in current assets and liabilities, net of acquisitions:Accounts receivable, net of sale (52,757) (34,649) (21,279)Inventories (67,125) (57,781) (16,805)Net assets from coal trading activities 11,377 (3,583) (22,771)Other current assets (10,769) (1,438) (3,621)Accounts payable and accrued expenses 173,919 66,576 34,423Asset retirement obligations (981) (6,571) (9,563)Workers’ compensation obligations 11,390 10,479 156Accrued postretirement benefit costs 19,719 (32,499) 3,705Contributions to pension plans (7,162) (62,082) (17,490)Other, net 28,436 1,381 (16,271)Net cash provided by operating activities 702,759 283,760 188,861Cash Flows From Investing ActivitiesAdditions to property, plant, equipment and mine development (384,304) (151,944) (156,443)Federal coal lease expenditures (118,364) (114,653) –Purchase of mining and related assets (141,195) – –Additions to advance mining royalties (14,566) (16,239) (14,010)Acquisitions, net – (429,061) (90,000)Investments in joint ventures (2,000) (32,472) (1,400)Proceeds from disposal of assets 76,227 39,339 69,573Net cash used in investing activities (584,202) (705,030) (192,280)Cash Flows From Financing ActivitiesNet change in revolving lines of credit – – (121,584)Proceeds from long-term debt 11,734 700,013 1,102,735Payments of long-term debt (20,198) (482,924) (868,386)Net proceeds from equity offering – 383,125 –Proceeds from stock options exercised 22,573 27,266 <strong>31</strong>,329Proceeds from employee stock purchases 3,009 2,343 1,737Increase (decrease) of securitized interests in accounts receivable 25,000 110,000 (46,400)Payment of debt issuance costs – (12,875) (23,700)Distributions to minority interests (2,498) (1,007) (4,186)Dividends paid (44,535) (32,568) (24,058)Other – <strong>31</strong> 1,111Net cash provided by (used in) financing activities (4,915) 693,404 48,598Effect of exchange rate changes on cash and cash equivalents – – 1,113Net increase in cash and cash equivalents 113,642 272,134 46,292Cash and cash equivalents at beginning of year 389,636 117,502 71,210Cash and cash equivalents at end of year $ 503,278 $ 389,636 $ 117,502See accompanying notes to consolidated financial statements54 <strong>Peabody</strong> <strong>Energy</strong>
CONSOLIDATEDStatements of Changes in Stockholders’ EquityUnearnedAccumulatedAdditional Restricted Other Other TotalCommon Paid-in Stock Employee Comprehensive Retained Treasury Stockholders’(Dollars in thousands) Stock Capital Awards Stock Loans (Loss) Earnings Stock EquityDecember <strong>31</strong>, 2002 $2,096 $ 956,995 $ – $(1,142) $(77,627) $200,859 $ (43) $1,081,138Comprehensive income:Net income – – – – – <strong>31</strong>,348 – <strong>31</strong>,348Foreign currency translation adjustment – – – – 3,138 – – 3,138Decrease in fair value of cash flowshedges (net of $4,694 tax benefit) – – – – (7,041) – – (7,041)Minimum pension liability adjustment(net of $27 tax benefit) – – – – (42) – – (42)Comprehensive income 27,403Dividends paid – – – – – (24,058) – (24,058)Loan repayments – – – 1,111 – – – 1,111Stock options exercised 90 35,245 – – – – – 35,335Income tax benefits from stock optionsexercised – 12,925 – – – – – 12,925Employee stock purchases 4 1,733 – – – – – 1,737Stock grants to non-employee directors – 100 – – – – – 100Employee stock grants – 368 (368) – – – – –Deferred compensation earned – – 10 – – – – 10Shares repurchased – – – – – – (3,644) (3,644)December <strong>31</strong>, 2003 2,190 1,007,366 (358) (<strong>31</strong>) (81,572) 208,149 (3,687) 1,132,057Comprehensive income:Net income – – – – – 175,387 – 175,387Increase in fair value of cash flowhedges (net of $9,945 tax provision) – – – – 14,915 – – 14,915Minimum pension liability adjustment(net of $4,026 tax provision) – – – – 6,039 – – 6,039Comprehensive income 196,341Issuance of common stock in connectionwith equity offering, net of expenses 352 382,773 – – – – – 383,125Dividends paid – – – – – (32,568) – (32,568)Loan repayments – – – <strong>31</strong> – – – <strong>31</strong>Stock options exercised 54 27,621 – – – – – 27,675Income tax benefits from stock optionsexercised – 15,718 – – – – – 15,718Employee stock purchases – 2,343 – – – – – 2,343Employee stock grants – 200 (200) – – – – –Deferred compensation earned – – 99 – – – – 99Shares repurchased – – – – – – (229) (229)December <strong>31</strong>, 2004 2,596 1,436,021 (459) – (60,618) 350,968 (3,916) 1,724,592Comprehensive income:Net income – – – – – 422,653 – 422,653Increase in fair value of cash flowhedges (net of $7,613 tax provision) – – – – 11,421 – – 11,421Minimum pension liability adjustment(net of $1,601 tax provision) – – – – 2,402 – – 2,402Comprehensive income 436,476Dividends paid – – – – – (44,535) – (44,535)Increase in value of equity-basedperformance awards – 4,305 – – – – – 4,305Stock options exercised 36 22,627 – – – – – 22,663Income tax benefits from stockoptions execised – 30,437 – – – – – 30,437Employee stock purchases 2 3,007 – – – – – 3,009Employee stock grants 4 7,000 (7,004) – – – – –Deferred compensation earned – – 1,520 – – – – 1,520December <strong>31</strong>, <strong>2005</strong> $2,638 $1,503,397 $(5,943) $ – $(46,795) $729,086 $(3,916) $2,178,467See accompanying notes to consolidated financial statements55
Notes to Consolidated Financial Statements(1) SUMMARY OF SIGNIFICANT ACCOUNTING POLICIESBasis of PresentationThe consolidated financial statements include the accountsof the Company and its controlled affiliates. All intercompanytransactions, profits, and balances have been eliminated inconsolidation.On January 23, 2006, the Company announced a two-foronestock split on all shares of its common stock payable toshareholders of record at the close of business on February 7,2006. The additional shares were distributed on February 22,2006. The Company had a similar two-for-one stock split onMarch 30, <strong>2005</strong>. All share and per share amounts in theseconsolidated financial statements and related notes hereinreflect the stock splits.Description of BusinessThe Company is engaged in the mining of steam coal forsale primarily to electric utilities and metallurgical coal for saleto industrial customers. The Company’s mining operationsare located in the United States and Australia, and include anequity interest in mining operations in Venezuela. In additionto the Company’s mining operations, the Company markets,brokers and trades coal. The Company is also involved inrelated energy businesses that include participation in thedevelopment of coal-fueled generating plants, coalbed methaneproduction and BTU conversion projects, which are designed toexpand the uses of coal through technologies that convert coalto natural gas, liquid fuels, and hydrogen.New PronouncementsIn March <strong>2005</strong>, the Emerging Issues Task Force (“EITF”)issued EITF Issue No. 04-6, “Accounting for Stripping Costsin the Mining Industry” (“EITF Issue No. 04-6”), which states“that stripping costs incurred during the production phase ofa mine are variable production costs that should be includedin the costs of the inventory produced during the period thatthe stripping costs are incurred.” Advance stripping costsinclude those costs necessary to remove overburden abovean unmined coal seam as part of the surface mining process,and are included as the “work-in-process” component of“Inventories” in the consolidated balance sheets ($245.5 millionand $197.2 million as of December <strong>31</strong>, <strong>2005</strong> and December <strong>31</strong>,2004, respectively - see Note 10). This is consistent with theconcepts embodied in Accounting Research Bulletin No. 43,“Restatement and Revision of Accounting Research Bulletins,”which provides that “the term inventory embraces goodsawaiting sale..., goods in the course of production (work-inprocess),and goods to be consumed directly or indirectlyin production....” At the June 15-16, <strong>2005</strong> EITF meeting, theTask Force clarified that the intended meaning of “inventoryproduced” is “inventory extracted.” Based on this clarification,stripping costs incurred during a period will be attributed onlyto the inventory costs of the coal that is extracted during thatsame period.EITF Issue No. 04-6 is effective for the first reporting periodin fiscal years beginning after December 15, <strong>2005</strong> (January 1,2006 for the Company). At the June <strong>2005</strong> EITF meeting, the TaskForce modified the transition provisions of EITF Issue No. 04-6,indicating that companies that adopt in periods beginningafter June 29, <strong>2005</strong>, may utilize a cumulative effect adjustmentapproach where the cumulative effect adjustment is recordeddirectly to retained earnings in the year of adoption. If theCompany had implemented the cumulative effect adjustmentapproach at December <strong>31</strong>, <strong>2005</strong>, the reduction to retainedearnings, net of tax, would have been $150.6 million. TheCompany adopted EITF Issue No. 04-6 on January 1, 2006.In December 2004, the Financial Accounting StandardsBoard (“FASB”) issued Statement of Financial AccountingStandards (“SFAS”) No. 153, “Exchanges of NonmonetaryAssets - an Amendment of APB Opinion 29,” which becameeffective for fiscal periods beginning after June 15, <strong>2005</strong>.Accounting Principles Board (“APB”) Opinion No. 29,“Accounting for Nonmonetary Transactions,” is based on theprinciple that exchanges of nonmonetary assets should bemeasured based on the fair value of the assets exchangedwith certain exceptions to that general principle. SFAS No. 153eliminates the exception to fair value measurement forexchanges of similar productive assets that previously existedunder APB Opinion No. 29 and replaces it with a generalexception for exchanges that lack commercial substance. TheCompany early adopted SFAS No. 153 on July 1, <strong>2005</strong>, andapplied these provisions to subsequent coal reserve exchanges(see Note 3).On December 16, 2004, the FASB issued SFAS No. 123(revised 2004), “Share-Based Payment” (“SFAS No. 123(R)”),which is a revision of SFAS No. 123, “Accounting for Stock-Based Compensation” (“SFAS No. 123”). SFAS No. 123(R)supersedes APB Opinion No. 25, “Accounting for Stock Issuedto Employees” (“APB Opinion No. 25”) and amends FASBStatement No. 95, “Statement of Cash Flows.” Generally,the approach in SFAS No. 123(R) is similar to the approachdescribed in SFAS No. 123. However, SFAS No. 123(R) requiresall share-based payments to employees, including employeestock options, to be recognized in the income statementbased on their fair values. Pro forma disclosure is no longer analternative. Income tax benefits from stock options exercisedwill be included in financing activities in the statements of cashflows rather than operating activities.In <strong>2005</strong>, the Securities and Exchange Commission deferredthe adoption date of SFAS No. 123(R) to fiscal years beginningafter June 15, <strong>2005</strong>. The Company adopted this standard onJanuary 1, 2006 and used the modified prospective method,in which compensation cost is recognized beginning with theeffective date (a) based on the requirements of SFAS No. 123(R)for all share-based payments granted after the effective dateand (b) based on the requirements of SFAS No. 123 for allawards granted to employees prior to the effective date ofSFAS No. 123(R) that remain unvested on the effective date.Based on stock option grants made in <strong>2005</strong> (and years prior)and currently anticipated for 2006, the Company estimatesit will recognize stock option expense for the year ending56 <strong>Peabody</strong> <strong>Energy</strong>
December <strong>31</strong>, 2006 of $5.6 million, net of taxes. The Companybegan utilizing restricted stock as part of its equity-basedcompensation strategy in January <strong>2005</strong>. Based on the restrictedstock grants made in <strong>2005</strong> and years prior, the Companyrecognized expense related to restricted stock of $1.0 million,net of taxes, in <strong>2005</strong>. Accounting for restricted stock awards isnot affected by the adoption of SFAS No. 123(R).SalesThe Company’s revenue from coal sales is realized andearned when risk of loss passes to the customer. Coal salesare made to the Company’s customers under the terms ofcoal supply agreements, most of which are long-term (greaterthan one year). Under the typical terms of these coal supplyagreements, title and risk of loss transfer to the customer atthe mine or port, where coal is loaded to the rail, barge, oceangoingvessel, truck or other transportation source(s) that serveseach of the Company’s mines. The Company incurs certain“add-on” taxes and fees on coal sales. Coal sales are reportedincluding taxes and fees charged by various federal and stategovernmental bodies.Other RevenuesOther revenues include royalties related to coal leaseagreements, sales agency commissions, farm income, coalbedmethane revenues, property and facility rentals, generationdevelopment activities, net revenues from coal trading activitiesaccounted for under SFAS No. 133, “Accounting for DerivativeInstruments and Hedging Activities” (“SFAS No. 133”), asamended, and contract termination or restructuring payments.Royalty income generally results from the lease or subleaseof mineral rights to third parties, with payments based upona percentage of the selling price or an amount per ton ofcoal produced. Certain agreements require minimum annuallease payments regardless of the extent to which minerals areproduced from the leasehold. The terms of these agreementsgenerally range from specified periods of five to 15 years, orcan be for an unspecified period until all reserves are depleted.Stock CompensationThe Company applies APB Opinion No. 25 and relatedinterpretations in accounting for its equity incentive plans. TheCompany recorded $1.6 million, $0.3 million and $0.4 millionof compensation expense during the years ended December <strong>31</strong>,<strong>2005</strong>, 2004 and 2003, respectively, for stock options andrestricted stock granted. The following table reflects pro formanet income and basic and diluted earnings per share hadcompensation cost been determined for the Company’s nonqualifiedand incentive stock options based on the fair value atthe grant dates consistent with the methodology set forth underSFAS No. 123:Year Ended December <strong>31</strong>,(Dollars in thousands, except per share data) <strong>2005</strong> 2004 2003Net income:As reported $422,653 $175,387 $<strong>31</strong>,348Pro forma 418,704 168,628 22,617Basic earnings per share:As reported $ 1.62 $ 0.71 $ 0.15Pro forma 1.60 0.68 0.11Diluted earnings per share:As reported $ 1.58 $ 0.69 $ 0.14Pro forma 1.56 0.66 0.10These pro forma amounts may not be representative offuture expense amounts since the estimated fair value of stockoptions is amortized to expense over the vesting period, andadditional options may be granted in future years.Compensation expense for awards with graded vestingprovisions is recognized on a straight-line basis.Discontinued OperationsThe Company classifies items within discontinuedoperations in the statement of operations when the operationsand cash flows of a particular component (defined asoperations and cash flows that can be clearly distinguished,operationally and for financial reporting purposes, from the restof the entity) of the Company have been (or will be) eliminatedfrom the ongoing operations of the Company as a result ofa disposal transaction, and the Company will no longer haveany significant continuing involvement in the operations ofthat component. Discontinued operations for the year endedDecember <strong>31</strong>, 2004, reflected a $2.8 million loss, net of taxes,related to the Company’s former Citizens Power subsidiary.Cash and Cash EquivalentsCash and cash equivalents are stated at cost, whichapproximates fair value. Cash equivalents consist of highlyliquid investments with original maturities of three monthsor less.InventoriesMaterials and supplies and coal inventory are valued at thelower of average cost or market. Coal inventory costs includelabor, supplies, equipment, operating overhead and otherrelated costs.Assets and Liabilities from Coal Trading ActivitiesThe Company’s coal trading activities are evaluated underSFAS No. 133. Trading contracts that meet the SFAS No. 133definition of a derivative are accounted for at fair value, whilecontracts that do not qualify as derivatives are accountedfor under the accrual method. Contracts entered into priorto October 25, 2002, were accounted for using the fair valuemethod required by EITF Issue No. 98-10, “Accounting forContracts Involved in <strong>Energy</strong> Trading and Risk ManagementActivities” (“EITF Issue No. 98-10”), which was rescindedby EITF Issue No. 02-3, “Issues Involved in Accounting for57
Derivative Contracts Held for Trading Purposes and ContractsInvolved in <strong>Energy</strong> Trading and Risk Management Activities”effective January 1, 2003. Accordingly, the effect of therescission on non-derivative energy trading contracts enteredinto prior to October 25, 2002 was recorded as a cumulativeeffect of a change in accounting principle in the first quarterof 2003, as discussed in Note 7. This accounting change onlyaffected the timing of the recognition of income or losses oncontracts that do not meet the definition of a derivative, and didnot change the underlying economics or cash flows of thosetransactions.The Company’s trading contracts are reflected at fair valueand are included in “Assets and liabilities from coal tradingactivities” in the consolidated balance sheets as of December <strong>31</strong>,<strong>2005</strong> and 2004. Under EITF Issue No. 02-3, all mark-to-marketgains and losses on energy trading contracts (includingderivatives and hedged contracts) are presented on a netbasis in the statement of operations, even if settled physically.The Company’s consolidated statements of operations reflectrevenues related to all mark-to-market trading contracts on anet basis in “Other revenues.”Property, Plant, Equipment and Mine DevelopmentProperty, plant, equipment and mine development arerecorded at cost. Interest costs applicable to major assetadditions are capitalized during the construction period,including $0.1 million, $0.2 million and $1.2 million for the yearsended December <strong>31</strong>, <strong>2005</strong>, 2004 and 2003, respectively.Expenditures which extend the useful lives of existingplant and equipment are capitalized. Maintenance and repairsare charged to operating costs as incurred. Costs incurred todevelop coal mines or to expand the capacity of operatingmines are capitalized. Costs incurred to maintain currentproduction capacity at a mine and exploration expendituresare charged to operating costs as incurred. Costs to acquirecomputer hardware and the development and/or purchase ofsoftware for internal use are capitalized and depreciated overthe estimated useful lives.Coal reserves are recorded at cost, or at fair value inthe case of acquired businesses. As of December <strong>31</strong>, <strong>2005</strong>and 2004, the net book value of coal reserves totaled$3.7 billion and $3.6 billion, respectively. These amountsincluded $1.8 billion and $1.7 billion at December <strong>31</strong>, <strong>2005</strong> and2004, respectively, attributable to properties where the Companywas not currently engaged in mining operations or leasing tothird parties and, therefore, the coal reserves were not currentlybeing depleted. Included in the book value of coal reservesare mineral rights for leased coal interests and associated withadvance royalties, and the net book value of these mineralrights was $2.1 billion at December <strong>31</strong>, <strong>2005</strong> and 2004.Depletion of coal reserves is computed using the units-ofproductionmethod utilizing only proven and probable reservesin the depletion base. Amortization of advance royaltiesis computed using the units-of-production method. Minedevelopment costs are principally amortized over the estimatedlives of the mines using the straight-line method.Depreciation of plant and equipment (excluding life of mineassets) is computed using the straight-line method over theestimated useful lives as follows:YearsBuilding and improvements 10 to 30Machinery and equipment 3 to 30Leasehold improvementsLife of LeaseIn addition, certain plant and equipment assets associatedwith mining are depreciated using the straight-line methodover the estimated life of the mine, which varies from one to33 years.Investments in Joint VenturesThe Company accounts for its investments in less thanmajority owned corporate joint ventures under either the equityor cost method. The Company currently has no investmentsaccounted for under the cost method. The Company applies theequity method to investments in joint ventures when it has theability to exercise significant influence over the operating andfinancial policies of the joint venture. Investments accountedfor under the equity method are initially recorded at cost, andany difference between the cost of the Company’s investmentand the underlying equity in the net assets of the joint ventureat the investment date is amortized over the lives of the relatedassets that gave rise to the difference. The Company’s prorata share of earnings from joint ventures and basis differenceamortization is reported in the consolidated statement ofoperations in “Income from equity affiliates.” The book value ofthe Company’s equity method investments as of December <strong>31</strong>,<strong>2005</strong> and 2004 was $97.2 million and $83.2 million, respectively,and is reported within “Investments and other assets” in theconsolidated balance sheets.Variable Interest EntitiesThe Company evaluates equity investments in jointventures, notes issued, leases or other contractual relationshipswith third parties to determine whether the joint venture orthird party is a variable interest entity, and if so, whether theCompany’s variable interest in the variable interest entitymakes it the primary beneficiary of the entity, which wouldrequire the entity to be included in the Company’s consolidatedfinancial statements. The Company was not the primarybeneficiary related to any variable interest entity and as aresult did not consolidate any entity under the provisions ofFASB Interpretation 46(R): “Consolidation of Variable InterestEntities, an interpretation of ARB No. 51,” for any of the periodspresented in these consolidated financial statements.Generation Development CostsDevelopment costs related to coal-based electricitygeneration, including expenditures for permitting and licensing,are capitalized at cost under the guidelines in SFAS No. 142,“Goodwill and Other Intangible Assets.” Start-up costs, asdefined in Statement of Position (“SOP”) No. 98-5, “Reportingon the Costs of Start-up Activities,” are expensed as incurred.Development costs of $22.4 million and $16.7 million wererecorded as part of “Investments and other assets” in theconsolidated balance sheets as of December <strong>31</strong>, <strong>2005</strong> and2004, respectively.58 <strong>Peabody</strong> <strong>Energy</strong>
Asset Retirement ObligationsSFAS No. 143, “Accounting for Asset RetirementObligations” (“SFAS No. 143”), which was adopted by theCompany on January 1, 2003 (see Note 7), addresses financialaccounting and reporting for obligations associated with theretirement of tangible long-lived assets and the associated assetretirement costs. The Company’s asset retirement obligation(“ARO”) liabilities primarily consist of spending estimates relatedto reclaiming surface land and support facilities at both surfaceand underground mines in accordance with federal and statereclamation laws as defined by each mining permit.The Company estimates its ARO liabilities for finalreclamation and mine closure based upon detailed engineeringcalculations of the amount and timing of the future cashspending for a third party to perform the required work.Spending estimates are escalated for inflation and thendiscounted at the credit-adjusted risk-free rate. The Companyrecords an ARO asset associated with the discounted liabilityfor final reclamation and mine closure. The obligation andcorresponding asset are recognized in the period in whichthe liability is incurred. The ARO asset is amortized on theunits-of-production method over its expected life and the AROliability is accreted to the projected spending date. As changesin estimates occur (such as mine plan revisions, changes inestimated costs, or changes in timing of the performance ofreclamation activities), the revisions to the obligation and assetare recognized at the appropriate credit-adjusted risk-free rate.The Company also recognizes an obligation forcontemporaneous reclamation liabilities incurred as a resultof surface mining. Contemporaneous reclamation consistsprimarily of grading, topsoil replacement and revegetation ofbackfilled pit areas.Environmental LiabilitiesIncluded in “Other noncurrent liabilities” are accruals forother environmental matters that are recorded in operatingexpenses when it is probable that a liability has been incurredand the amount of the liability can be reasonably estimated.Accrued liabilities are exclusive of claims against thirdparties and are not discounted. In general, costs related toenvironmental remediation are charged to expense.Income TaxesIncome taxes are accounted for using a balance sheetapproach in accordance with SFAS No. 109, “Accounting forIncome Taxes.” The Company accounts for deferred incometaxes by applying statutory tax rates in effect at the date of thebalance sheet to differences between the book and tax basisof assets and liabilities. A valuation allowance is established ifit is “more likely than not” that the related tax benefits will notbe realized. In determining the appropriate valuation allowance,the Company considers projected realization of tax benefitsbased on expected levels of future taxable income, available taxplanning strategies, and the overall deferred tax position.Postretirement Health Care and Life Insurance BenefitsThe Company accounts for postretirement benefits otherthan pensions in accordance with SFAS No. 106 “Employers’Accounting for Postretirement Benefits Other Than Pensions”(“SFAS No. 106”) which requires the cost to provide thebenefits to be accrued over the employees’ period of activeservice. These costs are determined on an actuarial basis.Multi-Employer Benefit PlansThe Company has an obligation to contribute to twoplans established by the Coal Industry Retiree Health BenefitsAct of 1992 - the “Combined Fund” and the “1992 Plan”. TheCombined Fund obligations are accounted for in accordancewith EITF Issue No. 92-13, “Accounting for Estimated Paymentsin Connection with the Coal Industry Retiree Health Benefit Actof 1992,” as determined on an actuarial basis. The 1992 Planqualifies as a multi-employer plan under SFAS No. 106 andexpense is recognized as contributions are made.A third fund, the 1993 Benefit Fund (the “1993 Plan”),was established through collective bargaining and providesbenefits to qualifying retired former employees who retiredafter September 30, 1994, of certain signatory companies whohave gone out of business and have defaulted in providing theirformer employees with retiree medical benefits. Beneficiariescontinue to be added to this fund as employers go out ofbusiness; however, the Company’s liability is limited to itscontractual commitment of $0.50 per hour worked. The 1993Plan qualifies as a multi-employer plan under SFAS No. 106 andexpense is recognized as contributions are made.Pension PlansThe Company sponsors non-contributory defined benefitpension plans which are accounted for in accordance withSFAS No. 87 “Employers’ Accounting for Pensions” (“SFASNo. 87”) which requires the cost to provide the benefits to beaccrued over the employees’ period of active service. Thesecosts are determined on an actuarial basis.The Company also participates in two multi-employerpension plans, the United Mine Workers of America 1950Pension Plan (the “1950 Plan”) and the United Mine Workersof America 1974 Pension Plan (the “1974 Plan”). These plansqualify as multi-employer plans under SFAS No. 87 andexpense is recognized as contributions are made.Postemployment BenefitsThe Company provides postemployment benefits toqualifying employees, former employees and dependentsand accounts for these items on the accrual basis inaccordance with SFAS No. 112 “Employers’ Accountingfor Postemployment Benefits.” Postemployment benefitsinclude workers’ compensation occupational disease which isaccounted for on the actuarial basis over the employees’ periodof active service, workers’ compensation traumatic injury claimswhich are accounted for based on estimated loss rates appliedto payroll and claim reserves determined by independentactuaries and claims administrators, disability income benefitswhich are accrued when a claim occurs and continuationof medical benefits which are recognized when theobligation occurs.DerivativesSFAS No. 133 (as amended) requires the recognition ofall derivatives as assets or liabilities within the consolidatedbalance sheets at fair value. Gains or losses on derivativefinancial instruments designated as fair value hedges arerecognized immediately in the consolidated statements ofoperations, along with the offsetting gain or loss related to theunderlying hedged item.59
Gains or losses on derivative financial instrumentsdesignated as cash flow hedges are recorded as a separatecomponent of stockholders’ equity until settlement (or untilhedge ineffectiveness is determined), whereby gains or lossesare reclassified to the consolidated statements of operationsin conjunction with the recognition of the underlying hedgeditem. To the extent that the periodic changes in the fair valueof the derivatives are not effective, or if the hedge ceases toqualify for hedge accounting, the ineffective portion of theperiodic non-cash changes are recorded in “Operating costsand expenses” in the income statement in the period of thechange. The potential of hedge ineffectiveness is only presentin the design of the hedge relationship in the Company’s cashflow hedges of anticipated fuel purchases as discussed in moredetail in Note 2. During the year ended December <strong>31</strong>, <strong>2005</strong>,the Company recognized approximately $0.1 million of loweroperating costs and expenses related to the ineffectiveness ofits fuel hedges. Hedge ineffectiveness had no effect on resultsof operations for the years ended December <strong>31</strong>, 2004 or 2003.Use of Estimates in the Preparation of the ConsolidatedFinancial StatementsThe preparation of financial statements in conformity withgenerally accepted accounting principles requires managementto make estimates and assumptions that affect the reportedamounts of assets and liabilities and disclosure of contingentassets and liabilities at the date of the financial statementsand reported amounts of revenues and expenses duringthe reporting period. Actual results could differ fromthose estimates.In particular, the Company has significant long-termliabilities relating to retiree health care, work-related injuriesand illnesses and defined pension plans. Each of these liabilitiesis actuarially determined and the Company uses variousactuarial assumptions, including the discount rate and futurecost trends, to estimate the costs and obligations for theseitems. In addition, the Company has significant asset retirementobligations that involve estimations of costs to remediatemining lands and the timing of cash outlays for such costs. Ifthese assumptions do not materialize as expected, actual cashexpenditures and costs incurred could differ materially fromcurrent estimates. Moreover, regulatory changes could increasethe obligation to satisfy these or additional obligations.Finally, in evaluating the valuation allowance related tothe Company’s deferred tax assets, the Company takes intoaccount various factors, including the expected level of futuretaxable income and available tax planning strategies. If actualresults differ from the assumptions made in the evaluation ofthe valuation allowance, the Company may record a change invaluation allowance through income tax expense in the periodsuch determination is made.Impairment of Long-Lived AssetsThe Company records impairment losses on long-livedassets used in operations when events and circumstancesindicate that the assets might be impaired and theundiscounted cash flows estimated to be generated by thoseassets under various assumptions are less than the carryingamounts of those assets. Impairment losses are measured bycomparing the estimated fair value of the impaired asset to itscarrying amount. There were no impairment lossesrecorded during the periods covered by the consolidatedfinancial statements.Foreign Currency TranslationFor the Company’s foreign subsidiaries where thefunctional currency is the U.S. dollar, monetary assets andliabilities are translated at year-end exchange rates whilenon-monetary items are translated at historical rates. Incomeand expense accounts are translated at the average ratesin effect during the year, except for those expenses relatedto balance sheet amounts that are remeasured at historicalexchange rates. The Company has foreign subsidiaries whosefunctional currency is the U.S. dollar during the years endedDecember <strong>31</strong>, <strong>2005</strong> and 2004. Gains and losses from foreigncurrency remeasurement are included in the consolidatedstatements of operations. Gains and losses from foreigncurrency remeasurement did not have a material impact onthe Company’s consolidated financial position or results ofoperations for the years ended December <strong>31</strong>, <strong>2005</strong> or 2004.The Company had foreign subsidiaries whose functionalcurrency was the local currency during the year endedDecember <strong>31</strong>, 2003. For the Company’s foreign subsidiarieswhose functional currency is the local currency, all assets andliabilities are translated at current exchange rates. Consolidatedstatements of operations accounts are translated at an averagerate for each period. Resulting translation adjustments arereported as a component of comprehensive income.ReclassificationsCertain amounts in prior periods have been reclassifiedto conform with the report classifications of the year endedDecember <strong>31</strong>, <strong>2005</strong>, with no effect on previously reported netincome or stockholders’ equity.(2) RISK MANAGEMENT AND DERIVATIVEFINANCIAL INSTRUMENTSThe Company is exposed to various types of risk in thenormal course of business, including fluctuations in commodityprices, interest rates and foreign currency exchange rates.These risks are actively monitored to ensure compliance withthe risk management policies of the Company. In most cases,commodity price risk (excluding coal trading activities) relatedto the sale of coal is mitigated through the use of long-term,fixed-price contracts rather than financial instruments, whilecommodity price risk related to materials used in productionis managed through the use of fixed price contracts andderivatives. Interest rate and foreign currency exchange riskare managed through the use of forward contracts, swapsand options. The Company’s usage of interest rate swaps isdiscussed in Note 14.Trading ActivitiesThe Company performs a value at risk analysis ofits trading portfolio, which includes over-the-counter andbrokerage trading of coal. The use of value at risk allowsmanagement to quantify, in dollars, on a daily basis, the pricerisk inherent in its trading portfolio. The Company’s value at riskmodel is based on the industry standard variance/co-varianceapproach. This captures exposure related to both option and60 <strong>Peabody</strong> <strong>Energy</strong>
forward positions. During the year ended December <strong>31</strong>, <strong>2005</strong>,the low, high, and average values at risk for the Company’s coaltrading portfolio were $1.2 million, $3.9 million and $2.3 million,respectively. Further discussion of the Company’s coal tradingassets and liabilities is included in Note 4.The Company also monitors other types of risk associatedwith its coal trading activities, including credit, market liquidityand counterparty nonperformance.Commodity Price RiskIn addition to the derivatives related to trading activities,the Company enters contracts to manage its exposure to pricevolatility of diesel fuel. As of December <strong>31</strong>, <strong>2005</strong>, the Companyhad derivative contracts designated as cash flow hedges withnotional amounts outstanding totaling 68.9 million gallons, withmaturities extending through 2007. The consolidated balancesheet as of December <strong>31</strong>, <strong>2005</strong>, reflects unrealized gains onthe cash flow hedges of $33.9 million, which is recordednet of a $13.5 million tax provision, in other comprehensiveincome (see Note 21). During <strong>2005</strong>, the Company recognizedapproximately $0.1 million of lower operating costs andexpenses related to the ineffectiveness of its diesel fuel hedges.Hedge ineffectiveness had no effect on results of operations forthe years ended December <strong>31</strong>, 2004 and 2003.Ineffectiveness is inherent in hedging diesel fuelwith derivative positions based on other crude oil relatedcommodities. Due to the volatility in markets for crude oil, andcrude oil related products, and the current refining spreadsthat have widened the price spread between crude oil andother petroleum distillates (such as diesel fuel), the Companyis unable to predict the amount of ineffectiveness in futureperiods, including the loss of hedge accounting (which couldbe determined on a derivative by derivative basis or in theaggregate), which may result in increased volatility in theCompany’s results.The notional amounts outstanding of 68.9 million gallonsincluded derivative swap contracts for 44.5 million gallonsof heating oil and 24.4 million gallons of crude oil that weredesignated as cash flow hedges of future anticipated diesel fuelpurchases as of December <strong>31</strong>, <strong>2005</strong>. The heating oil contractsare used to hedge fuel purchases in the Company’s Easternmining operations and the crude oil derivatives are usedto hedge fuel purchases in the Company’s Western miningoperations. Hedge ineffectiveness is present in the designof both of these hedge relationships since diesel fuel pricesare not perfectly correlated with either heating oil orcrude oil prices.Despite the ineffectiveness present in the hedgerelationships, very little ineffectiveness is recognized in theCompany’s statements of operations, due to two factors. First,the Company’s contract for physical fuel purchases hedgedwith heating oil derivatives are priced based on the derivativecontract (adjusted for a fixed transportation differential),resulting in little ineffectiveness. Second, the crude oil hedges,which have more ineffectiveness present, are nearly all in an“underhedge” position, where change in the fair value of thederivative is less than the change in the fair value of the hedgeditem. Under SFAS No. 133, ineffectiveness in cash flow hedgesis only recognized in the income statement in cases where thederivative has changed in value more than the hedged item.Credit RiskThe Company’s concentration of credit risk is substantiallywith energy producers and marketers and electric utilities,although it also has exposure to international steel producers,brokerage sources and trading counterparties. The Company’spolicy is to independently evaluate each customer’screditworthiness prior to entering into transactions and toconstantly monitor the credit extended. In the event that theCompany engages in a transaction with a counterparty thatdoes not meet its credit standards, the Company may protectits position by requiring the counterparty to provide appropriatecredit enhancement.When appropriate the Company has taken steps to reducethe Company’s credit exposure to customers or counterpartieswhose credit has deteriorated and who may pose a higher risk,as determined by the Company’s credit management function,of failure to perform under their contractual obligations. Thesesteps include obtaining letters of credit or cash collateral,requiring prepayments for shipments or the creation ofcustomer trust accounts held for the Company’s benefit to fundthe payment for coal under existing coal supply agreements.To reduce the Company’s credit exposure related toits trading and brokerage activities, the Company seeks toenter into netting agreements with counterparties that permitthe Company to offset receivables and payables with suchcounterparties. Counterparty risk with respect to interestrate swap and foreign currency forwards transactions is notconsidered to be significant based upon the creditworthiness ofthe participating financial institutions.Foreign Currency RiskThe Company utilizes currency forwards to hedge currencyrisk associated with anticipated Australian dollar expenditures.As of December <strong>31</strong>, <strong>2005</strong>, the Company had forward contractsdesignated as cash flow hedges with notional amountsoutstanding totaling A$915.8 million, with maturities extendingthrough 2008. The consolidated balance sheet as of December <strong>31</strong>,<strong>2005</strong>, reflects unrealized losses on the cash flow hedges of$3.8 million, which is recorded net of a $1.5 million tax benefit,in other comprehensive income (see Note 21).EmployeesAs of December <strong>31</strong>, <strong>2005</strong>, the Company and itssubsidiaries had approximately 8,300 employees. As ofDecember <strong>31</strong>, <strong>2005</strong>, approximately 39% of the Company’shourly employees were represented by organized labor unionsand generated 19% of the <strong>2005</strong> coal production. Relationswith its employees and, where applicable, organized labor areimportant to the Company’s success.In <strong>2005</strong>, the Company opened training centers in theeastern and western regions of the United States underits “Workforce of the Future” initiative. Due to the currentemployee demographics, a significant portion of theCompany’s current hourly employees will retire over the nextdecade. The training centers are educating the Company’sworkforce, particularly the most recent hires, in rigorous safetystandards and the latest in mining techniques and equipment,and the centers serve as centers for dissemination of miningbest practices across all of the Company’s operations. Thetraining efforts exceed minimum government standards forsafety and technical expertise with the intent of developing andretaining a world-class workforce.61
United StatesThe United Mine Workers of America representedapproximately 30% of the Company’s subsidiaries’ hourlyemployees, who generated 14% of the Company’s domesticproduction during the year ended December <strong>31</strong>, <strong>2005</strong>. Anadditional 6% of the hourly employees are represented bylabor unions other than the United Mine Workers of America(“UMWA”). These employees generated 2% of the Company’sproduction during the year ended December <strong>31</strong>, <strong>2005</strong>. Hourlyworkers at the Company’s mines in Arizona and one of itsmines in Colorado are represented by the UMWA under theWestern Surface Agreement of 2000, which is effective throughSeptember 1, 2007. Union labor east of the Mississippi Riveris primarily represented by the UMWA and the majority ofunion mines are subject to the National Bituminous Coal WageAgreement. The current five-year labor agreement was ratifiedin December 2001 and is effective through December <strong>31</strong>, 2006.AustraliaThe Australian coal mining industry is highly unionizedand the majority of workers employed at the Company’sAustralian mining operations are members of trade unions.The Construction Forestry Mining and <strong>Energy</strong> Union(“CFMEU”) represents the Australian mining operation’s hourlyproduction employees. The Australian hourly employees areapproximately 4% of the Company’s hourly workforce andgenerated 4% of the total production in the year endedDecember <strong>31</strong>, <strong>2005</strong>. Negotiations are underway to renewthe labor agreement at the Wilkie Creek Mine, which expiresin June 2006. The Eaglefield Mine operates under a laboragreement that expires in May 2007. The Burton and NorthGoonyella Mines operate under agreements due to expire in 2008.(3) SIGNIFICANT PROPERTY TRANSACTIONSIn the first quarter of <strong>2005</strong>, the Company purchasedmining assets from Lexington Coal Company for $61.0 million.The purchased assets included $2.5 million of materials andsupplies that were recorded in “Inventories” in the consolidatedbalance sheet. The remaining purchased assets consisted ofapproximately 70 million tons of reserves, preparation plants,facilities and mining equipment that were recorded in “Property,plant, equipment and mine development” in the consolidatedbalance sheet. The Company is using the acquired assets toopen a new mine that is expected to produce 2 to 3 milliontons per year, after it reaches full capacity, and to provide othersynergies to existing properties. The new mine, which beganproduction early in the third quarter, will supply coal under anew agreement with terms that can be extended through 2015(and a minimum term through the end of 2008). The Companyalso recorded $21.6 million for the estimated asset retirementobligations associated with the acquired assets.In the third quarter of <strong>2005</strong>, the Company exchangedcertain idle steam coal reserves for steam and metallurgicalcoal reserves as part of a contractual dispute settlement.Under the settlement, the Company received $10.0 millionin cash, a new coal supply agreement that partially replacedthe disputed coal supply agreement, and exchanged the idlesteam coal reserves. As a result of the final settlement andbased on the fair values of the items exchanged in the overallsettlement transaction, the Company recorded net contractlosses of $4.0 million and a gain on assets exchanged of$37.4 million. The fair value of assets exchanged exceeded thebook value by $33.4 million, a non-cash addition which is notincluded in “Additions to property, plant, equipment and minedevelopment” in the consolidated statement of cash flows.In the fourth quarter of <strong>2005</strong>, the Company acquired rail,loadout and surface facilities as well as other mining assetsfrom another major coal producer for $84.7 million andexchanged 60 million ton blocks of leased coal reserves in thePowder River Basin. The Company will utilize these reservesand infrastructure to accelerate the development of a newmine, which will include adjoining Company-leased reserves.(4) ASSETS AND LIABILITIES FROM COALTRADING ACTIVITIESThe Company’s coal trading portfolio included forwardcontracts as of December <strong>31</strong>, <strong>2005</strong>, and included forward,futures, and options contracts as of December <strong>31</strong>, 2004.The fair value of coal trading derivatives and related hedgecontracts as of December <strong>31</strong>, <strong>2005</strong> and 2004 is set forth below:December <strong>31</strong>, <strong>2005</strong> December <strong>31</strong>, 2004(Dollars in thousands) Assets Liabilities Assets LiabilitiesForward contracts $146,596 $1<strong>31</strong>,988 $89,042 $60,914Other – 385 123 2,651Total $146,596 $132,373 $89,165 $63,565Ninety-nine percent of the contracts in the Company’strading portfolio as of December <strong>31</strong>, <strong>2005</strong>, were valued utilizingprices from over-the-counter market sources, adjusted for coalquality and traded transportation differentials, and one percentof the Company’s contracts were valued based on similarmarket transactions. As of December <strong>31</strong>, <strong>2005</strong>, the timing ofthe estimated future realization of the value of the Company’strading portfolio was as follows:Year of ExpirationPercentage of Portfolio2006 76%2007 23%2008 1%100%At December <strong>31</strong>, <strong>2005</strong>, 42% of the Company’s creditexposure related to coal trading activities was with investmentgrade counterparties and 58% was with non-investment gradecounterparties, which were primarily other coal producers. TheCompany’s coal trading operations traded 36.2 million tons,33.4 million tons and 40.0 million tons for the years endedDecember <strong>31</strong>, <strong>2005</strong>, 2004, and 2003, respectively.62 <strong>Peabody</strong> <strong>Energy</strong>
(5) ACCOUNTS RECEIVABLE SECURITIZATIONThe Company has established an accounts receivablesecuritization program through its wholly-owned, bankruptcyremotesubsidiary (“Seller”). Under the program, the Companycontributes undivided interests in a pool of eligible tradereceivables to the Seller, which then sells, without recourse,to a multi-seller, asset-backed commercial paper conduit(“Conduit”). Purchases by the Conduit are financed withthe sale of highly rated commercial paper. The Companyutilizes proceeds from the sale of its accounts receivable asan alternative to other forms of debt, effectively reducing itsoverall borrowing costs. The funding cost of the securitizationprogram was $2.5 million, $1.7 million and $2.3 million for theyears ended December <strong>31</strong>, <strong>2005</strong>, 2004 and 2003, respectively.The securitization program is currently scheduled to expire inSeptember 2009.The securitization transactions have been recorded assales, with those accounts receivable sold to the Conduitremoved from the consolidated balance sheets. The amount ofundivided interests in accounts receivable sold to the Conduitwas $225.0 million and $200.0 million as of December <strong>31</strong>, <strong>2005</strong>and 2004, respectively.The Seller is a separate legal entity whose assets areavailable first and foremost to satisfy the claims of its creditors.Eligible receivables, as defined in the securitization agreement,consist of trade receivables from most of the Company’sdomestic subsidiaries, and are reduced for certain itemssuch as past due balances and concentration limits. Of theeligible pool of receivables contributed to the Seller, undividedinterests in only a portion of the pool are sold to the Conduit.The Company (the Seller) continues to own $69.7 million ofreceivables as of December <strong>31</strong>, <strong>2005</strong>, that represents collateralsupporting the securitization program. The Seller’s interest inthese receivables is subordinate to the Conduit’s interest in theevent of default under the securitization agreement.If the Company defaulted under the securitizationagreement or if its pool of eligible trade receivables decreasedsignificantly, the Company could be prohibited from selling anyadditional receivables in the future under the agreement.(6) BUSINESS COMBINATIONSThe results of operations for each of the acquired entities(discussed below) are included in the Company’s consolidatedresults of operations from the effective date of each acquisition.Except for the RAG Coal International AG acquisitions, hadthe acquired entities’ results of operations been included inthe Company’s results of operations since January 1, 2003,there would have been no material effect on the Company’sconsolidated statements of operations, financial condition orcash flows.RAG Coal International AGOn April 15, 2004, the Company purchased, through twoseparate agreements, all of the equity interests in three coaloperations from RAG Coal International AG. The combinedpurchase price, including related costs and fees, of$442.2 million was funded from the Company’s equity anddebt offerings as discussed in Notes 14 and 19. The purchasesincluded two mines in Queensland, Australia that collectivelyproduce 6 to 7 million tons per year of metallurgical coaland the Twentymile Mine in Colorado, which produces 8 to9 million tons per year of steam coal with a planned productionexpansion up to 12 million tons per year by 2008. The resultsof operations of the two mines in Queensland, Australia areincluded in the Company’s Australian Mining Operationssegment and the results of operations of the Twentymile Mineare included in the Company’s Western U.S. Mining Operationssegment from the April 15, 2004, purchase date. The acquisitionwas accounted for as a purchase.The purchase accounting allocations related tothe acquisition have been finalized and recorded in theaccompanying consolidated financial statements as of, andfor periods subsequent to, April 15, 2004. The following tablesummarizes the fair values of the assets acquired and theliabilities assumed at the date of acquisition:(Dollars in thousands)Accounts receivable $ 46,639Materials and supplies 5,669Coal inventory 11,543Other current assets 6,234Property, plant, equipment and mine development, net 463,567Accounts payable and accrued expenses (48,688)Other noncurrent assets and liabilities, net (63,699)Total purchase price, net of cash received of $20,914 $421,265In connection with the acquisition of the assets of theAustralian mines and the Twentymile Mine, the Companyacquired contract based intangibles consisting solely of coalsupply agreement obligations (customer contracts) that wereunfavorable based upon current market prices for similar coalas of April 15, 2004. As required by SFAS No. 141, “BusinessCombinations,” these below market obligations were fairvalued as part of the purchase price allocation and recorded asliabilities. The liabilities were amortized as the coal was shippedas follows:Opening Amortization for the Net BookBalance at Year Ended Dec. <strong>31</strong>, Value atContractual Obligation April 15, Dec. <strong>31</strong>,(Dollars in thousands) 2004 2004 <strong>2005</strong> <strong>2005</strong>US $35,285 $ (9,472) $(10,560) $15,253Foreign 11,483 (10,840) (643) –Total $46,768 $(20,<strong>31</strong>2) $(11,203) $15,25363
Estimated amortization (to income) for the next five yearsis as follows:Year Ended(Dollars in thousands) December <strong>31</strong>,2006 $ 7,1112007 6,5042008 1,0202009 6182010 –Total $15,253The following unaudited pro forma financial informationpresents the combined results of operations of the Companyand the operations acquired from RAG Coal International AG,on a pro forma basis, as though the companies had beencombined as of the beginning of each period presented.The pro forma financial information does not necessarilyreflect the results of operations that would have occurredhad the Company and the operations acquired from RAGCoal International AG constituted a single entity during thoseperiods:Year Ended December <strong>31</strong>,(Dollars in thousands, except per share data) 2004* 2003Revenues:As reported $3,6<strong>31</strong>,582 $2,815,296Pro forma 3,756,944 3,206,002Income before accounting changes:As reported $ 175,387 $ 41,492Pro forma 172,746 89,328Net income:As reported $ 175,387 $ <strong>31</strong>,348Pro forma 172,746 79,184Basic earnings per share – net income:As reported $ 0.71 $ 0.15Pro forma 0.67 0.32Diluted earnings per share – net income:As reported $ 0.69 $ 0.14Pro forma 0.66 0.<strong>31</strong>* During the first quarter of 2004, prior to the Company’s acquisition, the Australian undergroundmine acquired by the Company in April 2004 experienced a roof collapse on a portion of theactive mine face, resulting in the temporary suspension of mining activities. Due to the inabilityto ship during a portion of this downtime, costs to return the mine to operations and shippinglimits imposed as the result of unrelated restrictions of capacity at a third party loading facility, theAustralian operation experienced a pro forma net loss in the quarter immediately prior to acquisition.Dodge Hill Holding JV, LLCOn December 29, 2004, the Company purchased theremaining 55% interest in Dodge Hill Holding JV, LLC for$7.0 million of assumed debt that was repaid immediatelyupon closing, $2.8 million of cash and contingent earn-outpayments based on annual and cumulative EBIT (as defined inthe purchase agreement) through 2007. Dodge Hill Holding JV,LLC operates an underground operation located in Kentuckywhich mined 1.2 million tons during each of the years endedDecember <strong>31</strong>, <strong>2005</strong> and 2004. The acquisition was accountedfor as a purchase.Carbones del GuasareOn December 2, 2004, the Company completed theacquisition of a 25.5% equity interest in Carbones del Guasare,S.A., from RAG Coal International AG for a net purchase priceof $32.5 million. Carbones del Guasare, a joint venture thatincludes Anglo American plc and a Venezuelan governmentalpartner, operates the Paso Diablo surface mine in northwesternVenezuela, which produces approximately 7 million tons peryear of steam coal for electricity generators and steel producersprimarily in North America and Europe. The Company accountedfor the purchase under the equity method of accounting.(7) CUMULATIVE EFFECT OF ACCOUNTING CHANGESOn January 1, 2003, the Company adopted SFAS No. 143,which addresses accounting and reporting for obligationsassociated with the retirement of tangible long-lived assetsand the associated asset retirement costs.Pursuant to the January 1, 2003 adoption of SFAS No. 143,the Company:• recognized a credit to income during the first quarterof 2003 of $9.1 million, net of taxes, for the cumulativeeffect of the accounting change;• increased total liabilities by $0.5 million to record theasset retirement obligations;• increased property, plant and equipment by$12.1 million to add incremental asset retirementcosts to the carrying amount of the Company’smine properties and investments and other assetsby $6.5 million to reflect the incremental amount ofreclamation obligations recoverable from third parties;and• increased accumulated depreciation, depletion andamortization by $2.9 million for the amount of expensethat would have been recognized in prior periods.Adopting SFAS No. 143 had no impact on the Company’sreported cash flows. The Company’s reclamation liabilities areunfunded.On October 25, 2002, the EITF rescinded EITF Issue No. 98-10,and as a result, trading contracts entered into prior to October 25,2002, that did not meet the definition of a derivative underSFAS No. 133 were no longer accounted for on a fair valuebasis, effective January 1, 2003. In the first quarter of 2003, theCompany recorded a cumulative effect charge in the statementof operations of $20.2 million, net of income taxes, to reversethe unrealized gains and losses on non-derivative energytrading contracts recorded prior to December <strong>31</strong>, 2002.64 <strong>Peabody</strong> <strong>Energy</strong>
Effective January 1, 2003, the Company changed itsmethod of amortizing actuarial gains and losses related to netperiodic postretirement benefit costs. The Company previouslyamortized actuarial gains and losses using a 5% corridor withan amortization period of three years. Under the new method,the corridor has been eliminated and all actuarial gains andlosses are now amortized over the average remaining serviceperiod of active plan participants, which was estimated at9.26 years. The Company considers this method preferablein that the elimination of the corridor allows a closerapproximation of the fair value of the liability for postretirementbenefit costs, and the amortization of actuarial gains and lossesover the average remaining service period provides a bettermatching of the cost of the associated liability over the workinglife of the active plan participants. As a result of this change, theCompany recognized a $0.9 million, net of taxes, cumulativeeffect gain in the first quarter of 2003.The effect of the accounting changes noted above for theyear ended December <strong>31</strong>, 2003, was to increase income beforeaccounting changes by $20.4 million, or $0.09 per dilutedshare, net of income taxes. The cumulative effect charge of$10.1 million (net of income tax benefit of $6.8 million) to applyretroactively the new methods described above was includedin results of operations for the year ended December <strong>31</strong>,2003. Below are pro forma net income and earnings per shareresults for the Company assuming the new methods had beenretroactively applied:(Dollars in thousands, except per share data) Year Ended December <strong>31</strong>, 2003Net income:As reported $<strong>31</strong>,348Pro forma 41,492Basic earnings per share:As reported $ 0.15Pro forma 0.19Diluted earnings per share:As reported $ 0.14Pro forma 0.19(8) SHELF REGISTRATION STATEMENTOn May 9, <strong>2005</strong>, the Company filed a shelf registrationstatement on Form S-3 with the SEC, which was declaredeffective in June <strong>2005</strong>. Under this universal shelf registrationstatement, the Company has the capacity to offer and sellfrom time to time up to an aggregate maximum of $3 billionof securities, including common stock, preferred stock, debtsecurities, warrants and units. As of December <strong>31</strong>, <strong>2005</strong>, nosecurities had been issued under the universal shelf registrationstatement, which remains effective.(9) EARNINGS PER SHAREA reconciliation of weighted-average shares outstandingfollows:Year Ended December <strong>31</strong>,<strong>2005</strong> 2004 2003Weighted-average sharesoutstanding – basic 261,519,424 248,732,744 213,638,084Dilutive impact of stockoptions, restrictedstock units andperformance units 6,494,052 6,079,888 5,704,428Weighted-average sharesoutstanding – diluted 268,013,476 254,812,632 219,342,512For the years ended December <strong>31</strong>, 2004 and 2003,respectively, options for three thousand and 0.2 million shareswere excluded from the diluted earnings per share calculationsfor the Company’s common stock because they were antidilutive.In addition, the Company granted options to purchase0.5 million shares of common stock, 0.5 million shares ofrestricted stock and 0.1 million performance units (that willultimately be settled in Company common stock) in January 2006.(10) INVENTORIESInventories consisted of the following:December <strong>31</strong>,(Dollars in thousands) <strong>2005</strong> 2004Materials and supplies $ 65,942 $ 57,467Raw coal 14,033 17,590Advance stripping 245,522 197,225Saleable coal 64,274 51,327Total $389,771 $323,609Materials and supplies and coal inventory are valued atthe lower of average cost or market. Raw coal represents coalstockpiles that may be sold in current condition or may befurther processed prior to shipment to a customer. Advancestripping consists of the costs to remove overburden abovean unmined coal seam as part of the surface mining process.These costs include labor, supplies, equipment costs andoperating overhead, and are charged to operations as coal fromthe seam is sold. Effective January 1, 2006, and as discussedin Note 1, advance stripping costs included in inventories atDecember <strong>31</strong>, <strong>2005</strong>, will no longer be included as a separatecomponent of inventory.65
(11) LEASESThe Company leases equipment and facilities undervarious noncancelable lease agreements. Certain leaseagreements require the maintenance of specified ratiosand contain restrictive covenants which limit indebtedness,subsidiary dividends, investments, asset sales and otherCompany actions. Rental expense under operating leaseswas $108.6 million, $108.1 million and $106.8 million for theyears ended December <strong>31</strong>, <strong>2005</strong>, 2004 and 2003, respectively.The net book value of property, plant, equipment and minedevelopment assets under capital leases was $1.5 million and$1.4 million as of December <strong>31</strong>, <strong>2005</strong> and 2004, respectively.The Company also leases coal reserves under agreementsthat require royalties to be paid as the coal is mined. Certainagreements also require minimum annual royalties to be paidregardless of the amount of coal mined during the year. Totalroyalty expense was $288.1 million, $233.9 million and$183.5 million for the years ended December <strong>31</strong>, <strong>2005</strong>, 2004and 2003, respectively.A substantial amount of the coal mined by the Companyis produced from mineral reserves leased from the owner.One of the major lessors is the U.S. government, from whichthe Company leases substantially all of the coal it mines inWyoming and Colorado under terms set by Congress andadministered by the U.S. Bureau of Land Management. Theterms of these leases are generally for an initial term of ten yearsbut may be extended by diligent development and mining ofthe reserve until all economically recoverable reserves aredepleted. The Company has met the diligent developmentrequirements for substantially all of these federal leases eitherdirectly through production or by including the lease as apart of a logical mining unit with other leases upon whichdevelopment has occurred. <strong>Annual</strong> production on these federalleases must total at least 1.0% of the original amount of coal inthe entire logical mining unit. In addition, royalties are payablemonthly at a rate of 12.5% of the gross realization from thesale of the coal mined using surface mining methods and at arate of 8.0% of the gross realization for coal produced usingunderground mining methods. The Company also leases thecoal reserves at its Arizona mines from The Navajo Nation andthe Hopi Tribe under leases that are administered by the U.S.Department of the Interior. These leases expire upon exhaustionof the leased reserves or upon the permanent ceasing of allmining activities on the related reserves as a whole. The royaltyrates are also generally based upon a percentage of the grossrealization from the sale of coal. These rates are subject toredetermination every ten years under the terms of the leases.The remainder of the leased coal is generally leased from stategovernments, land holding companies and various individuals.The duration of these leases varies greatly. Typically, the leaseterms are automatically extended as long as active miningcontinues. Royalty payments are generally based upon aspecified rate per ton or a percentage of the gross realizationfrom the sale of the coal.Future minimum lease and royalty payments as ofDecember <strong>31</strong>, <strong>2005</strong>, are as follows:Year Ended December <strong>31</strong> Capital Operating Coal(Dollars in thousands) Leases Leases Reserves2006 $ 790 $ 84,0<strong>31</strong> $203,8402007 716 77,176 201,3542008 47 62,729 197,0692009 – 42,869 138,8122010 – 32,566 11,1842011 and thereafter – 103,506 44,094Total minimum lease payments $1,553 $402,877 $796,353Less interest 24Present value of minimumcapital lease payments $1,529On December 19, 2002, the Company entered into atransaction with Penn Virginia Resource Partners, L.P. (“PVR”)whereby the Company sold 120 million tons of coal reservesin exchange for $72.5 million in cash and 2.76 million units, or15%, of the PVR master limited partnership. The Company’ssubsidiaries leased back the coal and pay royalties as the coalis mined. No gain or loss was recorded at the inception ofthis transaction.In <strong>2005</strong>, 2004 and 2003, the Company sold 0.838 million,0.775 million and 1.15 million, respectively, of the PVR unitsreceived in the December 2002 transaction. As of December <strong>31</strong>,<strong>2005</strong>, the Company had no remaining ownership in PVR. Thesales were accounted for under SFAS No. 66, “Sales of RealEstate,” and gains of $<strong>31</strong>.1 million, $15.8 million and $7.6 millionwere recognized in the years ended December <strong>31</strong>, <strong>2005</strong>, 2004and 2003, respectively. The remaining deferred gain from thesales of the reserves and units of $16.6 million is intended toprovide for the Company’s potential exposure to loss resultingfrom its continuing involvement in the properties and will beamortized over the minimum term of the leases. The Companyaccounted for its investment in PVR under the equity method ofaccounting, under the provisions of SOP No. 78-9, “Accountingfor Investments in Real Estate Ventures.”As of December <strong>31</strong>, <strong>2005</strong>, certain of the Company’s leaseobligations were secured by outstanding surety bonds andletters of credit totaling $281.4 million. As of December <strong>31</strong>,<strong>2005</strong>, the covenants under certain lease agreements of one ofthe Company’s subsidiaries required a minimum consolidatedtangible net worth (as defined in the agreement) of not lessthan $500.0 million.66 <strong>Peabody</strong> <strong>Energy</strong>
(12) ACCOUNTS PAYABLE AND ACCRUED EXPENSESAccounts payable and accrued expenses consisted ofthe following:December <strong>31</strong>,(Dollars in thousands) <strong>2005</strong> 2004Trade accounts payable $348,320 $273,274Accrued taxes other than income 111,997 98,208Accrued payroll and related benefits 110,675 74,907Accrued health care 78,523 84,286Workers’ compensation obligations 34,<strong>31</strong>2 41,436Other accrued benefits 21,939 17,025Accrued royalties 50,344 23,517Accrued environmental 23,619 15,095Income taxes payable – Australia 23,409 1,658Accrued interest 21,260 21,304Other accrued expenses 43,567 40,890Total accounts payable andaccrued expenses $867,965 $691,600Total income tax provision (benefit) consisted ofthe following:Year Ended December <strong>31</strong>,(Dollars in thousands) <strong>2005</strong> 2004 2003Current:U.S. federal $ – $ 655 $ –Non U.S. 25,622 4,533 251State 300 300 300Deferred:Total current 25,922 5,488 551U.S. federal (18,475) (33,275) (46,2<strong>31</strong>)Non U.S. 22,997 (328) –State (29,484) 1,678 (2,028)Total deferred (24,962) (<strong>31</strong>,925) (48,259)Total provision (benefit) $ 960 $(26,437) $(47,708)The income tax rate differed from the U.S. federal statutoryrate as follows:(13) INCOME TAXESIncome (loss) before income taxes, minority interests anddiscontinued operations consisted of the following:Year Ended December <strong>31</strong>,(Dollars in thousands) <strong>2005</strong> 2004 2003U.S. $253,329 $118,076 $ 1,734Non U.S. 172,756 34,995 (4,915)Total $426,085 $153,071 $(3,181)Year Ended December <strong>31</strong>,(Dollars in thousands) <strong>2005</strong> 2004 2003Federal statutory rate $ 149,130 $ 53,575 $ (1,113)Depletion (59,412) (43,488) (34,436)Foreign earnings rate differential (12,279) (8,043) (965)State income taxes, net ofU.S. federal tax benefit (29,288) 1,872 (1,834)Deemed liquidation of subsidiary (<strong>31</strong>4,071) – –Changes in valuation allowance 216,908 (25,863) (230)Changes in tax reserves 44,968 – (10,000)Other, net 5,004 (4,490) 870Total $ 960 $(26,437) $(47,708)67
The tax effects of temporary differences that give rise tosignificant portions of the deferred tax assets and liabilitiesconsisted of the following:December <strong>31</strong>,(Dollars in thousands) <strong>2005</strong> 2004Deferred tax assets:Tax credits and loss carryforwards $ 742,368 $ 377,183Postretirement benefit obligations 410,905 391,410Accrued long-term workers’ compensation liabilities 101,346 100,157Additional minimum pension liability 46,9<strong>31</strong> 48,188Accrued reclamation and mine closing liabilities 46,139 46,776Intangible tax asset and purchased contract rights 35,405 45,001Obligation to industry fund 12,112 13,365Others 71,<strong>31</strong>1 82,844Total gross deferred tax assets 1,466,517 1,104,924Deferred tax liabilities:Property, plant, equipment and mine development,leased coal interests and advance royalties,principally due to differences in depreciation,depletion and asset writedowns 1,356,692 1,271,758Inventory 77,824 64,973Others 1,021 2,465Total gross deferred tax liabilities 1,435,537 1,339,196Valuation allowance (360,441) (143,533)Net deferred tax liability $ (329,461) $ (377,805)Deferred taxes consisted of the following:Current deferred income taxes $ 9,027 $ 15,461Noncurrent deferred income taxes (338,488) (393,266)Net deferred tax liability $ (329,461) $ (377,805)The Company’s deferred tax assets included alternativeminimum tax (“AMT”) credits of $26.2 million and $54.0 millionas of December <strong>31</strong>, <strong>2005</strong> and 2004, respectively, and netoperating loss (“NOL”) carryforwards of $716.2 million and$322.7 million as of December <strong>31</strong>, <strong>2005</strong> and 2004, respectively.The AMT credits have no expiration date and the NOLcarryforwards begin to expire in the year 2019. Utilization ofthese AMT credits and NOL carryforwards is subject to variouslimitations because of previous changes in ownership (asdefined in the Internal Revenue Code) of the Company, andultimate realization could be negatively impacted by marketconditions and other variables not known or anticipated at thistime. The AMT credits and NOL carryforwards are offset by avaluation allowance of $360.4 million. The valuation allowancewas increased by $216.9 million for the year ended December <strong>31</strong>,<strong>2005</strong>, to correspond with an increase in available NOLs andreduced by $25.9 million and $0.2 million for the years endedDecember <strong>31</strong>, 2004 and 2003, respectively. The Companyevaluated and assessed the expected near-term utilization ofNOLs, book and taxable income trends, available tax strategiesand the overall deferred tax position to determine the amountand timing of valuation allowance adjustments.During <strong>2005</strong>, the Company completed a comprehensiveand strategic internal corporate restructuring project.This restructuring focused on realigning the Company’ssubsidiary ownership on a geographic and functional basisand facilitated the consolidation of assets in a tax-efficientmanner, better positioning the Company to execute futurestrategic transactions. One of the indirect consequences of theinternal corporate restructuring was a deduction for a deemedliquidation of a subsidiary for tax purposes, which, as a result,increased the Company’s net operating losses by $1.0 billion.The Company establishes reserves for tax contingencieswhen, despite the belief that the Company’s tax returnpositions are fully supported, certain positions are likelyto be challenged and may not be fully sustained. The taxcontingency reserves are analyzed on a quarterly basis andadjusted based upon changes in facts and circumstances,such as the progress of federal and state audits, case lawand emerging legislation. The Company’s effective tax rateincludes the impact of tax contingency reserves and changesto the reserves, including related interest, as consideredappropriate by management. The Company establishes thereserves based upon management’s assessment of exposureassociated with permanent tax differences (e.g., tax depletionexpense) and certain tax sharing agreements. The Companyis subject to federal audits for several open years due to itsprevious inclusion in multiple consolidated groups and thevarious parties involved in finalizing those years. The taxcontingency reserve was increased by $45.0 million for the taxyear ended December <strong>31</strong>, <strong>2005</strong>. The tax contingency reservewas decreased for the year ended December <strong>31</strong>, 2003, by$10.0 million reflecting the reduction in exposure due to thecompletion of a federal audit.The total amount of undistributed earnings of foreignsubsidiaries for income tax purposes was approximately$156.0 million and $28.2 million at December <strong>31</strong>, <strong>2005</strong> and2004, respectively. On October 22, 2004, the American JobsCreation Act of 2004 (the “Act”) was signed into law. The Actcreated a temporary incentive for U.S. multinationals to repatriateaccumulated income earned outside the U.S. at an effectivetax rate of 5.25%. The Company did not repatriate foreignincome through December <strong>31</strong>, <strong>2005</strong>, and the Company hasnot provided deferred taxes on foreign earnings because suchearnings were intended to be indefinitely reinvested outsidethe U.S. Should the Company repatriate all of these earnings,a one-time income tax charge to the Company’s consolidatedresults of operations of up to $53 million could occur.The Company made no U.S. Federal tax payments forthe years ended December <strong>31</strong>, <strong>2005</strong> and 2003. The Companymade U.S. Federal tax payments totaling $1.4 million for the68 <strong>Peabody</strong> <strong>Energy</strong>
year ended December <strong>31</strong>, 2004. The Company paid state andlocal income taxes totaling $0.3 million, $0.3 million and$0.4 million for the years ended December <strong>31</strong>, <strong>2005</strong>, 2004 and2003, respectively. The Company made non-U.S. tax paymentstotaling $2.8 million, $6.3 million and $3.2 million for the yearsended December <strong>31</strong>, <strong>2005</strong>, 2004 and 2003, respectively.(14) LONG-TERM DEBTThe Company’s total indebtedness consisted of thefollowing at:December <strong>31</strong>,(Dollars in thousands) <strong>2005</strong> 2004Term Loan under Senior SecuredCredit Facility $ 442,500 $ 448,7506.875% Senior Notes due 2013 650,000 650,0005.875% Senior Notes due 2016 239,525 239,525Fair value of interest rate swaps –6.875% Senior Notes (8,879) 5,1895.0% Subordinated Note 66,693 73,621Other 15,667 7,880Total $1,405,506 $1,424,965Senior Secured Credit FacilityOn March 21, 2003, the Company entered into a SeniorSecured Credit Facility (the “Facility”) that consisted of a$600.0 million revolving credit facility and a $450.0 millionterm loan. On March 8, 2004, the Company entered into anamendment to refinance the Facility, which expanded themaximum borrowings under the revolving credit facility from$600.0 million to $900.0 million and reduced the interest ratepayable on the existing term loan under the Facility from LIBORplus 2.5% to LIBOR plus 1.75%. On October 27, 2004, theCompany refinanced the Facility, which reduced the applicablemargin on the loans and the revolving credit agreement fee rateand extended the revolving credit facility termination date toMarch 2010. The refinancing reduced the interest rate payableon the existing term loan under the Facility from LIBOR plus1.75% to LIBOR plus 1.25%. The applicable rate was 3.74% asof December <strong>31</strong>, 2004.For the year ending December <strong>31</strong>, <strong>2005</strong>, based onthe attainment of certain leverage ratios, as defined in theagreement, there was a reduction in the interest rate payableon the existing term loan under the Facility from LIBOR plus1.25% to LIBOR plus 0.75%. The same reduction in the marginapplies to fees under the revolving credit facility. The applicablerate for the term loan was 5.24% as of December <strong>31</strong>, <strong>2005</strong>. TheCompany had letters of credit outstanding under the revolvingcredit facility of $406.7 million at December <strong>31</strong>, <strong>2005</strong>, leaving$493.3 million available for borrowing.Under the term loan, total principal of $42.5 million willbe paid in quarterly installments through March <strong>31</strong>, 2009.The remaining principal of $400.0 million is due in quarterlyinstallments of $100.0 million to be paid from June 30,2009, through March 21, 2010. The Facility is secured by thecapital stock and certain assets of the Company’s “restrictedsubsidiaries” (as defined in the Facility). These restrictedsubsidiaries are also guarantors of the Facility. Under theFacility, the Company must comply with certain financialcovenants on a quarterly basis. These covenants include aminimum Adjusted EBITDA (as defined in the Facility) interestcoverage ratio, a maximum “total obligations” (as defined in the Facility)to Adjusted EBITDA ratio and a maximum senior secured debt toAdjusted EBITDA ratio. The Company was in compliance with these ascovenants of December <strong>31</strong>, <strong>2005</strong>.6.875% Senior Notes Due March 2013On March 21, 2003, the Company issued $650.0 millionof 6.875% Senior Notes due March 2013. The notes are seniorunsecured obligations of the Company and rank equally withall of the Company’s other senior unsecured indebtedness.Interest payments are scheduled to occur on March 15 andSeptember 15 of each year, and commenced on September 15,2003. The notes are guaranteed by the Company’s “restrictedsubsidiaries” as defined in the note indenture. The noteindenture contains covenants which, among other things,limit the Company’s ability to incur additional indebtednessand issue preferred stock, pay dividends or make otherdistributions, make other restricted payments and investments,create liens, sell assets and merge or consolidate with otherentities. The notes are redeemable prior to March 15, 2008, ata redemption price equal to 100% of the principal amount plusa make-whole premium (as defined in the indenture) and on orafter March 15, 2008, at fixed redemption prices as set forth inthe indenture.5.875% Senior Notes Due March 2016On March 23, 2004, the Company completed an offeringof $250.0 million of 5.875% Senior Notes due March 2016. Thenotes are senior unsecured obligations of the Company andrank equally with all of the Company’s other senior unsecuredindebtedness. Interest payments are scheduled to occur onApril 15 and October 15 of each year, and commenced onApril 15, 2004. The notes are guaranteed by the Company’s“restricted subsidiaries” as defined in the note indenture. Thenote indenture contains covenants which, among other things,limit the Company’s ability to incur additional indebtednessand issue preferred stock, pay dividends or make otherdistributions, make other restricted payments and investments,create liens, sell assets and merge or consolidate with otherentities. The notes are redeemable prior to April 15, 2009, at aredemption price equal to 100% of the principal amount plusa make-whole premium (as defined in the indenture) and on orafter April 15, 2009, at fixed redemption prices as set forth inthe indenture. Net proceeds from the offering, after deductingunderwriting discounts and expenses, were $244.7 million.Interest Rate SwapsIn May 2003, the Company entered into and designatedfour interest rate swaps with combined notional amountstotaling $100.0 million as a fair value hedge of the Company’s6.875% Senior Notes. Under the swaps, the Company paysa floating rate that resets each March 15 and September 15,based upon the six-month LIBOR rate, for a period of 10 yearsending March 15, 2013 and receives a fixed rate of 6.875%. Theaverage applicable floating rate for the four swaps was 7.09%as of December <strong>31</strong>, <strong>2005</strong>.69
In September 2003, the Company entered into two$400.0 million interest rate swaps. One $400.0 million notionalamount floating-to-fixed interest rate swap, expiring March 15,2010, was designated as a hedge of changes in expected cashflows on the term loan under the Senior Secured Credit Facility.The term loan was refinanced in October 2004, and the swapwas re-designated as a hedge of the refinanced term loan.Under this swap, the Company pays a fixed rate of 6.764%and receives a floating rate of LIBOR plus 2.5% (6.99% atDecember <strong>31</strong>, <strong>2005</strong>) that resets each March 15, June 15,September 15 and December 15 based upon the three-monthLIBOR rate. Another $400.0 million notional amount fixedto-floatinginterest rate swap, expiring March 15, 2013, wasdesignated as a hedge of the changes in the fair value of the6.875% Senior Notes due 2013. Under this swap, the Companypays a floating rate of LIBOR plus 1.97% (6.46% at December <strong>31</strong>,<strong>2005</strong>) that resets each March 15, June 15, September 15 andDecember 15 based upon the three-month LIBOR rate andreceives a fixed rate of 6.875%. The swaps will lower theCompany’s overall borrowing costs on $400.0 million of debtprincipal by 0.64% over the term of the floating-to-fixed swap.Because the critical terms of the swaps and the respectivedebt instruments they hedge coincide, there was no hedgeineffectiveness recognized in the statement of operationsduring the year ended December <strong>31</strong>, <strong>2005</strong>. Related to the cashflow hedge, the balance sheet at December <strong>31</strong>, <strong>2005</strong> and 2004,respectively, reflected an unrealized gain of $2.3 million andan unrealized loss of $10.9 million, which is recognized net ofa $0.9 million tax provision and a $4.4 million tax benefit, inother comprehensive loss (see Note 21). As of December <strong>31</strong>,<strong>2005</strong> and 2004, the balance sheet reflected a net unrealizedloss of $8.9 million and a net unrealized gain of $5.2 million,respectively, on the fair value hedges discussed above, whichis reflected as an adjustment to the carrying value of the SeniorNotes (see table above).5.0% Subordinated NoteThe 5.0% Subordinated Note is recorded net of discount atan effective annual interest rate of 12.0%. Interest and principalare payable each March 1, and a scheduled principal paymentof $10.0 million is due in 2006, with the remaining $60.0 milliondue March 1, 2007. The 5.0% Subordinated Note is expresslysubordinated in right of payment to all prior indebtedness (asdefined), including borrowings under the Senior Secured CreditFacility, the 6.875% Senior Notes due March 2013 and the5.875% Senior Notes due March 2016.OtherOther long-term debt, which consists principally of notespayable, is due in installments through 2016. The weightedaverageeffective interest rate of this debt was 5.54% as ofDecember <strong>31</strong>, <strong>2005</strong>.The aggregate amounts of long-term debt maturitiessubsequent to December <strong>31</strong>, <strong>2005</strong> are as follows:Year of Maturity(Dollars in thousands)2006 $ 22,5852007 72,2682008 16,4352009 304,7972010 101,1122011 and thereafter 888,309Total $1,405,506Interest paid on long-term debt was $94.2 million,$87.4 million and $89.0 million for the years ended December <strong>31</strong>,<strong>2005</strong>, 2004 and 2003, respectively. No interest was paid onthe revolving credit facility in <strong>2005</strong> or 2004. Interest paid onthe revolving credit facility was $0.1 million for the year endedDecember <strong>31</strong>, 2003.Early Debt Extinguishment CostsIn 2004, the Company recorded a net charge for earlydebt extinguishment of $1.8 million. In connection with therefinancing of the Senior Secured Credit Facility on October 27,2004, the Company incurred a non-cash charge of $2.4 millionto write-off unamortized debt issuance costs related to the termloan. In connection with the July 2004 repurchase of $10.5 millionof 5.875% Senior Notes due March 2016, the Company realizeda gain of $0.6 million, which included a gain from the excessof carrying value of the notes over the cash cost to retire thenotes of $0.8 million partially offset by charges to write-off debtissuance costs associated with the debt extinguished of$0.2 million.In 2003, the Company recorded total early debtextinguishment costs of $53.5 million in connection with aseries of transactions to refinance a substantial portion of itsoutstanding indebtedness. The early debt extinguishment costsincluded prepayment premiums paid on the debt retired of$41.8 million, non-cash charges to write-off the associated debtissuance costs of $17.5 million, and a gain from the terminationand monetization of interest rate swaps associated with thedebt extinguished of $5.8 million.70 <strong>Peabody</strong> <strong>Energy</strong>
(15) ASSET RETIREMENT OBLIGATIONSSFAS No. 143 addresses financial accounting andreporting for obligations associated with the retirement oftangible long-lived assets and the associated asset retirementcosts. The Company’s asset retirement obligation (“ARO”)liabilities primarily consist of spending estimates related toreclaiming surface land and support facilities at both surfaceand underground mines in accordance with federal andstate reclamation laws as defined by each mine permit. Theobligation and corresponding asset are recognized in the periodin which the liability is incurred.The Company estimates its ARO liabilities for finalreclamation and mine closure based upon detailed engineeringcalculations of the amount and timing of the future cashspending for a third party to perform the required work.Spending estimates are escalated for inflation, then discountedat the credit-adjusted risk-free rate (5.81% at January 1,<strong>2005</strong>). The Company records an ARO asset associated withthe liability. The ARO asset is amortized based on the unitsof production method over its expected life, and the AROliability is accreted to the projected spending date. Changesin estimates could occur due to mine plan revisions, changesin estimated costs, and changes in timing of the performanceof reclamation activities. The Company also recognizes anobligation for contemporaneous reclamation liabilities incurredas a result of surface mining.A reconciliation of the Company’s liability for assetretirement obligations for the year ended December <strong>31</strong>, <strong>2005</strong>, isas follows:(16) WORKERS’ COMPENSATION OBLIGATIONSCertain subsidiaries of the Company are subject to theFederal Coal Mine Health and Safety Act of 1969 and therelated workers’ compensation laws in the states in whichthey operate. These laws require the subsidiaries to paybenefits for occupational disease resulting from coal workers’pneumoconiosis (“occupational disease”). Changes to thefederal regulations became effective in August 2001, andthe revised regulations could ultimately result in highercosts, although experience to date has not resulted in higherclaims costs. Provisions for occupational disease costs arebased on determinations by independent actuaries or claimsadministrators.The Company provides income replacement and medicaltreatment for work related traumatic injury claims as requiredby applicable state law. Provisions for estimated claims incurredare recorded based on estimated loss rates applied to payrolland claim reserves determined by independent actuaries orclaims administrators.Certain subsidiaries of the Company are required tocontribute to state workers’ compensation funds for secondinjury and other costs incurred by the state fund based on apayroll-based assessment by the applicable state. Provisionsare recorded based on the payroll-based assessment criteria.As of December <strong>31</strong>, <strong>2005</strong>, the Company had $163.8 millionin surety bonds and letters of credit outstanding to secureworkers’ compensation obligations.Workers’ compensation provision consists of the followingcomponents:(Dollars in thousands)Balance at December <strong>31</strong>, 2004 $396,022Liabilities incurred 24,101Liabilities settled or disposed (40,341)Accretion expense 24,095Revisions to estimate (4,674)Balance at December <strong>31</strong>, <strong>2005</strong> $399,203Total asset retirement obligations as of December <strong>31</strong>, <strong>2005</strong>,of $399.2 million consisted of $340.7 million related to locationswith active mining operations and $58.5 million related tolocations that are closed or inactive. In <strong>2005</strong>, the Companyrecorded a $9.2 million reduction in its asset retirementobligations associated with the disposal of non-strategicproperties and the assumption of the related reclamationliabilities by the purchaser.As of December <strong>31</strong>, <strong>2005</strong> and 2004, the Company had$323.6 million and $294.5 million, respectively, in surety bondsoutstanding to secure reclamation obligations or activities. Theamount of reclamation self-bonding in certain states in whichthe Company qualifies was $671.8 million and $653.3 millionas of December <strong>31</strong>, <strong>2005</strong> and 2004, respectively. Additionally,the Company had $0.1 million and $0.4 million of letters ofcredit in support of reclamation obligations or activities as ofDecember <strong>31</strong>, <strong>2005</strong> and 2004, respectively.Year Ended December <strong>31</strong>,(Dollars in thousands) <strong>2005</strong> 2004 2003Occupational disease:Service cost $ 4,491 $ 4,346 $ 3,807Interest cost 10,425 11,568 11,760Net amortization (1,213) 742 339Total occupational disease 13,703 16,656 15,906Traumatic injury claims 25,610 27,141 19,691State assessment taxes 16,820 15,365 15,016Total provision $56,133 $59,162 $50,613The weighted-average assumptions used to determine theworkers’ compensation provision were as follows:Year Ended December <strong>31</strong>,<strong>2005</strong> 2004 2003Discount rate 6.10% 6.40% 7.00%Inflation rate 3.50% 3.50% 3.50%71
Workers’ compensation obligations consist of amountsaccrued for loss sensitive insurance premiums, uninsuredclaims and related taxes and assessments under black lung andtraumatic injury workers compensation programs.The workers’ compensation obligations consisted ofthe following:December <strong>31</strong>,(Dollars in thousands) <strong>2005</strong> 2004Occupational disease costs $190,347 $186,647Traumatic injury claims 81,034 81,713State assessment taxes 505 552Total obligations 271,886 268,912Less current portion (34,<strong>31</strong>2) (41,436)Noncurrent obligations $237,574 $227,476The reconciliation of changes in the benefit obligation ofthe occupational disease liability is as follows:December <strong>31</strong>,(Dollars in thousands) <strong>2005</strong> 2004Beginning of year obligation $199,346 $191,993Service cost 4,491 4,346Interest cost 10,425 11,568Actuarial gain (16,071) (601)Acquisitions – 2,514Benefit and administrative payments (10,284) (10,474)Net obligation at end of year 187,907 199,346Unamortized gain (loss) and prior service cost 2,440 (12,699)Accrued cost $190,347 $186,647The liability for occupational disease claims representsthe actuarially-determined present value of known claims andan estimate of future claims that will be awarded to currentand former employees. The liability for occupational diseaseclaims was based on a discount rate of 5.9% and 6.1% atDecember <strong>31</strong>, <strong>2005</strong> and 2004, respectively. Traumatic injuryworkers’ compensation obligations are estimated from bothcase reserves and actuarial determinations of historical trends,discounted at 6.1% and 6.4% for the years ended December <strong>31</strong>,<strong>2005</strong> and 2004, respectively.Federal Black Lung Excise Tax Refund ClaimsIn addition to the obligations discussed above, certainsubsidiaries of the Company are required to pay black lungexcise taxes to the Federal Black Lung Trust Fund (the “TrustFund”). The Trust Fund pays occupational disease benefits toentitled former miners who worked prior to July 1, 1973. Excisetaxes are based on the selling price of coal, up to a maximumof $1.10 per ton for underground mines and $0.55 per ton forsurface mines. The Company had a receivable for excise taxrefunds of $19.4 million as of December <strong>31</strong>, <strong>2005</strong> and 2004.(17) PENSION AND SAVINGS PLANSOne of the Company’s subsidiaries, <strong>Peabody</strong> InvestmentsCorp., sponsors a defined benefit pension plan coveringsubstantially all salaried U.S. employees and eligible hourlyemployees at certain <strong>Peabody</strong> Investments Corp. subsidiaries(the “<strong>Peabody</strong> Plan”). A <strong>Peabody</strong> Investments Corp. subsidiaryalso has a defined benefit pension plan covering eligibleemployees who are represented by the UMWA under theWestern Surface Agreement of 2000 (the “Western Plan”).Twentymile Coal Company (“Twentymile”), a subsidiaryof the Company, sponsors two defined benefit pensionplans, one which covers substantially all Twentymile hourlyemployees (the “Twentymile Hourly Plan”) and one whichcovers substantially all Twentymile salaried employees (the“Twentymile Salaried Plan”). <strong>Peabody</strong> Investments Corp. alsosponsors an unfunded supplemental retirement plan to providesenior management with benefits in excess of limits underthe federal tax law and increased benefits to reflect a serviceadjustment factor.<strong>Annual</strong> contributions to the plans are made as determinedby consulting actuaries based upon the Employee RetirementIncome Security Act of 1974 minimum funding standard. InMay 1998, the Company entered into an agreement with thePension Benefit Guaranty Corporation which requires theCompany to maintain certain minimum funding requirements.Assets of the plans are primarily invested in various marketablesecurities, including U.S. government bonds, corporateobligations and listed stocks.Net periodic pension costs included the followingcomponents:Year Ended December <strong>31</strong>,(Dollars in thousands) <strong>2005</strong> 2004 2003Service cost for benefits earned $ 11,853 $ 12,275 $ 10,184Interest cost on projected benefit obligation 45,499 43,658 41,794Expected return on plan assets (52,812) (49,813) (44,462)Other amortizations and deferrals 24,588 22,366 13,179Net periodic pension costs 29,128 28,486 20,695Curtailment charges 9,527 – –Total pension costs $ 38,655 $ 28,486 $ 20,695The Company amortizes actuarial gains and losses using a5% corridor with a five-year amortization period.The curtailment charges resulted from the planned closureduring <strong>2005</strong> of two of the Company’s three operating minesthat participate in the Western Plan. The loss is actuariallydetermined and consists of an increase in the actuarial liability,the accelerated recognition of previously unamortized priorservice cost and contractual termination benefits under theWestern Plan resulting from the closures.During the period ended March <strong>31</strong>, 1999, the Companymade an amendment to phase out the <strong>Peabody</strong> Plan beginningJanuary 1, 2000. Effective January 1, 2001, certain employeesno longer accrue future service under the plan while otheremployees accrue reduced service under the plan based ontheir age and years of service as of December <strong>31</strong>, 2000. Forplan benefit calculation purposes, employee earnings are also72 <strong>Peabody</strong> <strong>Energy</strong>
frozen as of December <strong>31</strong>, 2000. The Company has adopted anenhanced savings plan contribution structure in lieu of benefitsformerly accrued under the defined benefit pension plan.The following summarizes the change in benefit obligation,change in plan assets and funded status of the Company’s plans:December <strong>31</strong>,(Dollars in thousands) <strong>2005</strong> 2004Change in benefit obligation:Benefit obligation at beginning of period $ 759,283 $ 681,300Service cost 11,853 12,275Interest cost 45,499 43,658Acquisitions – 27,328Plan amendments (225) –Curtailments (1,309) –Special termination benefits 7,896 –Benefits paid (38,<strong>31</strong>5) (35,095)Actuarial loss 17,136 29,817Benefit obligation at end of period 801,818 759,283Change in plan assets:Fair value of plan assets at beginningof period 642,400 527,914Actual return on plan assets 42,707 68,819Acquisitions – 18,680Employer contributions 7,2<strong>31</strong> 62,082Benefits paid (38,<strong>31</strong>5) (35,095)Fair value of plan assets at end of period 654,023 642,400Funded status (147,795) (116,883)Unrecognized actuarial loss 141,517 140,175Unrecognized prior service cost 346 2,201Accrued pension asset (liability) $ (5,932) $ 25,493Amounts recognized in the consolidatedbalance sheets:Accrued benefit liability $(125,622) $ (99,905)Intangible asset 2,362 4,067Additional minimum pension liability,included in other comprehensive income 117,328 121,3<strong>31</strong>Net amount recognized $ (5,932) $ 25,493The accumulated benefit obligation for all pension planswas $779.6 million and $740.9 million as of December <strong>31</strong>,<strong>2005</strong>, and 2004, respectively. The projected benefit obligationand the accumulated benefit obligation exceeded plan assetsfor all plans as of December <strong>31</strong>, <strong>2005</strong> and 2004. The followingpresents information applicable to pension plans withaccumulated benefit obligations in excess of plan assets:December <strong>31</strong>,(Dollars in thousands) <strong>2005</strong> 2004Projected benefit obligation $801,818 $759,283Accumulated benefit obligation 779,646 740,9<strong>31</strong>Fair value of plan assets 654,023 642,400The provisions of SFAS No. 87 require the recognition ofan additional minimum liability and related intangible asset tothe extent that accumulated benefits exceed plan assets. Asof December <strong>31</strong>, <strong>2005</strong> and 2004, the Company has recorded$117.3 million and $121.3 million, respectively, to reflect theCompany’s minimum liability. The current portion of theCompany’s pension liability as reflected within “Accountspayable and accrued expenses” at December <strong>31</strong>, <strong>2005</strong> and 2004was $7.9 million and $5.8 million, respectively. The noncurrentportion of the Company’s pension liability as reflected within“Other noncurrent liabilities” at December <strong>31</strong>, <strong>2005</strong> and 2004was $115.4 million and $90.0 million, respectively.The weighted-average assumptions used to determine thebenefit obligations as of the end of each year were as follows:Year Ended December <strong>31</strong>,<strong>2005</strong> 2004Discount rate 5.90% 6.10%Rate of compensation increase 3.50% 3.50%Measurement date December <strong>31</strong>, <strong>2005</strong> December <strong>31</strong>, 2004The weighted-average assumptions used to determine netperiodic benefit cost were as follows:Year Ended December <strong>31</strong>,<strong>2005</strong> 2004 2003Discount rate 6.10% 6.40% 7.00%Expected long-term return onplan assets 8.75% 8.75% 8.75%Rate of compensation increase 3.50% 3.75% 3.75%Measurement date Dec. <strong>31</strong>, 2004 Dec. <strong>31</strong>, 2003 Dec. <strong>31</strong>, 2002The expected rate of return on plan assets is determinedby taking into consideration expected long-term returnsassociated with each major asset class (net of inflation) basedon long-term historic ranges, inflation assumptions and theexpected net value from active management of the assetsbased on actual results.73
Plan AssetsAssets of the <strong>Peabody</strong> Plan, the Western Plan, theTwentymile Hourly Plan and the Twentymile Salaried Plan arecommingled in the <strong>Peabody</strong> Investment Corporation MasterTrust (the “Master Trust”) and are invested in accordancewith investment guidelines that have been established bythe Company’s Retirement Committee (the “RetirementCommittee”) after consultation with outside investmentadvisors and actuaries.As of the year ended December <strong>31</strong>, <strong>2005</strong>, Master Trustassets totaled $654.0 million and were invested in the followingmajor asset categories:futures contracts are permitted only to the extent necessary toequitize cash holdings.ContributionsThe Company expects to contribute $6.6 million to itsfunded pension plans and make $1.3 million in expectedbenefit payments attributable to its unfunded pension plansduring 2006.Estimated Future Benefit PaymentsThe following benefit payments (net of retireecontributions), which reflect expected future service, asappropriate, are expected to be paid by the Master Trust:Balance as of Percentage Allocation(Dollars in thousands) December <strong>31</strong>, <strong>2005</strong> of Total Assets Target AllocationEquity securities $360,133 55.1% 50.0%Fixed income 247,747 37.9% 40.0%Real estate 45,328 6.9% 10.0%Cash fund 815 0.1% 0.0%Total $654,023 100.0% 100.0%As of the year ended December <strong>31</strong>, 2004, Master Trustassets totaled $642.4 million and were invested in the followingmajor asset categories:Balance as of Percentage Allocation(Dollars in thousands) December <strong>31</strong>, 2004 of Total Assets Target AllocationEquity securities $339,287 52.8% 50.0%Fixed income 250,749 39.0% 40.0%Real estate 49,647 7.8% 10.0%Cash fund 2,717 0.4% 0.0%Total $642,400 100.0% 100.0%The asset allocation targets have been set with theexpectation that the plan’s assets will fund the plan’s expectedliabilities with an appropriate level of risk. To determine theappropriate target asset allocations, the Retirement Committeeconsiders the demographics of the plan participants, thefunding status of the plan, the business and financial profileof the Company and other associated risk preferences. Theseallocation targets are reviewed by the Retirement Committeeon a regular basis and revised as necessary. Periodically assetsare rebalanced among major asset categories to maintainthe allocations within a range of plus or minus 5% of thetarget allocation.Plan assets are either under active management by thirdpartyinvestment advisors or in index funds, all selected andmonitored by the Retirement Committee. The RetirementCommittee has established specific investment guidelines foreach major asset class including performance benchmarks,allowable and prohibited investment types and concentrationlimits. In general, the plan investment guidelines do notpermit leveraging the Master Trust’s assets. Equity investmentguidelines do not permit entering into put or call options(except as deemed appropriate to manage currency risk), and(Dollars in thousands)Pension Benefits2006 $ 40,8042007 42,1622008 44,2272009 45,8392010 47,695Years 2011-2015 282,423Multi-Employer Pension PlansCertain subsidiaries participate in multi-employer pensionplans (the 1950 Plan and the 1974 Plan), which provide definedbenefits to substantially all hourly coal production workersrepresented by the UMWA other than those covered by theWestern Plan. Benefits under the UMWA plans are computedbased on service with the subsidiaries or other signatoryemployers. There were no contributions to the multi-employerpension plans during the years ended December <strong>31</strong>, <strong>2005</strong>,2004 or 2003, and the Company does not anticipate anycontributions in 2006.Defined Contribution PlansThe Company sponsors employee retirement accountsunder seven 401(k) plans for eligible salaried U.S. employees.The Company matches voluntary contributions to each planup to specified levels. The expense for these plans was$10.7 million, $10.2 million and $9.4 million for the yearsended December <strong>31</strong>, <strong>2005</strong>, 2004 and 2003, respectively.A performance contribution feature allows for additionalcontributions from the Company based upon meetingspecified Company performance targets, and the performancecontributions made by the Company were $9.3 million,$6.7 million and $3.7 million for the years ended December <strong>31</strong>,<strong>2005</strong>, 2004 and 2003, respectively.(18) POSTRETIREMENT HEALTH CARE AND LIFEINSURANCE BENEFITSThe Company currently provides health care and lifeinsurance benefits to qualifying salaried and hourly retireesand their dependents from defined benefit plans established bythe Company. Plan coverage for the health and life insurancebenefits is provided to future hourly retirees in accordancewith the applicable labor agreement. The Company accountsfor postretirement benefits in accordance with SFAS No. 106,74 <strong>Peabody</strong> <strong>Energy</strong>
which requires the cost to provide the benefits to be accruedover the employees’ period of active service. These costs aredetermined on an actuarial basis.Net periodic postretirement benefit costs included thefollowing components:Year Ended December <strong>31</strong>,(Dollars in thousands) <strong>2005</strong> 2004 2003Service cost for benefits earned $ 5,343 $ 4,430 $ 4,670Interest cost on accumulated postretirementbenefit obligation 72,673 63,635 77,984Amortization of prior service cost (5,339) (13,230) (15,787)Amortization of actuarial losses 26,304 3,575 16,802Net periodic postretirement benefit costs $98,981 $ 58,410 $ 83,669The Company amortizes actuarial gains and losses using a0% corridor with an amortization period that covers the averageremaining service period of active employees (8.99 years and8.43 years at January 1, <strong>2005</strong> and 2004, respectively).The following table sets forth the plans’ combined fundedstatus reconciled with the amounts shown in the consolidatedbalance sheets:December <strong>31</strong>,(Dollars in thousands) <strong>2005</strong> 2004Change in benefit obligation:Benefit obligation at beginning of period $ 1,234,185 $ 1,023,453Service cost 5,343 4,430Interest cost 72,673 63,635Participant contributions 1,716 1,360Plan amendments – 4,492Acquisitions – 10,191Benefits paid (87,250) (83,451)Actuarial loss 62,288 210,075Benefit obligation at end of period 1,288,955 1,234,185Change in plan assets:Fair value of plan assets at beginning of period – –Employer contributions 85,534 82,091Participant contributions 1,716 1,360Benefits paid (87,250) (83,451)Fair value of plan assets at end of period – –Funded status (1,288,955) (1,234,185)Unrecognized actuarial loss 272,617 236,634Unrecognized prior service cost (17,932) (23,270)Accrued postretirement benefit obligation (1,034,270) (1,020,821)Less current portion 75,048 81,<strong>31</strong>8Noncurrent obligation $ (959,222) $ (939,503)The weighted-average assumptions used to determine thebenefit obligations as of the end of each year were as follows:Year Ended December <strong>31</strong>,<strong>2005</strong> 2004Discount rate 5.90% 6.10%Rate of compensation increase 3.50% 3.50%Measurement date December <strong>31</strong>, <strong>2005</strong> December <strong>31</strong>, 2004The weighted-average assumptions used to determine netperiodic benefit costs were as follows:Year Ended December <strong>31</strong>,<strong>2005</strong> 2004 2003Discount rate 6.10% 6.40% 7.00%Expected long-term returnon plan assetsnot applicable not applicable not applicableRate of compensation increase 3.50% 3.75% 3.75%Measurement date Dec. <strong>31</strong>, 2004 Dec. <strong>31</strong>, 2003 Dec. <strong>31</strong>, 2002The following presents information about the assumedhealth care cost trend rate:Year Ended December <strong>31</strong>,<strong>2005</strong> 2004Health care cost trend rate assumedfor next year 7.00% 8.00%Rate to which the cost trend is assumedto decline (the ultimate trend rate) 4.75% 4.75%Year that the rate reachesthe ultimate trend rate 2011 2010Assumed health care cost trend rates have a significanteffect on the amounts reported for health care plans. A onepercentage-pointchange in the assumed health care cost trendwould have the following effects:One-Percentage- One-Percentage-(Dollars in thousands) Point Increase Point DecreaseEffect on total service and interestcost components $ 8,789 $ (6,961)Effect on total postretirementbenefit obligation $161,903 $(135,501)Plan AssetsThe Company’s postretirement benefit plans are unfunded.Cash FlowsThe Company expects to pay $75.0 million in benefitsattributable to its postretirement benefit plans during 2006.75
Estimated Future Benefit PaymentsThe following benefit payments (net of retireecontributions), which reflect expected future service, asappropriate, are expected to be paid by the Company:(Dollars in thousands)2006 $ 75,0482007 78,8232008 81,6182009 84,3812010 87,3<strong>31</strong>Years 2011-2015 $493,716Medicare and Other Plan ChangesOn December 8, 2003, the Medicare Prescription Drug,Improvement and Modernization Act of 2003 (the “Act”)was signed into law. The Company elected not to defer theeffects of the Act as discussed in FASB Staff Position 106-1,“Accounting and Disclosure Requirements Related to theMedicare Prescription Drug, Improvement and ModernizationAct of 2003.” Additionally, the Company did not elect theFederal Subsidy provisions of the Act; rather the Companycoordinated benefits with available Medicare coverageconsidered the primary payer, whether or not the beneficiaryenrolled and paid the required premiums.The Company recognized a reduction in the benefitobligation on two distinct components. For plans that requiredamendment to incorporate the Act, the Company recognized aliability reduction of $19.1 million. This reduction was treatedas a negative plan amendment and is being amortized toincome over six years beginning December 15, 2003. For plansthat did not require amendment, the Company recognizeda liability reduction of $162.4 million. The reduction wastreated as a change in the estimated cost to provide benefitsto Medicare eligible beneficiaries constituting a component ofthe cumulative actuarial gain or loss subject to amortization inaccordance with the Company’s amortization method.In July 2001, the Company adopted changes to theprescription drug program. Effective January 1, 2002,an incentive mail order and comprehensive utilizationmanagement program was added to the prescription drugprogram. The effect at the time of adoption of the change onthe retiree health care liability was $38.4 million. The Companybegan recognizing the effect of the plan amendment overthree years beginning July 1, 2001. Net periodic postretirementbenefit costs were reduced by $6.4 million for the year endedDecember <strong>31</strong>, 2004, and $12.8 million for the year endedDecember <strong>31</strong>, 2003, for this change.In January 1999, the Company adopted reductions to thesalaried employee medical coverage levels for employeesretiring before January 1, 2003, which was changed toJanuary 1, <strong>2005</strong>, in 2002. For employees retiring on or afterJanuary 1, <strong>2005</strong>, the current medical plan is replaced with amedical premium reimbursement plan. This plan change didnot apply to Powder River or Lee Ranch salaried employees.The change in the retiree health care plan resulted in a$22.4 million reduction to the salaried retiree health careliability. The Company began recognizing the effect of the planamendment over nine years beginning January 1, 1999. Theeffect was $1.0 million for the year ended December <strong>31</strong>, <strong>2005</strong>,and $2.5 million for each of the years ended December <strong>31</strong>,2004 and 2003.Multi-Employer Benefit PlansRetirees formerly employed by certain subsidiaries andtheir predecessors, who were members of the UMWA, lastworked before January 1, 1976 and were receiving healthbenefits on July 20, 1992, receive health benefits providedby the Combined Fund, a fund created by the Coal IndustryRetiree Health Benefit Act of 1992 (the “Coal Act”). The CoalAct requires former employers (including certain subsidiariesof the Company) and their affiliates to contribute to theCombined Fund according to a formula. In addition, certainFederal Abandoned Mine Lands funds will be transferred to theCombined Fund to fund certain benefits.The Company has recorded an actuarially determinedliability representing the amounts anticipated to be due tothe Combined Fund. The noncurrent portion related to thisobligation as reflected within “Other noncurrent liabilities” inthe consolidated balance sheets as of December <strong>31</strong>, <strong>2005</strong> and2004, was $27.9 million and $33.4 million, respectively. Thecurrent portion related to this obligation reflected in “Accountspayable and accrued expenses” in the consolidated balancesheets as of December <strong>31</strong>, <strong>2005</strong> and 2004, was $8.8 million and$6.4 million, respectively.Expense of $0.9 million was recognized related to theCombined Fund for the year ended December <strong>31</strong>, <strong>2005</strong>, andconsisted of interest discount of $1.0 million and amortizationof actuarial gain of $0.1 million. Expense of $4.9 millionwas recognized related to the Combined Fund for the yearended December <strong>31</strong>, 2004, and consisted of interest discountof $3.8 million and amortization of actuarial loss of $1.1 million.Expense of $1.2 million was recognized related to theCombined Fund for the year ended December <strong>31</strong>, 2003, andconsisted of interest discount of $3.4 million and amortizationof actuarial gain of $2.2 million. The Company madecontributions of $4.0 million, $16.6 million and $16.2 million tothe Combined Fund for the years ended December <strong>31</strong>, <strong>2005</strong>,2004 and 2003, respectively.The Coal Act also established a multi-employer benefitplan (“1992 Plan”) which will provide medical and deathbenefits to persons who are not eligible for the Combined Fund,who retired prior to October 1, 1994, and whose employer andany affiliates are no longer in business. A prior labor agreementestablished the 1993 United Mine Workers of America BenefitTrust (“1993 Plan”) to provide health benefits for retired minersnot covered by the Coal Act. The 1992 Plan and the 1993Plan qualify under SFAS No. 106 as multi-employer benefitplans, which allows the Company to recognize expense ascontributions are made. The expense related to these fundswas $4.0 million, $4.4 million and $5.3 million for the yearsended December <strong>31</strong>, <strong>2005</strong>, 2004 and 2003, respectively.76 <strong>Peabody</strong> <strong>Energy</strong>
Pursuant to the provisions of the Coal Act and the 1992Plan, the Company is required to provide security in an amountequal to three times the annual cost of providing health carebenefits for all individuals receiving benefits from the 1992Plan who are attributable to the Company, plus all individualsreceiving benefits from an individual employer plan maintainedby the Company who are entitled to receive such benefits. Inaccordance with the Coal Act and the 1992 Plan, the Companyhas outstanding letters of credit as of December <strong>31</strong>, <strong>2005</strong>, of$120.1 million to secure the Company’s obligation.(19) STOCKHOLDERS’ EQUITYCommon StockThe Company has 400.0 million authorized shares of$0.01 par value common stock. Holders of common stock areentitled to one vote per share on all matters to be voted uponby the stockholders. The holders of common stock do not havecumulative voting rights in the election of directors. Holdersof common stock are entitled to ratably receive dividends if,as and when dividends are declared from time to time by theBoard of Directors. Upon liquidation, dissolution or windingup, any business combination or a sale or disposition of allor substantially all of the assets, the holders of commonstock are entitled to receive ratably the assets available fordistribution to the stockholders after payment of liabilities andaccrued but unpaid dividends and liquidation preferences onany outstanding preferred stock or series common stock. Thecommon stock has no preemptive or conversion rights andis not subject to further calls or assessment by the Company.There are no redemption or sinking fund provisions applicableto the common stock.Preferred Stock and Series Common StockIn addition to the common stock, the Board of Directorsis authorized to issue up to 10.0 million shares of preferredstock and up to 40.0 million shares of series common stock.The Board of Directors is authorized to determine the termsand rights of each series, including the number of authorizedshares, whether dividends (if any) will be cumulative or noncumulativeand the dividend rate of the series, redemption orsinking fund provisions, conversion terms, prices and rates, andamounts payable on shares of the series in the event of anyvoluntary or involuntary liquidation, dissolution or winding upof the affairs of the Company. The Board of Directors may alsodetermine restrictions on the issuance of shares of the sameseries or of any other class or series, and the voting rights (ifany) of the holders of the series. There were no outstandingshares of preferred stock or series common stock as ofDecember <strong>31</strong>, <strong>2005</strong>.Preferred Share Purchase Rights Plan and Series AJunior Participating Preferred StockIn July 2002, the Board of Directors of the Companyadopted a preferred share purchase rights plan (the “RightsPlan”). In connection with the Rights Plan, the Board ofDirectors of the Company declared a dividend of one preferredshare purchase right (a “Right”) for each outstanding share ofcommon stock, par value $0.01 per share, of the Company. TheRights Plan expires in August 2012.The Rights have certain anti-takeover effects. The Rightswill cause substantial dilution to a person or group thatattempts to acquire the Company on terms not approved bythe Company’s Board of Directors, except pursuant to any offerconditioned on a substantial number of Rights being acquired.The Rights should not interfere with any merger or otherbusiness combination approved by the Board of Directors sincethe Rights may be redeemed by the Company at a redemptionprice of $0.001 per Right prior to the time that a person orgroup has acquired beneficial ownership of 15% or more ofthe common stock of the Company. In addition, the Board ofDirectors is authorized to reduce the 15% threshold to not lessthan 10%.Each Right entitles the holder to purchase one quarterof one-hundredth of a share of series A junior participatingpreferred stock from the Company at an exercise price of$27.50 and is exercisable only if a person or group acquires15% or more of the Company’s common stock. The Boardof Directors is authorized to issue up to 1.5 million shares ofseries A junior participating preferred stock. There were nooutstanding shares of series A junior participating preferredstock as of December <strong>31</strong>, <strong>2005</strong>.Treasury StockDuring the year ended December <strong>31</strong>, 2004, the Companyreceived 20,136 shares of common stock as consideration foremployees’ exercise of stock options. The value of the commonstock tendered by employees to exercise stock options wasbased upon the closing price on the dates of the respectivetransactions. The common stock tenders were in accordancewith the provisions of the 1998 Stock Purchase and OptionPlan, which was previously approved by the Company’s Boardof Directors.Equity OfferingOn March 23, 2004, the Company completed an offeringof 35,300,000 shares of the Company’s common stock, pricedat $11.25 per share. Net proceeds from the offering, afterdeducting underwriting discounts and commissions and otherexpenses, were $383.1 million, and were primarily used, asdiscussed in Note 6, to fund the acquisition of three coaloperations from RAG Coal International AG.77
The following table summarizes common share activityfrom December <strong>31</strong>, 2002 to December <strong>31</strong>, <strong>2005</strong>:Shares OutstandingDecember <strong>31</strong>, 2002 209,601,112Stock options exercised 9,055,080Employee stock purchases 304,268Stock grants to non-employee directors 19,960Stock grant to executive 40,000Shares repurchased (433,404)December <strong>31</strong>, 2003 218,587,016Stock options exercised 4,953,868Employee stock purchases 297,648Stock grants to non-employee directors 17,512Equity offering 35,300,000Shares repurchased (20,136)December <strong>31</strong>, 2004 259,135,908Stock options exercised 3,633,750Employee stock purchases 210,750Stock grants to non-employee directors 1,594Stock grants to employees 375,400December <strong>31</strong>, <strong>2005</strong> 263,357,402(20) EQUITY COMPENSATION PLANSLong-Term Equity Incentive PlansEffective May 6, 2004, shareholders approved and theCompany adopted the “2004 Long-Term Equity Incentive Plan,”making 14.0 million shares of the Company’s common stockavailable for grant. The Board of Directors may provide suchgrants in the form of stock appreciation rights, restricted stock,performance awards, incentive stock options, nonqualifiedstock options and stock units. The Company granted 0.4 millionstock options and 0.4 million shares of restricted stock grantsunder this plan for the year ended December <strong>31</strong>, <strong>2005</strong>.In connection with the initial public offering, the Companyadopted the “Long-Term Equity Incentive Plan,” making10.0 million shares of the Company’s common stock availablefor grant. The Board of Directors may provide such grantsin the form of stock appreciation rights, restricted stock,performance awards, incentive stock options, nonqualifiedstock options and stock units. The Company granted 3.9 millionand 2.7 million non-qualified options to purchase commonstock during the years ended December <strong>31</strong>, 2003 and 2002,respectively. These options generally vest over three years andexpire 10 years after date of grant. The Company granted0.2 million performance units under this plan for the year endedDecember <strong>31</strong>, <strong>2005</strong>.Performance units granted by the Company vest over athree year measurement period, subject to the achievement ofperformance goals at the conclusion of the three years. Threeperformance unit grants were outstanding during <strong>2005</strong>. Thepayout related to the 2003 grant (which will be settled in cash)is based on the Company’s stock price performance comparedto both an industry peer group and an S&P Index. The payoutrelated to the 2004 grant (which will be settled in cash) and<strong>2005</strong> grant (which will be settled in common stock) is based50% on stock price performance compared to both an industrypeer group and an S&P Index and 50% on a return on capitaltarget. During the years ended December <strong>31</strong>, <strong>2005</strong>, 2004 and2003, the Company granted 0.2 million, 0.5 million and0.4 million performance units in each period, respectively. Asa result of the Company’s performance under the terms ofthese grants, the Company recognized compensation expenseof $41.2 million, $21.1 million and $3.3 million in <strong>2005</strong>, 2004and 2003, respectively.Stock Purchase and Option PlanEffective May 19, 1998, the Company adopted the “1998Stock Purchase and Option Plan for Key Employees of P&LCoal Holdings Corporation,” making 22.4 million shares ofthe Company’s common stock available for grant. The Boardof Directors provided such grants in the form of stock, nonqualifiedoptions and incentive stock options. No grants weremade under this plan in <strong>2005</strong>.Non-Employee Director Equity Incentive PlanDuring the nine months ended December <strong>31</strong>, 2001,the Company also adopted the “Equity Incentive Plan forNon-Employee Directors.” Under that plan, members of theCompany’s Board of Directors who are not employees of theCompany or one of its affiliates will be eligible to receive grantsof restricted stock and stock options. All options granted underthe plan vest ratably over three years and will expire after10 years from the date of the grant, subject to earlier terminationin connection with a director’s termination of service. Membersof the Company’s Board of Directors are eligible for stockoption and restricted stock grants (made either from the EquityIncentive Plan for Non-Employee Directors or the Long-TermEquity Incentive Plan) at the date of their election and annuallyin January.The Company recognized compensation cost related togrants of common stock and options to management, employeesand non-employee directors of $1.6 million, $0.3 million and$0.4 million during the years ended December <strong>31</strong>, <strong>2005</strong>, 2004,and 2003, respectively.A summary of outstanding option activity is as follows:Year Weighted- Year Weighted- Year Weighted-Ended Average Ended Average Ended AverageDecember <strong>31</strong>, Exercise December <strong>31</strong>, Exercise December <strong>31</strong>, Exercise<strong>2005</strong> Price 2004 Price 2003 PriceBeginningbalance 14,468,336 $ 5.90 17,547,372 $ 5.22 23,095,<strong>31</strong>6 $4.26Granted 418,606 20.54 2,157,484 10.63 3,929,148 7.72Exercised (3,633,750) 6.22 (4,953,868) 5.55 (9,055,080) 3.87Forfeited (469,406) 5.75 (282,652) 6.03 (422,012) 4.83Outstanding 10,783,786 $ 6.37 14,468,336 $5.90 17,547,372 $5.22Exercisable 2,825,334 $ 7.35 4,126,956 $5.93 6,652,256 $5.2578 <strong>Peabody</strong> <strong>Energy</strong>
A summary of options outstanding and exercisable as ofDecember <strong>31</strong>, <strong>2005</strong> is as follows:Options OutstandingOptions ExercisableWeighted-Average Weighted- Weighted-Remaining Average AverageRange of Contractual Exercise ExerciseExercise Prices Number Life Price Number Price$3.58 5,900,708 3.1 $ 3.58 504,500 $ 3.58$5.85 to $6.82 469,682 6.0 6.70 460,806 6.71$6.83 to $7.80 1,605,136 6.6 7.23 832,060 7.16$7.81 to $8.77 367,566 7.8 8.40 321,710 8.46$8.78 to $9.75 404,000 7.8 9.74 402,666 9.75$9.76 to $10.72 1,482,656 8.0 10.49 263,098 10.49$10.73 to $17.24 137,432 8.4 12.20 40,494 12.24$17.25 to $25.86 406,654 9.1 20.24$25.87 to $30.66 9,952 9.6 30.5110,783,786 2,825,334The weighted-average fair values of the Company’s stockoptions and the assumptions used in applying the Black-Scholes option pricing model (for grants during the yearsended December <strong>31</strong>, <strong>2005</strong>, 2004 and 2003) were as follows:December <strong>31</strong>,<strong>2005</strong> 2004 2003Weighted-average fair value $8.03 $4.46 $3.38Risk-free interest rate 3.6% 3.9% 3.6%(21) ACCUMULATED OTHER COMPREHENSIVEINCOME (LOSS)The after-tax components of accumulated othercomprehensive income (loss) are as follows:TotalForeign Minimum AccumulatedCurrency Pension OtherTranslation Liability Cash Flow Comprehensive(Dollars in thousands) Adjustment Adjustment Hedges LossDecember <strong>31</strong>, 2002 $ 15 $(77,642) $ – $(77,627)Net decrease in value ofcash flow hedges – – (4,955) (4,955)Reclassification from othercomprehensive income to earnings – – (2,086) (2,086)Current period change 3,138 (42) – 3,096December <strong>31</strong>, 2003 3,153 (77,684) (7,041) (81,572)Net increase in value ofcash flow hedges – – 17,329 17,329Reclassification from othercomprehensive income to earnings – – (2,414) (2,414)Current period change – 6,039 – 6,039December <strong>31</strong>, 2004 3,153 (71,645) 7,874 (60,618)Net increase in value ofcash flow hedges – – 36,154 36,154Reclassification from othercomprehensive income to earnings – – (24,733) (24,733)Current period change – 2,402 – 2,402December <strong>31</strong>, <strong>2005</strong> $3,153 $(69,243) $ 19,295 $(46,795)Expected option life 5.7 years 5.9 years 6.6 yearsExpected volatility 40% 40% 42%Dividend yield 1.0% 1.0% 1.4%Employee Stock Purchase PlanDuring 2001, the Company adopted an employee stockpurchase plan. Total shares of common stock available forpurchase under the plan were 6.0 million. Eligible full-time andpart-time employees are able to contribute up to 15% of theirbase compensation into this plan, subject to a limit of $25,000per year. Employees are able to purchase Company commonstock at a 15% discount to the lower of the fair market valueof the Company’s common stock on the initial and endingdates of each offering period. Shares purchased under the planwere 0.2 million, 0.3 million and 0.3 million for the years endedDecember <strong>31</strong>, <strong>2005</strong>, 2004 and 2003, respectively.79
(22) RELATED PARTY TRANSACTIONSOn March 23, 2004, August 4, 2003, and May 7, 2003,Lehman Brothers Merchant Banking Partners II L.P. and affiliates(“Merchant Banking Fund”), the Company’s largest stockholderas of those dates, sold 41.1 million, 21.6 million and 22.5 millionshares, respectively, of the Company’s common stock. TheCompany did not receive any proceeds from the sales of sharesby Merchant Banking Fund. The March 2004 offering completedMerchant Banking Fund’s planned exit strategy and eliminatedthe remaining portion of their beneficial ownership of the Company.Lehman Brothers Inc. (“Lehman Brothers”) is an affiliate ofthe Merchant Banking Fund. In March 2004, Morgan Stanleyand Lehman Brothers served as joint managers in connectionwith the secondary equity offering discussed above. LehmanBrothers received from third parties customary underwritingdiscounts and commissions from the offering. The Companypaid no fees to Lehman Brothers related to the secondaryequity offerings. In May 2003 and August 2003, LehmanBrothers served as the lead underwriter in connection with thesecondary offerings discussed above and fees for their serviceswere paid by the selling shareholders and not by the Company.The Company paid incidental expenses customarily incurred bya registering company in connection with the secondary offerings.Lehman Brothers served as lead underwriter in connectionwith the Company’s sale of limited partner interests in PVRin March 2004 and December 2003, as discussed in Note 11above. Lehman Brothers received customary fees, plusreimbursement of certain expenses, for those services.As discussed in Note 14 above, in March 2003, theCompany refinanced a substantial portion of its indebtednessby entering into a new Senior Secured Credit Facility andissuing new Senior Notes. Based upon a competitive biddingprocess conducted by members of management and reviewedby members of the Company’s Board of Directors not affiliatedwith Lehman Brothers, the Company appointed WachoviaSecurities, Inc., Fleet Securities, Inc. and Lehman Brothersas lead arrangers for the Senior Secured Credit Facility, andLehman Brothers and Morgan Stanley as joint book runningmanagers for the Senior Notes. Lehman Brothers received totalfees of $7.4 million for their services in connection with therefinancing; such fees were consistent with the fees paid toother parties to the transaction for their respective services.As discussed in Note 14 above, in May 2003, the Companyentered into four $25.0 million fixed-to-floating interest rateswaps as a hedge of the changes in fair value of the 6.875%Senior Notes due 2013. Lehman Brothers was chosen as oneof the swap counterparties as part of a competitive biddingprocess among eight financial institutions.(23) GUARANTEES AND FINANCIAL INSTRUMENTSWITH OFF-BALANCE-SHEET RISKIn the normal course of business, the Company is a partyto guarantees and financial instruments with off-balancesheetrisk, such as bank letters of credit, performance orsurety bonds and other guarantees and indemnities, whichare not reflected in the accompanying consolidated balancesheets. Such financial instruments are valued based on theamount of exposure under the instrument and the likelihood ofperformance being required. In the Company’s past experience,virtually no claims have been made against these financialinstruments. Management does not expect any materiallosses to result from these guarantees or off-balance-sheetinstruments.Letters of Credit and BondingThe Company has letters of credit, surety bonds andcorporate guarantees (such as self bonds) in support of theCompany’s reclamation, lease, workers’ compensation,retiree healthcare and other obligations as follows as ofDecember <strong>31</strong>, <strong>2005</strong>:Workers’ RetireeReclamation Lease Compensation Healthcare(Dollars in thousands) Obligations Obligations Obligations Obligations Other (1) TotalSelf Bonding $ 671,815 $ – $ – $ – $ 2,917 $ 674,732Surety Bonds 335,644 258,769 19,193 – 28,411 642,017Letters of Credit 105 22,652 144,591 120,089 119,745 407,182$1,007,564 $281,421 $163,784 $120,089 $151,073 $1,723,9<strong>31</strong>(1) Other includes the two letters of credit obligations described below and an additional$71.3 million in self-bonding, letters of credit and surety bonds related to collateral forsurety companies, road maintenance, performance guarantees and other operations.The Company owns a 30.0% interest in a partnership thatleases a coal export terminal from the Peninsula Ports Authorityof Virginia under a 30-year lease that permits the partnershipto purchase the terminal at the end of the lease term for anominal amount. The partners have severally (but not jointly)agreed to make payments under various agreements whichin the aggregate provide the partnership with sufficient fundsto pay rents and to cover the principal and interest paymentson the floating-rate industrial revenue bonds issued by thePeninsula Ports Authority, and which are supported by lettersof credit from a commercial bank. The Company’s maximumreimbursement obligation to the commercial bank is in turnsupported by a letter of credit totaling $42.8 million.80 <strong>Peabody</strong> <strong>Energy</strong>
The Company is party to an agreement with the PensionBenefit Guarantee Corporation, or the PBGC, and TXUEurope Limited, an affiliate of the Company’s former parentcorporation, under which the Company is required to makespecial contributions to two of the Company’s defined benefitpension plans and to maintain a $37.0 million letter of credit infavor of the PBGC. If the Company or the PBGC gives noticeof an intent to terminate one or more of the covered pensionplans in which liabilities are not fully funded, or if the Companyfails to maintain the letter of credit, the PBGC may draw downon the letter of credit and use the proceeds to satisfy liabilitiesunder the Employee Retirement Income Security Act of 1974,as amended. The PBGC, however, is required to first applyamounts received from a $110.0 million guarantee in place fromTXU Europe Limited in favor of the PBGC before it draws on theCompany’s letter of credit. On November 19, 2002 TXU EuropeLimited was placed under the administration process in theUnited Kingdom (a process similar to bankruptcy proceedingsin the United States) and continues under this process as ofDecember <strong>31</strong>, <strong>2005</strong>. As a result of these proceedings, TXUEurope Limited may be liquidated or otherwise reorganized insuch a way as to relieve it of its obligations under its guarantee.Other GuaranteesThe Company owns a 49.0% interest in a joint venture thatoperates an underground mine and preparation plant facility inWest Virginia. The partners have severally agreed to guaranteethe debt of the joint venture, which consists of a $19.9 millionloan facility. Monthly principal payments on the loan facility ofapproximately $0.4 million are due through September 2010.Interest payments on the loan facility are due monthly andaccrue at prime, or 7.25%, as of December <strong>31</strong>, <strong>2005</strong>. The totalamount of the joint venture’s debt guaranteed by the Companywas $9.8 million as of December <strong>31</strong>, <strong>2005</strong>.The Company has guaranteed the performance of AssetManagement Group (“AMG”) under their coal purchasecontract with a third party, which has terms extendingthrough December <strong>31</strong>, 2006. Default occurs if AMG doesnot deliver specified monthly tonnage amounts to the thirdparty. In the event of a default, the Company would assumeAMG’s obligation to ship coal at agreed prices for theremaining term of the contract. As of December <strong>31</strong>, <strong>2005</strong>, themaximum potential future payments under this guarantee areapproximately $4.0 million, based on recent spot coal prices.As a matter of recourse in the event of a default, the Companyhas access to cash held in escrow and the ability to triggeran assignment of AMG’s assets to the Company. Based onthese recourse options and the remote probability of nonperformanceby AMG due to their proven operating history, theCompany has valued the liability associated with the guaranteeat zero.As part of arrangements through which the Companyobtains exclusive sales representation agreements with smallcoal mining companies (the “Counterparties”), the Companyissued financial guarantees on behalf of the Counterparties.These guarantees facilitate the Counterparties’ efforts to obtainbonding or financing. The Company also guaranteed bondingfor a partnership in which it formerly held an interest as partof an exchange in which the Company obtained strategicIllinois Basin coal reserves. The total amount guaranteed by theCompany was $5.5 million, and the fair value of the guaranteesrecognized as a liability was $0.4 million as of December <strong>31</strong>,<strong>2005</strong>. The Company’s obligations under the guarantees extendto September 2015.The Company is the lessee under numerous equipmentand property leases, as described in Note 11. It is common insuch commercial lease transactions for the Company, as thelessee, to agree to indemnify the lessor for the value of theproperty or equipment leased, should the property be damagedor lost during the course of the Company’s operations. TheCompany expects that losses with respect to leased propertywould be covered by insurance (subject to deductibles).The Company and certain of its subsidiaries haveguaranteed other subsidiaries’ performance under their variouslease obligations. Aside from indemnification of the lessor forthe value of the property leased, the Company’s maximumpotential obligations under its leases are equal to the respectivefuture minimum lease payments as presented in Note 11 andthe Company assumes that no amounts could be recoveredfrom third parties.The Company has provided financial guaranteesunder certain long-term debt agreements entered into byits subsidiaries, and substantially all of the Company’ssubsidiaries provide financial guarantees under long-term debtagreements entered into by the Company. Descriptions of theCompany’s (and its subsidiaries’) debt are included in Note 14.The maximum amounts payable under the Company’s debtagreements are presented in Note 14 and assume that noamounts could be recovered from third parties.In connection with the sale of Citizens Power LLC (“CitizensPower”), the Company has indemnified the buyer from certainlosses resulting from specified power contracts and guarantees.The indemnity is described in detail in Note 25. A discussion ofthe Company’s accounts receivable securitization is included inNote 5 to the consolidated financial statements.81
(24) FAIR VALUE OF FINANCIAL INSTRUMENTSSFAS No. 107, “Disclosures About Fair Value of FinancialInstruments,” defines the fair value of a financial instrumentas the amount at which the instrument could be exchanged ina current transaction between willing parties, other than in aforced or liquidation sale.The following methods and assumptions were used by theCompany in estimating its fair value disclosures for financialinstruments as of December <strong>31</strong>, <strong>2005</strong> and 2004:• Cash and cash equivalents, accounts receivable andaccounts payable and accrued expenses have carryingvalues which approximate fair value due to the shortmaturity or the financial nature of these instruments.• The fair value of the Company’s coal trading assetsand liabilities was determined as described in Note 4.• Long-term debt fair value estimates are based onestimated borrowing rates to discount the cash flowsto their present value. The 5.0% Subordinated Notecarrying amount is net of unamortized note discount.• The fair values of interest rate swap contracts,currency forward contracts and fuel hedgecontracts were provided by the respective contractcounterparties, and were based on benchmarktransactions entered into on terms substantiallysimilar to those entered into by the Company and thecontract counterparties. Based on these estimatesas of December <strong>31</strong>, <strong>2005</strong>, the Company would havepaid $6.7 million and $3.8 million, respectively, uponliquidation of its interest rate swaps and currencyforwards and would have received $33.9 million uponliquidation of its fuel hedges.• Other noncurrent liabilities include a deferredpurchase obligation related to the prior purchase of amine facility. The fair value estimate is based on thesame assumption as long-term debt.The carrying amounts and estimated fair values ofthe Company’s debt and deferred purchase obligation aresummarized as follows:December <strong>31</strong>, <strong>2005</strong> December <strong>31</strong>, 2004Carrying Estimated Carrying Estimated(Dollars in thousands) Amount Fair Value Amount Fair ValueLong-term debt $1,405,506 $1,389,666 $1,424,965 $1,447,235Deferred purchase obligation 1,397 1,402 6,717 6,807See Note 2 for a discussion of the Company’s derivativefinancial instruments.(25) COMMITMENTS AND CONTINGENCIESOklahoma Lead LitigationGold Fields Mining, LLC (“Gold Fields”), one of theCompany’s subsidiaries, is a dormant, non-coal producingentity that was previously managed and owned by HansonPLC, a predecessor owner of the Company. In the February1997 spin-off of its energy businesses, Hanson PLC transferredownership of Gold Fields to the Company, despite the fact thatGold Fields had no ongoing operations and the Company hadno prior involvement in its past operations. The Company hasagreed to indemnify a former affiliate of Gold Fields forcertain claims.Gold Fields and two other companies are defendantsin two class action lawsuits filed in the U.S. District Courtfor the Northern District of Oklahoma (Betty Jean Cole, etal. v. Asarco Inc., et al. and Darlene Evans, et al. v. AsarcoInc., et al.). The plaintiffs have asserted claims predicated onallegations of intentional lead exposure by the defendants andare seeking compensatory damages for diminution of propertyvalue, punitive damages and the implementation of medicalmonitoring and relocation programs for the affected individuals.A predecessor of Gold Fields formerly operated two leadmills near Picher, Oklahoma prior to the 1950s and mined, inaccordance with lease agreements and permits, approximately1.5% of the total amount of the ore mined in the county.Gold Fields is also a defendant, along with othercompanies, in several personal injury lawsuits involvingover 50 children, pending in the U.S. District Court for theNorthern District of Oklahoma, arising out of the same lead milloperations. Plaintiffs in these actions are seeking compensatoryand punitive damages for alleged personal injuries fromlead exposure. Previously scheduled trials for some of theseplaintiffs have been postponed.In December 2003, the Quapaw Indian tribe and certainQuapaw land owners filed a class action lawsuit against GoldFields and five other companies in the U.S. District Court forthe Northern District of Oklahoma. The plaintiffs are seekingcompensatory and punitive damages based on a variety oftheories. Gold Fields has filed a third-party complaint againstthe United States, and other parties. In February <strong>2005</strong>, the stateof Oklahoma on behalf of itself and several other parties sent anotice to Gold Fields and other companies regarding a possiblenatural resources damage claim.The outcome of litigation and these claims are subject tonumerous uncertainties. Based on the Company’s evaluationof the issues and their potential impact, the amount of anypotential loss cannot be estimated. However, the Companybelieves this matter is likely to be resolved without a materialadverse effect on the Company’s financial condition, results ofoperations or cash flows.82 <strong>Peabody</strong> <strong>Energy</strong>
Navajo NationOn June 18, 1999, the Navajo Nation served three of theCompany’s subsidiaries, including <strong>Peabody</strong> Western CoalCompany (“<strong>Peabody</strong> Western”), with a complaint that had beenfiled in the U.S. District Court for the District of Columbia. TheNavajo Nation has alleged 16 claims, including Civil RacketeerInfluenced and Corrupt Organizations Act (“RICO”) violationsand fraud. The complaint alleges that the defendants jointlyparticipated in unlawful activity to obtain favorable coallease amendments. The plaintiff is seeking various remediesincluding actual damages of at least $600 million, which couldbe trebled under the RICO counts, punitive damages of atleast $1 billion, a determination that <strong>Peabody</strong> Western’s twocoal leases have terminated due to <strong>Peabody</strong> Western’s breachof these leases and a reformation of these leases to adjustthe royalty rate to 20%. Subsequently, the court allowed theHopi Tribe to intervene in this lawsuit and the Hopi Tribe isalso seeking unspecified actual damages, punitive damagesand reformation of its coal lease. On March 4, 2003, theU.S. Supreme Court issued a ruling in a companion lawsuitinvolving the Navajo Nation and the United States rejecting theNavajo Nation’s allegation that the United States breached itstrust responsibilities to the Tribe in approving the coal leaseamendments.On February 9, <strong>2005</strong>, the U.S. District Court for the Districtof Columbia granted a consent motion to stay the litigation untilfurther order of the court. <strong>Peabody</strong> Western, the Navajo Nation,the Hopi Tribe and the customers purchasing coal from theBlack Mesa and Kayenta mines are in mediation with respect tothis litigation and other business issues.The outcome of litigation, or the current mediation, issubject to numerous uncertainties. Based on the Company’sevaluation of the issues and their potential impact, the amountof any potential loss cannot be estimated. However, theCompany believes this matter is likely to be resolved without amaterial adverse effect on the Company’s financial condition,results of operations or cash flows.The Future of the Mohave Generating Station and BlackMesa MineThe Company had been supplying coal to the MohaveGenerating Station pursuant to a long-term coal supplyagreement through its Black Mesa Mine. The mine suspendedits operations on December <strong>31</strong>, <strong>2005</strong>, and the coal supplyagreement expired on that date. As a part of the alternatedispute resolution referenced in the Navajo Nation litigation,<strong>Peabody</strong> Western has been participating in mediation withthe owners of the Mohave Generating Station and the NavajoGenerating Station and the two tribes to resolve the complexissues surrounding groundwater and other disputes involvingthe two generating stations. Resolution of these issues iscritical to the operation of the Mohave Generating Station afterDecember <strong>31</strong>, <strong>2005</strong>. There is no assurance that these issues willbe resolved. The Mohave plant was the sole customer of theBlack Mesa Mine, which sold 4.6 million tons of coal in <strong>2005</strong>.During <strong>2005</strong>, the mine generated $29.8 million of AdjustedEBITDA (reconciled to its most comparable measure undergenerally accepted accounting principles in Note 27), whichrepresented 3.4% of the Company’s total Adjusted EBITDA of$870.4 million.Salt River Project Agricultural Improvement and PowerDistrict — Mine Closing and Retiree Health CareSalt River Project and the other owners of the NavajoGenerating Station filed a lawsuit on September 27, 1996, inthe Superior Court of Maricopa County in Arizona seekinga declaratory judgment that certain costs relating to finalreclamation, environmental monitoring work and minedecommissioning and costs primarily relating to retiree healthcare benefits are not recoverable by the Company’s subsidiary,<strong>Peabody</strong> Western, under the terms of a coal supply agreementdated February 18, 1977. The contract expires in 2011. The trialcourt subsequently ruled that the mine decommissioning costswere subject to arbitration but that the retiree health care costswere not subject to arbitration. The Company has recorded areceivable for mine decommissioning costs of $74.2 millionand $68.6 million included in “Investments and other assets”in the consolidated balance sheets at December <strong>31</strong>, <strong>2005</strong>, andDecember <strong>31</strong>, 2004, respectively.The outcome of litigation is subject to numerousuncertainties. Based on the Company’s evaluation of the issuesand their potential impact, the amount of any potential losscannot be estimated. However, the Company believes thismatter is likely to be resolved without a material adverse effecton its financial condition, results of operations or cash flows.West Virginia Flooding LitigationThree of the Company’s subsidiaries have been namedin six separate complaints filed in Boone, Kanawha, Wyoming,and McDowell Counties, West Virginia seeking compensationfor property damage and personal injury arising out of floodingthat occurred in southern West Virginia during heavy rainstormsin July of 2001. These cases, along with approximately 50similar cases not involving the Company’s subsidiaries, includeapproximately 3,500 plaintiffs and 77 defendants engagedin the extraction of natural resources. Plaintiffs have allegedthat timbering, mining and disturbances of surface land bythe defendants in the extraction of natural resources causednatural surface waters to be diverted in unnatural ways, therebyresulting in flooding which would not have occurred absent thedefendants’ use and disturbance of surface lands.These cases have been consolidated pursuant to theCourt’s Mass Litigation Rules. The Mass Litigation Panel hasordered that the cases be tried based upon the six geographicwatersheds in which the flooding occurred. The first such trialis scheduled for early March 2006; however, the Company’ssubsidiaries held no active mining permits in the geographicarea which is the focus of the first trial. Trials involving twoadditional watersheds are scheduled for the second halfof 2006. No trials are scheduled for the remaining threewatersheds. Certain of the Company’s defendant subsidiariesdid hold multiple active permits in the five remaininggeographic watersheds. The Company’s insurance carrierhas acknowledged the Company’s tender of these claims andis currently providing a defense under applicable policies ofinsurance.While the outcome of litigation is subject to uncertainties,based on the Company’s preliminary evaluation of the issuesand the potential impact on it, the Company believes thismatter ultimately will be resolved without a material adverseeffect on its financial condition, results of operations orcash flows.83
Citizens PowerIn connection with the August 2000 sale of the Company’sformer subsidiary, Citizens Power, the Company has indemnifiedthe buyer, Edison Mission <strong>Energy</strong>, from certain losses resultingfrom specified power contracts and guarantees. During theperiod that the Company owned Citizens Power, Citizens Powerguaranteed the obligations of two affiliates to make paymentsto third parties for power delivered under fixed-priced powersales agreements with terms that extend through 2008.Edison Mission <strong>Energy</strong> has stated and the Company believesthere will be sufficient cash flow to pay the power suppliers,assuming timely payment by the power purchasers. In 2004,the Company incurred costs related to restructuring one of theindemnified power purchase agreements of $2.8 million, net ofa tax benefit of $1.9 million. These amounts are classified withindiscontinued operations in the statement of operations.EnvironmentalThe Company is subject to federal, state and localenvironmental laws and regulations, including theComprehensive Environmental Response, Compensation andLiability Act of 1980, as amended (“CERCLA” or “Superfund”),the Superfund Amendments and Reauthorization Act of 1986,the Clean Air Act, the Clean Water Act and the Conservationand Recovery Act. Superfund and similar state laws createliability for investigation and remediation in response toreleases of hazardous substances in the environment and fordamages to natural resources. Under that legislation and manystate Superfund statutes, joint and several liability may beimposed on waste generators, site owners and operators andothers regardless of fault. These regulations could require theCompany to do some or all of the following:• remove or mitigate the effects on the environment atvarious sites from the disposal or release of certainsubstances;• perform remediation work at such sites; and• pay damages for loss of use and non-use values.Environmental claims have been asserted against GoldFields related to activities of Gold Fields or its former affiliates.Gold Fields is a dormant, non-coal producing entity that waspreviously managed and owned by Hanson PLC, a predecessorowner of the Company. The Company has been named apotentially responsible party (“PRP”) based on CERCLA atfive sites, and claims have been asserted at 17 other sites. Thenumber of PRP sites in and of itself is not a relevant measureof liability, because the nature and extent of environmentalconcerns varies by site, as does the Company’s estimatedshare of responsibility.The Company’s policy is to accrue environmental cleanuprelatedcosts of a non-capital nature when those costs arebelieved to be probable and can be reasonably estimated.The quantification of environmental exposures requires anassessment of many factors, including the nature and extentof contamination, the timing, extent and method of theremedial action, changing laws and regulations, advancementsin environmental technologies, the quality of informationavailable related to specific sites, the assessment stage ofeach site investigation, preliminary findings and the length oftime involved in remediation or settlement. The Company alsoassesses the financial capability and proportional share of costsof other PRPs and, where allegations are based on tentativefindings, the reasonableness of the Company’s apportionment.The Company has not anticipated any recoveries frominsurance carriers in the estimation of liabilities recorded inits consolidated balance sheets. Undiscounted liabilitiesfor environmental cleanup-related costs for all of the sitesnoted above totaled $42.5 million at December <strong>31</strong>, <strong>2005</strong>,and $40.5 million at December <strong>31</strong>, 2004, $23.6 million and$15.1 million of which was a current liability, respectively.These amounts represent those costs that the Companybelieves are probable and reasonably estimable. In September<strong>2005</strong>, Gold Fields and other PRPs received a letter from the U.S.Department of Justice alleging that the PRPs’ mining operationscaused the Environmental Protection Agency (“EPA”) to incurapproximately $125 million in residential yard remediation costsat Picher, Oklahoma and will cause the EPA to incur additionalremediation costs relating to historic mining sites. Gold Fieldshas participated in the ongoing settlement discussions. Apredecessor of Gold Fields formerly operated two lead millsnear Picher, Oklahoma prior to the 1950s and mined, inaccordance with lease agreements and permits, approximately1.5% of the total amount of the ore mined in the county. GoldFields believes it has meritorious defenses to these claims. GoldFields is involved in other litigation in the Picher area, and theCompany has agreed to indemnify one of the defendants in thislitigation as discussed under the “Oklahoma Lead Litigation”caption above.Significant uncertainty exists as to whether claims will bepursued against Gold Fields in all cases, and where they arepursued, the amount of the eventual costs and liabilities, whichcould be greater or less than this provision.Although waste substances generated by coal mining andprocessing are generally not regarded as hazardous substancesfor the purposes of Superfund and similar legislation, someproducts used by coal companies in operations, such aschemicals, and the disposal of these products are governedby the statute. Thus, coal mines currently or previously ownedor operated by the Company, and sites to which the Companyhas sent waste materials, may be subject to liability underSuperfund and similar state laws.84 <strong>Peabody</strong> <strong>Energy</strong>
OtherIn addition, the Company at times becomes a party to otherclaims, lawsuits, arbitration proceedings and administrativeprocedures in the ordinary course of business. Managementbelieves that the ultimate resolution of pending or threatenedproceedings will not have a material effect on the financialposition, results of operations or liquidity of the Company.Accounts receivable in the consolidated balance sheetsas of December <strong>31</strong>, <strong>2005</strong>, and December <strong>31</strong>, 2004, included$9.9 million and $18.1 million, respectively, of receivables billedbetween 2001 and <strong>2005</strong> related to legal fees incurred in theCompany’s defense of the Navajo lawsuit discussed above. Thebillings have been disputed by two customers, who withheldpayment. The Company believes these billings were madeproperly under the coal supply agreements. The billings wereconsistent with past practice, when litigation costs related tolegal or regulatory issues were billed under the contract andpaid by the customer. One customer and the Company settledall claims for legal fees incurred to date as of December <strong>31</strong>,<strong>2005</strong>. The settlement did not have a material impact on theCompany’s results of operations for the year ended December <strong>31</strong>,<strong>2005</strong>. The Company is in litigation with a similar claim againstthe other customer to resolve this issue. In the second quarterof <strong>2005</strong>, the trial court dismissed the Company’s claim, and theCompany has appealed that decision. Although the Companybelieves it has meritorious grounds for appeal, the Companyrecognized an allowance against the disputed receivable, whichresulted in a charge of $9.9 million in <strong>2005</strong>. The net receivablebalance related to these claims, net of the allowance, was zeroand $18.1 million at December <strong>31</strong>, <strong>2005</strong>, and December <strong>31</strong>,2004, respectively.At December <strong>31</strong>, <strong>2005</strong>, purchase commitments for capitalexpenditures were approximately $138.5 million. Commitmentsfor expenditures to be made under coal leases are reflected inNote 11.(26) SUMMARY QUARTERLY FINANCIALINFORMATION (UNAUDITED)A summary of the unaudited quarterly results of operationsfor the years ended December <strong>31</strong>, <strong>2005</strong> and 2004, is presentedbelow. <strong>Peabody</strong> <strong>Energy</strong> common stock is listed on the NewYork Stock Exchange under the symbol “BTU.”Year Ended December <strong>31</strong>, <strong>2005</strong>(Dollars in thousandsexcept per share and First Second Third Fourthstock price data) Quarter Quarter Quarter QuarterRevenues $1,077,480 $1,108,786 $1,223,510 $1,234,677Operating profit 80,803 129,309 150,885 157,386Net income 51,890 95,254 113,340 162,169Basic earnings per share $0.20 $0.36 $0.43 $0.62Diluted earnings per share $0.19 $0.36 $0.42 $0.60Weighted-average sharesused in calculating basicearnings per share 260,693,518 261,630,146 262,432,394 263,076,194Weighted-average sharesused in calculating dilutedearnings per share 266,801,306 267,620,416 268,521,976 268,975,324Stock price – high andlow prices $ 25.47-$18.38 $ 28.23-$19.68 $ 43.03-$26.01 $ 43.48-$35.22Dividends per share $0.0375 $0.0375 $0.0475 $0.0475Operating profit for the first quarter of <strong>2005</strong> includedthe $<strong>31</strong>.1 million gain on the sale of PVR common units asdiscussed in Note 11 offset by $34.0 million of contract lossesprimarily related to a breach of a coal supply contract by aproducer. Second quarter operating profit included $12.5 millionof gains from property sales and a $12.5 million reduction ofestimated contract losses recorded in the first quarter of <strong>2005</strong>.Operating profit in the third quarter of <strong>2005</strong> included$43.6 million of gains resulting from exchanges of assetsand an additional $6.7 million recovery of the contract lossesrecorded in the first quarter. Operating profit for the thirdquarter and fourth quarter of <strong>2005</strong> included charges relatedto long-term compensation plans of $18.6 million and$11.6 million, respectively. Net income for the fourth quarterof <strong>2005</strong> included the tax benefit realized from the deemedliquidation of a subsidiary as discussed in Note 13 partiallyoffset by an increase in the valuation allowance onNOL carryforwards.85
Year Ended December <strong>31</strong>, 2004(Dollars in thousandsexcept per share and First Second Third Fourthstock price data) Quarter Quarter Quarter QuarterRevenues $772,293 $916,771 $918,989 $1,023,529Operating profit 38,723 51,827 73,905 82,243Net income 22,580 41,481 43,437 67,889Basic earnings per share $0.10 $0.16 $0.17 $0.26Diluted earnings per share $0.10 $0.16 $0.17 $0.26Weighted-average sharesused in calculating basicearnings per share 223,152,504 255,855,800 257,114,348 258,607,704Weighted-average sharesused in calculating dilutedearnings per share 228,619,396 261,753,044 263,116,128 264,903,612Stock price – high andlow prices $ 12.65-$9.11 $ 14.01-$10.44 $ 15.11-$12.69 $ 21.70-$13.51Dividends per share $0.0<strong>31</strong>3 $0.0<strong>31</strong>3 $0.0<strong>31</strong>3 $0.0375Operating profit for the first quarter and fourth quarter of2004 included the $9.9 million and $5.9 million, respectively,gains on the sale of PVR common units as discussed in Note 11.Operating profit for the third quarter and fourth quarter of2004 included $9.5 million and $11.5 million, respectively, inbusiness interruption insurance recoveries. Operating profitfor the second quarter and fourth quarter of 2004 includedcharges related to long-term compensation plans of $6.6 millionand $10.5 million, respectively. Net income for the secondquarter and the fourth quarter of 2004 included a reduction inthe valuation allowance on NOL carryforwards of $10.0 millionand $18.0 million, respectively. The results of operations fromthe RAG Coal International AG acquisitions were included inthe Company’s consolidated results of operations from theeffective date of the acquisitions, April 15, 2004.(27) SEGMENT INFORMATIONThe Company reports its operations primarily throughthe following reportable operating segments: “Western U.S.Mining,” “Eastern U.S. Mining,” “Australian Mining” and“Trading and Brokerage.” Western U.S. Mining operationsreflect the aggregation of the Powder River Basin, Southwestand Colorado operating segments, and Eastern U.S. Miningoperations reflect the aggregation of the Appalachia andMidwest operating segments. The principal business of theWestern U.S. Mining, Eastern U.S. Mining and Australian Miningsegments is the mining, preparation and sale of steam coal,sold primarily to electric utilities, and metallurgical coal, soldto steel and coke producers. For the year ended December <strong>31</strong>,<strong>2005</strong>, 87% of the Company’s sales were to U.S. electricitygenerators, 4% were to the U.S. industrial sector, and 9%were to customers outside the United States. Western U.S.Mining operations are characterized by predominantly surfacemining extraction processes, lower sulfur content and Btuof coal, and longer shipping distances from the mine to thecustomer. Conversely, Eastern U.S. Mining operations arecharacterized by a majority of underground mining extractionprocesses, higher sulfur content and Btu of coal, and shortershipping distances from the mine to the customer. Geologically,Western operations mine primarily subbituminous and Easternoperations mine bituminous coal deposits. Australian Miningoperations are characterized by surface and undergroundextraction processes, mining primarily low sulfur, metallurgicalcoal sold to an international customer base. The Trading andBrokerage segment’s principal business is the marketing,brokerage and trading of coal. “Corporate and Other” includesselling and administrative expenses, net gains on propertydisposals, costs associated with past mining obligations, jointventure earnings related to the Company’s 25.5% investmentin a Venezuelan mine and revenues and expenses related tothe Company’s other commercial activities such as coalbedmethane, generation development and resource management.The Company’s chief operating decision maker usesAdjusted EBITDA as the primary measure of segment profit andloss. Adjusted EBITDA is defined as income from continuingoperations before deducting early debt extinguishment costs,net interest expense, income taxes, minority interests, assetretirement obligation expense and depreciation, depletionand amortization.86 <strong>Peabody</strong> <strong>Energy</strong>
Operating segment results for the year ended December <strong>31</strong>,<strong>2005</strong> were as follows:Operating segment results for the year ended December <strong>31</strong>,2003 were as follows:Western Eastern Australian Trading and Corporate(Dollars in thousands) U.S. Mining U.S. Mining Mining Brokerage and Other ConsolidatedRevenues $1,611,587 $1,738,681 $598,085 $679,176 $16,924 $4,644,453Adjusted EBITDA 459,039 374,628 202,582 43,058 (208,909) 870,398Total assets 2,566,034 1,136,738 426,810 212,550 2,509,874 6,852,006Additions to property,plant, equipment andmine development 113,047 88,320 85,335 – 97,602 384,304Federal coal leaseexpenditures 118,364 – – – – 118,364Purchase of mining andrelated assets 84,695 34,988 – – 21,512 141,195Income fromequity affiliates 14 9,718 – – 20,364 30,096Operating segment results for the year ended December <strong>31</strong>,2004 were as follows:Western Eastern Australian Trading and Corporate(Dollars in thousands) U.S. Mining U.S. Mining Mining Brokerage and Other ConsolidatedRevenues $1,393,622 $1,501,352 $270,926 $454,537 $11,145 $3,6<strong>31</strong>,582Adjusted EBITDA 402,052 280,357 50,372 41,039 (214,576) 559,244Total assets 2,435,152 1,170,570 343,155 121,306 2,108,409 6,178,592Additions to property,plant, equipment andmine development 52,541 66,418 19,665 23 13,297 151,944Federal coal leaseexpenditures 114,653 – – – – 114,653Income fromequity affiliates 21 8,666 – – 3,712 12,399Western Eastern Australian Trading and Corporate(Dollars in thousands) U.S. Mining U.S. Mining Mining Brokerage and Other ConsolidatedRevenues $ 1,221,994$1,198,5<strong>31</strong> $29,435 $351,929 $13,407 $2,815,296Adjusted EBITDA 356,898 198,964 2,225 45,828 (193,637) 410,278Additions to property,plant, equipment andmine development <strong>31</strong>,667 111,815 1,393 1,943 9,625 156,443Income (loss) fromequity affiliates 36 (1,678) – – 4,514 2,872A reconciliation of Adjusted EBITDA to consolidatedincome from continuing operations follows:Year Ended Year Ended Year Ended(Dollars in thousands) December <strong>31</strong>, <strong>2005</strong> December <strong>31</strong>, 2004 December <strong>31</strong>, 2003Total Adjusted EBITDA $870,398 $559,244 $410,278Depreciation, depletion andamortization <strong>31</strong>6,114 270,159 234,336Asset retirementobligation expense 35,901 42,387 <strong>31</strong>,156Interest expense 102,939 96,793 98,540Early debt extinguishment costs – 1,751 53,513Interest income (10,641) (4,917) (4,086)Income tax provision (benefit) 960 (26,437) (47,708)Minority interests 2,472 1,282 3,035Income fromcontinuing operations $422,653 $178,226 $ 41,492(28) SUPPLEMENTAL GUARANTOR/NON-GUARANTOR FINANCIAL INFORMATIONSupplemental guarantor/non-guarantor financialinformation can be located in Note 28 of the Company’sconsolidated financial statements filed as part of the <strong>2005</strong><strong>Annual</strong> Report on Form 10-K with the U.S. Securities andExchange Commission.87
Board of Directors and ExecutivesDIRECTORSGregory H. Boyce (51) 3President andChief Executive Officer<strong>Peabody</strong> <strong>Energy</strong>B.R. “Bobby” Brown (73) 2Independent DirectorFormer Chairman, Presidentand Chief Executive OfficerCONSOL <strong>Energy</strong> Inc.William A. Coley (62) 3Independent DirectorPresident and Chief ExecutiveOfficer British <strong>Energy</strong> Group plcIrl F. Engelhardt (59) 3Chairman<strong>Peabody</strong> <strong>Energy</strong>Dr. Henry Givens, Jr. (72) 4Independent DirectorPresidentHarris-Stowe State UniversityWilliam E. James (60) 2Independent DirectorFounding PartnerRockPort Capital Partners LLCRobert B. Karn III (64) 1, 2Independent DirectorFormer ManagingPartner, Arthur AndersenFinancial & Consulting,St. LouisHenry E. Lentz (60) 3Independent DirectorAdvisory DirectorLehman Brothers Inc.William C. Rusnack (61) 1, 3Independent DirectorFormer President andChief Executive OfficerPremcor Inc.Dr. James R. Schlesinger (77) 4Independent DirectorFormer U.S. Secretaryof <strong>Energy</strong>, U.S. Secretaryof Defense & CIA DirectorDr. Blanche M. Touhill (74) 4Independent DirectorChancellor EmeritusUniversity of Missouri-St. LouisJohn F. Turner (63) 4Independent DirectorFormer U.S. Assistant Secretaryof State for Oceans andInternational Environmentaland Scientific AffairsSandra A. Van Trease (45) 1Independent DirectorGroup PresidentBJC HealthcareAlan H. Washkowitz (65) 4Independent DirectorFormer Managing DirectorLehman Brothers Inc.1 Audit CommitteeWilliam C. Rusnack, ChairRobert B. Karn IIISandra A. Van Trease2 Compensation CommitteeRobert B. Karn III, ChairB.R. BrownWilliam E. James3 Executive CommitteeGregory H. Boyce, ChairWilliam A. ColeyIrl F. EngelhardtHenry E. LentzWilliam C. Rusnack4 Nominating & CorporateGovernance CommitteeDr. Blanche M. Touhill, ChairDr. Henry Givens, Jr.Dr. James R. SchlesingerJohn F. TurnerAlan H. WashkowitzEXECUTIVESGregory H. Boyce (51)President andChief Executive OfficerCharles A. Burggraf (51)Group Vice PresidentTechnical ServicesIan S. Craig (52)Managing DirectorAustralian OperationsSharon D. Fiehler (49)Executive Vice PresidentHuman Resources andAdministrationRichard A. Navarre (45)Executive Vice Presidentand Chief Financial OfficerJiri Nemec (49)Group Vice PresidentU.S. Eastern OperationsFredrick D. Palmer (61)Senior Vice PresidentGovernment RelationsRoger B. Walcott, Jr. (49)Executive Vice PresidentResource Management andStrategic PlanningRichard M. Whiting (51)Executive Vice PresidentSales, Marketing & TradingKemal Williamson (46)Group Vice PresidentU.S. Western Operations88 <strong>Peabody</strong> <strong>Energy</strong>