Lab report writing guidelines - DePaul University
Lab report writing guidelines - DePaul University
Lab report writing guidelines - DePaul University
- No tags were found...

Create successful ePaper yourself
Turn your PDF publications into a flip-book with our unique Google optimized e-Paper software.
Writing Guidelines for CHE 341 (Version 1.4)In this class, your lab <strong>report</strong>s will follow the form of a formal scientific paper suitable forsubmission to a professional journal. Your <strong>report</strong>s will have the following sections: Abstract,Introduction, Experimental Procedures, Results, Discussion, Acknowledgements, andReferences. On Desire2Learn, there are links to selected sample papers from the journalBiochemistry. Use these as models. Additionally, I encourage you use papers from recent issuesof Biochemistry to get a feeling for the requirements. Below, I give advice for <strong>writing</strong> thesesections. Some former students have provided some examples.Guidelines for <strong>writing</strong> an “Abstract”An abstract should be a summary of the paper or <strong>report</strong>. An abstract enables a reader toidentify the basic content of a document quickly and accurately and allow them to assess if theywill want to read the full paper. It should provide a brief summary of each of the main sectionsof the paper: Introduction, Experimental Procedures, Results, and Discussion. It should (1) statethe principal objectives/purposes of the experiment upfront, (2) concisely describe theexperimental and data analysis methods, (3) mention KEY experimental conditions that wereessential to the results, (4) summarize the MAJOR results, and (4) and rationalize the resultswith the principal conclusions.Your abstract should be a single, typed paragraph of no more than 300 words. It should bewritten in the past tense because it refers to work done. It should never give any information orconclusion that is not stated in the <strong>report</strong>. Neither Figures nor Tables should be included in theAbstract. References to the literature must not be cited either. Since the abstract will bepublished search databases, footnotes or undefined abbreviations may not be used. If areference must be cited, complete publication data must be given [White, R. H. (1982)Biochemistry 21, 4271‐4275].The abstract below was submitted by a student. This student received a poor score because ithad problems. Can you spot the problems? [To be added later. Please be patient.]Guidelines for <strong>writing</strong> an “Introduction” sectionThe introduction should state the purpose of the investigation, its relationship to other work inthe field, and necessary theoretical background required to understand the system andmethods. The following are tips provided by former students:
Clearly state the purpose of the experiment at the very beginning or end of this section. Usethe objectives provided in the lab handout(s) to give you an idea of what you are expectedto know and explain in your lab <strong>report</strong>. You will lose a lot of points if the professor/TAcannot find a clearly stated purpose.You should state why problem being studied is important or interesting.Write the introduction after you have written the Results and Discussion. This ensures thatyou fully understand the experiment enough to put it into a broader context.Include relevant background information for the topic of interest. You will lose points if youdon’t. The kind of information you will need for the introduction is usually given in the prelabreadings or the pre‐lab lecture (take good notes).Make sure to include what you measured, how, and why. Don’t make this procedural,rather, explain the purpose of important procedural steps.It’s really good to reference many different publications to support and add information toyour introduction. Don’t just rehash the information in the lab handout.Skim some articles Read some papers in the current issueBelow is a sample of a good Introduction. I have underlined the purpose.Alzheimer’s Disease is a neurodegenerative disease characterized by the accumulation ofplaques in the brain. 1 These plaques form from the aggregation of amyloid‐β (Aβ) peptide,a peptide between 39‐43 amino acid residues in length. This peptide is known to bind thedivalent cations Cu 2+ and Zn 2+ at histidine residues positions 13 and 14. Such bindingaccelerates the rate of peptide aggregation and the formation of toxic fibrils and plaques. 1Previous studies have led to some insight into the role of metals in the formation ofpeptide aggregates. X‐ray absorption spectroscopy has identified portions of the 3‐dimensional structure of the Cu 2+ binding site which includes 3 histidine residues. 2,3Theoretical approaches have also been used to give information about the possiblecoordination intermediates between copper and Aβ peptide. 4Another experimental approach that has been used to study the binding of metals toamyloid‐β is Isothermal Titration Calorimetry (ITC). 5 In ITC studies, ligand aliquots areinjected into a sample of a macromolecule solution of known concentration to determinethe heat released upon binding. This is measured indirectly by monitoring the powerapplied to the sample cell to keep the temperature difference between the sample celland a reference cell constant. 6 Software has been developed that allows thedetermination of binding sites, ΔH values and equilibrium binding constants from the rawdata generated from ITC experiments.
Currently, the thermodynamic dissociation constant (K d ) for the binding of Cu 2+ with Aβ innot known at physiological pH. In this experiment, we used ITC to measure the K d bindingof Cu 2+ to the short Aβ peptide Aβ‐(1‐16) which contains the first 16 amino acid residuespresent in the complete peptide. The short peptide was chosen for convenience; itcontains the three histidine residues necessary for Cu 2+ binding but lacks the sequencecritical for aggregation. Cu 2+ is only weakly soluble at physiological pH due to formation ofa highly insoluble hydroxide species. 7 Thus, the binding affinity and thermodynamicparameters were measured at pH 5.5 and 6.0 in order to extrapolate thermodynamicparameters at a physiologically relevant pH.Guidelines for <strong>writing</strong> an Experimental Procedures (Material and Methods) sectionThis section should include sufficient detail to enable others to repeat your experiments. Thefirst paragraph of the Material and Methods should contain the list of materials. Names ofproducts, chemicals, and manufacturers should be included the source may make a significantdifference to the results. Provide the manufacturer and model information for analyticalequipment used to obtain data. Provide the source of all biological materials. For example, ifyou made a UV absorbance measurement, you should list the source of water and the modeland manufacturer of the spectrophotometer, but it is not necessary to detail the brand totubes, pipettors, and sodium phosphate used. Likewise, if you analyzed and plotted your datausing spreadsheet software, you should name the software package and manufacturer, but itnot necessary to detail the pens and paper used to write down the data.The paragraphs that follow should contain individual sections that describe each experimentalprocedure performed with just enough practical detail that the reader can reproduce yourwork. A description of the data analysis, important equations used, and calculations must alsobe included in the Methods section. The Material and Methods section should not be a re<strong>writing</strong>of the detailed lab procedure in your handouts, it should be succinct. For example, youshould mention the formulations of buffers (100 mM Tris buffer, pH 8.50 with 50 mM NaCl),but you should not describe the recipes to make concentrated stocks and steps you carried‐outto prepare the buffer.Whenever hazardous materials or dangerous procedures are utilized, the necessary precautionsshould be stated.Below is a sample of a good Material and Methods section:Materials: A previously obtained Aß‐(1‐16) peptide, amino acid sequenceDAEFRHDSGYEVHHQK (origin unknown, Dr. Lihua Jin’s lab, <strong>DePaul</strong> <strong>University</strong>) wasutilized for all measurements. Uv‐Vis absorbance was measured using a Nanodrop 1000
(Thermo Scientific). All calorimetry measurements were performed on a VP‐ITCMicrocalorimeter (MicroCal Inc, Northampton, MA) and degassed using a MicroCalThermovac (MicroCal Inc, Northampton, MA).Solution preparation. The Cu 2+ solution for titration was 0.176 mM CuCl 2 in pH = 5.5 MESbuffer (50 mM MES, 150 mM NaCl). The stock solution of Aβ peptide was determined tobe 1.21 mM using Beer’s Law, c = A/(εb), where A is the measured absorbance, ε is theextinction coefficient of 1280 M ‐1 cm ‐1 , and b was an assumed pathlength of 1 cm. TheAβ peptide stock solution was prepared to a final concentration of 0.0197 mM using thesame buffer used to dissolve copper.ITC Measurements. For the copper titration, the copper solution was loaded in the VP‐ITC Microcalorimeter syringe and the peptide was placed in the sample cell. Control ITCdata was acquired by injecting the same solution into the MES buffer used to preparethe peptide sample. Data was acquired with the following parameters: 29 injections(4μL for first injection, 10μL the remaining injections), 1.2 sec duration per mL ofinjected sample, 25 o C cell temperature, power of 15μcal/sec, initial delay of 600seconds with a 480 second spacing between injections, and a stirring speed of 310. Thefeedback mode was set to ‘high.’Analysis of ITC Data. Origin software (Originlabs Inc., Northampton, MA) was used toanalyze the raw ITC data. The raw data consisted of a plot of power against copperconcentration. The heat that is generated upon each injection of copper into thereaction cell generated a net amount of power that was applied in order to maintain theconstant temperature of 25 o C. The amount of heat that is associated with eachinjection can be represented by the function:q i V cellH [L i] bound(1)where q i is the heat that is applied, V cell is the volume of the reaction cell, and ∆[L i ] boundis the concentration of ligand that is bound to the peptide. Because q i can be calculatedby taking the integration of the peak in the power against ligand concentration plot andV cell and ∆[L i ] bound are known values, ∆H can be calculated from equation 1.The binding isotherm, the plot of ∆H against copper concentration, is then used todetermine the binding constant (K a ) for the binding of copper to Aß‐(1‐16). Bindingisotherms of the copper titration were subtracted from the binding isotherm of thecontrol data to account for account for the enthalpy of dilution unrelated to theenthalpy of copper‐peptide binding. Equation 1 can be modified in order to determineK a . Examination of the difference between the solutions at concentration n andconcentration n‐1 allows for the incorporation of the binding constant into equation 1.The simplest form of this equation can be shown as: Kq i V cellH [P] a[L] nK [L] a n1(2) 1 K a[L] n1 K a[L] n1
where K a is the association equilibrium constant, [L] is the amount of free ligand at thetwo points of interest, and [P] is the total amount of peptide. Upon the determination ofthe binding constant, free energy of binding ∆G can be determined using the equation:G RTlnK a(3)Entropy of binding was then determined from the relationship:G H TS (4)Thus, the three major thermodynamic parameters of ∆G, ∆H, and ∆S can be determinedfrom the ITC data that was generated for the titration of copper into a solution of Aß‐(1‐16).Guidelines for <strong>writing</strong> a “Results” sectionThe results section should concisely present the results of your work with some amount ofdescriptive narrative that explains what figures say and whether or not the results are of goodquality. It should present processed data primarily in the form of figures and tables (include rawdata only if it is requested in the assignment). As a rule, interpretation of the results should bereserved for the Discussion.All figures should have a legend that includes the figure number and a brief description,preferably one or two sentences or descriptive phrases. It should be understandable withoutreference to the text and should not include new material that is not in the text. The figure orthe legend should include a summary of the experimental conditions. Explain all symbols andabbreviations used in the illustrations. Simple symbols such as O, Δ, and ◊ should be used. Theuse of error bars on the data points is recommended. The statistical basis of the error barshould be explained.First‐order and second‐order rate constants (including steady‐state values of k cat and k cat /K M forenzymes) should be <strong>report</strong>ed in units of s ‐1 and M ‐1 s‐1 , respectively. Equilibrium bindingconstants should normally be <strong>report</strong>ed as dissociation constants with units of concentration (M,mM, μM, etc.). Steady‐state enzyme activity (specific activity) should be optimally <strong>report</strong>ed ask cat or, if there is uncertainty in the molar concentration of the catalyst, as a V max (nmol, μmol)of product formed per amount of protein per unit time. All <strong>report</strong>ed parameters should begiven with a calculated estimate of error and a description of the data analysis.Use tables only when the data cannot be presented clearly otherwise. Tables should benumbered consecutively with Arabic numerals. Provide a brief title for each table and a brief
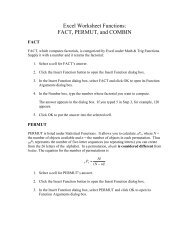
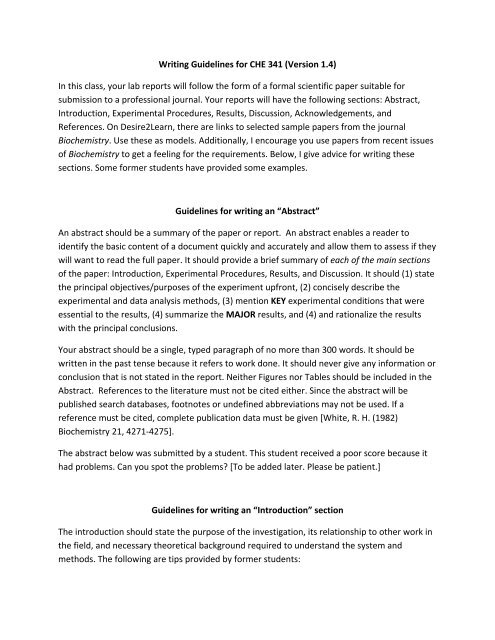
heading for each column. Clearly indicate the units of measure. Data should be rounded to thenearest significant figure. Give standard deviations if appropriate. Explanatory materialreferring to the whole table is to be included as a caption.Below are some tips from previous biochemistry students:Answer the “what was measured” question with ALL (unless otherwise advised) of theresults you collected during the experiment.Make sure to include, in paragraph form, a summary of the data you included in the lab<strong>report</strong> and how it will help you find what you’re measuring. Although one should be able tolook at the data and understand it, the written paragraph will provide extra informationthat cannot be put in a table or graph and will guide the reader through your figures.Make sure that your results make sense. For example, if your data should show a lineartrend but there are some outliers, discard the outliers but make sure to state later why youdiscarded them. Never fit a straight line to non‐linear data.Double check these things for tables and figures:o Do the plots have strong, descriptive titles that describe what is plotted? (e.g. don’tjust say “enzyme,” say exactly which enzyme was studied)o Are all axes labeled?o Are the conditions of the experiment are somewhere on the plot or in the caption?o Is there any missing information that is critical to understanding the figure?o Take a second look at them later to see if they still make sense to you.If in doubt, include all raw data. You won’t be penalized for presenting too much data.Before you leave lab, make sure you know all the appropriate units for your data. You mustinclude units for all values.When creating a table of figure, make it so that it can be understood without having to readthe summary paragraphs of the results. Make sure to always include statistical analyses ofyour data such as standard error.All tables and figures should be cited in the text.An easy way to add a caption to a table or figure is to right click it and select the “Addcaption” action. This will add a caption to your figure that will stay grouped with itthroughout the document and will prevent it from ending up on a separate page.Here is an example of a good figure:
Initial Rate of Reaction (M/sec)35302520151050Initial Rate of Product Formation as aFunction of Imaginase Concentrationy = 5xR² = 10 1 2 3 4 5 6 7Imaginase Concentration (mM)Figure 2. The Initial Rate as a Function of Enzyme Concentration Figure. Product formationwas monitored at by absorbace at 400 nm at 23 °C in 50 mM pH = 7.0 phosphate buffer. Thetrendline relationship is y = 5.00 x (R 2 = 1).Guidelines for <strong>writing</strong> a “Discussion” sectionThe purpose of the discussion is to interpret the results and to relate them to existingknowledge in the field. You should also be clear about the limits of your interpretation andsuggest further work that should be performed (every scientific experiment creates more newquestions than answers!). In general, observe the utmost brevity consistent with clarity.Information given elsewhere in the manuscript should not be repeated in the Discussion.ReferencesAny information that you did not determine in the study should be referenced. Referencesshould clearly identify the original contributor to the work being cited so that others can findthat work. Never reference the lab handouts for this class, they are not published works! Irecommend the American Chemical Society (ACS) formatting standards for <strong>report</strong>ingbibliographic information. For historic reasons the ACS journal Biochemistry has its own format;this format is also accepted. Below are examples of the ACS format for the most common typesof cited references. Nearly all bibliography utilities (e.g. Endnote) will automatically format to
these <strong>guidelines</strong> if you select “ACS journal” as your template.Article in a scientificjournalArticle in a popular/non‐scientificmagazineArticle from an onlinejournalWhole book, singleauthorEdited BookArticle from areference bookWeb pageJulia, S.; Lefebvre, C. Tetrahedron Lett. 1984, 25, 189Manning, R. Super Organics. Wired, May 2004, pp 176‐181Peacock‐Lopez, E. Exact Solutions of the Quantum Double Square‐Well Potential. Chem. Ed. [Online] 2007, 11, 383‐393http://chemeducator.org/bibs/0011006/11060380lb.htm(accessed Aug 23, 2007).Chang, R. General Chemistry: The Essential Concepts, 3rd ed.;McGraw‐Hill: Boston, 2003.Gbalint‐Kurti, G. G. Wavepacket Theory of Photodissociation andReactive Scattering. In Advances in Chemical Physics; Rice, S. A.,Ed.; Wiley: New York, 2004; Vol. 128; p 257.Powder Metallurgy. Kirk‐Othmer Encyclopedia of ChemicalTechnology, 3rd ed.; Wiley: New York, 1982; Vol. 19, pp 28‐62.National Library of Medicine. Environmental Health andToxicology: Specialized Information Services.http://sis.nlm.nih.gov/enviro.html (accessed Aug 23, 2008).Common Manuscript Errors to Avoid1. The line spacing in manuscripts should be greater than single spacing (1.5 or double isrecommended). This makes the text faster for the copy editor to read and leaves room foreditorial notations and comments.2. Always number the pages of manuscripts so that they can be easily reassembled in thecorrect order if they become detached, and so that the copy editor can refer to previousnotations.3. Always use past tense to relate an occurrence; e.g., “25 g (3.8 mmol) was added,” not “25 gis added.” When you write a <strong>report</strong> of your results, everything you did was an occurrence in
the past. However, your general conclusions from your results can be in present or futuretense (because they are always or will always be true).4. You do not have to use the passive voice. Nobody actually says, “To a stirring solution of Aand B, 23.0 mg of X was added with stirring for 10 minutes.” Lately, most journalsdiscourage the passive voice. Even though it is awkward to read and write this way,scientists still do it. It is acceptable to say, “We added 23.0 mg of X into a solution of A and Band continued to stir for 10 minutes.” Use passive voice if you want to, but if it feelsawkward and artificial to you then don’t use it.5. Do not begin sentences with numerals, formulas, or abbreviations.6. In English, quantities under ten are usually spelled. A “quantity” is anything that isquantized, i.e. cannot be fractional (examples: four tubes or nine trials). In a scientificmanuscript, measured values are not quantities. Thus, you should write “2 grams” not “twograms” or “a pH of 7.0” not “a pH of seven.”7. Always hyphenate compound adjectives, such as a “10‐mL portion” or a “freshly‐distilledsolvent.”8. For decimal fractions less than unity, always give a leading zero; e.g., “0.5 mL,” not “.5 mL.”9. In specifying quantities in the Experimental section, do not omit “of.” For example, “10 mLof buffer was added,” not “10 mL CH 2 Cl 2 was added.”10. There is a space between a quantity and its units; e.g., ‐78 °C, 7 mL, 5 h, 15 min. There isonly one exception, and that is a simple degree sign when referring to an actual measuredangle; e.g., α = 4.234°.11. You measure a spectrum “with” a spectrometer, not “on” a spectrometer. This applies to allspectra, i.e. NMR, infrared, optical rotations, etc.12. Do not use lab slang in manuscripts or <strong>report</strong>s. You do not “mass‐out” a substance. You“weigh” a substance or simply say the “mass was 25.01 grams.”13. In the Experimental section, you may use formulas for common inorganic reagents such asNaOH, HCl, H 2 SO 4 , MgSO 4 , etc., and for common organic solvents with very few carbonssuch as CH 2 Cl 2 (dichloromethane) and CHCI 3 (chloroform). Do not use formulas if they arenot readily interpretable or if they take as much space as the name itself (e.g., use hexane,not CH 3 CH 2 CH 2 CH 2 CH 2 CH 3 ).14. If you use abbreviation numbers to refer to chemical structures, the numbers areparenthesized if the number is used as an adjective and not parenthesized if the number is
a noun; e.g., “amine 5 was distilled” and “the procedure gave 56% yield of 2‐methylcyclohexanone (7).” In the first example “5” is the noun and “amine” is an adjective.In the second example “2‐methylcyclohexanone” is a noun and “7” is an adjective. A simpletest you can apply to see if the number should be parenthesized or not is to see whetheryou still have a valid sentence if the number is left out; the sentence will still work if anadjective is eliminated but not if a noun is eliminated.Useful Word Processing TipsThe shortcuts below apply to Windows and Linux. Mac users should replace the Control keywith the Command key (⌘).1. In MS Word, the degree symbol (°): Hold Shift‐Control‐@, then press 2. In MS Word: Superscript formatting: Control‐Shift‐= Subscript formatting: Control‐=3. You can enter equations in Word with the Equation Editor. In Word 2007, it is under Insert Equation (in the Symbols area). In older versions of Word, it is available under the menuitem Insert Object Microsoft Equation 3.0 (if this item is not available, run theMicrosoft Office installation utility and select it under Shared Options).4. You can make shortcuts Greek letters! In Word 2007 through Insert Symbol (in theSymbols area) More Symbols. In the pop‐up window, select “Greek and Coptic” under“Subset.” Highlight the symbol of interest, e.g. “μ.” Then select “Shortcut Key.” Now youcan press any combination of keys (or even a series like the series for the “°” symbol above).For example, I like to use Control‐Alt‐m for “μ,” Control‐Alt‐b for “β,” etc.5. An easy way to add a caption to a table or figure is to right click it and select the “Addcaption” action. This will add a caption to your figure that will stay grouped with itthroughout the document and will prevent it from ending up on a separate page.6. If you wish to include screenshots in your document, such as data processing images, followthese instructions. Windows: simply press the “Print Screen” key. This will copy the currentscreen image to the system buffer. Next open an image editor such as MS Paint or
Photoshop, create a new document, paste the image, and save. Mac OS: Simply press“Command+Shift+3” at the same time and a screen shot of your entire desktop will besaved to the desktop. To capture a portion of the screen, press “Command+Shift+4” at thesame time, a cross‐hair cursor will appear, click and drag to select the area you wish tocapture. When you release the mouse button, the screen shot will be automatically savedon your desktop.7. Finally, if you need to crop or otherwise edit images, and you don’t own Photoshop, thereyou have many free options. You can use iPhoto in Mac OS or one of the many freeprograms for Windows such as Photoscape or Google Picasa. Also, you can edit photosonline with free services such as Picnik and FotoFlexer.