in $000s, except per share amounts - Alere
in $000s, except per share amounts - Alere
in $000s, except per share amounts - Alere
- No tags were found...

You also want an ePaper? Increase the reach of your titles
YUMPU automatically turns print PDFs into web optimized ePapers that Google loves.
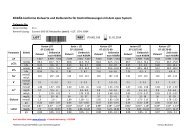
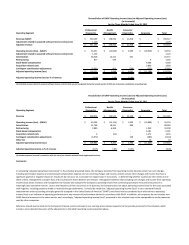
<strong>Alere</strong> Inc. and SubsidiariesCondensed Consolidated Statements of O<strong>per</strong>ations andReconciliation to Non-GAAP Adjusted Cash Basis Amounts(<strong>in</strong> <strong>$000s</strong>, <strong>except</strong> <strong>per</strong> <strong>share</strong> <strong>amounts</strong>)Three Months Ended September 30, 2011Three Months Ended September 30, 2010Non-GAAPNon-GAAPAdjustedAdjustedNon-GAAP Cash Non-GAAP CashGAAP Adjustments Basis (a) GAAP Adjustments Basis (a)Net product sales and services revenue $ 580,520 $ -$ 580,520 $ 534,556 $ -$ 534,556License and royalty revenue 5,249 - 5,249 4,123 - 4,123Net revenue 585,769 - 585,769 538,679 - 538,679Cost of net revenue 279,807 (14,473) (b) (c) (d) 265,334 253,133 (17,314) (b) (c) (d) (e) 235,819Gross profit 305,962 14,473 320,435 285,546 17,314 302,860Gross marg<strong>in</strong> 52% 55% 53% 56%O<strong>per</strong>at<strong>in</strong>g expenses:Research and development 34,772 (2,319) (b) (d) 32,453 32,434 (2,936) (b) (c) (d) 29,498Sell<strong>in</strong>g, general and adm<strong>in</strong>istrative 226,271 (60,407) (b) (c) (d) (f) (g) (k) 165,864 221,737 (68,180) (b) (c) (d) (f) (g) 153,557Total o<strong>per</strong>at<strong>in</strong>g expenses 261,043 (62,726) 198,317 254,171 (71,116) 183,055O<strong>per</strong>at<strong>in</strong>g <strong>in</strong>come 44,919 77,199 122,118 31,375 88,430 119,805Interest and other <strong>in</strong>come (expense), net 233,319 (269,442) (c) (h) (i) (j) (36,123) (26,655) (3,411) (c) (30,066)Income (loss) from cont<strong>in</strong>u<strong>in</strong>g o<strong>per</strong>ations before provision (benefit) for <strong>in</strong>come taxes 278,238 (192,243) 85,995 4,720 85,019 89,739Provision (benefit) for <strong>in</strong>come taxes 42,652 (16,252) (n) 26,400 (167) 30,432 (n) 30,265Income (loss) from cont<strong>in</strong>u<strong>in</strong>g o<strong>per</strong>ations before equity earn<strong>in</strong>gs of unconsolidated entities, net of tax 235,586 (175,991) 59,595 4,887 54,587 59,474Equity earn<strong>in</strong>gs (losses) of unconsolidated entities, net of tax 4,118 415 (b) (c) 4,533 (62) 1,896 (b) (c) 1,834Income (loss) from cont<strong>in</strong>u<strong>in</strong>g o<strong>per</strong>ations 239,704 (175,576) 64,128 4,825 56,483 61,308Income from discont<strong>in</strong>ued o<strong>per</strong>ations, net of tax - - - 2 13 (m) 15Net <strong>in</strong>come (loss) 239,704 (175,576) 64,128 4,827 56,496 61,323Less: Net <strong>in</strong>come attributable to non-controll<strong>in</strong>g <strong>in</strong>terests, net of tax 138 21 (l) 159 1,494 700 (l) 2,194Net <strong>in</strong>come (loss) attributable to <strong>Alere</strong> Inc. and Subsidiaries $ 239,566 $ (175,597)$ 63,969 $ 3,333 $ 55,796$ 59,129Preferred stock dividends $ (5,358)$ (5,358) $ (6,147)$ (6,147)Net <strong>in</strong>come (loss) available to common stockholders $ 234,208$ 58,611 $ (2,814)$ 52,982Basic net <strong>in</strong>come (loss) <strong>per</strong> common <strong>share</strong> attributable to <strong>Alere</strong> Inc. and Subsidiaries:Basic <strong>in</strong>come (loss) <strong>per</strong> common <strong>share</strong> from cont<strong>in</strong>u<strong>in</strong>g o<strong>per</strong>ations $ 2.84$ 0.71 $ (0.03)$ 0.62Basic <strong>in</strong>come <strong>per</strong> common <strong>share</strong> from discont<strong>in</strong>ued o<strong>per</strong>ations $ -$ -$ -$ -Basic net <strong>in</strong>come (loss) <strong>per</strong> common <strong>share</strong> $ 2.84$ 0.71 $ (0.03)$ 0.62Diluted net <strong>in</strong>come (loss) <strong>per</strong> common <strong>share</strong> attributable to <strong>Alere</strong> Inc. and Subsidiaries:Diluted <strong>in</strong>come (loss) <strong>per</strong> common <strong>share</strong> from cont<strong>in</strong>u<strong>in</strong>g o<strong>per</strong>ations $ 2.48 (o) $ 0.67 (q) $ (0.03) (p) $ 0.59 (r)Diluted <strong>in</strong>come <strong>per</strong> common <strong>share</strong> from discont<strong>in</strong>ued o<strong>per</strong>ations $ - (o) $ - (q) $ - (p) $ - (r)Diluted net <strong>in</strong>come (loss) <strong>per</strong> common <strong>share</strong> $ 2.48 (o) $ 0.67 (q) $ (0.03) (p) $ 0.59 (r)Weighted average common <strong>share</strong>s - basic 82,486 82,486 84,796 84,796Weighted average common <strong>share</strong>s - diluted 97,090 (o) 97,090 (q) 84,796 (p) 101,126 (r)(a) In calculat<strong>in</strong>g net <strong>in</strong>come or loss on an adjusted cash basis, the Company excludes from net <strong>in</strong>come or loss (i) certa<strong>in</strong> non-cash charges, <strong>in</strong>clud<strong>in</strong>g amortization expense and stock-based compensation expense, (ii) non-recurr<strong>in</strong>g charges and <strong>in</strong>come, and (iii) certa<strong>in</strong> other charges and<strong>in</strong>come that have a significant positive or negative impact on results yet do not occur on a consistent or regular basis <strong>in</strong> its bus<strong>in</strong>ess. In determ<strong>in</strong><strong>in</strong>g whether a particular item meets one of these criteria, management considers facts and circumstances that it believes are relevant.Management believes that exclud<strong>in</strong>g such charges and <strong>in</strong>come from net <strong>in</strong>come or loss allows <strong>in</strong>vestors and management to evaluate and compare the Company's o<strong>per</strong>at<strong>in</strong>g results from cont<strong>in</strong>u<strong>in</strong>g o<strong>per</strong>ations from <strong>per</strong>iod to <strong>per</strong>iod <strong>in</strong> a mean<strong>in</strong>gful and consistent manner. Due to the frequencyof their occurrence <strong>in</strong> its bus<strong>in</strong>ess, the Company does not adjust net <strong>in</strong>come or loss for the costs associated with litigation, <strong>in</strong>clud<strong>in</strong>g payments made or received through settlements. It should be noted that "net <strong>in</strong>come or loss on an adjusted cash basis" is not a standard f<strong>in</strong>ancialmeasurement under account<strong>in</strong>g pr<strong>in</strong>ciples generally accepted <strong>in</strong> the United States of America ("GAAP") and should not be considered as an alternative to net <strong>in</strong>come or loss or cash flow from o<strong>per</strong>at<strong>in</strong>g activities, as a measure of liquidity or as an <strong>in</strong>dicator of o<strong>per</strong>at<strong>in</strong>g <strong>per</strong>formance or anymeasure of <strong>per</strong>formance derived <strong>in</strong> accordance with GAAP. In addition, all companies do not calculate non-GAAP f<strong>in</strong>ancial measures <strong>in</strong> the same manner and, accord<strong>in</strong>gly, "net <strong>in</strong>come or loss on an adjusted cash basis" presented <strong>in</strong> this press release may not be comparable to similarmeasures used by other companies.(b) Amortization expense of $70.3 million and $74.4 million <strong>in</strong> the third quarter of 2011 and 2010 GAAP results, respectively, <strong>in</strong>clud<strong>in</strong>g $14.0 million and $16.1 million charged to cost of sales, $1.4 million and $1.2 million charged to research and development, $54.7 million and $56.9million charged to sell<strong>in</strong>g, general and adm<strong>in</strong>istrative, with $0.2 million and $0.2 million charged through equity earn<strong>in</strong>gs of unconsolidated entities, net of tax, dur<strong>in</strong>g each of the respective quarters.(c) Restructur<strong>in</strong>g associated with the decision to close facilities resulted <strong>in</strong> a charge of $3.4 million and a net recovery of $1.6 million for the third quarter of 2011 and 2010 GAAP results, respectively. The $3.4 million charge for the third quarter of 2011 <strong>in</strong>cluded $0.1 million charged tocost of sales, $3.1 million charged to sell<strong>in</strong>g, general and adm<strong>in</strong>istrative expense, $0.1 million charged to <strong>in</strong>terest expense and $0.2 million charged through equity earn<strong>in</strong>gs of unconsolidated entities, net of tax. The $1.6 million net recovery for the third quarter of 2010 <strong>in</strong>cluded a netrecovery of $0.7 million recorded to cost of sales, $0.2 million charged to research and development, $0.6 million charged to sell<strong>in</strong>g, general and adm<strong>in</strong>istrative expense, a net recovery of $3.4 million recorded to <strong>in</strong>terest and other <strong>in</strong>come (expense) and $1.7 million charged through equityearn<strong>in</strong>gs of unconsolidated entities, net of tax.(d) Compensation costs of $4.3 million and $7.3 million associated with stock-based compensation expense for the third quarter of 2011 and 2010 GAAP results, respectively, <strong>in</strong>clud<strong>in</strong>g $0.4 million and $0.6 million charged to cost of sales, $0.9 million and $1.5 million charged to research
(d) Compensation costs of $4.3 million and $7.3 million associated with stock-based compensation expense for the third quarter of 2011 and 2010 GAAP results, respectively, <strong>in</strong>clud<strong>in</strong>g $0.4 million and $0.6 million charged to cost of sales, $0.9 million and $1.5 million charged to researchand development and $3.0 million and $5.2 million charged to sell<strong>in</strong>g, general and adm<strong>in</strong>istrative, <strong>in</strong> the respective <strong>per</strong>iods.(e) A write-off <strong>in</strong> the amount of $1.3 million dur<strong>in</strong>g the third quarter of 2010, relat<strong>in</strong>g to <strong>in</strong>ventory write-ups recorded <strong>in</strong> connection with the acquisitions.(f) Acquisition-related costs <strong>in</strong> the amount of $2.9 million and $0.9 million <strong>in</strong> the third quarter of 2011 and 2010 GAAP results, respectively, recorded <strong>in</strong> connection with ASC 805, Bus<strong>in</strong>ess Comb<strong>in</strong>ations.(g) $3.8 million of <strong>in</strong>come and $4.6 million of expense <strong>in</strong> the third quarter of 2011 and 2010 GAAP results, respectively, recorded <strong>in</strong> connection with fair value adjustments to acquisition-related cont<strong>in</strong>gent consideration obligations <strong>in</strong> accordance with ASC 805, Bus<strong>in</strong>ess Comb<strong>in</strong>ations.(h) Interest expense of $1.3 million recorded <strong>in</strong> connection with fees paid for certa<strong>in</strong> debt modifications and the term<strong>in</strong>ation of our senior secured credit facility.(i) An $18.1 million unrealized foreign currency loss <strong>in</strong> the third quarter of 2011 GAAP results associated with a bank account funded for the potential acquisition of Axis-Shield Plc.(j) Recognition of a $288.9 million ga<strong>in</strong> orig<strong>in</strong>ally recorded <strong>in</strong> connection with the formation of SPD, our 50/50 jo<strong>in</strong>t venture with the Procter & Gamble Company.(k) A $0.6 million fair value write-down <strong>in</strong> the third quarter of 2011 recorded <strong>in</strong> connection with an idle facility.(l) Amortization expense of $27.0 thousand ($21.0 thousand, net of tax) and $0.9 million ($0.7 million, net of tax) <strong>in</strong> the third quarter of 2011 and 2010 GAAP results, respectively.(m) Expenses of $21.0 thousand ($13.0 thousand, net of tax) <strong>in</strong>curred <strong>in</strong> connection with the sale of our vitam<strong>in</strong>s and nutritional supplements bus<strong>in</strong>ess.(n) Tax effect on adjustments as discussed above <strong>in</strong> notes (b), (c), (d), (e), (f), (g), (h), (i), (j) and (k).(o) Included <strong>in</strong> the weighted average diluted common <strong>share</strong>s for the calculation of net <strong>in</strong>come <strong>per</strong> common <strong>share</strong> on a GAAP basis for the three months ended September 30, 2011, are dilutive <strong>share</strong>s consist<strong>in</strong>g of 756,000 common stock equivalent <strong>share</strong>s from the potential exercise of stockoptions and warrants. Also <strong>in</strong>cluded were dilutive <strong>share</strong>s consist<strong>in</strong>g of 3,438,000 common stock equivalent <strong>share</strong>s from the potential conversion of convertible debt securities, 189,000 common stock equivalents from the potential settlement of a portion of the deferred purchase priceconsideration related to the ACON Second Territory Bus<strong>in</strong>ess and 10,221,000 common stock equivalent <strong>share</strong>s from the potential conversion of Series B convertible preferred stock. The diluted net <strong>in</strong>come <strong>per</strong> common <strong>share</strong> calculation for the three months ended September 30, 2011, on aGAAP basis, <strong>in</strong>cluded the add back of <strong>in</strong>terest expense related to the convertible debt of $0.7 million, the add back of $5.4 million of preferred stock dividends related to the Series B convertible preferred stock and the add back of <strong>in</strong>terest expense related to the ACON Second TerritoryBus<strong>in</strong>ess of $25.0 thousand, result<strong>in</strong>g <strong>in</strong> net <strong>in</strong>come available to common stockholders of $240.3 million for the three months ended September 30, 2011.(p) For the three months ended September 30, 2010, potential dilutive <strong>share</strong>s were not used <strong>in</strong> the calculation of diluted net loss <strong>per</strong> common <strong>share</strong> under GAAP because <strong>in</strong>clusion thereof would be antidilutive.(q) Included <strong>in</strong> the weighted average diluted common <strong>share</strong>s for the calculation of net <strong>in</strong>come <strong>per</strong> common <strong>share</strong> for the three months ended September 30, 2011, on an adjusted cash basis, are dilutive <strong>share</strong>s consist<strong>in</strong>g of 756,000 common stock equivalent <strong>share</strong>s from the potential exerciseof stock options and warrants. Also <strong>in</strong>cluded were dilutive <strong>share</strong>s consist<strong>in</strong>g of 3,438,000 common stock equivalent <strong>share</strong>s from the potential conversion of convertible debt securities, 189,000 common stock equivalents from the potential settlement of a portion of the deferred purchaseprice consideration related to the ACON Second Territory Bus<strong>in</strong>ess and 10,221,000 common stock equivalent <strong>share</strong>s from the potential conversion of Series B convertible preferred stock. The diluted net <strong>in</strong>come <strong>per</strong> common <strong>share</strong> calculation for the three months ended September 30, 2011,on an adjusted cash basis, <strong>in</strong>cluded the add back of <strong>in</strong>terest expense related to the convertible debt of $0.7 million, the add back of $5.4 million of preferred stock dividends related to the Series B convertible preferred stock and the add back of <strong>in</strong>terest expense related to the ACON SecondTerritory Bus<strong>in</strong>ess of $25.0 thousand, result<strong>in</strong>g <strong>in</strong> net <strong>in</strong>come available to common stockholders of $64.7 million for the three months ended September 30, 2011.(r) Included <strong>in</strong> the weighted average diluted common <strong>share</strong>s for the calculation of net <strong>in</strong>come <strong>per</strong> common <strong>share</strong> for the three months ended September 30, 2010, on an adjusted cash basis, were dilutive <strong>share</strong>s consist<strong>in</strong>g of 1,030,000 common stock equivalent <strong>share</strong>s from the potentialexercise of stock options and warrants. Also <strong>in</strong>cluded were potential dilutive <strong>share</strong>s consist<strong>in</strong>g of 3,438,000 common stock equivalent <strong>share</strong>s from the potential conversion of convertible debt securities, 11,727,000 common stock equivalent <strong>share</strong>s from the potential conversion of Series Bconvertible preferred stock and 135,000 common stock equivalents from the potential settlement of a portion of the deferred purchase price consideration related to the ACON Second Territory Bus<strong>in</strong>ess. The diluted net <strong>in</strong>come <strong>per</strong> common <strong>share</strong> calculation for the three months endedSeptember 30, 2010, on an adjusted cash basis, <strong>in</strong>cluded the add back of <strong>in</strong>terest expense related to the convertible debt of $0.7 million, the add back of $6.1 million of preferred stock dividends related to the Series B convertible preferred stock and the add back of <strong>in</strong>terest expense related tothe ACON Second Territory Bus<strong>in</strong>ess of $24.0 thousand, result<strong>in</strong>g <strong>in</strong> net <strong>in</strong>come available to common stockholders of $59.9 million for the three months ended September 30, 2010.
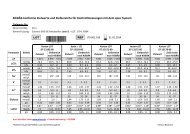
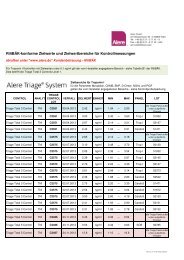
<strong>Alere</strong> Inc. and SubsidiariesCondensed Consolidated Statements of O<strong>per</strong>ations andReconciliation to Non-GAAP Adjusted Cash Basis Amounts(<strong>in</strong> <strong>$000s</strong>, <strong>except</strong> <strong>per</strong> <strong>share</strong> <strong>amounts</strong>)N<strong>in</strong>e Months Ended September 30, 2011N<strong>in</strong>e Months Ended September 30, 2010Non-GAAPNon-GAAPAdjustedAdjustedNon-GAAP Cash Non-GAAP CashGAAP Adjustments Basis (a) GAAP Adjustments Basis (a)Net product sales and services revenue $ 1,717,695 $ -$ 1,717,695 $ 1,560,841 $ -$ 1,560,841License and royalty revenue 17,723 - 17,723 16,052 - 16,052Net revenue 1,735,418 - 1,735,418 1,576,893 - 1,576,893Cost of net revenue 830,521 (51,667) (b) (c) (d) 778,854 745,392 (58,327) (b) (c) (d) (e) 687,065Gross profit 904,897 51,667 956,564 831,501 58,327 889,828Gross marg<strong>in</strong> 52% 55% 53% 56%O<strong>per</strong>at<strong>in</strong>g expenses:Research and development 112,662 (14,586) (b) (c) (d) 98,076 96,187 (9,397) (b) (c) (d) 86,790Sell<strong>in</strong>g, general and adm<strong>in</strong>istrative 700,257 (193,980) (b) (c) (d) (f) (g) (l) 506,277 653,171 (200,015) (b) (c) (d) (f) (g) 453,156Total o<strong>per</strong>at<strong>in</strong>g expenses 812,919 (208,566) 604,353 749,358 (209,412) 539,946O<strong>per</strong>at<strong>in</strong>g <strong>in</strong>come 91,978 260,233 352,211 82,143 267,739 349,882Interest and other <strong>in</strong>come (expense), net 129,225 (237,508) (c) (h) (i) (j) (k) (108,283) (86,240) (2,955) (c) (f) (89,195)Income (loss) from cont<strong>in</strong>u<strong>in</strong>g o<strong>per</strong>ations before provision (benefit) for <strong>in</strong>come taxes 221,203 22,725 243,928 (4,097) 264,784 260,687Provision (benefit) for <strong>in</strong>come taxes (4,414) 82,188 (p) 77,774 (964) 89,150 (p) 88,186Income (loss) from cont<strong>in</strong>u<strong>in</strong>g o<strong>per</strong>ations before equity earn<strong>in</strong>gs of unconsolidated entities, net of tax 225,617 (59,463) 166,154 (3,133) 175,634 172,501Equity earn<strong>in</strong>gs of unconsolidated entities, net of tax 4,922 1,185 (b) (c) 6,107 8,195 3,712 (b) (c) 11,907Income (loss) from cont<strong>in</strong>u<strong>in</strong>g o<strong>per</strong>ations 230,539 (58,278) 172,261 5,062 179,346 184,408Income from discont<strong>in</strong>ued o<strong>per</strong>ations, net of tax - - - 11,913 180 (m) 12,093Net <strong>in</strong>come (loss) 230,539 (58,278) 172,261 16,975 179,526 196,501Less: Net <strong>in</strong>come attributable to non-controll<strong>in</strong>g <strong>in</strong>terests, net of tax 160 54 (n) 214 1,167 3,463 (n) (o) 4,630Net <strong>in</strong>come (loss) attributable to <strong>Alere</strong> Inc. and Subsidiaries $ 230,379 $ (58,332)$ 172,047 $ 15,808 $ 176,063$ 191,871Preferred stock dividends $ (16,682)$ (16,682) $ (18,001)$ (18,001)Preferred stock repurchase $ 23,936 $ (23,936) (u) $ -$ - $ -$ -Net <strong>in</strong>come available to common stockholders $ 237,633$ 155,365 $ (2,193)$ 173,870Basic net <strong>in</strong>come (loss) <strong>per</strong> common <strong>share</strong> attributable to <strong>Alere</strong> Inc. and Subsidiaries:Basic <strong>in</strong>come (loss) <strong>per</strong> common <strong>share</strong> from cont<strong>in</strong>u<strong>in</strong>g o<strong>per</strong>ations $ 2.81$ 1.84 $ (0.17)$ 1.92Basic <strong>in</strong>come <strong>per</strong> common <strong>share</strong> from discont<strong>in</strong>ued o<strong>per</strong>ations $ -$ -$ 0.14$ 0.14Basic net <strong>in</strong>come (loss) <strong>per</strong> common <strong>share</strong> $ 2.81$ 1.84 $ (0.03)$ 2.06Diluted net <strong>in</strong>come (loss) <strong>per</strong> common <strong>share</strong> attributable to <strong>Alere</strong> Inc. and Subsidiaries:Diluted <strong>in</strong>come (loss) <strong>per</strong> common <strong>share</strong> from cont<strong>in</strong>u<strong>in</strong>g o<strong>per</strong>ations $ 2.56 (q) $ 1.74 (s) $ (0.17) (r) $ 1.80 (t)Diluted <strong>in</strong>come <strong>per</strong> common <strong>share</strong> from discont<strong>in</strong>ued o<strong>per</strong>ations $ - (q) $ - (s) $ 0.14 (r) $ 0.12 (t)Diluted net <strong>in</strong>come (loss) <strong>per</strong> common <strong>share</strong> $ 2.56 (q) $ 1.74 (s) $ (0.03) (r) $ 1.92 (t)Weighted average common <strong>share</strong>s - basic 84,508 84,508 84,269 84,269Weighted average common <strong>share</strong>s - diluted 100,058 (q) 100,058 (s) 84,269 (r) 101,124 (t)(a) (a) In calculat<strong>in</strong>g In net net <strong>in</strong>come or or loss loss on on an an adjusted cash cash basis, basis, the the Company excludes from from net net <strong>in</strong>come or or loss loss (i) (i) certa<strong>in</strong> non non-cash charges, <strong>in</strong>clud<strong>in</strong>g amortization expense and stock-based compensation expense, (ii) non-recurr<strong>in</strong>g charges and <strong>in</strong>come, and (iii) certa<strong>in</strong> other chargesand and <strong>in</strong>come that that have have a significant a positive or or negative impact on on results yet yet do do not not occur on on a a consistent or or regular basis i<strong>in</strong> n its bus<strong>in</strong>ess. In determ<strong>in</strong><strong>in</strong>g whether a particular item meets one of of these criteria, management considers facts facts and and circumstances ces that that it believes it believes are are relevant.relevant. Management Management believes believes that exclud<strong>in</strong>g that exclud<strong>in</strong>g such charges such charges and <strong>in</strong>come and from <strong>in</strong>come net from <strong>in</strong>come net or <strong>in</strong>come loss allows or loss <strong>in</strong>vestors allows <strong>in</strong>vestors and management and management to evaluate to and evaluate compare and the compare Company's the Company's o<strong>per</strong>at<strong>in</strong>g results o<strong>per</strong>at<strong>in</strong>g from results cont<strong>in</strong>u<strong>in</strong>g from o<strong>per</strong>ations cont<strong>in</strong>u<strong>in</strong>g from o<strong>per</strong>ations <strong>per</strong>iod from to <strong>per</strong>iod <strong>per</strong>iod <strong>in</strong> a to mean<strong>in</strong>gful <strong>per</strong>iod a and mean<strong>in</strong>gful consistent and manner. con sistent Due to themanner. frequency Due of to their frequency occurrence of <strong>in</strong> their its bus<strong>in</strong>ess, occurrence the Company <strong>in</strong> its bus<strong>in</strong>ess, does the not Company adjust net does <strong>in</strong>come not or adjust loss for net the <strong>in</strong>come costs or associated loss for the with cos litigation, ts associated <strong>in</strong>clud<strong>in</strong>g with payments litigation, made <strong>in</strong>clud<strong>in</strong>g or received payments through made settlements. or received through It should settlements. be noted that It "net should <strong>in</strong>come be noted or loss that on an "net adjusted <strong>in</strong>come cash or loss basis" on is an not adjusted a standard cashbasis" f<strong>in</strong>ancial is not measurement a standard f<strong>in</strong>ancial under account<strong>in</strong>g measurement pr<strong>in</strong>ciples under generally account<strong>in</strong>g accepted pr<strong>in</strong>ciples the generally United accepted States of <strong>in</strong> America the United ("GAAP") States of and America should not ("GAAP") be considered and should as an not alternative be considered to net as <strong>in</strong>come an alternative or loss or to cash net flow <strong>in</strong>come from or o<strong>per</strong>at<strong>in</strong>g loss or cash activities, flow from as a o<strong>per</strong>at<strong>in</strong>g measure activities, of liquidity as or a meas an <strong>in</strong>dicator ure of liquidity of o<strong>per</strong>at<strong>in</strong>g or as an<strong>in</strong>dicator <strong>per</strong>formance of o<strong>per</strong>at<strong>in</strong>g or any <strong>per</strong>formance measure of <strong>per</strong>formance any measure derived of <strong>per</strong>formance <strong>in</strong> accordance derived with GAAP. <strong>in</strong> accordance In addition, with all GAAP. companies In addition, do not all calculate companies non-GAAP do not calculate f<strong>in</strong>ancial non-GAAP measures <strong>in</strong> f<strong>in</strong>ancial the same measures manner and, <strong>in</strong> the accord<strong>in</strong>gly, same manner "net and, <strong>in</strong>come accord<strong>in</strong>gly, loss on "net an <strong>in</strong>come adjusted or cash loss basis" on an presented adjusted cash <strong>in</strong> this basis" press pr release esented may <strong>in</strong> not this bepresscomparablerelease mayto similarnot bemeasurescomparableusedtobysimilarothermeasurescompanies.used by other companies.(b) Amortization expense of $227.8 million and $220.7 million <strong>in</strong> the first n<strong>in</strong>e months of 2011 and 2010 GAAP results, respectively, <strong>in</strong>clud<strong>in</strong>g $48.2 million and $46.7 million charged to cost of sales, $11.1million and $3.5 million charged to research and development, $167.8(b) Amortization expense of $227.8 million and $220.7 million <strong>in</strong> the first n<strong>in</strong>e months of 2011 and 2010 GAAP results, respect ively, <strong>in</strong>clud<strong>in</strong>g $48.2 million and $46.7 million charged to cost of sales, $11.1million and $3.5 million charged to research and development, $167.8million and $169.8 million charged to sell<strong>in</strong>g, general and adm<strong>in</strong>istrative, with $0.7 million and $0.7 million charged through equity earn<strong>in</strong>gs of unconsolidated entities, net of tax, dur<strong>in</strong>g each of the respective <strong>per</strong>iods.million and $169.8 million charged to sell<strong>in</strong>g, general and adm<strong>in</strong>istrative, with $0.7 million and $0.7 million charged through equity earn<strong>in</strong>gs of unconsolidated entities, net of tax, dur<strong>in</strong>g each of the respective <strong>per</strong>iods.
(c) Restructur<strong>in</strong>g charges associated with the decision to close facilities of $20.4 million and $13.5 million <strong>in</strong> the first n<strong>in</strong>e months of 2011 and 2010 GAAP results, respectively. The $20.4 million charge for the n<strong>in</strong>e months ended September 30, 2011 <strong>in</strong>cluded $2.3 million(c) charged Restructur<strong>in</strong>g to cost charges of sales, associated $0.4 million with charged the decision to research to close and facilities development, of $20.4 $16.9 million million and charged $13.5 million to sell<strong>in</strong>g, the general first niand ne months adm<strong>in</strong>istrative of 2011 expense, and 2010 $0.2 GAAP million results, charged respectively. to <strong>in</strong>terest The expense $20.4 million and $0.5 charge million for charged the n<strong>in</strong>e through months equity ended earn<strong>in</strong>gs September of unconsolidated 30, 2011 <strong>in</strong> cluded entities, $2.3 net million of tax. charged Theto $13.5 cost of million sales, $0.4 charge million for the charged n<strong>in</strong>e months to research ended and September development, 30, 2010 $16.9 <strong>in</strong>cluded million $3.3 charged million to charged sell<strong>in</strong>g, general to cost of and sales, adm<strong>in</strong>istrat $0.5 million ive expense, charged $0.2 to research million and charged development, to <strong>in</strong>terest $9.6 expense million and charged $0.5 million to sell<strong>in</strong>g, charged general through and adm<strong>in</strong>istrative equity earn<strong>in</strong>gs expense, of unconsolidated a net recovery entities of $3.1 , net million of tax. recorded The $13.5 tomillion <strong>in</strong>terest charge and other for the <strong>in</strong>come n<strong>in</strong>e months (expense) ended and September $3.2 million 30, charged 2010 <strong>in</strong>cluded through equity $3.3 million earn<strong>in</strong>gs charged of unconsolidated to cost of sales, entities, $0.5 million net of tax. char ged to research and development, $9.6 million charged to sell<strong>in</strong>g, general and adm<strong>in</strong>istrative expense, a net recovery of $3.1 mill ion recorded to <strong>in</strong>terestand other <strong>in</strong>come (expense) and $3.2 million charged through equity earn<strong>in</strong>gs of unconsolidated entities, net of tax.(d) Compensation costs of $16.3 million and $22.9 million associated with stock-based compensation expense for the first n<strong>in</strong>e months of 2011 and 2010 GAAP results, respectively, <strong>in</strong>clud<strong>in</strong>g $1.1 million and $1.4 million charged to cost of sales, $3.0 million and $5.4 million(d) charged Compensation to research costs and of development $16.3 million and $12.1 $22.9 million and associated $16.1 million with stock charged -based to sell<strong>in</strong>g, compensation general expense and adm<strong>in</strong>istrative, for the first n<strong>in</strong>e the months respective of 2011 <strong>per</strong>iods. and 2010 GAAP results, respectively, <strong>in</strong>clud<strong>in</strong>g $1.1 million and $1.4 million charged to cost of sales, $3.0 mill ion and $5.4 millioncharged to research and development and $12.1 million and $16.1 million charged to sell<strong>in</strong>g, general and adm<strong>in</strong>istrative, <strong>in</strong> th e respective <strong>per</strong>iods.(e) A write-off <strong>in</strong> the amount of $7.0 million dur<strong>in</strong>g the first n<strong>in</strong>e months of 2010, relat<strong>in</strong>g to <strong>in</strong>ventory write-ups recorded <strong>in</strong> connection with the acquisitions . (See also footnote o below.)(e) A write-off <strong>in</strong> the amount of $7.0 million dur<strong>in</strong>g the first n<strong>in</strong>e months of 2010, relat<strong>in</strong>g to <strong>in</strong>ventory write -ups recorded <strong>in</strong> connection with the acquisitions . (See also footnote o below.)(f) Acquisition-related costs <strong>in</strong> the amount of $6.2 million and $6.9 million <strong>in</strong> the first n<strong>in</strong>e months of 2011 and 2010 GAAP results, respectively, recorded <strong>in</strong> connection with ASC 805, Bus<strong>in</strong>ess Comb<strong>in</strong>ations. The $6.9 million of acquisition-related costs recorded dur<strong>in</strong>g the n<strong>in</strong>emonths ended September 30, 2010 <strong>in</strong>cluded $6.8 million charged to sell<strong>in</strong>g, general and adm<strong>in</strong>istrative and $0.1 million charged to <strong>in</strong>terest expense.(f) Acquisition-related costs <strong>in</strong> the amount of $6.2 million and $6.9 million <strong>in</strong> the first n<strong>in</strong>e months of 2011 and 2010 GAAP resu lts, respectively, recorded <strong>in</strong> connection with ASC 805, Bus<strong>in</strong>ess Comb<strong>in</strong>ations. The $6.9 million of acquisition-related costs recorded dur<strong>in</strong>g the n<strong>in</strong>emonths ended September 30, 2010 <strong>in</strong>cluded $6.8 million charged to sell<strong>in</strong>g, general and adm<strong>in</strong>istrative and $0.1 million charged to <strong>in</strong>terest expense.(g) $9.7 million and $2.3 million of <strong>in</strong>come <strong>in</strong> the first n<strong>in</strong>e months of 2011 and 2010 GAAP results, respectively, recorded <strong>in</strong> connection with fair value adjustments to acquisition-related cont<strong>in</strong>gent consideration obligations <strong>in</strong> accordance with ASC 805, Bus<strong>in</strong>ess Comb<strong>in</strong>ations.(g)(h)$9.7Amillion$1.9 millionand $2.3realizedmillionforeignof <strong>in</strong>comecurrency<strong>in</strong> thelossfirstassociatedn<strong>in</strong>e monthswithofthe2011settlementand 2010of anGAAPacquisition-relatedresults, respectively,cont<strong>in</strong>gentrecordedconsideration<strong>in</strong> connectionobligationwith fair<strong>in</strong> thevaluefirstadjustmentsn<strong>in</strong>e monthstoofacquisition-related2011.cont<strong>in</strong>gent consideration obligations <strong>in</strong> accordance with ASC 805, Bus<strong>in</strong>ess Comb<strong>in</strong>ations.(h)(i) A $1.9 Interest million expense realized of $31.2 foreign million currency recorded loss associated <strong>in</strong> connection with with the fees settlement paid for of certa<strong>in</strong> an acquisition debt modifications -related cont<strong>in</strong>gent and the term<strong>in</strong>ation consideration of our obligation senior secured <strong>in</strong> the first credit n<strong>in</strong>e facility months and of related 2011. <strong>in</strong>terest rate swap agreement <strong>in</strong> the first n<strong>in</strong>e months of 2011.(i) (j) Interest An $18.1 expense million of $31.2 unrealized million foreign recorded currency <strong>in</strong> connection loss <strong>in</strong> the with third fees quarter paid for of 2011 certa<strong>in</strong> GAAP debt results modifications associated and with the a term<strong>in</strong>atio bank account n of funded our senior for secured the potential credit acquisition facility and of related Axis-Shield <strong>in</strong>terest Plc. rate swap agreement <strong>in</strong> the first n<strong>in</strong>e months of 2011.(j) (k) An $18.1 Recognition million of unrealized a $288.9 foreign million currency ga<strong>in</strong> orig<strong>in</strong>ally loss <strong>in</strong> recorded the third <strong>in</strong> quarter connection of 2011 with GAAP the formation results associated of SPD, our with 50/50 a bank jo<strong>in</strong>t accoun venture t funded with the for Procter the potential & Gamble acquisition Company. of Axis-Shield Plc.(k)(l) Recognition A $0.6 million of a $288.9 fair value million write-down ga<strong>in</strong> orig<strong>in</strong>ally <strong>in</strong> the first recorded n<strong>in</strong>e months <strong>in</strong> connection of 2011 with recorded the formation <strong>in</strong> connection of SPD, with our an 50/50 idle facility. jo<strong>in</strong>t venture with the Procter & Gamble Company.(l) (m) A $0.6 Expenses million of fair $0.3 value million write-down ($0.2 million, <strong>in</strong> the first net of n<strong>in</strong>e tax) months <strong>in</strong>curred of 2011 <strong>in</strong> connection recorded with <strong>in</strong> connection the sale of with our vitam<strong>in</strong>s an idle facility. and nutritional supplements bus<strong>in</strong>ess. <strong>in</strong> the first n<strong>in</strong>e months of 2010.(m)(n)ExpensesAmortizationof $0.3expensemillionof($0.2$70.0million,thousandnet of($54.0tax) <strong>in</strong>curredthousand,<strong>in</strong>netconnectionof tax) andwith$2.9themillionsale of($2.2our vitam<strong>in</strong>smillion,andnet ofnutritionaltax) <strong>in</strong> thesupplementsfirst n<strong>in</strong>e monthsbus<strong>in</strong>ess.of 2011<strong>in</strong> theandfirst2010n<strong>in</strong>eGAAPmonthsresults,of 2010.respectively.(o) A write-off <strong>in</strong> the amount of $1.7 million ($1.3 million, net of tax) <strong>in</strong> the first n<strong>in</strong>e months of 2010 relat<strong>in</strong>g to <strong>in</strong>ventory write-ups attributable to o<strong>per</strong>at<strong>in</strong>g results of non-controll<strong>in</strong>g <strong>in</strong>terests.(n) Amortization expense of $70.0 thousand ($54.0 thousand, net of tax) and $2.9 million ($2.2 million, net of tax) <strong>in</strong> the fi rst n<strong>in</strong>e months of 2011 and 2010 GAAP results, respectively.(p) Tax effect on adjustments as discussed above <strong>in</strong> notes (b), (c), (d), (e), (f), (g), (h), (i), (j), (k) and (l).(o) A write-off <strong>in</strong> the amount of $1.7 million ($1.3 million, net of tax) <strong>in</strong> the first n<strong>in</strong>e months of 2010 relat<strong>in</strong>g to <strong>in</strong>ventory write-ups attributable to o<strong>per</strong>at<strong>in</strong>g results of non-controll<strong>in</strong>g <strong>in</strong>terests.(q) Included <strong>in</strong> the weighted average diluted common <strong>share</strong>s for the calculation of net <strong>in</strong>come <strong>per</strong> common <strong>share</strong> on a GAAP basis for the n<strong>in</strong>e months ended September 30, 2011, are dilutive <strong>share</strong>s consist<strong>in</strong>g of 1,198,000 common stock equivalent <strong>share</strong>s from the potential(p) exercise Tax effect of on stock adjustments options and as warrants. discussed Also above <strong>in</strong>cluded notes were (b), dilutive (c), (d), <strong>share</strong>s (e), (f), consist<strong>in</strong>g (g), (h), (i), of (j), 3,438,000 (k) and (l). common stock equivalent <strong>share</strong>s from the potential conversion of convertible debt securities, 189,000 common stock equivalents from the potential settlement of a portion of thedeferred purchase price consideration related to the ACON Second Territory Bus<strong>in</strong>ess and 10,725,000 common stock equivalent <strong>share</strong>s from the potential conversion of Series B convertible preferred stock. The diluted net <strong>in</strong>come <strong>per</strong> common <strong>share</strong> calculation for the n<strong>in</strong>e months(q) ended Included September <strong>in</strong> the weighted 30, 2011, average on a GAAP diluted basis, common <strong>in</strong>cluded <strong>share</strong>s the add for the back calculation of <strong>in</strong>terest of expense net <strong>in</strong>come related <strong>per</strong> to common the convertible <strong>share</strong> on debt a GAAP of $2.1 basis million, for the the n<strong>in</strong>e add months back of ended $16.7 million September of preferred 30, 2011, stock are dilutive dividends <strong>share</strong>s related consist<strong>in</strong>g to the Series of 1,198,000 B convertible common preferred stock equivalent stock and the <strong>share</strong>s add from back of t he <strong>in</strong>terest potential expenseexercise related of to stock the ACON options Second and warrants. Territory Also Bus<strong>in</strong>ess <strong>in</strong>cluded of $0.1 were million, dilutive result<strong>in</strong>g <strong>share</strong>s consist<strong>in</strong>g <strong>in</strong> net <strong>in</strong>come of 3,438,000 available common to common stock stockholders equivalent of sh $256.5 ares from million the potential for the n<strong>in</strong>e conversion months ended of convertible September debt 30, securities, 2011. 189,000 common stock equivalents from the potential settlemen t of a portion of thedeferred purchase price consideration related to the ACON Second Territory Bus<strong>in</strong>ess and 10,725,000 common stock equivalent sh ares from the potential conversion of Series B convertible preferred stock. The diluted net <strong>in</strong>come <strong>per</strong> common <strong>share</strong> calculation for the n<strong>in</strong>emonths (r) For ended the n<strong>in</strong>e September months ended 30, 2011, September on a GAAP 30, 2010, basis, potential <strong>in</strong>cluded dilutive the add <strong>share</strong>s back of were <strong>in</strong>terest not used expense <strong>in</strong> the related calculation to the of convertible diluted net debt <strong>in</strong>come o f $2.1 <strong>per</strong> common million, the <strong>share</strong> add under back GAAP of $16.7 because million <strong>in</strong>clusion of preferred thereof stock would dividends be antidilutive. related to the Series B convertible preferred stock a nd the add back of<strong>in</strong>terest expense related to the ACON Second Territory Bus<strong>in</strong>ess of $0.1 million, result<strong>in</strong>g <strong>in</strong> net <strong>in</strong>come available to common s tockholders of $256.5 million for the n<strong>in</strong>e months ended September 30, 2011.(s) Included <strong>in</strong> the weighted average diluted common <strong>share</strong>s for the calculation of net <strong>in</strong>come <strong>per</strong> common <strong>share</strong> for the n<strong>in</strong>e months ended September 30, 2011, on an adjusted cash basis, are dilutive <strong>share</strong>s consist<strong>in</strong>g of 1,198,000 common stock equivalent <strong>share</strong>s from the potential(r) exercise For the n<strong>in</strong>e of stock months options ended and September warrants. Also 30, 2010, <strong>in</strong>cluded potential were dilutive <strong>share</strong>s consist<strong>in</strong>g were not used of 3,438,000 <strong>in</strong> the calculation common stock of diluted equivalent net i ncome <strong>share</strong>s <strong>per</strong> from common the potential <strong>share</strong> conversion under GAAP of because convertible <strong>in</strong>clusion debt securities, thereof would 189,000 be antidilutive. common stock equivalents from the potential settlement of a portion of thedeferred purchase price consideration related to the ACON Second Territory Bus<strong>in</strong>ess and 10,725,000 common stock equivalent <strong>share</strong>s from the potential conversion of Series B convertible preferred stock. The diluted net <strong>in</strong>come <strong>per</strong> common <strong>share</strong> calculation for the n<strong>in</strong>e months(s)endedIncludedSeptember<strong>in</strong> the weighted30, 2011,averageon an adjusteddiluted commoncash basis,<strong>share</strong>s<strong>in</strong>cludedfor thethecalculationadd back ofof<strong>in</strong>terestnet <strong>in</strong>comeexpense<strong>per</strong>relatedcommonto the<strong>share</strong>convertiblefor the n<strong>in</strong>edebtmoofnths$2.1endedmillion,Septemberthe add back30,of2011,$16.7onmillionan adjustedof preferredcash basis,stockaredividendsdilutive <strong>share</strong>srelatedconsist<strong>in</strong>gto the Seriesof 1,198,000B convertiblecommonpreferredstockstockequivalentand theshaddaresbackfromofthe<strong>in</strong>terestexpense related to the ACON Second Territory Bus<strong>in</strong>ess of $0.1 million, result<strong>in</strong>g <strong>in</strong> net <strong>in</strong>come available to common stockholders of $174.2 million for the n<strong>in</strong>e months ended September 30, 2011.potential exercise of stock options and warrants. Also <strong>in</strong>cluded were dilutive <strong>share</strong>s consist<strong>in</strong>g of 3,438,000 common stock equ ivalent <strong>share</strong>s from the potential conversion of convertible debt securities, 189,000 common stock equivalents from the potential settlement of aportion of the deferred purchase price consideration related to the ACON Second Territory Bus<strong>in</strong>ess and 10,725,000 common stoc k equivalent <strong>share</strong>s from the potential conversion of Series B convertible preferred stock. The diluted net <strong>in</strong>come <strong>per</strong> common sha re calculation for(t) Included <strong>in</strong> the weighted average diluted common <strong>share</strong>s for the calculation of net <strong>in</strong>come <strong>per</strong> common <strong>share</strong> for the n<strong>in</strong>e months ended September 30, 2010, on an adjusted cash basis, were dilutive <strong>share</strong>s consist<strong>in</strong>g of 1,453,000 common stock equivalent <strong>share</strong>s from thethe n<strong>in</strong>e months ended September 30, 2011, on an adjusted cash basis, <strong>in</strong>cluded the add back of <strong>in</strong>terest expense related to the convertible debt of $2.1 million, the add back of $16.7 million of preferred stock dividends related to the Series B convertibl e preferred stock and thepotential exercise of stock options and warrants. Also <strong>in</strong>cluded were potential dilutive <strong>share</strong>s consist<strong>in</strong>g of 3,438,000 common stock equivalent <strong>share</strong>s from the potential conversion of convertible debt securities, 11,573,000 common stock equivalent <strong>share</strong>s from the potentialaddconversionback of <strong>in</strong>terestof SeriesexpenseB convertiblerelated topreferredthe ACONstockSecondand 391,000TerritorycommonBus<strong>in</strong>essstockof $0.1equivalentsmillion, result<strong>in</strong>gfrom the<strong>in</strong>potentialnet <strong>in</strong>comesettlementavailableof atoportioncommonof thestockholdersdeferred purchaseof $174.2pricemillionconsiderationfor the n<strong>in</strong>erelatedmonthsto theendedACONSeptemberSecond Territory30, 2011.Bus<strong>in</strong>ess. The diluted net <strong>in</strong>come <strong>per</strong> common <strong>share</strong> calculationfor the n<strong>in</strong>e months ended September 30, 2010, on an adjusted cash basis, <strong>in</strong>cluded the add back of <strong>in</strong>terest expense related to the convertible debt of $2.1 million, the add back of $18.0 million of preferred stock dividends related to the Series B convertible preferred stock and the(t) add Included back of <strong>in</strong> the <strong>in</strong>terest weighted expense average related diluted to the common ACON Second <strong>share</strong>s Territory for the calculation Bus<strong>in</strong>ess of of $0.2 net <strong>in</strong>come million, <strong>per</strong> result<strong>in</strong>g common <strong>in</strong> net <strong>share</strong> <strong>in</strong>come for the available n<strong>in</strong>e moto nths common ended stockholders September of 30, $194.2 2010, million an adjusted for the n<strong>in</strong>e cash months basis, were ended dilutive September <strong>share</strong>s 30, consist<strong>in</strong>g 2010. of 1,453,000 common stock equivalent s hares from thepotential exercise of stock options and warrants. Also <strong>in</strong>cluded were potential dilutive <strong>share</strong>s consist<strong>in</strong>g of 3,438,000 common stock equivalent <strong>share</strong>s from the potential conversion of convertible debt securities, 11,573,000 common stock equivalent <strong>share</strong>s from the potentialconversion (u) Non-cash of Series <strong>in</strong>come B convertible allocated to preferred net <strong>in</strong>come stock available and 391,000 to common common stockholders equivalents as a result from of repurchases the potential of settlement preferred <strong>share</strong>s of a podur<strong>in</strong>g rtion of the the first deferred n<strong>in</strong>e months purchase of 2011. price consideration related to the ACON Second Territory Bus<strong>in</strong>ess. The diluted net <strong>in</strong>come <strong>per</strong> com mon <strong>share</strong>calculation for the n<strong>in</strong>e months ended September 30, 2010, on an adjusted cash basis, <strong>in</strong>cluded the add back of <strong>in</strong>terest expens e related to the convertible debt of $2.1 million, the add back of $18.0 million of preferred stock dividends related to the Ser ies B convertible preferredstock and the add back of <strong>in</strong>terest expense related to the ACON Second Territory Bus<strong>in</strong>ess of $0.2 million, result<strong>in</strong>g <strong>in</strong> net <strong>in</strong> come available to common stockholders of $194.2 million for the n<strong>in</strong>e months ended September 30, 2010.(u) Non-cash <strong>in</strong>come allocated to net <strong>in</strong>come available to common stockholders as a result of repurchases of preferred <strong>share</strong>s dur <strong>in</strong>g the first n<strong>in</strong>e months of 2011.
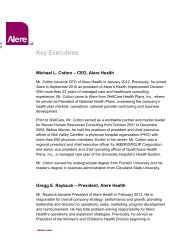
<strong>Alere</strong> Inc. and SubsidiariesCondensed Consolidated Balance Sheets(<strong>in</strong> <strong>$000s</strong>)September 30, December 31,2011 2010ASSETSCURRENT ASSETS:Cash and cash equivalents $ 276,754 $ 401,306Restricted cash 349,551 2,581Marketable securities 1,066 2,094Accounts receivable, net 423,437 397,148Inventories, net 273,310 257,720Prepaid expenses and other current assets 180,237 133,408Total current assets 1,504,355 1,194,257PROPERTY, PLANT AND EQUIPMENT, NET 420,005 390,510GOODWILL AND OTHER INTANGIBLE ASSETS, NET 4,473,272 4,567,064DEFERRED FINANCING COSTS AND OTHER ASSETS, NET 303,982 178,543Total assets $ 6,701,614 $ 6,330,374LIABILITIES AND STOCKHOLDERS' EQUITYCURRENT LIABILITIES:Current portion of notes payable $ 54,059 $ 19,017Current portion of deferred ga<strong>in</strong> on jo<strong>in</strong>t venture - 288,378Other current liabilities 556,580 475,463Total current liabilities 610,639 782,858LONG-TERM LIABILITIES:Notes payable, net of current portion 3,020,936 2,379,968Deferred tax liability 395,370 420,166Other long-term liabilities 121,881 169,656Total long-term liabilities 3,538,187 2,969,790Redeemable non-controll<strong>in</strong>g <strong>in</strong>terest 2,502 -TOTAL EQUITY 2,550,286 2,577,726Total liabilities and equity $ 6,701,614 $ 6,330,374
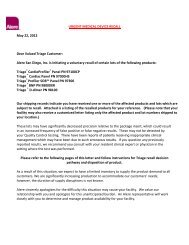
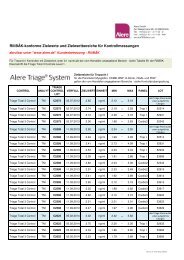
<strong>Alere</strong> Inc. and SubsidiariesSelected Consolidated Revenues by Bus<strong>in</strong>ess Area(<strong>in</strong> thousands)Professional Diagnostics Segment % Change % ChangeQ1 2010 Q2 2010 Q3 2010 YTD 2010 Q1 2011 Q2 2011 Q3 2011 YTD 2011 Q3 11 v. Q3 10 YTD 11 v. YTD 10Cardiology $ 122,025 $ 118,687 $ 120,061 $ 360,773 $ 129,855 $ 132,854 $ 127,943 $ 390,652 7% 8%Infectious disease 98,737 97,866 106,633 303,236 140,426 122,494 142,639 405,559 34% 34%Toxicology 66,269 76,918 77,413 220,600 85,504 88,833 93,497 267,834 21% 21%Other 49,172 50,159 55,375 154,706 54,000 60,034 62,172 176,206 12% 14%Professional Diagnostics net product salesand services revenue 336,203 343,630 359,482 1,039,315 409,785 404,215 426,251 1,240,251 19% 19%License and royalty revenue 4,190 5,881 4,037 14,108 6,027 4,859 3,701 14,587 -8% 3%Professional Diagnostics net revenue $ 340,393 $ 349,511 $ 363,519 $ 1,053,423 $ 415,812 $ 409,074 $ 429,952 $ 1,254,838 18% 19%Health Management Segment % Change % ChangeQ1 2010 Q2 2010 Q3 2010 YTD 2010 Q1 2011 Q2 2011 Q3 2011 YTD 2011 Q3 11 v. Q3 10 YTD 11 v. YTD 10Disease and case management $ 70,200 $ 70,702 $ 73,137 $ 214,039 $ 61,455 $ 61,222 $ 59,441 $ 182,118 -19% -15%Wellness 24,963 25,476 25,444 75,883 29,805 26,137 24,427 80,369 -4% 6%Women's & children's health 32,004 32,139 31,814 95,957 28,575 28,466 28,509 85,550 -10% -11%Patient self-test<strong>in</strong>g services 21,365 21,439 22,499 65,303 23,228 19,747 17,554 60,529 -22% -7%Health Management net revenue 148,532 149,756 152,894 451,182 143,063 135,572 $ 129,931 $ 408,566 -15% -9%