Lire - Les thèses en ligne de l'INP - Institut National Polytechnique ...
Lire - Les thèses en ligne de l'INP - Institut National Polytechnique ...
Lire - Les thèses en ligne de l'INP - Institut National Polytechnique ...
- No tags were found...

Create successful ePaper yourself
Turn your PDF publications into a flip-book with our unique Google optimized e-Paper software.
Numéro d’ordre : 2458THÈSEprés<strong>en</strong>tée pour obt<strong>en</strong>ir le titre <strong>de</strong>DOCTEUR DEL’INSTITUT NATIONAL POLYTECHNIQUEDE TOULOUSEEcole doctorale:Spécialité:Directeur <strong>de</strong> thèse:TYFEPDynamique <strong>de</strong>s Flui<strong>de</strong>sThierry POINSOTPar M. Alexis GIAUQUEFONCTIONS DE TRANSFERT DE FLAMMEET ENERGIES DES PERTURBATIONSDANS LES ECOULEMENTS REACTIFSSout<strong>en</strong>ue le 14 Mars 2007 <strong>de</strong>vant le jury composé <strong>de</strong>:G. SEARBY Directeur <strong>de</strong> recherche à l’IRPHE <strong>de</strong> Marseille RapporteurC. BAILLY Professeur à l’Ecole C<strong>en</strong>trale <strong>de</strong> Lyon RapporteurF. VUILLOT Ingénieur/Chercheur à l’ONERA/DSNA ExaminateurS. DUCRUIX Professeur à l’École C<strong>en</strong>trale <strong>de</strong> Paris ExaminateurF. NICOUD Professeur à l’Université <strong>de</strong> Montpellier II ExaminateurT. POINSOT Directeur <strong>de</strong> Recherche à l’IMF <strong>de</strong> Toulouse Directeur <strong>de</strong> ThèseRéf. CERFACS : TH/CFD/07/15
Figure 1 - Photography of a ”real” wood fireFigure 2 - Picture of a ”simulated” methane flame (<strong>de</strong>tail of figure 4.11)
RésuméCes travaux <strong>de</strong> thèse prés<strong>en</strong>t<strong>en</strong>t une étu<strong>de</strong> numérique (utilisant la Simulation aux Gran<strong>de</strong>s Echelles)<strong>de</strong>s instabilités <strong>de</strong> combustion. L’objectif général est d’<strong>en</strong> approfondir la compréh<strong>en</strong>sion <strong>en</strong> développant<strong>de</strong> nouveaux concepts physiques ainsi que <strong>de</strong> nouvelles métho<strong>de</strong>s d’analyses. Deux aspects principaux<strong>de</strong>s instabilités <strong>de</strong> combustion sont traités :• <strong>Les</strong> Fonctions <strong>de</strong> Transfert <strong>de</strong> Flamme (FTF)Quatre métho<strong>de</strong>s différ<strong>en</strong>tes pour la détermination <strong>de</strong>s Fonctions <strong>de</strong> Transfert <strong>de</strong> Flamme (FTF)sont évaluées à l’ai<strong>de</strong> <strong>de</strong> la Simulation aux Gran<strong>de</strong>s Echelles (SGE). La métho<strong>de</strong> HF-FFT, reposantsur un forçage harmonique <strong>de</strong> la chambre <strong>de</strong> combustion et sur l’analyse <strong>de</strong> Fourier prévoit<strong>de</strong>s délais <strong>de</strong> combustion globaux <strong>en</strong> accord avec l’expéri<strong>en</strong>ce. Cette métho<strong>de</strong> fournit aussi la FTFlocale (c’est à dire la réponse <strong>de</strong> chaque point <strong>de</strong> la chambre à une excitation <strong>en</strong> <strong>en</strong>trée) et permet<strong>de</strong> localiser les zones ayant la plus forte réponse à l’excitation. Elle permet aussi <strong>de</strong> connaître larépartition spatiale <strong>de</strong>s délais <strong>de</strong> cette réponse. Cette métho<strong>de</strong> <strong>de</strong>vrait donc se révéler utile pourl’analyse <strong>de</strong> configurations dans lesquelles la réponse <strong>de</strong> la flamme n’est pas compacte par rapportà la longueur d’on<strong>de</strong> <strong>de</strong> l’excitation.Une nouvelle métho<strong>de</strong> WN-WH, reposant sur le forçage par un bruit blanc filtré <strong>de</strong> la chambre<strong>de</strong> combustion et une analyse utilisant la relation <strong>de</strong> Wi<strong>en</strong>er-Hopf est comparée avec succès à lamétho<strong>de</strong> HF-FFT. Bi<strong>en</strong> que WN-WH semble plus difficile à mettre <strong>en</strong> oeuvre que HF-FFT, sonavantage principal rési<strong>de</strong> <strong>en</strong> ce qu’elle donne accès au spectre <strong>de</strong> fréqu<strong>en</strong>ce <strong>de</strong> la FTF locale sansaugm<strong>en</strong>ter le coût <strong>de</strong> calcul.Cette étu<strong>de</strong> est <strong>en</strong> li<strong>en</strong> étroit avec l’analyse <strong>de</strong> stabilité <strong>de</strong>s chambres <strong>de</strong> combustion. En effet,la FTF a une influ<strong>en</strong>ce sur la fréqu<strong>en</strong>ce et les taux d’amplification <strong>de</strong>s mo<strong>de</strong>s dans les outilsnumériques utilisées pour déterminer la stabilité <strong>de</strong>s brûleurs. Cette étu<strong>de</strong> montre comm<strong>en</strong>t construirecette FTF qui est un élém<strong>en</strong>t ess<strong>en</strong>tiel <strong>de</strong> ce type d’analyse.• <strong>Les</strong> énergies <strong>de</strong>s fluctuations et les critères <strong>de</strong> stabilité dans les écoulem<strong>en</strong>ts réactifsPoursuivant les travaux <strong>de</strong> Chu [23] et <strong>de</strong> Myers [88], cette thèse développe une nouvelle équation<strong>de</strong> conservation pour une énergie nonlinéaire <strong>de</strong>s fluctuations <strong>en</strong> combustion. Un nouvel outil<strong>de</strong> post-traitem<strong>en</strong>t modulaire est utilisé pour vérifier la fermeture <strong>de</strong>s équations <strong>de</strong>s énergies <strong>de</strong>sfluctuations sur <strong>de</strong>s flammes laminaires mono et bidim<strong>en</strong>sionnelles .Cet outil donne par ailleurs accès à tous les termes physiques et numériques responsables <strong>de</strong>l’évolution <strong>de</strong> ces énergies dans l’écoulem<strong>en</strong>t. Pour chaque équation, les principaux termes”source” sont id<strong>en</strong>tifiés et cette analyse fournit <strong>de</strong>ux critères <strong>de</strong> stabilité pour les écoulem<strong>en</strong>tsréactifs. Ces critères sont validés sur le cas d’une instabilité se développant dans une chambre <strong>de</strong>combustion bi-dim<strong>en</strong>sionelle.Le premier critère ét<strong>en</strong>d le critère <strong>de</strong> Rayleigh linéaire <strong>en</strong> y introduisant l’influ<strong>en</strong>ce <strong>de</strong> la fluctuationdu flux <strong>de</strong> chaleur. Ce travail fournit donc un outil d’étu<strong>de</strong> linéaire <strong>de</strong> la stabilité <strong>de</strong>schambres <strong>de</strong> combustion.Il montre égalem<strong>en</strong>t que l’équation <strong>de</strong> conservation <strong>de</strong> l’énergie <strong>en</strong>tropique <strong>de</strong>s fluctuations nepeut pas être linéarisée dans les cas réactifs <strong>en</strong> raison <strong>de</strong> l’amplitu<strong>de</strong> <strong>de</strong>s fluctuations locales <strong>de</strong>température. Le <strong>de</strong>uxième critère est donc non linéaire afin d’inclure l’influ<strong>en</strong>ce <strong>de</strong> l’énergie<strong>en</strong>tropique sur la stabilité <strong>de</strong> la flamme. Ce critère permet d’obt<strong>en</strong>ir <strong>de</strong>s informations sur la
stabilité <strong>de</strong> la chambre <strong>de</strong> combustion lorsqu’aucune linéarisation <strong>de</strong> l’écoulem<strong>en</strong>t n’est possible.Mots clefs : Simulation aux Gran<strong>de</strong>s Echelles (SGE), Instabilités thermo-acoustiques, Fonctions<strong>de</strong> Transfert <strong>de</strong> Flamme (FTF), Energies <strong>de</strong>s fluctuations dans les écoulem<strong>en</strong>ts réactifs, Critères <strong>de</strong>stabilité <strong>en</strong> combustionAbstractThe g<strong>en</strong>eral objective of this thesis is to ext<strong>en</strong>d the un<strong>de</strong>rstanding of combustion instabilities by testingmo<strong>de</strong>ls, physical concepts and numerical procedures, and by providing new numerical post-processingtools to do so. Two main aspects of combustion instabilities are studied and lead to many outputs.• Flame Transfer Function (FTF)Four differ<strong>en</strong>t methods for the <strong>de</strong>termination of Flame Transfer Functions (FTFs) in LES havebe<strong>en</strong> tested. HF-FFT method, based on harmonic flame forcing and FFT post-processing givesresults of global combustion <strong>de</strong>lays that compare well with the experim<strong>en</strong>ts. This method alsoprovi<strong>de</strong>s the local FTF which gives valuable information about the amplitu<strong>de</strong>s, <strong>de</strong>lays and maximumlocations of the local flame response. This method should reveal useful for configurationswhere the response of the flame is not compact compared to the characteristic wavel<strong>en</strong>gth of theexcitation, as for distributed reacting cases.A new WN-WH method based on filtered-white noise forcing and post-processing using theWi<strong>en</strong>er-Hopf relation is successfully compared to HF-FFT. Though this method should be handledwith care, its main advantage is that it gives access to the frequ<strong>en</strong>cy spectrum of the local FTFwith no additional computational cost.An important aspect of this study is its link with stability analysis of combustors. Obviously, FTFsdo have an influ<strong>en</strong>ce on the frequ<strong>en</strong>cy and amplification rates of mo<strong>de</strong>s in the numerical methodsused for combustor stability. This study shows how to construct FTFs which are an important”brick” of acoustic analysis.• Disturbance Energies and Stability Criteria in reacting Flows.Following the works of Chu [23] and Myers [88] for non-reacting flows, a new nonlinear conservationequation for a disturbance <strong>en</strong>ergy in gaseous reacting flows is <strong>de</strong>rived.A new modular post-processing tool is used here to check the balance closure of disturbance <strong>en</strong>ergieson laminar 1D and 2D flames. This tool gives access to all the physical and numerical termsresponsible for the evolution of disturbance <strong>en</strong>ergies in the flow.For each equation, major terms are id<strong>en</strong>tified and this work proposes two stability criteria for reactingflows. These criteria are validated on the case of an instability <strong>de</strong>veloping in a 2D reacting4
configuration.The first criterion ext<strong>en</strong>ds the linear Rayleigh criterion by taking into account the influ<strong>en</strong>ce of thefluctuation of the heat flux. This work therefore gives a relevant linear tool for the study of combustionchambers stability.Besi<strong>de</strong>s, it also shows that the <strong>en</strong>tropy disturbance <strong>en</strong>ergy cannot be linearized in reacting flowsbecause of the local amplitu<strong>de</strong> of temperature fluctuations. The second criterion is therefore nonlinearto inclu<strong>de</strong> the influ<strong>en</strong>ce of the <strong>en</strong>tropy disturbance <strong>en</strong>ergy on the global stability. Thiscriterion gives relevant information on the stability wh<strong>en</strong> no linearization of the flow is possible.Keywords : Large-Eddy Simulation (LES), Thermo-acoustic instabilities, Flame Transfer Function(FTF), Disturbance Energies in reacting flows, Stability Criteria in combustion5
Cont<strong>en</strong>tsRemerciem<strong>en</strong>ts 11List of symbols 13Introduction 17Objectives & Organisation 28I Description of the numerical tool 331 Description of the numerical tool AVBP 351.1 Governing Equations and hypothesis for DNS . . . . . . . . . . . . . . . . . . . . . . . 351.2 Governing equations for LES . . . . . . . . . . . . . . . . . . . . . . . . . . . . . . . 431.3 The Thick<strong>en</strong>ed Flame (TF) mo<strong>de</strong>l for LES . . . . . . . . . . . . . . . . . . . . . . . . 501.4 G<strong>en</strong>eral aspects of the Boundary Conditions in AVBP . . . . . . . . . . . . . . . . . . . 551.5 Artificial Viscosity in AVBP . . . . . . . . . . . . . . . . . . . . . . . . . . . . . . . . 561.6 Cell-Vertex Discretization . . . . . . . . . . . . . . . . . . . . . . . . . . . . . . . . . 60II Flame Transfer Functions 632 Linear mo<strong>de</strong>ls for FTFs (Flame Transfer Functions) 692.1 Historical background . . . . . . . . . . . . . . . . . . . . . . . . . . . . . . . . . . . . 69
CONTENTS2.2 Mo<strong>de</strong>ls for FTF . . . . . . . . . . . . . . . . . . . . . . . . . . . . . . . . . . . . . . . 723 Measurem<strong>en</strong>t methods for FTF in LES 813.1 LES of FTF . . . . . . . . . . . . . . . . . . . . . . . . . . . . . . . . . . . . . . . . . 813.2 Postprocessing methods for local FTF . . . . . . . . . . . . . . . . . . . . . . . . . . . 823.3 Preliminary comparisons of postprocessing methods. . . . . . . . . . . . . . . . . . . . 854 Transfer functions of flames 954.1 Configuration A : laminar planar premixed flame (1D) . . . . . . . . . . . . . . . . . . 974.2 Configuration B : laminar V flame (2D axi-symmetric) . . . . . . . . . . . . . . . . . . 1014.3 Configuration C : turbul<strong>en</strong>t burner in cylindrical chamber (3D) . . . . . . . . . . . . . . 1044.4 Configuration D : turbul<strong>en</strong>t burner in a 15 ◦ sector (3D) . . . . . . . . . . . . . . . . . . 1274.5 Evaluation of FTF measurem<strong>en</strong>ts methods in LES. . . . . . . . . . . . . . . . . . . . . 138III Disturbance <strong>en</strong>ergies and stability criteria in reacting flows 1415 Introduction 1475.1 Previous studies . . . . . . . . . . . . . . . . . . . . . . . . . . . . . . . . . . . . . . . 1475.2 An advanced post-processing tool for LES : POSTTIT . . . . . . . . . . . . . . . . . . 1615.3 Examples of conservation equation balance closure . . . . . . . . . . . . . . . . . . . . 1716 Disturbance <strong>en</strong>ergies in flow 1756.1 Pressure-Velocity (PV) disturbance <strong>en</strong>ergy Eq.(1)[Eq.(6.10)] . . . . . . . . . . . . . . . . . . 1756.2 Entropy disturbance <strong>en</strong>ergy Eq.(2)[Eq.(6.18)] . . . . . . . . . . . . . . . . . . . . . . . . . . 1816.3 Nonlinear disturbance <strong>en</strong>ergy Eq.(3)[Eq.(6.37)] . . . . . . . . . . . . . . . . . . . . . . . . . 1846.4 The choice of the baseline flow . . . . . . . . . . . . . . . . . . . . . . . . . . . . . . . 1896.5 Summary of disturbance <strong>en</strong>ergies conservation equations . . . . . . . . . . . . . . . . . 1917 Results 1958
CONTENTS7.1 Configuration A (1-D Reacting Case) . . . . . . . . . . . . . . . . . . . . . . . . . . . 1997.2 Configuration B (2-D Reacting Case) . . . . . . . . . . . . . . . . . . . . . . . . . . . 2107.3 Summary of the results . . . . . . . . . . . . . . . . . . . . . . . . . . . . . . . . . . . 2588 Stability criteria in reacting flows 2638.1 Evolution of disturbance <strong>en</strong>ergies . . . . . . . . . . . . . . . . . . . . . . . . . . . . . . 2638.2 Linear criteria for stability : Rayleigh Criteria, Chu criterion . . . . . . . . . . . . . . . 2658.3 Deriving stability criteria from Eqs.(1), (2) and (3) . . . . . . . . . . . . . . . . . . . . 2688.4 Conclusion and prospects . . . . . . . . . . . . . . . . . . . . . . . . . . . . . . . . . . 272G<strong>en</strong>eral Conclusion 275Bibliography 277App<strong>en</strong>dix 291A Linear conservation equation for Pressure-Velocity (PV) disturbance <strong>en</strong>ergy 291B Linear conservation equation for Entropy disturbance <strong>en</strong>ergy 297C Exact conservation equation for a nonlinear disturbance <strong>en</strong>ergy 301D Evaluation of numerical corrections for Eqs.(1), (2) and (3) 311E Short notations for balance closure analysis (Chapter 7). 313E.1 Equation 1 . . . . . . . . . . . . . . . . . . . . . . . . . . . . . . . . . . . . . . . . . . 313E.2 Equation 2 . . . . . . . . . . . . . . . . . . . . . . . . . . . . . . . . . . . . . . . . . . 314E.3 Equation 3 . . . . . . . . . . . . . . . . . . . . . . . . . . . . . . . . . . . . . . . . . . 314F Publication in Proceedings of the Stanford CTR 2006 Summer Program. 3159
CONTENTSG Publication submitted to Combustion and Flame. 32910
Remerciem<strong>en</strong>tsJe remercie tout particulièrem<strong>en</strong>t Anne Clausse, sans qui cette thèse ne serait pas la même, ainsi quebeaucoup d’autres choses! Merci...Je ti<strong>en</strong>s à remercier mon directeur <strong>de</strong> thèse, le Professeur Thierry Poinsot, pour m’avoir permisd’<strong>en</strong>trepr<strong>en</strong>dre cette étu<strong>de</strong> à la fois théorique et numérique concernant les instabilités <strong>de</strong> combustion. Jele remercie tout particulièrem<strong>en</strong>t pour son ai<strong>de</strong> dans l’étu<strong>de</strong> <strong>de</strong>s fonctions <strong>de</strong> transfert <strong>de</strong> flamme.Je ti<strong>en</strong>s à remercier chaleureusem<strong>en</strong>t le Professeur Franck Nicoud pour son souti<strong>en</strong> et son ai<strong>de</strong>, <strong>en</strong> particulierconcernant l’étu<strong>de</strong>s <strong>de</strong>s énergies <strong>de</strong>s perturbations <strong>en</strong> combustion. Nous avons eu <strong>de</strong> nombreusesdiscussions fructueuses qui nous ont permis <strong>de</strong> m<strong>en</strong>er à bi<strong>en</strong> une étu<strong>de</strong> intéressante <strong>de</strong> ces énergies.Je remercie Charles Martin pour son ai<strong>de</strong> concernant l’étu<strong>de</strong> <strong>de</strong> l’énergie acoustique <strong>en</strong> combustion. Il amis <strong>en</strong> place une première approche très utile <strong>de</strong> l’évolution <strong>de</strong> cette énergie. Le lecteur est r<strong>en</strong>voyé à sathèse dans laquelle figur<strong>en</strong>t certaines analyses <strong>en</strong> li<strong>en</strong> avec les mi<strong>en</strong>nes.Je remercie égalem<strong>en</strong>t Laur<strong>en</strong>t B<strong>en</strong>oit et Clau<strong>de</strong> S<strong>en</strong>siau pour leur ai<strong>de</strong> concernant la compréh<strong>en</strong>sion <strong>de</strong>ce qu’est un ”solveur fréqu<strong>en</strong>tiel <strong>de</strong>s équations <strong>de</strong> Helmholtz”, chose qui n’était pas clair pour moi audébut <strong>de</strong> cette thèse....Je ti<strong>en</strong>s à remercier Simon M<strong>en</strong><strong>de</strong>z, Eléonore Riber, Valérie Auffray et Gabriel Staffelbach pour leursouti<strong>en</strong>, leur bonne humeur, les discussions parfois sérieuses et sci<strong>en</strong>tifiques et celles qui n’avai<strong>en</strong>t ri<strong>en</strong>à voir avec le sujet <strong>de</strong> ce mémoire... Merci pour tout ceci et un peu plus!Finalem<strong>en</strong>t, je ti<strong>en</strong>s à remercier tous les doctorants, post-doctorants et personnels <strong>de</strong> recherche duCERFACS à la fois passé et prés<strong>en</strong>t pour l’ambiance chaleureuse, décontractée et professionnelle qu’ilsapport<strong>en</strong>t avec eux chaque jour au laboratoire.
REMERCIEMENTS12
Nom<strong>en</strong>clatureRoman charactersc vHeat capacity at constant volume∆H 0 jEnthalpy change of reaction jDDisturbance <strong>en</strong>ergy source term∆S 0 jEntropy change of reaction jD kSpecies diffusion coeffici<strong>en</strong>tK f ,jK r,jForward reaction rate of reaction jReverse reaction rate of reaction jE Effici<strong>en</strong>cy function (Part I)E, e Total <strong>en</strong>ergyQ jRate progress of reaction je kSpecies <strong>en</strong>ergy⃗J, ⃗q k⃗m⃗q⃗u⃗V k⃗WA(n)A +A −Species Diffusive fluxMom<strong>en</strong>tumHeat fluxVelocity vectorSpecies diffusion velocityDisturbance <strong>en</strong>ergy fluxLES co<strong>de</strong> variable updateDownstream propagating acoustic waveUpstream propagating acoustic waveAl(n) LES co<strong>de</strong> variable update linked with walllaw correctionse 1E <strong>de</strong> ske sFDisturbance <strong>en</strong>ergy in quadratic pressureand velocity fluctuationsG<strong>en</strong>eral disturbance <strong>en</strong>ergy in flowSpecies s<strong>en</strong>sible <strong>en</strong>ergyDisturbance <strong>en</strong>ergy in quadratic <strong>en</strong>tropyfluctuationsFlame Transfer FunctionF Thick<strong>en</strong>ing factor (Part I)F pF uFlame Transfer Function relative to pressurefluctuationsFlame Transfer Function relative to velocityfluctuationsB(n)cLES co<strong>de</strong> variable update linked withboundary conditionsSound velocityF norm2 Flame Transfer Function (Normalization2)F norm Flame Transfer Function (Normalization 1)c pkSpecies heat capacity at constant pressureF resFlame Transfer Function for 1D analysisc pHeat capacity at constant pressuregFree <strong>en</strong>thalpyc vkSpecies heat capacity at constant volumeg sFree s<strong>en</strong>sible <strong>en</strong>thalpy
LIST OF SYMBOLSg skSpecies free s<strong>en</strong>sible <strong>en</strong>thalpyΩ TVolumic integrated heat releaseH, h Enthalpyω kSpecies source termh kSpecies <strong>en</strong>thalpyΦDissipation functionh skSpecies s<strong>en</strong>sible <strong>en</strong>thalpyφEquival<strong>en</strong>ce ratioh m skMolar s<strong>en</strong>sible species mass <strong>en</strong>thalpyρMass d<strong>en</strong>sitynAmplitu<strong>de</strong> of the Flame Transfer Functionρ kSpecies mass d<strong>en</strong>sityp PressureQ rrss ks m kTWW kX kY kRadiative source termGas constant of the mixtureEntropySpecies <strong>en</strong>tropyMolar species <strong>en</strong>tropyTemperatureMean molecular weightSpecies molecular weightSpecies molar fractionSpecies mass fractionGreek characters∆ Filter characteristic sizeδ Kronecker operatorδL0∆ xThickness of the premixed flameStandard mesh size˙ω T /ω T Heat releaseγ Specific heat ratioλ Heat conduction coeffici<strong>en</strong>tστViscous t<strong>en</strong>sorTime <strong>de</strong>lay of the Flame Transfer Function(Part II)τ, ¯τ Stress t<strong>en</strong>sorΞWrinkling factorDim<strong>en</strong>sionless numbersRL eMP rP t rR eRe tSS c,kS t c,kOperators¯f tDfDtUniversal gas constantLewis numberMach numberPrandtl numberTurbul<strong>en</strong>t Prandtl numberReynolds numberTurbul<strong>en</strong>t Reynold numberSwirl numberSchmidt numberTurbul<strong>en</strong>t Schmidt numberTurbul<strong>en</strong>t compon<strong>en</strong>t of the Reynolds filteredvariable fTotal <strong>de</strong>rivative of scalar fµ Molecular viscosityˆfFourier transform of variable fµ t Turbul<strong>en</strong>t molecular viscosityf Reynolds filtering operator (Part I)14
List of symbolsfTime average of variable fNSCBC Navier-Stokes Characteristic B.C.∂Partial differ<strong>en</strong>tiation operatorPDFProbability D<strong>en</strong>sity Function⃗∇. ⃗ fDiverg<strong>en</strong>ce of vector ⃗ fRANS Reynolds Averaged Navier-Stokes⃗∇fGradi<strong>en</strong>t of scalar fSGSSub-Grid Scale˜fFavre filtering operatorTFThick<strong>en</strong>ed FlameSubscriptsTFLES Thick<strong>en</strong>ed Flame mo<strong>de</strong>l for LESτ ijf 0f 1u iu jij compon<strong>en</strong>t of the stress t<strong>en</strong>sorZeroth or<strong>de</strong>r of the linear <strong>de</strong>composition ofvariable fFirst or<strong>de</strong>r of the linear <strong>de</strong>composition ofvariable fCompon<strong>en</strong>t i of vector ⃗uCompon<strong>en</strong>t j of vector ⃗uTTGC Two-step Taylor-Galerkin ColinWALE Wall Adapting Linear Eddy (mo<strong>de</strong>l)WN-FFT White Noise (forced) - Fast FourierTransform (post-processed)WN-WH White Noise (forced) - Wi<strong>en</strong>er-Hopf(post-processed)Superscripts¯fT<strong>en</strong>sor notation of ff ′ Subgrid scale compon<strong>en</strong>t (Part I)f ′Time fluctuation of variable fShort namesAVIBCCFDDNSDTFArtificial VIscosityBoundary ConditionComputational Fluid DynamicsDirect Numerical SimulationDynamically Thick<strong>en</strong>ed FlameHF-FFT Harmonically Forced - Fast FourierTransform (post-processed)LESLWMPILarge Eddy SimulationLax-W<strong>en</strong>droffMessage Passing Interface15
LIST OF SYMBOLS16
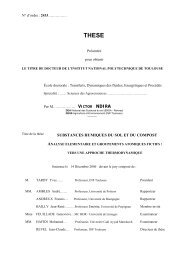
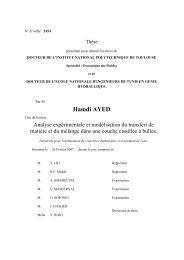
IntroductionBi<strong>en</strong> qu’il apparaisse désormais évid<strong>en</strong>t que les réserves <strong>de</strong> combustibles fossiles s’épuis<strong>en</strong>t, leurutilisation pour la production d’électricité et pour le transport reste largem<strong>en</strong>t majoritaire par rapportaux formes ”r<strong>en</strong>ouvelables” d’énergie. En effet, l’imm<strong>en</strong>se majorité <strong>de</strong>s systèmes <strong>de</strong> production <strong>de</strong>spays développés ou <strong>en</strong> développem<strong>en</strong>t repos<strong>en</strong>t actuellem<strong>en</strong>t sur la combustion et la transformation <strong>de</strong>sdérivés organiques fossiles. Consci<strong>en</strong>ts <strong>de</strong>s dangers <strong>de</strong> la dép<strong>en</strong>dance énergétique qui <strong>en</strong> résulte, d<strong>en</strong>ombreux chantiers <strong>de</strong> recherche se sont ouverts pour t<strong>en</strong>ter <strong>de</strong> s’<strong>en</strong> affranchir.Concernant la production d’électricité <strong>de</strong> masse, le nucléaire, malgré les risques qui l’accompagn<strong>en</strong>t 1apparaît comme le seul candidat capable <strong>de</strong> sout<strong>en</strong>ir le niveau <strong>de</strong> consommation actuel. <strong>Les</strong> réc<strong>en</strong>tesdéclarations <strong>de</strong> l’exécutif américain 2 ainsi que celles <strong>de</strong> la Commission Europé<strong>en</strong>ne montr<strong>en</strong>t le regaind’intérêt pour ce mo<strong>de</strong> <strong>de</strong> production d’énergie. Le lancem<strong>en</strong>t réc<strong>en</strong>t du projet ITER (reposant surla domestication <strong>de</strong> la fusion thermonucléaire) fournit un espoir supplém<strong>en</strong>taire <strong>de</strong> pouvoir disposerun jour (le projet doit fournir <strong>de</strong>s résultats industriels à l’horizon 2040-2050) d’une source d’énergiequasi-inépuisable et dont les matières premières serai<strong>en</strong>t mieux distribuées.Cep<strong>en</strong>dant, du fait <strong>de</strong> l’organisation économique actuelle, et malgré l’augm<strong>en</strong>tation inévitable <strong>de</strong>son coût, l’utilisation d’énergies fossiles reste prépondérante dans bi<strong>en</strong> <strong>de</strong>s domaines. Parmi leursnombreuses utilisations, ces énergies serv<strong>en</strong>t <strong>de</strong>ux intérêts majeurs :• Leur combustion <strong>en</strong>tre <strong>en</strong> jeu dans la production d’électricité par les c<strong>en</strong>trales thermiques.• Elle fournit égalem<strong>en</strong>t un travail mécanique utile servant aux transports, qu’ils soi<strong>en</strong>t terrestres ouaéri<strong>en</strong>s.Récemm<strong>en</strong>t, la production d’électricité par turbine à gaz a connu un regain d’intérêt <strong>en</strong> li<strong>en</strong> avec ladérégulation du marché <strong>de</strong> l’énergie. En effet, grâce à l’augm<strong>en</strong>tation <strong>de</strong> son r<strong>en</strong><strong>de</strong>m<strong>en</strong>t (cf Fig.3) et àsa gran<strong>de</strong> flexibilité (temps <strong>de</strong> livraison, temps <strong>de</strong> maint<strong>en</strong>ance, etc...) ce mo<strong>de</strong> <strong>de</strong> production d’énergieest <strong>de</strong>v<strong>en</strong>u extrêmem<strong>en</strong>t concurr<strong>en</strong>tiel pour les ”petits producteurs” d’électricité.1 les principaux risques sont liés aux accid<strong>en</strong>ts nucléaires <strong>en</strong> production (Tchernobil (URSS), Three Mile Island (USA),Saint-Laur<strong>en</strong>t (France), Tokaimura (Japon)....) et aux risques <strong>de</strong> contamination après utilisation du combustible, ces matériauxnécessitant un stockage pouvant durer plusieurs dizaines <strong>de</strong> milliers d’années.2 <strong>Les</strong> Etats-Unis ont pourtant connu un accid<strong>en</strong>t nucléaire majeur <strong>en</strong> 1979 (Three Mile Island).
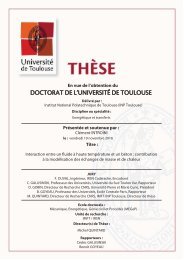
INTRODUCTIONFigure 3 - Evolution <strong>de</strong>s coûts <strong>de</strong> production <strong>en</strong> fonction <strong>de</strong> la quantité d’électricité produite à l’ai<strong>de</strong> <strong>de</strong>s turbinesà gaz. Chaque point <strong>de</strong> la courbe représ<strong>en</strong>te le meilleur compromis à une date donnée. Depuis le début <strong>de</strong>sannées 1990, il est <strong>de</strong>v<strong>en</strong>u plus r<strong>en</strong>table <strong>de</strong> produire <strong>de</strong> l’électricité à l’ai<strong>de</strong> <strong>de</strong> turbines <strong>de</strong> faible puissance.Source: ”Charles E.Bayless, <strong>Les</strong>s Is More: Why Gas Turbines Will Transform Electric utilities. Public UtilitiesFortnightly 1994”Bi<strong>en</strong> que <strong>de</strong>s énergies alternatives exist<strong>en</strong>t concernant le transport routier (systèmes hybri<strong>de</strong>s ess<strong>en</strong>ceélectricité)et que <strong>de</strong>s systèmes innovants voi<strong>en</strong>t le jour (pile à combustible, hydrogène, solaire, etc...),la combustion d’ess<strong>en</strong>ce, <strong>de</strong> diesel ou <strong>de</strong> fuel n’a pas <strong>en</strong>core <strong>de</strong> concurr<strong>en</strong>t économiquem<strong>en</strong>t sérieux.Quels sont alors les points à améliorer pour nous permettre <strong>de</strong> vivre au mieux avec ce mo<strong>de</strong><strong>de</strong> production et <strong>de</strong> consommation d’énergie et d’<strong>en</strong> limiter les méfaits sur l’<strong>en</strong>vironnem<strong>en</strong>t?Une solution évid<strong>en</strong>te est la limitation <strong>de</strong> la consommation <strong>de</strong> carburant <strong>de</strong> tous les types <strong>de</strong> chambres<strong>de</strong> combustion <strong>en</strong> améliorant leur r<strong>en</strong><strong>de</strong>m<strong>en</strong>t, permettant ainsi d’utiliser au mieux les réserves prés<strong>en</strong>teset <strong>de</strong> diminuer les émissions <strong>de</strong> dioxy<strong>de</strong> <strong>de</strong> carbone (CO 2 ) (produit inévitable <strong>de</strong> la combustion <strong>de</strong>composés carbonés et gaz à effet <strong>de</strong> serre). Cep<strong>en</strong>dant, le CO 2 n’est pas le seul polluant produit parla combustion d’hydrocarbures et <strong>de</strong> nombreuses étu<strong>de</strong>s s’attach<strong>en</strong>t aussi à limiter la production d’uneautre famille <strong>de</strong> polluants : les oxy<strong>de</strong>s d’azote (NO x ).Ces dérivés <strong>de</strong> la combustion d’hydrocarbures dans un milieu riche <strong>en</strong> azote (comme c’est le cas dansl’air) sont à l’origine d’un cycle <strong>de</strong> réactions chimiques qui mèn<strong>en</strong>t à la diminution <strong>de</strong> la conc<strong>en</strong>tration<strong>en</strong> ozone(O 3 ) dans les couches élevées <strong>de</strong> l’atmosphère. Or l’ozone empêche une partie du rayonnem<strong>en</strong>tultra-violet <strong>de</strong> se frayer un chemin jusqu’à la surface <strong>de</strong> la Terre. Lorsque la conc<strong>en</strong>tration <strong>en</strong> O 3<strong>de</strong>s hautes couches <strong>de</strong> l’atmosphère diminue, une plus gran<strong>de</strong> partie ce rayonnem<strong>en</strong>t nous parvi<strong>en</strong>t et<strong>en</strong>traîne une augm<strong>en</strong>tation <strong>de</strong> l’incid<strong>en</strong>ce <strong>de</strong>s cancers <strong>de</strong> la peau. Paradoxalem<strong>en</strong>t, au cours <strong>de</strong> ce mêmecycle chimique, <strong>de</strong> l’ozone peut être créé au niveau du sol m<strong>en</strong>ant ainsi à la formation <strong>de</strong> brouillardsd’ozone. Or l’ozone est toxique par inhalation, et ces brouillards d’ozone <strong>en</strong>traîn<strong>en</strong>t cette fois <strong>de</strong>srisques respiratoires. La figure 4 résume ce cycle simplifié <strong>de</strong> l’ozone.Le monoxy<strong>de</strong> d’azote (NO) est l’un <strong>de</strong>s représ<strong>en</strong>tants <strong>de</strong> la famille <strong>de</strong>s NO x . La formation <strong>de</strong> NOdans les chambres <strong>de</strong> combustion a lieu à travers <strong>de</strong>ux principaux mécanismes:18
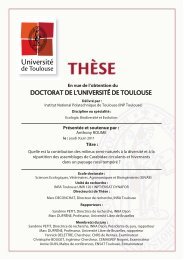
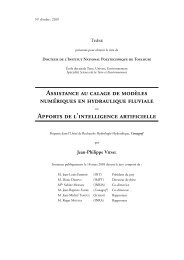
IntroductionFigure 4 - Cycle simplifié <strong>de</strong> l’ozone incluant l’influ<strong>en</strong>ce <strong>de</strong> NO originaires <strong>de</strong> la combustion. source: TheESPERE Associaton (Environm<strong>en</strong>tal Sci<strong>en</strong>ce Published for Everybody Round the Earth)• la formation ”rapi<strong>de</strong>” <strong>de</strong> NO, due principalem<strong>en</strong>t à la réaction <strong>en</strong>tre le radical OH ⋆ et la moléculeN2 dans les flammes pré-mélangées.• la formation ”thermique” du NO, dû à la réaction <strong>en</strong>tre la molécule <strong>de</strong> O 2 et celle <strong>de</strong> N 2 .Ces <strong>de</strong>ux mécanismes <strong>de</strong> formation <strong>en</strong>courag<strong>en</strong>t à diminuer la température à laquelle a lieu la combustionpour limiter les émissions <strong>de</strong> NO. Cep<strong>en</strong>dant, aux basses températures se forme alors un autre polluant:le monoxy<strong>de</strong> <strong>de</strong> carbone (CO). Comme le montre la figure 5, il existe une température optimale <strong>de</strong>combustion à laquelle on parvi<strong>en</strong>t à minimiser à la fois la conc<strong>en</strong>tration <strong>en</strong> CO et <strong>en</strong> NO dans les gazbrûlés.Ces températures optimales <strong>de</strong> fonctionnem<strong>en</strong>t étant plus faibles que les températures stœchiométriques3 <strong>de</strong> combustion, les industriels se sont ori<strong>en</strong>tés progressivem<strong>en</strong>t vers <strong>de</strong>s technologies <strong>de</strong>combustion à richesse 4 basse et pré-mélangées, ainsi qu’au développem<strong>en</strong>t <strong>de</strong> chambres <strong>de</strong> combustionétagées permettant une maîtrise locale <strong>de</strong> la richesse du mélange. Cep<strong>en</strong>dant, à <strong>de</strong>s richesses faibles(la richesse moy<strong>en</strong>ne <strong>de</strong> combustion est parfois plus faible que la limite d’extinction <strong>de</strong> la flamme), lacombustion est beaucoup plus s<strong>en</strong>sible aux phénomènes d’instabilités. Dans ce cas, <strong>de</strong>s étu<strong>de</strong>s réc<strong>en</strong>tesont montré [126] que la quantité <strong>de</strong> polluants émis pouvait augm<strong>en</strong>ter.Il convi<strong>en</strong>t alors <strong>de</strong> mieux compr<strong>en</strong>dre les instabilités <strong>de</strong> combustion afin <strong>de</strong> permettre l’utilisationindustrielle d’une combustion plus pauvre et donc plus ”propre”.3 Température atteinte lorsque la combustion à lieu à une richesse unitaire4 La richesse d’un mélange caractérise le rapport <strong>en</strong>tre la quantité <strong>de</strong> carburant et celle <strong>de</strong> comburant disponible. Elleaugm<strong>en</strong>te avec la conc<strong>en</strong>tration <strong>de</strong> carburant.19
INTRODUCTIONIndices d’émissionCONormesEuropé<strong>en</strong>nesPlage <strong>de</strong> températuresà faibles émissionsNOx1500 1600 1700 1800 1900 2000 2100 KTempérature <strong>de</strong> la zone primaireFigure 5 - Graphique montrant l’évolution <strong>de</strong>s émissions <strong>de</strong> NO et CO <strong>en</strong> fonction <strong>de</strong> la température <strong>de</strong>combustion.20
IntroductionInstabilités <strong>de</strong> combustionL’étu<strong>de</strong> <strong>de</strong> la minimisation <strong>de</strong>s conc<strong>en</strong>trations <strong>en</strong> polluants dans les gaz brûlés est un aspect majeur<strong>de</strong> la recherche actuelle <strong>en</strong> combustion. Cep<strong>en</strong>dant, celle-ci se heurte <strong>de</strong>puis <strong>de</strong> nombreusesannées au phénomène <strong>de</strong>s instabilités <strong>de</strong> combustion. Comme on l’a vu précé<strong>de</strong>mm<strong>en</strong>t, les brûleursactuels fonctionnant à <strong>de</strong>s richesses globales faibles sont plus s<strong>en</strong>sibles aux instabilités <strong>de</strong> combustion[27, 51, 76, 97, 109]. Dans ce cas, ils sont alors plus susceptibles <strong>de</strong> générer du bruit lié à lafluctuation périodique du dégagem<strong>en</strong>t <strong>de</strong> chaleur. Par ailleurs, lorsqu’une chambre <strong>de</strong> combustion estsoumise à une instabilité, le mélange est moins bon et il se crée alors <strong>de</strong>s zones plus riches que lamoy<strong>en</strong>ne et qui vont donc produire plus <strong>de</strong> NO [7, 36, 63, 126, 148]. La prévision <strong>de</strong>s instabilités<strong>de</strong> combustion et l’amélioration <strong>de</strong>s modèles d’interaction <strong>en</strong>tre la flamme et les divers phénomènesinstationnaires <strong>de</strong> l’écoulem<strong>en</strong>t sont donc actuellem<strong>en</strong>t <strong>de</strong>ux points clés <strong>de</strong> la recherche <strong>en</strong> combustion.Sous le terme d’instabilités <strong>de</strong> combustion se cach<strong>en</strong>t <strong>de</strong> nombreux phénomènes physiques qu’il convi<strong>en</strong>t<strong>de</strong> détailler ici. <strong>Les</strong> instabilités liées à la combustion peuv<strong>en</strong>t être séparées <strong>en</strong> <strong>de</strong>ux gran<strong>de</strong>s famillessuivant qu’elles ne font interv<strong>en</strong>ir que la flamme, ou bi<strong>en</strong> qu’elles nécessit<strong>en</strong>t un confinem<strong>en</strong>t <strong>de</strong> lazone <strong>de</strong> combustion pour pr<strong>en</strong>dre naissance. <strong>Les</strong> premières sont nommées instabilités intrinsèques et lessecon<strong>de</strong>s, instabilités extrinsèques <strong>de</strong> flamme.Instabilités intrinsèquesDans la première catégorie sont rec<strong>en</strong>sés tous les types d’instabilités ne faisant interv<strong>en</strong>ir que la flamme,sans considérer son év<strong>en</strong>tuel confinem<strong>en</strong>t. <strong>Les</strong> instabilités intrinsèques <strong>de</strong> combustion ont comme origine,• soit un terme source <strong>de</strong> type ”Rayleigh-Taylor”, c’est à dire reposant sur la différ<strong>en</strong>ce <strong>de</strong> d<strong>en</strong>sité<strong>en</strong>tre les gaz frais et brûlés,• soit un terme source lié à l’instabilité <strong>de</strong> ”Darrieus-Landau” ou ”Hydrodynamique” reposant surla déviation <strong>de</strong>s <strong>ligne</strong>s <strong>de</strong> courant <strong>en</strong> amont et <strong>en</strong> aval du front <strong>de</strong> flamme et m<strong>en</strong>ant à la courburedu front <strong>de</strong> flamme,• soit un terme source m<strong>en</strong>ant à l’instabilité <strong>de</strong> type ”Thermo-diffusive” reposant sur la différ<strong>en</strong>ce<strong>en</strong>tre les coeffici<strong>en</strong>ts <strong>de</strong> diffusion d’espèces et <strong>de</strong> chaleur.Clavin et Garcia [26] fourniss<strong>en</strong>t une analyse complète <strong>de</strong>s instabilités intrinsèques dans les flammesplanes prémélangées. Ces travaux fourniss<strong>en</strong>t une relation <strong>de</strong> dispersion théorique qui montre que pourla plupart <strong>de</strong>s vitesses <strong>de</strong> flamme laminaire, le taux <strong>de</strong> croissance <strong>de</strong> l’instabilité <strong>de</strong> Darrieus-Landau estpositif sur une large ban<strong>de</strong> <strong>de</strong> fréqu<strong>en</strong>ce (figure 6). Clanet et al. <strong>en</strong> 1998 [25] ont effectué la premièreétu<strong>de</strong> expérim<strong>en</strong>tale <strong>de</strong> l’instabilité <strong>de</strong> Darrieus-Landau, et ont montré la validité du modèle théorique<strong>de</strong> Clavin et Garcia pour <strong>de</strong>s vitesses <strong>de</strong> flamme inférieures à 20cm/s et pour une longueur d’on<strong>de</strong>d’instabilité fixée. La figure 7 montre un instantané du front <strong>de</strong> flamme perturbé par une instabilité<strong>de</strong> Darrieus-Landau. Le phénomène est mono-fréqu<strong>en</strong>tiel comme <strong>en</strong> témoigne la périodicité spatiale <strong>de</strong>s21
INTRODUCTIONfigures liées à l’instabilité. Il est à noter que l’instabilité <strong>de</strong> Darrieus-Landau est actuellem<strong>en</strong>t vue commel’un <strong>de</strong>s mécanismes possibles <strong>de</strong> la transition déflagration-détonation 5 [72] <strong>en</strong> combustion, ce qui montreque ce type d’instabilité peut avoir une importante influ<strong>en</strong>ce sur l’évolution du front <strong>de</strong> flamme mêmelorsque celle-ci est largem<strong>en</strong>t turbul<strong>en</strong>te.Figure 6 - Taux <strong>de</strong> croissance réduit <strong>en</strong> fonction du nombre d’on<strong>de</strong> réduit <strong>de</strong> la perturbation. Source [25]Figure 7 - Front <strong>de</strong> flamme soumis à l’instabilité <strong>de</strong> Darrieus-Landau. Source [119]5 La transition déflagration-détonation se produit lorsqu’une on<strong>de</strong> <strong>de</strong> choc traverse un front <strong>de</strong> flamme se propageant à unevitesse faible. Il se produit alors une transition après laquelle le front <strong>de</strong> flamme suit l’on<strong>de</strong> <strong>de</strong> choc à une vitesse supersonique.22
IntroductionInstabilités extrinsèquesLa <strong>de</strong>uxième catégorie concerne les instabilités pour lesquelles le confinem<strong>en</strong>t est nécessaire. La manièreglobale dont ces instabilités se développ<strong>en</strong>t est résumé sur la figure 8. La flamme est l’élém<strong>en</strong>t c<strong>en</strong>tral<strong>de</strong> la boucle d’instabilité, amplifiant et transformant les différ<strong>en</strong>ts types d’on<strong>de</strong>s prés<strong>en</strong>tes dansl’écoulem<strong>en</strong>t. <strong>Les</strong> instabilités <strong>en</strong> milieu confiné peuv<strong>en</strong>t donc être ordonnées suivant le type d’on<strong>de</strong>excitée dans l’écoulem<strong>en</strong>t.A l’origine <strong>de</strong> l’instabilité, une faible fluctuation <strong>de</strong> l’écoulem<strong>en</strong>t amont vi<strong>en</strong>t perturber le front <strong>de</strong>flamme (figure 8-zone2). La flamme amplifie cette perturbation et crée principalem<strong>en</strong>t <strong>de</strong>ux typesd’on<strong>de</strong>s se propageant dans l’écoulem<strong>en</strong>t (figure 8-zone3):• une on<strong>de</strong> acoustique se propageant à la vitesse u + c (u étant la vitesse <strong>de</strong> l’écoulem<strong>en</strong>t et c celledu son),• une on<strong>de</strong> <strong>en</strong>tropique se propageant à la vitesse u <strong>de</strong> l’écoulem<strong>en</strong>t.Ces on<strong>de</strong>s r<strong>en</strong>contr<strong>en</strong>t les murs et la sortie <strong>de</strong> la chambre <strong>de</strong> combustion (figure 8-zone4). L’on<strong>de</strong>acoustique est <strong>en</strong> partie réfléchie, donnant naissance à une on<strong>de</strong> acoustique remontant l’écoulem<strong>en</strong>t àla vitesse u − c. L’on<strong>de</strong> <strong>en</strong>tropique créée par la flamme peut aussi donner naissance à une on<strong>de</strong> acoustiqueremontant l’écoulem<strong>en</strong>t. 6 L’on<strong>de</strong> acoustique se propageant vers l’amont peut interagir directem<strong>en</strong>tavec la flamme et ainsi exciter une nouvelle on<strong>de</strong> <strong>en</strong>tropique et/ou acoustique. Elle peut aussi remonterl’écoulem<strong>en</strong>t jusqu’au niveau <strong>de</strong> l’injection. Au niveau <strong>de</strong> l’injection, l’interaction <strong>en</strong>tre l’acoustiqueet l’écoulem<strong>en</strong>t est complexe (figure 8-zone1). De nombreux travaux <strong>de</strong> recherche trait<strong>en</strong>t ce problèmespécifique [132] et <strong>de</strong> manière générale, on observe une réflexion <strong>de</strong> l’énergie acoustique remontantl’écoulem<strong>en</strong>t sous forme d’une on<strong>de</strong> acoustique, d’une on<strong>de</strong> <strong>en</strong>tropique ou d’une on<strong>de</strong> <strong>de</strong> vorticité (c’està dire une structure cohér<strong>en</strong>te se propageant à sa vitesse <strong>de</strong> groupe α). Suivant les différ<strong>en</strong>ts types <strong>de</strong>fluctuations perturbant le front <strong>de</strong> flamme (figure 8-zone2), la boucle d’instabilité peut être fermée <strong>de</strong>différ<strong>en</strong>tes manières.• Il existe un transfert d’énergie possible <strong>en</strong>tre les fluctuations d’<strong>en</strong>tropie et les fluctuations acoustiques.C’est, par exemple, le cas d’une flamme subissant une fluctuation <strong>de</strong> richesse périodique.Celle-ci donne lieu à une fluctuation <strong>de</strong> dégagem<strong>en</strong>t <strong>de</strong> chaleur créant à la fois une on<strong>de</strong> acoustiqueet une on<strong>de</strong> <strong>en</strong>tropique se propageant dans le s<strong>en</strong>s <strong>de</strong> l’écoulem<strong>en</strong>t [140].• La flamme peut aussi transformer <strong>de</strong> l’énergie <strong>de</strong> vorticité <strong>en</strong> énergie acoustique. Ce phénomène alieu lorsque par exemple une structure cohér<strong>en</strong>te plisse le front <strong>de</strong> flamme et crée une variation localedu dégagem<strong>en</strong>t <strong>de</strong> chaleur. Comme dans l’exemple précéd<strong>en</strong>t, cette fluctuation du dégagem<strong>en</strong>t<strong>de</strong> chaleur alim<strong>en</strong>te l’énergie acoustique <strong>de</strong>rrière le front <strong>de</strong> flamme [47].• Il a été observé une re-laminarisation dans les gaz brûlés pour certains écoulem<strong>en</strong>ts d’injectionfaiblem<strong>en</strong>t turbul<strong>en</strong>t. Ce comportem<strong>en</strong>t vi<strong>en</strong>t <strong>de</strong> l’expansion <strong>de</strong>s gaz brûlés qui a pour effetd’écarter les <strong>ligne</strong>s <strong>de</strong> courant et donc <strong>de</strong> diminuer le niveau <strong>de</strong> vorticité. Ceci explique pourquoi6 De manière générale, Kovasnay [64] montre que hors du domaine linéaire, il existe <strong>de</strong>s échanges <strong>en</strong>tre les énergies <strong>de</strong>sperturbations liées aux fluctuations acoustiques, turbul<strong>en</strong>tes et <strong>en</strong>tropiques23
INTRODUCTIONla flamme t<strong>en</strong>d à atténuer la vorticité qui la traverse. (flèches pointillées figure 8-zone3).Figure 8 - Schéma d’<strong>en</strong>semble <strong>de</strong> la boucle d’instabilité <strong>de</strong> combustion dans les milieux confinés.<strong>Les</strong> mécanismes <strong>de</strong> fermeture <strong>de</strong> l’instabilité font interv<strong>en</strong>ir différ<strong>en</strong>ts types d’on<strong>de</strong>s se propageant à<strong>de</strong>s vitesses différ<strong>en</strong>tes. Le temps nécessaire à l’information pour parcourir le cycle d’instabilité n’estdonc pas le même suivant le type d’instabilité. Ceci est l’une <strong>de</strong>s raisons pour lesquelles différ<strong>en</strong>tesfréqu<strong>en</strong>ces d’instabilités sont observées dans les chambre <strong>de</strong> combustion. En effet, la fréqu<strong>en</strong>ce <strong>de</strong>l’instabilité ne peut être inférieure à la fréqu<strong>en</strong>ce liée au temps <strong>de</strong> bouclage.La figure 9 prés<strong>en</strong>te une chambre <strong>de</strong> combustion simplifiée. La flamme est située à 10 cm <strong>de</strong> l’injectiondans une chambre <strong>de</strong> 50 cm <strong>de</strong> long. Le tableau 1 fournit pour cette configuration les vitesses et temps<strong>de</strong> propagation <strong>de</strong>s différ<strong>en</strong>ts types d’on<strong>de</strong>s pouvant être impliquées dans le phénomène d’instabilité.Le tableau 2 résume (grâce à ces temps <strong>de</strong> propagation) les fréqu<strong>en</strong>ces minimales possibles suivant letype d’interaction. Il est à noter que l’analyse ne compr<strong>en</strong>d que les fluctuations colinéaires à l’axe <strong>de</strong>la chambre <strong>de</strong> combustion. On observe que les instabilités purem<strong>en</strong>t acoustiques sont principalem<strong>en</strong>tresponsables <strong>de</strong>s fluctuations à plus haute-fréqu<strong>en</strong>ce. Tandis que les fréqu<strong>en</strong>ces intermédiaires (<strong>en</strong>tre 100et 1000 Hz) sont liées à un mécanisme faisant interv<strong>en</strong>ir un couplage <strong>en</strong>tre l’acoustique et l’écoulem<strong>en</strong>t,via une transmission <strong>de</strong> la perturbation sous forme <strong>de</strong> fluctuation <strong>en</strong>tropique ou sous forme d’unepropagation <strong>de</strong> vorticité (par exemple une structure cohér<strong>en</strong>te). Dans son livre ”Combustion Theory”,Forman A. Williams [154] pr<strong>en</strong>d l’exemple <strong>de</strong>s instabilités observées dans les chambres <strong>de</strong> combustioncryotechniques. Dans ces chambres, <strong>de</strong>ux familles principales d’instabilités ont été observées :• le ”screaming” est un mo<strong>de</strong> d’instabilité dont la fréqu<strong>en</strong>ce est supérieure à 1000 Hz.• le ”chugging” dont la caractéristique est d’être basse fréqu<strong>en</strong>ce (inférieure à 100 Hz), est principalem<strong>en</strong>tdû au couplage <strong>en</strong>tre la chambre <strong>de</strong> combustion et le système d’injection.24
IntroductionCette différ<strong>en</strong>tiation <strong>en</strong> <strong>de</strong>ux familles distinctes (”chugging” et ”screaming”) correspond bi<strong>en</strong> à <strong>de</strong>smécanismes sous-jac<strong>en</strong>ts d’excitation différ<strong>en</strong>ts comme on peut le voir dans le tableau 2. Ainsi,dans l’exemple choisi, une instabilité purem<strong>en</strong>t acoustique ne peut se développer pour <strong>de</strong>s fréqu<strong>en</strong>cesinférieures à 675Hz. Pour expliquer la prés<strong>en</strong>ce d’instabilités <strong>de</strong> plus basse fréqu<strong>en</strong>ce, on doit considérerune interaction <strong>en</strong>tre l’acoustique et l’écoulem<strong>en</strong>t. On observe (Tableau 2) que lorsque l’on invoque unestructure cohér<strong>en</strong>te dans la première partie <strong>de</strong> la boucle d’instabilité, la fréqu<strong>en</strong>ce minimale pouvant êtreexcitée diminue pour atteindre 191 Hz.Figure 9 - Chambre <strong>de</strong> combustion schématisée.zone type <strong>de</strong> d’on<strong>de</strong> vitesse <strong>de</strong> propagation (m.s-1) temps <strong>de</strong> propagation (ms)1 acoustique (amont) 400 0.251 acoustique remontante (amont) 300 0.331 <strong>en</strong>tropique (amont) 50 21 vorticité (amont) 25-50 (vitesse <strong>de</strong> groupe <strong>de</strong> la structure) 2-42 acoustique (aval) 1000 0.42 <strong>en</strong>tropique (aval) 100 42 acoustique remontante (aval) 800 0.5Table 1 - Temps caractéristiques nécessaires au différ<strong>en</strong>ts types d’on<strong>de</strong>s pour parcourir les zones définies sur lafigure 9Outils d’analyse numérique <strong>de</strong>s instabilités <strong>de</strong> combustionDeux principales métho<strong>de</strong>s numériques d’analyse peuv<strong>en</strong>t être appliquées pour connaître la s<strong>en</strong>sibilitéd’une chambre <strong>de</strong> combustion aux instabilités thermo-acoustiques : les co<strong>de</strong>s d’instabilité et les critères25
INTRODUCTIONtype d’interaction temps total <strong>de</strong> la boucle d’instabilité (ms) fréqu<strong>en</strong>ce minimale d’excitation (Hz)1A-2A-RA 1.48 6751A-2E-RA 5.08 1971E-2A-RA 3.23 3091E-2E-RA 6.83 1461V-2A-RA 3.23-5.08 191-3091V-2E-RA 6.83-8.83 113-146Table 2 - Fréqu<strong>en</strong>ces minimales d’exist<strong>en</strong>ce <strong>de</strong>s instabilités suivant le type d’interaction. A:acoustique,E:<strong>en</strong>tropique, V:vorticité, R:retour, 1,2:zones définies sur la figure 9d’instabilité.• Co<strong>de</strong>s d’instabilitéLa première est quantitative et cherche à prévoir l’amplitu<strong>de</strong> ainsi que les fréqu<strong>en</strong>ces <strong>de</strong>s instabilitéspouvant se développer dans la chambre <strong>de</strong> combustion. Il s’agit d’outils <strong>de</strong> résolution<strong>de</strong>s équations régissant le comportem<strong>en</strong>t <strong>de</strong> l’écoulem<strong>en</strong>t perturbé. L’acoustique jouant un rôleprépondérant, il n’est pas surpr<strong>en</strong>ant que la plupart <strong>de</strong> ces outils ressemble à <strong>de</strong>s co<strong>de</strong>s d’acoustiquedans les domaines fermés où l’outil développé a pour but <strong>de</strong> donner les fréqu<strong>en</strong>ces et les taux <strong>de</strong>croissance <strong>de</strong>s mo<strong>de</strong>s instables. Au sein <strong>de</strong> ce type d’analyse, on peut distinguer trois gran<strong>de</strong>smétho<strong>de</strong>s <strong>de</strong> résolution :– <strong>Les</strong> métho<strong>de</strong>s d’élém<strong>en</strong>ts <strong>en</strong> réseaux [8, 43, 44, 78, 108, 112, 145].Ces métho<strong>de</strong>s résolv<strong>en</strong>t les amplitu<strong>de</strong>s et fréqu<strong>en</strong>ces <strong>de</strong>s mo<strong>de</strong>s acoustiques longitudinauxdans chacun <strong>de</strong>s élém<strong>en</strong>ts. Leur avantage est <strong>de</strong> permettre une étu<strong>de</strong> paramétrique <strong>de</strong> la stabilitépr<strong>en</strong>ant <strong>en</strong> compte <strong>de</strong>s impédances complexes aux frontières du domaine. Cep<strong>en</strong>dant,cet outil requiert <strong>de</strong> connaître au préalable la forme <strong>de</strong>s mo<strong>de</strong>s interv<strong>en</strong>ant dans l’analyse etne convi<strong>en</strong>t pas lorsque la géométrie est complexe ou la fréqu<strong>en</strong>ce <strong>de</strong>s mo<strong>de</strong>s élevée.– <strong>Les</strong> métho<strong>de</strong>s directes spatio-temporelles - Simulation aux Gran<strong>de</strong>s Echelles (SGE) [3, 19,28, 37, 57, 87, 102, 101, 138]La SGE fournit l’évolution spatio-temporelle <strong>de</strong>s variables <strong>de</strong> l’écoulem<strong>en</strong>t. Elle pr<strong>en</strong>d donc<strong>en</strong> compte les interactions non linéaires pouvant se produire au sein du flui<strong>de</strong>. Cette métho<strong>de</strong><strong>de</strong>man<strong>de</strong> une importante puissance <strong>de</strong> calcul et ne donne accès qu’au mo<strong>de</strong> acoustique leplus amplifié. Par ailleurs, l’utilisation <strong>de</strong> conditions aux limites avec impédances complexespeut se révéler difficile.– <strong>Les</strong> métho<strong>de</strong>s <strong>de</strong> résolution dans l’espace <strong>de</strong>s fréqu<strong>en</strong>ces. [33, 68, 83, 90, 128, 129, 136]Ces métho<strong>de</strong>s fourniss<strong>en</strong>t les fréqu<strong>en</strong>ces ainsi que les amplitu<strong>de</strong>s complexes <strong>de</strong>s mo<strong>de</strong>sacoustiques <strong>en</strong> linéarisant les équations <strong>de</strong> Navier-Stokes réactives. Le principal avantage<strong>de</strong> ces métho<strong>de</strong>s est <strong>de</strong> pouvoir pr<strong>en</strong>dre <strong>en</strong> compte <strong>de</strong>s conditions aux limites faisant interv<strong>en</strong>ir<strong>de</strong>s impédances complexes. Mais l’analyse <strong>de</strong> stabilité est linéaire dans ce cas et larésolution du problème dans le domaine non linéaire peut s’avérer complexe. Un élém<strong>en</strong>t26
Introductioness<strong>en</strong>tiel <strong>de</strong> ces approches est le besoin <strong>de</strong> modèles décrivant la réponse <strong>de</strong> la flamme (c.à.d.le taux <strong>de</strong> réaction) à <strong>de</strong>s perturbations acoustiques <strong>de</strong> la chambre. Cet élém<strong>en</strong>t appelé FTF(Fonction <strong>de</strong> transfert <strong>de</strong> flamme) est la difficulté principale dans ce type d’approche.• Critères d’instabilitéLe second type d’analyse est qualitatif. Il s’agit <strong>de</strong> déterminer si un critère simple, basé sur l<strong>en</strong>iveau <strong>de</strong> fluctuation <strong>de</strong>s variables primitives (pression, dégagem<strong>en</strong>t <strong>de</strong> chaleur, température, etc...)peut permettre <strong>de</strong> prévoir la prés<strong>en</strong>ce d’une instabilité thermo-acoustique.Le premier critère <strong>de</strong> ce type a été développé par Rayleigh <strong>en</strong> 1878 [120] et prévoit qu’une instabilitéthermo-acoustique peut se développer si la fluctuation <strong>de</strong> pression est <strong>en</strong> phase avec celle dudégagem<strong>en</strong>t <strong>de</strong> chaleur. Depuis, <strong>de</strong> nombreux travaux se sont attaché à ét<strong>en</strong>dre ce critère qui ne permetpas toujours <strong>de</strong> détecter la prés<strong>en</strong>ce <strong>de</strong> l’instabilité. Deux directions principales ont été suivies.La première consiste à ét<strong>en</strong>dre la notion d’énergie acoustique à <strong>de</strong>s cas dans lesquels l’écoulem<strong>en</strong>tmoy<strong>en</strong> ne peut être négligé [16, 18, 85]. La secon<strong>de</strong> cherche à déterminer une équation <strong>de</strong> conservationnon linéaire pour l’énergie <strong>de</strong>s fluctuations dans les écoulem<strong>en</strong>ts [23, 88].Ces <strong>de</strong>ux aspects, quantitatif et qualitatif, <strong>de</strong> l’étu<strong>de</strong> <strong>de</strong>s instabilités <strong>de</strong> combustion sont abordésdans cette thèse. Ces travaux s’inscriv<strong>en</strong>t donc dans la continuité d’étu<strong>de</strong>s précéd<strong>en</strong>tes [8, 82, 135,139, 143, 149] m<strong>en</strong>ées au CERFACS et utilisant l’outil numérique instationnaire (Simulation auxGran<strong>de</strong>s Echelles-Simulation Numérique Directe) comme :– un moy<strong>en</strong> <strong>de</strong> caractériser la Fonction <strong>de</strong> Transfert <strong>de</strong> Flamme (réponse <strong>de</strong> la flamme à uneperturbation <strong>de</strong> l’écoulem<strong>en</strong>t). Cette information permet d’accé<strong>de</strong>r aux taux <strong>de</strong> croissance<strong>de</strong>s mo<strong>de</strong>s acoustiques <strong>en</strong> utilisant les métho<strong>de</strong>s <strong>de</strong> résolution dans l’espace <strong>de</strong>s fréqu<strong>en</strong>cesprécé<strong>de</strong>mm<strong>en</strong>t décrites.– un moy<strong>en</strong> <strong>de</strong> réaliser <strong>de</strong>s expéri<strong>en</strong>ces numériques mettant <strong>en</strong> évid<strong>en</strong>ce les principaux termessource <strong>de</strong>s instabilités thermo-acoustiques et ainsi fournir un critère simple permettant <strong>de</strong>détecter ces instabilités dans les écoulem<strong>en</strong>ts réactifs.27
OBJECTIVES & ORGANISATION28
Objectives & OrganisationObjectivesThis work pres<strong>en</strong>ts a numerical study (using both Large-Eddy Simulation (LES) and Direct NumericalSimulation (DNS)) of two main aspects of combustion instabilities. It is part of the un<strong>de</strong>rgoing studiesthat t<strong>en</strong>d to address this issue for more than fifty years. The final goal of this long-lasting research effortis the un<strong>de</strong>rstanding and the prediction of thermo-acoustic instabilities in combustion. The objectives ofthis thesis are:• the ext<strong>en</strong>sion of existing and the <strong>de</strong>velopm<strong>en</strong>t of new numerical post-processing tools for the studyof Flame Transfer Functions with the help of LES. As far as these transfer functions are concerned,only global or 1D responses are curr<strong>en</strong>tly used in acoustic co<strong>de</strong>s, assuming a compact reaction zonecompared to the acoustic wavel<strong>en</strong>gth. Yet, the flame is not always compact and distributed reactionzones should also be consi<strong>de</strong>red. There is therefore a need for a tool that could <strong>de</strong>termine the localresponse of the flame to the incoming perturbations (i.e. the correlation betwe<strong>en</strong> the inlet velocityfluctuation and the local heat release fluctuation). This tool would help to un<strong>de</strong>rstand the influ<strong>en</strong>ceof the geometry and the injection system on the global response of the flame. This would alsobe a step towards the creation of an acoustic tool able to <strong>de</strong>termine the linear stability of reactingsystems.• the <strong>de</strong>rivation of new stability criteria in gaseous reacting flows. Rec<strong>en</strong>tly, Nicoud and Poinsot [93]have pointed out the possibility that the classical Rayleigh criterion might not be relevant for allreacting flows since it does not take into account the disturbance <strong>en</strong>ergy created by the fluctuationof <strong>en</strong>tropy. Following Chu [23], they <strong>de</strong>rive a linear criterion based on the correlation betwe<strong>en</strong>temperature and heat release fluctuations. The first objective here is therefore to test these linearcriteria on a 2D laminar unstable flame using Direct Numerical Simulations (DNS).Exact conservation equations for disturbance <strong>en</strong>ergies should also be <strong>de</strong>rived and their balanceclosed to test the assumptions usually ma<strong>de</strong> wh<strong>en</strong> <strong>de</strong>riving stability criteria in reacting flows. Sincethe combustion ph<strong>en</strong>om<strong>en</strong>on creates high temperature fluctuations, this work also aims at <strong>de</strong>rivinga nonlinear stability criterion that could be used wh<strong>en</strong> no linearization of the flow is possible.
OBJECTIVES & ORGANISATIONOrganisationFirst, Part I provi<strong>de</strong>s a <strong>de</strong>scription of the numerical tool AVBP used during this work. Th<strong>en</strong>, followingthe previously <strong>de</strong>scribed objectives, the docum<strong>en</strong>t is split in two parts.Part II pres<strong>en</strong>ts a study of Flame Transfer Function (FTF) measurem<strong>en</strong>ts using LES.Chapter 2 introduces this issue in its historical background and pres<strong>en</strong>ts a short review of FTFlinear mo<strong>de</strong>ls in reacting flows.Chapter 3 focuses on FTF measurem<strong>en</strong>t techniques using LES. In particular, one <strong>de</strong>scribes a procedureinvolving the response of the flame to a filtered-white noise and using the inversion of the Wi<strong>en</strong>er-Hopfrelation to get the FTF.Chapter 4 pres<strong>en</strong>ts the results obtained using differ<strong>en</strong>t methods for FTF measurem<strong>en</strong>ts in four configurations.• First, the main aspects of FTF are obtained in a 1D laminar flame.• Th<strong>en</strong>, a comparison of three methods of FTF is giv<strong>en</strong> in a laminar conical flame.• In a third section, a local comparison of two largely used methods is done in a 3D-turbul<strong>en</strong>t forcedconfiguration. This section also provi<strong>de</strong>s a comparison of global time <strong>de</strong>lays giv<strong>en</strong> by these methodswith experim<strong>en</strong>tal results.• Finally, a FTF method using filtered-white noise local response is compared to the classical harmonicmethod in a 3D-turbul<strong>en</strong>t forced configuration.Part III pres<strong>en</strong>ts a theoretical and numerical study of disturbance <strong>en</strong>ergies in combustion.Chapter 5 pres<strong>en</strong>ts a short sample of the un<strong>de</strong>rgoing research effort towards the prediction of thermoacousticinstabilities in reacting flows. This chapter also introduces the numerical post-processing tool<strong>de</strong>veloped here to investigate budgets of disturbance <strong>en</strong>ergies in flows.Chapter 6 focuses on the <strong>de</strong>rivation of three disturbance <strong>en</strong>ergies.• The first two conservation equations are linear and respectively refer to Pressure-Velocity (PV)and Entropy disturbance <strong>en</strong>ergies.• The third equation is nonlinear and aims at giving the levels of disturbance <strong>en</strong>ergy in nonlinearcases.Chapter 7 focuses on the analysis of budgets of these disturbance <strong>en</strong>ergies in two configurations.• The first configuration is a 1D flame and gives access to the main aspects of the unsteady evolutionof disturbance <strong>en</strong>ergies.30
Objectives & Organisation• The second configuration is a 2D laminar flame. This case is harmonically forced and also ma<strong>de</strong>unstable by increasing the outlet reflection coeffici<strong>en</strong>t. Results obtained in both cases are compared.The influ<strong>en</strong>ce of the choice of the refer<strong>en</strong>ce field is also investigated. A procedure forbalance analysis in turbul<strong>en</strong>t cases using LES is proposed.Chapter 8 pres<strong>en</strong>ts a validation of Rayleigh and Chu linear stability criteria in an unstable 2D laminarflame. These criteria fail to predict the instability and two new criteria are proposed which succeed.The first one ext<strong>en</strong>ds the Rayleigh linear stability criterion and the second one aims at <strong>de</strong>tecting thermoacousticinstabilities wh<strong>en</strong> no linearization of the flow is possible.31
OBJECTIVES & ORGANISATION32
Part IDescription of the numerical tool
Chapter 1Description of the numerical tool AVBPThis chapter focuses on some aspects of the numerical tool used for all simulations during this PhD.AVBP solver is a mo<strong>de</strong>rn software tool for Computational Fluid Dynamics (CFD) of high flexibility,effici<strong>en</strong>cy and modularity. It is an unstructured solver capable of handling grids of any cells type. Inthis work, both structured and unstructured grids have be<strong>en</strong> used. AVBP solves the unsteady laminarand turbul<strong>en</strong>t compressible Navier-Stokes equations in two and three space dim<strong>en</strong>sions using numericalmethod which are second or third or<strong>de</strong>r in space and time.In the following sections, att<strong>en</strong>tion will be paid on to two important aspects of the co<strong>de</strong>, the equationsand the main un<strong>de</strong>rlying hypothesis used for Direct Numerical Simulations (DNS) and the mo<strong>de</strong>ls usedfor Large Eddy Simulations (LES). Some information concerning boundary conditions and the implem<strong>en</strong>tationof artificial viscosity in AVBP may also be found.Finally, some <strong>de</strong>tails on the cell-vertex discretization are also provi<strong>de</strong>d. This section gives the main differ<strong>en</strong>cesbetwe<strong>en</strong> a ”c<strong>en</strong>tral differ<strong>en</strong>ce” and the Lax-W<strong>en</strong>droff scheme that will be used in the third Partof this work.1.1 Governing Equations and hypothesis for DNSIn this section the compressible Navier-Stokes equations are <strong>de</strong>scribed (as found in fundam<strong>en</strong>tal CFDtext books such as [2, 53] ) . This chapter focuses on unfiltered equations used in Direct NumericalSimultation. The LES ext<strong>en</strong>sions will be <strong>de</strong>scribed on page 43.1.1.1 The governing equationsThroughout this docum<strong>en</strong>t, the in<strong>de</strong>x notation is adopted for the <strong>de</strong>scription of the governing equations.Summation rule is h<strong>en</strong>ceforth implied over repeated indices (Einstein’s rule of summation). Note howeverthat in<strong>de</strong>x k is reserved to refer to the k th species and will not follow the summation rule unlesspecifically m<strong>en</strong>tioned or implied by the ∑ sign.
DESCRIPTION OF THE NUMERICAL TOOL AVBPThe set of conservation equations <strong>de</strong>scribing the evolution of a compressible flow with chemicalreactions of thermodynamically active scalars reads,∂ρ E∂t∂ρ u i∂t+ ∂ (ρ u i u j ) = −∂ [P δ ij − τ ij ], (1.1)∂x j ∂x j+ ∂ (ρ E u j ) = −∂ [u i (P δ ij − τ ij ) + q j ] + ˙ω T + Q r , (1.2)∂x j ∂x j∂ρ k∂t + ∂ (ρ k u j ) = −∂ [J j,k ] + ˙ω k . (1.3)∂x j ∂x jIn Eqs 1.1-1.3 respectively corresponding to the conservation laws for mom<strong>en</strong>tum, total <strong>en</strong>ergy andspecies, the following symbols d<strong>en</strong>ote respecticely ρ, u i , E, ρ k , d<strong>en</strong>sity, the velocity vector, the total<strong>en</strong>ergy per unit mass and ρ k = ρY k for k = 1 to N ( N is the total number of species). The source termin the total <strong>en</strong>ergy equation, Eq. 1.2s, is <strong>de</strong>composed for conv<strong>en</strong>i<strong>en</strong>ce into a chemical source term anda radiative source term such that: S = ˙ω T + Q r . Corresponding source terms in the species transportequations, Eq. 1.3, are noted, ˙ω k .It is usual to <strong>de</strong>compose the flux t<strong>en</strong>sor into an inviscid and a viscous compon<strong>en</strong>t. They are respectivelynoted for the three conservation equations:Inviscid terms:⎛⎝ρ u i u j + P δ ij(ρE + P δ ij ) u jρ k u j⎞⎠ (1.4)where the hydrostatic pressure P is giv<strong>en</strong> by the equation of state for a perfect gas (Eq. 1.12).Viscous terms:The compon<strong>en</strong>ts of the viscous flux t<strong>en</strong>sor take the form:⎛⎝−τ ij−(u i τ ij ) + q jJ j,k⎞⎠ (1.5)J j,k is the diffusive flux of species k and is pres<strong>en</strong>ted in subsection on page 38 (Eq. 1.23). The stresst<strong>en</strong>sor τ ij is explicited in subsection on page 39 (Eq. 1.24). Finally, subsection on page 39 is <strong>de</strong>voted tothe heat flux vector q j (Eq. 1.27).1.1.2 Thermodynamical variablesThe standard refer<strong>en</strong>ce state used is P 0 = 1 bar and T 0 = 0 K. The s<strong>en</strong>sible mass <strong>en</strong>thalpies (h s,k ) and<strong>en</strong>tropies (s k ) for each species are tabulated for 51 values of the temperature (T i with i = 1...51) rangingfrom 0K to 5000K with a step of 100K. Therefore these variables can be evaluated by:36
Governing Equations and hypothesis for DNSh s,k (T i ) =∫ TiT 0 =0KC p,k dT = hm s,k (T i) − h m s,k (T 0)W k, and (1.6)s k (T i ) = sm k (T i) − s m k (T 0)W k, with i = 1, 51 (1.7)The superscript m corresponds to molar values. The tabulated values for h s,k (T i ) and s k (T i ) canbe found in the JANAF tables [146]. With this assumption, the s<strong>en</strong>sible <strong>en</strong>ergy for each species can bereconstructed using the following expression :e s,k (T i ) =∫ TiT 0 =0KC v,k dT = h s,k (T i ) − r k T i i = 1, 51 (1.8)Note that the mass heat capacities at constant pressure c p,k and volume c v,k are supposed constantbetwe<strong>en</strong> T i and T i+1 = T i + 100. They are <strong>de</strong>fined as the slope of the s<strong>en</strong>sible <strong>en</strong>thalpy (C p,k =∂h s,k∂T) and s<strong>en</strong>sible <strong>en</strong>ergy (C v,k = ∂e s,k∂T). The s<strong>en</strong>sible <strong>en</strong>ergy h<strong>en</strong>ceforth varies continuously with thetemperature and is obtained by using a linear interpolation:e s,k (T ) = e s,k (T i ) + (T − T i ) e s,k(T i+1 ) − e s,k (T i )T i+1 − T i(1.9)The s<strong>en</strong>sible <strong>en</strong>ergy and <strong>en</strong>thalpy of the mixture may th<strong>en</strong> be expressed as:ρe s =ρh s =N∑N∑ρ k e s,k = ρ Y k e s,k (1.10)k=1k=1k=1N∑N∑ρ k h s,k = ρ Y k h s,k (1.11)k=11.1.3 The equation of stateThe equation of state for an i<strong>de</strong>al gas mixture writes:P = ρ r T (1.12)where r is the gas constant of the mixture <strong>de</strong>p<strong>en</strong>dant on time and space: r = R Wwhere W is the meanmolecular weight of the mixture:1NW = ∑ Y k(1.13)W kk=137
DESCRIPTION OF THE NUMERICAL TOOL AVBPThe gas constant r and the heat capacities of the gas mixture <strong>de</strong>p<strong>en</strong>d on the local gas composition as:r = R W = N ∑k=1C p =C v =Y kW kR =N∑Y k r k (1.14)k=1N∑Y k C p,k (1.15)k=1N∑Y k C v,k (1.16)k=1where R = 8.3143 J/mol.K is the universal gas constant. The adiabatic expon<strong>en</strong>t for the mixture is giv<strong>en</strong>by γ = C p /C v . Thus, the gas constant, the heat capacities and the adiabatic expon<strong>en</strong>t are no longerconstant. In<strong>de</strong>ed, they <strong>de</strong>p<strong>en</strong>d on the local gas composition as expressed by the local mass fractionsY k (x, t):r = r(x, t), C p = C p (x, t), C v = C v (x, t), and γ = γ(x, t) (1.17)The temperature is <strong>de</strong>duced from the the s<strong>en</strong>sible <strong>en</strong>ergy, using Eqs. 1.9 and 1.10. Finally boundaryconditions make use of the speed of sound of the mixture c which is giv<strong>en</strong> by:c 2 = γ r T (1.18)1.1.4 Conservation of Mass: Species diffusion fluxIn multi-species flows the total mass conservation implies that:N∑k=1Y k V ki = 0 (1.19)where Vik are the compon<strong>en</strong>ts in directions (i=1,2,3) of the diffusion velocity of species k. They areoft<strong>en</strong> expressed as a function of the species gradi<strong>en</strong>ts using the Hirschfel<strong>de</strong>r Curtis approximation:X k V ki= −D k∂X k∂x i, (1.20)where X k is the molar fraction of species k : X k = Y k W/W k . In terms of mass fraction, the approximation1.20 may be expressed as:Y k V ki= −D kW kW38∂X k∂x i, (1.21)
Governing Equations and hypothesis for DNSSumming Eq. 1.21 over all k’s shows that the approximation 1.21 does not necessarily comply withequation 1.19 that expresses mass conservation. In or<strong>de</strong>r to achieve this, a correction diffusion velocity⃗V c is ad<strong>de</strong>d to the convection velocity to <strong>en</strong>sure global mass conservation (see [107]) as:V ci =N∑k=1D kW kW∂X k∂x i, (1.22)and computing the diffusive species flux for each species k as:()W k ∂X kJ i,k = −ρ D k − Y k Vic , (1.23)W ∂x iHere, D k are the diffusion coeffici<strong>en</strong>ts for each species k in the mixture (see subsection on page 40);J i,k . Using Eq. 1.23 to <strong>de</strong>termine the diffusive species flux implicitly verifies Eq. 1.19.1.1.5 Viscous stress t<strong>en</strong>sorThe stress t<strong>en</strong>sor τ ij is giv<strong>en</strong> by the following relations:τ ij = 2µ(S ij − 1 3 δ ijS ll ), (1.24)andS ij = 1 2 (∂u j∂x i+ ∂u i∂x j), (1.25)Eq. 1.24 may also be writt<strong>en</strong>:τ xx = 2µ 3τ yy = 2µ 3τ zz = 2µ 3(2∂u∂x − ∂v∂y − ∂w∂z ),∂z ),(2∂v∂y − ∂u∂x − ∂w(2∂z∂w − ∂u∂x − ∂v∂y ),τ xy = µ( ∂u∂y + ∂v∂x )τ xz = µ( ∂u∂z + ∂w∂x )τ yz = µ( ∂v∂z + ∂w∂y ) (1.26)where µ is the shear viscosity (see subsection on page 40).1.1.6 Heat flux vectorFor multi-species flows, an additional heat flux term appears in the diffusive heat flux. This term is dueto heat transport by species diffusion. The total heat flux vector th<strong>en</strong> writes:q i = −λ ∂TN∑()W k ∂X k−ρ D k − Y k Vic h s,k = −λ ∂T N∑+ J i,k h s,k , (1.27)∂x} {{ } iW ∂x i∂x ik=1k=1} {{ }Heat conductionHeat flux through species diffusionwhere λ is the heat conduction coeffici<strong>en</strong>t of the mixture (see subsection on page 40).39
DESCRIPTION OF THE NUMERICAL TOOL AVBP1.1.7 Transport coeffici<strong>en</strong>tsIn CFD co<strong>de</strong>s for multi-species flows the molecular viscosity µ is oft<strong>en</strong> assumed to be in<strong>de</strong>p<strong>en</strong>d<strong>en</strong>t ofthe gas composition and close to that of air 1 so that the classical Sutherland law can be used. In a firststep, the same assumption for the multi-gas AVBP solver is ma<strong>de</strong>, yielding:µ = c 1T 3/2T + c 2T ref + c 2T 3/2ref(1.28)where c 1 and c 2 must be <strong>de</strong>termined so as to fit the real viscosity of the mixture. For air at T ref = 273 K,c 1 = 1.71e-5 kg/m.s and c 2 = 110.4 K (see [153]). These values are giv<strong>en</strong> by the user. A second law isavailable, called Power law:with b typically ranging betwe<strong>en</strong> 0.5 and 1.0. For example b = 0.76 for air.µ = c 1 ( TT ref) b (1.29)The heat conduction coeffici<strong>en</strong>t of the gas mixture can th<strong>en</strong> be computed by introducing the molecularPrandtl number of the mixture as:λ = µC pP r(1.30)with P r supposed as constant in time and space and is giv<strong>en</strong> by the user. The computation of the speciesdiffusion coeffici<strong>en</strong>ts D k is a specific issue. These coeffici<strong>en</strong>ts should be expressed as a function of thebinary coeffici<strong>en</strong>ts D ij obtained from kinetic theory (Hirschfel<strong>de</strong>r et al. [54]). The mixture diffusioncoeffici<strong>en</strong>t for species k, D k , is computed as (Bird et al. [11]):D k =1 − Y k∑ Nj≠k X j/D jk(1.31)The D ij are complex functions of collision integrals and thermodynamic variables. For a DNS co<strong>de</strong>using complex chemistry, using Eq. 1.31 makes s<strong>en</strong>se. However in most cases, DNS uses a simplifiedchemical scheme and mo<strong>de</strong>ling diffusivity in a precise way is not nee<strong>de</strong>d so that this approach is muchless attractive. Therefore a simplified approximation is used in AVBP for D k . The Schmidt numbersS c,k of the species are supposed to be constant so that the binary diffusion coeffici<strong>en</strong>t for each species iscomputed as:D k = µρ S c,k(1.32)Note that the Schmidt number for each species k is assumed to be constant in time and space and isgiv<strong>en</strong> by the user. P r and S c,k mo<strong>de</strong>l the laminar (thermal and molecular) diffusion. Usual values ofSchmidt and Prandtl numbers for premixed flames are those giv<strong>en</strong> by PREMIX in the burnt gas.1 This introduces errors that are less important than those related to the thermodynamic properties.40
Governing Equations and hypothesis for DNS1.1.8 KineticsThe source term on the right hand si<strong>de</strong> of Eqs. 1.2 & 1.3 respectively writes:( ˙ωT˙ω k)where ˙ω T is the rate of heat release and ˙ω k the reaction rate of species k. Source terms in the mom<strong>en</strong>tumequation, Eq. 1.1, may also appear and are in this case used to impose mom<strong>en</strong>tum compon<strong>en</strong>ts, forexample an imposed pressure gradi<strong>en</strong>ts in periodic flows. In most cases however, they are null.The combustion mo<strong>de</strong>l of AVBP is an Arrh<strong>en</strong>ius law writt<strong>en</strong> for N reactants M k and for M reactionsas:N∑N∑ν kj ′ M kj ⇋ ν kj ′′ M kj, j = 1, M (1.33)k=1The reaction rate of species k ( ˙ω k ) is the sum of rates ˙ω kj produced by all M reactions:˙ω k =k=1M∑ ∑M˙ω kj = W k ν kj Q j (1.34)where ν kj = ν ′′kj − ν′ kj and Q j is the rate progress of reaction j and is writt<strong>en</strong>:Q j = K f,jj=1N ∏k=1j=1( ρY k) ν′ kj − K r,jW kK f,j and K r,j are the forward and reverse rates of reaction j:N ∏k=1( ρY k) ν′′ kj (1.35)W kK f,j = A f,j exp(− E a,jRT ) (1.36)where A f,j and E a,j are the pre-expon<strong>en</strong>tial factor and the activation <strong>en</strong>ergy giv<strong>en</strong> in the input file. K r,jis <strong>de</strong>duced from the equilibrium assumption:where K eq is the equilibrium constant <strong>de</strong>fined by Kuo [70]:K eq =K r,j = K f,jK eq(1.37)( p0) P (Nk=1 ν kj ∆S0jexpRTR− ∆H0 jRT)(1.38)where p 0 = 1 bar. ∆Hj 0 and ∆S0 jchanges for reaction j:are respectively the <strong>en</strong>thalpy (s<strong>en</strong>sible + chemical) and the <strong>en</strong>tropyN∑∆Hj 0 = h j (T ) − h j (0) = ν kj W k (h s,k (T ) + ∆h 0 f,k ) (1.39)k=141
DESCRIPTION OF THE NUMERICAL TOOL AVBP∆S 0 j =N∑ν kj W k s k (T ) (1.40)k=1where ∆h 0 f,k is the mass <strong>en</strong>thalpy of formation of species k at temperature T 0 = 0 K and is giv<strong>en</strong> in theinput file (molar value).The heat release is calculated as:N∑˙ω T = − ˙ω k ∆h 0 f,k (1.41)k=142
1.2 Governing equations for LES1.2 Governing equations for LES1.2.1 The LES ConceptLarge Eddy Simulation (LES) [122, 116] is nowadays recognized as an intermediate approach in comparisonsto the more classical Reynolds Averaged Navier-Stokes (RANS) methodologies. Althoughconceptually very differ<strong>en</strong>t these two approaches aim at providing new systems of governing equationsto mimic the characteristics of turbul<strong>en</strong>t flows.The <strong>de</strong>rivation of the new governing equations is obtained by introducing operators to be applied tothe set of compressible Navier-Stokes equations. Unclosed terms arise from these manipulations andmo<strong>de</strong>ls need to be supplied for the problem to be solved. The major differ<strong>en</strong>ces betwe<strong>en</strong> RANS andLES come from the operator employed in the <strong>de</strong>rivation. In RANS the operation consists of a temporalor <strong>en</strong>semble average over a set of realizations of the studied flow [116, 22]. The unclosed terms arerepres<strong>en</strong>tative of the physics taking place over the <strong>en</strong>tire range of frequ<strong>en</strong>cies pres<strong>en</strong>t in the <strong>en</strong>sembleof realizations un<strong>de</strong>r consi<strong>de</strong>ration. In LES, the operator is a spatially localized time in<strong>de</strong>p<strong>en</strong>d<strong>en</strong>t filterof giv<strong>en</strong> size, △, to be applied to a single realization of the studied flow. Resulting from this ”spatialaverage” is a separation betwe<strong>en</strong> the large (greater than the filter size) and small (smaller than the filtersize) scales. The unclosed terms are in LES repres<strong>en</strong>tative of the physics associated with the smallstructures (with high frequ<strong>en</strong>cies) pres<strong>en</strong>t in the flow. Figure 1.1 illustrates the conceptual differ<strong>en</strong>cesbetwe<strong>en</strong> (a) RANS and (b) LES wh<strong>en</strong> applied to a homog<strong>en</strong>eous isotropic turbul<strong>en</strong>t field.(a)(b)Figure 1.1 - Conceptual repres<strong>en</strong>tation of (a) RANS and (b) LES applied to a homog<strong>en</strong>eous isotropic turbul<strong>en</strong>tfield.Due to the filtering approach, LES allows a dynamic repres<strong>en</strong>tation of the large scale motions whosecontributions are critical in complex geometries. The LES predictions of complex turbul<strong>en</strong>t flows areh<strong>en</strong>ceforth closer to the physics since large scale ph<strong>en</strong>om<strong>en</strong>a such as large vortex shedding and acousticwaves are embed<strong>de</strong>d in the set of governing equations [107].43
DESCRIPTION OF THE NUMERICAL TOOL AVBPFor the reasons pres<strong>en</strong>ted above, LES has a clear pot<strong>en</strong>tial in predicting turbul<strong>en</strong>t flows <strong>en</strong>counteredin industrial applications. Such possibilities are however restricted by the hypothesis introduced whileconstructing LES mo<strong>de</strong>ls.This chapter <strong>de</strong>scribes the equation solved for LES of reacting flows in AVBP. First, the filtered equationssolved by AVBP for a turbul<strong>en</strong>t non-reacting flow are <strong>de</strong>scribed (subsection on page 44). Subsectionon page 47 pres<strong>en</strong>ts the mo<strong>de</strong>ls used for turbul<strong>en</strong>t viscosity. Subsection on page 50 <strong>de</strong>scribes specificallythe mo<strong>de</strong>ls for flame/turbul<strong>en</strong>ce interactions (the TF mo<strong>de</strong>l) and shows how this mo<strong>de</strong>l is coupled to thefiltered equations.1.2.2 The Governing Equations for Non-Reacting FlowsThe filtered quantity f is resolved in the numerical simulation whereas f ′ = f −f is the subgrid scale partdue to the unresolved flow motion. For variable d<strong>en</strong>sity ρ, a mass-weighted Favre filtering is introducedsuch as:ρ ˜f = ρf (1.42)The balance equations for large eddy simulations are obtained by filtering the instantaneous balanceequations 1.1, 1.2 and 1.3:∂ρ ũ i∂t+ ∂ (ρ ũ i ũ j ) = −∂ [P δ ij − τ ij − τ t ij ], (1.43)∂x j ∂x j∂ρ Ẽ∂t+ ∂ (ρ∂x Ẽ ũ j) = −∂ [u i (P δ ij − τ ij ) + q j + q t j ] + ˙ω T + Q r , (1.44)j ∂x j∂ρ Ỹk∂t+ ∂ (ρ∂x Ỹk ũ j ) = −∂t[J j,k + J j,k ] + ˙ωk , (1.45)j ∂x jwhere a repeated in<strong>de</strong>x implies summation over this in<strong>de</strong>x (Einstein’s rule of summation). Note alsothat throughout the docum<strong>en</strong>t, the in<strong>de</strong>x k is reserved to refer to the k th species and does not follow thesummation rule (unless specifically m<strong>en</strong>tioned).For g<strong>en</strong>erality, the filtered chemical source terms are m<strong>en</strong>tioned here if a user wants to implem<strong>en</strong>t anew combustion mo<strong>de</strong>l. For the standard AVBP mo<strong>de</strong>ls for flame / turbul<strong>en</strong>ce interactions (TF and DTF),a specific implem<strong>en</strong>tation is done (see Section on page 50). The cut-off scale corresponds to the meshsize (implicit filtering). As usually done, we assume that the filter operator and the partial <strong>de</strong>rivativecommute.In Eqs. 1.43, 1.44 and 1.45, the flux t<strong>en</strong>sor can be divi<strong>de</strong>d in three parts: the inviscid part, the viscouspart and the subgrid scale turbul<strong>en</strong>t part.Inviscid terms:The three spatial compon<strong>en</strong>ts of the inviscid flux t<strong>en</strong>sor are the same as in DNS but based on thefiltered quantities:44
Governing equations for LES⎛⎝ρũ i ũ j + P δ ijρẼũ j + P u j δ ijρ k ũ j⎞⎠ (1.46)Viscous terms:The compon<strong>en</strong>ts of the viscous flux t<strong>en</strong>sor take the form:⎛⎝−τ ij−(u i τ ij ) + q jJ j,k⎞⎠ (1.47)Filtering the balance equations leads to unclosed quantities, which need to be mo<strong>de</strong>led.Subgrid scale turbul<strong>en</strong>t terms:The compon<strong>en</strong>ts of the turbul<strong>en</strong>t subgrid scale flux take the form:⎛−τt ij⎞⎝ qt jtJ j,k⎠ (1.48)The filtered viscous terms in non reactive flowsThe filtered diffusion terms are (see T. Poinsot and D. Veynante, Chapter 4 [107]) :• the laminar filtered stress t<strong>en</strong>sor ˜τ ij is giv<strong>en</strong> by the following relations:andEq. 1.49 may also be writt<strong>en</strong>:τ xx ≈ 2µ 3τ yy ≈ 2µ 3τ zz ≈ 2µ 3τ ij = 2µ(S ij − 1 3 δ ijS ll ),≈ 2µ( ˜S ij − 1 3 δ ij ˜S ll ),(1.49)˜S ij = 1 2 (∂ũ j∂x i+ ∂ũ i∂x j), (1.50)(2∂eu∂x − ∂ev∂y − ∂ ew∂z ),∂z ),(2∂ev∂y − ∂eu∂x − ∂ ew(2∂ ew∂z − ∂eu∂x − ∂ev∂y ),τ xy ≈ µ( ∂eu∂y + ∂ev∂x )τ xz ≈ µ( ∂eu∂z + ∂ ew∂x )τ yz ≈ µ( ∂ev∂z + ∂ ew∂y ) (1.51)• the filtered diffusive species flux vector is:(= −ρJ i,k≈ −ρWD k ∂X k k W∂X e k∂x i(D kW kW∂x i− Y k V ic )− ỸkṼic ) ,(1.52)45
DESCRIPTION OF THE NUMERICAL TOOL AVBPwhere higher or<strong>de</strong>r correlations betwe<strong>en</strong> the differ<strong>en</strong>t variables of the expression are assumednegligible.• the filtered heat flux is :q i= −λ ∂T∂x i+ ∑ Nk=1 J i,kh s,k≈ −λ ∂ T e∂x i+ ∑ Nk=1 J i,k ˜h(1.53)s,kThese forms assume that the spatial variations of molecular diffusion fluxes are negligible and can bemo<strong>de</strong>lled through simple gradi<strong>en</strong>t assumptions.Subgrid scale turbul<strong>en</strong>t terms for non-reacting LESAs highlighted above, filtering the transport equations yields a closure problem evid<strong>en</strong>ced by the so called”Sub-Grid Scale” (SGS) turbul<strong>en</strong>t fluxes (see Eq. on page 44). For the system to be solved numerically,closures need to be supplied. Details on the forms and mo<strong>de</strong>ls available in AVBP are giv<strong>en</strong> in thissubsection.• the Reynolds t<strong>en</strong>sor is :τ ij t = −ρ(ũ i u j − ũ i ũ j ), (1.54)τ ij t is mo<strong>de</strong>led as:τ ij t = 2 ρ ν t ( ˜S ij − 1 3 δ ij ˜S ll ), (1.55)The mo<strong>de</strong>lisation of ν t is explained in subsection on page 47.• the subgrid scale diffusive species flux vector:J i,kt= ρ ( ũ i Y k − ũ i Ỹ k ), (1.56)J i,ktis mo<strong>de</strong>led as:J i,kt= −ρ(D kt W kW∂ ˜X k∂x i)− ỸkṼic,t, (1.57)withD t k =ν tS t c,k(1.58)The turbul<strong>en</strong>t Schimdt number Sc,k t = 1 is the same for all species and is fixed in the source co<strong>de</strong>(like Pr). t Note also that having one turbul<strong>en</strong>t Schmidt number for all the species does not imply,Ṽ c,t = 0 because of the W k /W term in Eq. 1.57.46
Governing equations for LES• the subgrid scale heat flux vector:q i t = ρ(ũiE − ũ i Ẽ), (1.59)where e is the s<strong>en</strong>sible <strong>en</strong>ergy. In the source co<strong>de</strong>, the mo<strong>de</strong>lisation for ˜q t is writt<strong>en</strong> :withq i t = −λ t∂ ˜T∂x i+N∑J i,kt ˜hs,k , (1.60)k=1The turbul<strong>en</strong>t Prandtl number is fixed in AVBP. Usually, P t r = 0.9.λ t = µ tC pPrt . (1.61)The correction diffusion velocities are h<strong>en</strong>ceforth obtained in AVBP from:()N∑Ṽic + Ṽ c,t µi=+µ t W k ∂ ˜X k, (1.62)ρS c,k W ∂x iand where Eqs. 1.32 and 1.58 are used.k=1ρS t c,k1.2.3 Mo<strong>de</strong>ls for the subgrid stress t<strong>en</strong>sor τ ij t :In AVBP, three mo<strong>de</strong>ls are available:• the Smagorinsky mo<strong>de</strong>l,• the Wall Adapting Linear Eddy (WALE) mo<strong>de</strong>l,• the Filtered Smagorinsky mo<strong>de</strong>l.A <strong>de</strong>scription of the characteristics of each mo<strong>de</strong>l is giv<strong>en</strong> in the next subsection.These LES mo<strong>de</strong>ls are <strong>de</strong>rived on the theoretical ground that the LES filter is spatially and temporallyinvariant. Variations in the filter size due to non-uniform meshes or moving meshes are not directlyaccounted for in the LES mo<strong>de</strong>ls. Change of cell topology is only accounted for through the use of thelocal cell volume, that is △ = V 1/3cell .Use of artificial viscosity is in theory prohibited in LES. It should therefore be used with a lot ofcaution and in no way overshadow the LES mo<strong>de</strong>l contribution.The filtered compressible Navier-Stokes equations exhibit sub-grid scale (SGS) t<strong>en</strong>sors and vectors<strong>de</strong>scribing the interaction betwe<strong>en</strong> the non-resolved and resolved motions. The influ<strong>en</strong>ce of the SGS47
DESCRIPTION OF THE NUMERICAL TOOL AVBPon the resolved motion is tak<strong>en</strong> into account in AVBP by a SGS mo<strong>de</strong>l based on the introduction of aturbul<strong>en</strong>t viscosity, ν t . Such an approach assumes the effect of the SGS field on the resolved field to bepurely dissipative.The previous hypothesis is ess<strong>en</strong>tially valid within the casca<strong>de</strong> theory of turbul<strong>en</strong>ce. The notion ofturbul<strong>en</strong>t viscosity can therefore be introduced and yields a g<strong>en</strong>eral mo<strong>de</strong>l for the SGS which readsτ ijt= −ρ (ũ i u j − ũ i ũ j )with= 2 ρ ν t ˜Sij − 1 3 τ ll t δ ij , (1.63)˜S ij = 1 2( ∂ũi∂x j+ ∂ũ j∂x i)− 1 3∂ũ k∂x kδ ij . (1.64)In Eqn. (1.63) τ ij t is the SGS t<strong>en</strong>sor to be mo<strong>de</strong>led, ν t is the SGS turbul<strong>en</strong>t viscosity, ũ i is the Favrefiltered velocity vector (compressible flows) and ˜S ij is the resolved strain rate t<strong>en</strong>sor. The three mo<strong>de</strong>lsin AVBP only differ through the estimation of ν t whose expressions are giv<strong>en</strong> below.Smagorinsky mo<strong>de</strong>lν t = (C S △) 2 √2 ˜S ij ˜Sij , (1.65)where △ d<strong>en</strong>otes the filter characteristic l<strong>en</strong>gth (cube-root of the cell volume), C S is the mo<strong>de</strong>l constantset to 0.18 but can vary betwe<strong>en</strong> 0.1 and 0.18 <strong>de</strong>p<strong>en</strong>ding on the flow configuration. The Smagorinskymo<strong>de</strong>l [141] was <strong>de</strong>veloped in the sixties and heavily tested for multiple flow configurations. This closurehas the particularity of supplying the right amount of dissipation of kinetic <strong>en</strong>ergy in homog<strong>en</strong>eousisotropic turbul<strong>en</strong>t flows. Locality is however lost and only global quantities are maintained. It is knownas being ”too dissipative” and transitioning flows are not suited for its use [122].Note: in AVBP, the expression for ν t is not exactly as giv<strong>en</strong> in (1.65). Rather a simplified version of˜S ij (as shown in (1.64) ) is used; compressibility effects are neglected and ∂ũ k /∂x k ≈ 0.WALE mo<strong>de</strong>ls d ij = 1 2 (˜g2 ij + ˜g 2 ji) − 1 3 ˜g2 kk δ ij, (1.66)ν t = (C w △) 2 (s d ij sd ij )3/2( ˜S, (1.67)ij ˜Sij ) 5/2 +(s d ij sd ij)5/4where △ d<strong>en</strong>otes the filter characteristic l<strong>en</strong>gth (cube-root of the cell volume), C w = 0.4929 is the mo<strong>de</strong>lconstant and ˜g ij d<strong>en</strong>otes the resolved velocity gradi<strong>en</strong>t. The WALE mo<strong>de</strong>l [40] was <strong>de</strong>veloped for wallboun<strong>de</strong>d flows in an attempt to recover the scaling laws of the wall. Similarly to the Smagorinsky mo<strong>de</strong>llocality is lost and only global quantities are to be trusted.48
Governing equations for LESFiltered Smagorinsky mo<strong>de</strong>lν t = (C SF △) 2 √2 HP ( ˜S ij ) HP ( ˜S ij ), (1.68)where △ d<strong>en</strong>otes the filter chracteristic l<strong>en</strong>gth (cube-root of the cell volume), C SF = 0.37 is the mo<strong>de</strong>lconstant and HP ( ˜S ij ) d<strong>en</strong>otes the resolved strain rate t<strong>en</strong>sor obtained from a high-pass filtered velocityfield. This mo<strong>de</strong>l was <strong>de</strong>veloped in or<strong>de</strong>r to allow a better repres<strong>en</strong>tation of local ph<strong>en</strong>om<strong>en</strong>a typical ofcomplex turbul<strong>en</strong>t flows [40]. With the Filtered Smagorinsky mo<strong>de</strong>l transition is better predicted andlocality is in g<strong>en</strong>eral better preserved.49
DESCRIPTION OF THE NUMERICAL TOOL AVBP1.3 The Thick<strong>en</strong>ed Flame (TF) mo<strong>de</strong>l for LESA difficult problem is <strong>en</strong>countered for Large Eddy Simulation of premixed flames: the thickness δ 0 L of apremixed flame is g<strong>en</strong>erally smaller than the standard mesh size ∆ x used for LES. For this reason, theThick<strong>en</strong>ed Flame (TF) mo<strong>de</strong>l has be<strong>en</strong> <strong>de</strong>veloped so as to resolve the flame fronts on a LES mesh. Inturbul<strong>en</strong>t flows, the interaction betwe<strong>en</strong> turbul<strong>en</strong>ce and chemistry is altered: eddies smaller than F δ 0 L donot interact with the flame any longer. As a result, the thick<strong>en</strong>ing of the flame reduces the ability of thevortices to wrinkle the flame front. As the flame surface is reduced, the reaction rate is un<strong>de</strong>restimated.In or<strong>de</strong>r to correct this effect, an effici<strong>en</strong>cy function E has be<strong>en</strong> <strong>de</strong>veloped [28] from DNS results andimplem<strong>en</strong>ted into AVBP (see Fig. 1.2). It is <strong>de</strong>scribed in the next subsection.Figure 1.2 - Direct Numerical Simulation of flame/turbul<strong>en</strong>ce interactions by Veynante ([4], [104]). Left: nonthick<strong>en</strong>ed flame, right: thick<strong>en</strong>ed flame (F = 5).1.3.1 The combustion subgrid scale mo<strong>de</strong>l: EA complete <strong>de</strong>scription of the effici<strong>en</strong>cy function is giv<strong>en</strong> in ref [28]. The un<strong>de</strong>rlying mo<strong>de</strong>l philosophycan be summarized through 3 main steps:• The wrinkling factor of the flame surface Ξ is estimated from the flame surface d<strong>en</strong>sity Σ, assumingan equilibrium betwe<strong>en</strong> the turbul<strong>en</strong>ce and the subscale flame surface:Ξ ≃ 1 + α ∆ eSL0 〈a T 〉 s (1.69)where 〈a T 〉 s is the subgrid scale strain rate, ∆ e is the filter size and α is a mo<strong>de</strong>l constant.• 〈a T 〉 s is estimated from the filter size ∆ e and the subgrid scale turbul<strong>en</strong>t velocity u ′ ∆ e: 〈a T 〉 s =Γu ′ ∆ e/∆ e . The function Γ corresponds to the integration of the effective strain rate induced by50
The Thick<strong>en</strong>ed Flame (TF) mo<strong>de</strong>l for LESall scales affected by the artificial thick<strong>en</strong>ing, i.e. betwe<strong>en</strong> the Kolmogorov η K and the filter ∆ escales (see also [84]). Γ is writt<strong>en</strong> as:( ) [] (∆e )∆eΓδL1 , u′ 2∆ e1.23SL0 = 0.75 exp −( )u′∆e/SL0 0.3δL1 (1.70)Finally, the effici<strong>en</strong>cy function is <strong>de</strong>fined as the wrinkling ratio betwe<strong>en</strong> the non-thick<strong>en</strong>ed refer<strong>en</strong>ceflame and the thick<strong>en</strong>ed flame:(∆eE = Ξ(δ0 L ) 1 + αΓΞ(δL 1 ) = δL( 01 + αΓ ∆eδ 1 L), u′ ∆e u ′∆eSL0 SL0, u′ ∆eS 0 L) u ′∆eS 0 L(1.71)SL 0 and δ0 Lare the laminar flame speed and the laminar flame thickness, respectively, wh<strong>en</strong> F = 1and δL 1 = F δ0 L .E varies betwe<strong>en</strong> 1 (weak turbul<strong>en</strong>ce) to E max ≃ F 2/3 (large wrinkling at the subgrid scale). Inturbul<strong>en</strong>t premixed zones, the effici<strong>en</strong>cy function is <strong>de</strong>termined to <strong>en</strong>sure that the turbul<strong>en</strong>t flamespeed will be E SL 0 = S T . The effici<strong>en</strong>cy function is required wh<strong>en</strong> the vortex size r is <strong>de</strong>finedby δL 0 > r > δc L for a real flame and by δ1 L = β F δ0 L > r > δc L for a thick<strong>en</strong>ed flame. δc L isa cut-off l<strong>en</strong>gth scale: for vortices lower than δL c , the flame remains unaffected. δc Lis <strong>de</strong>fined in[28], Eq. 31.• The filter size ∆ e corresponds to the greatest scale affected by the flame thick<strong>en</strong>ing, that is tosay δL 1 . In practice, ∆ e = 10∆ x with ∆ x = 3√ voln. The subgrid scale turbul<strong>en</strong>t velocity u ′ ∆ eis estimated using the operateur OP 2 , based on the rotational of the velocity field to remove thedilatational part of the velocity which must not be counted as ”turbul<strong>en</strong>ce”. A Laplacian operatoris directly applied to the velocity :u ′ ∆ e= c 2 ∆ 3 ∂ 2 ( )∂u nx| ɛ lmn | (1.72)∂x j ∂x j ∂x mwith c 2 ≈ 2 and where ɛ lmn stands for the permutation t<strong>en</strong>sor.Estimation of the mo<strong>de</strong>l constant αThe mo<strong>de</strong>l constant α is estimated to match the asymptotic behavior of the wrinkling factor Ξ versusRMS velocity u’ for thin flames wh<strong>en</strong> ∆ e goes to the integral l<strong>en</strong>gth scale l t , the flame wrinkling Ξ goesto Ξ max <strong>de</strong>fined by:Ξ max = 1 + βu ′ /S 0 L (1.73)with u’ the velocity at l<strong>en</strong>gth scale l t . α is th<strong>en</strong> <strong>de</strong>duced from Eq. 1.73:α = β2 ln(2)3c ms [Re 1/2t − 1](1.74)where Re t = u′ l tνis the turbul<strong>en</strong>t Reynolds number and c ms = 0.28. The rea<strong>de</strong>r is referred to [28] formore <strong>de</strong>tails.51
DESCRIPTION OF THE NUMERICAL TOOL AVBPThe TFLES1 mo<strong>de</strong>l: In this method, the user has to provi<strong>de</strong> an evaluation for α. For that, Re t = u′ l tνhas to be evaluated. Typically, l t is of the or<strong>de</strong>r of the largest vortex in the computation domain. However,strong variations of Re t may be observed whether the vortex is near the injectors or in the burner, in thefresh gas or in the burnt gas. In usual combustion chamber, Re t varies betwe<strong>en</strong> 100 and 100,000, th<strong>en</strong> αvaries betwe<strong>en</strong> 0.165 and 0.0052 (assuming β is of the or<strong>de</strong>r of unity).The TFLES2 mo<strong>de</strong>l: The objective of this mo<strong>de</strong>l is to compute Re t as a function of space andtime and to give a new formulation for α. The differ<strong>en</strong>t steps to obtain the effici<strong>en</strong>cy function are thefollowing:• First, the integral l<strong>en</strong>gth scale is estimated. Near the wall, the log-law in turbul<strong>en</strong>t channel flowis used to estimate l t : l t ≈ 0.4d w , where d w is the distance to the wall. Numerically, d w is theminimum distance from walls to the consi<strong>de</strong>red no<strong>de</strong>. Far from walls, the user must provi<strong>de</strong> anestimation of the integral l<strong>en</strong>gth scale l 0 t in the whole chamber. Usually l 0 t is of the or<strong>de</strong>r of 1/10to 1/4 of the transversal size of the burner. Finally, the local integral l<strong>en</strong>gth scale is:l t ≈ min(0.4d w , l 0 t ) (1.75)• Assuming a Kolmogorov casca<strong>de</strong> with constant transfer rate ɛ, the fluctuation velocity u’ is <strong>de</strong>ducedby:ɛ = u′3l t= u′3 ∆ e∆ e(1.76)• The subgrid scale velocity u ′ ∆ eis overestimated wh<strong>en</strong> using Eq. 1.72 close to the wall, that is tosay in boundary layers. For this reason a damping function <strong>de</strong>p<strong>en</strong>ding on the distance to the wallis used and u ′ ∆ eis th<strong>en</strong> <strong>de</strong>termined as:u ′ ∆ e=(1 − exp(− d w0.2δ 1 L))c 2 ∆ 3 ∂ 2 ( )∂u nx| ɛ lmn | (1.77)∂x j ∂x j ∂x mNear the wall, l t goes to zero while the filter scale ∆ e is nearly constant. Wh<strong>en</strong> ∆ e < l t , theKolmogorov assumption is not valid any more, that is why ∆ e and u ′ ∆ eare replaced by l t and u’.Such an approximation is acceptable, because most of the combustion occurs in the c<strong>en</strong>ter of thechamber.• A correction for the turbul<strong>en</strong>t Reynolds number is done wherever the cut-off l<strong>en</strong>gth scale δL c issmaller or greater than the Kolmogorov scale η k . If δL c < η k, η k is the smallest effici<strong>en</strong>t structuresize and δL c is irrelevant. The Reynolds number is th<strong>en</strong> Re t = u′ l tν. Recalling that the flameReynolds number is <strong>de</strong>fined by: Re f = S0 L δ0 Lν≈ 1, and that the Kolmogorov scale Reynoldsnumber is writt<strong>en</strong> as: Re(η k ) = u′ (η k )η k= 1, the turbul<strong>en</strong>t Reynolds number may be(ltν≈ u′ (η k )η kS 0 L δ0 L) 4/3.writt<strong>en</strong>: Re t =η kIf δcL> η k , the smallest effici<strong>en</strong>t structure size is δL c and the Reynolds( )number estimation should be corrected with a function θ, such as: θ 2 Re t = lt 4/3.δ The finalL cmo<strong>de</strong>l for α is th<strong>en</strong> writt<strong>en</strong>:2ln(2)α = β3c ms [θ(Re t ) 1/2 (1.78)− 1]52
The Thick<strong>en</strong>ed Flame (TF) mo<strong>de</strong>l for LES(ηkδ c Lθ = min((ηkδ c L) 2/3, 1) (1.79)⎛ ⎞) 2/3 ( ) 2/3= (Re t ) 1/2 lt ln(2) ⎜exp ⎝ −1.2 ⎟( )2c ms u ′ 0.3 ⎠ (1.80)The mo<strong>de</strong>l constant β has to be fixed by the user in the input file and is of the or<strong>de</strong>r of 0.3.δ 0 LOther forms of effici<strong>en</strong>cy function have be<strong>en</strong> <strong>de</strong>rived by Charlette and M<strong>en</strong>eveau [20, 21] but are notimplem<strong>en</strong>ted in AVBP yet.S 0 L1.3.2 Implem<strong>en</strong>tation of the standard Thick<strong>en</strong>ed Flame (TF) mo<strong>de</strong>lThe filtered equations for total <strong>en</strong>ergy and for species (Eqs. 1.44 & 1.45) must be modified in reactiveflows wh<strong>en</strong> the TF or DTF mo<strong>de</strong>l is used. In this case, only the filtered equations for velocities (Eq. 1.43)are unchanged. For the species and <strong>en</strong>ergy, the filtered equations are replaced by the thick<strong>en</strong>ed equationsas follows:Viscous terms• the filtered diffusive species flux vector is giv<strong>en</strong> by:J i,k = − E F µ W k ∂ ˜X k+ ρS c,k W ∂x k Ṽi c , (1.81)iwith• the filtered heat flux is:Ṽ ci= E FN∑k=1q i = − E F µC pP rµ W k ∂ ˜X k, (1.82)ρS c,k W ∂x i∂ ˜T∂x i+N∑J i,k ˜hs,k , (1.83)k=1The source termThe filtered source term vector of Eq. 1.42 is writt<strong>en</strong>:(E ˙ωT ( e Y k , e T )FE ˙ω k ( e Y k , e T )F), (1.84)where ˙ω T (Ỹk, ˜T ) and ˙ω k (Ỹk, ˜T ) are reaction rates computed with the Arrh<strong>en</strong>ius expression and thefiltered values of Y k and T . Note that this mo<strong>de</strong>l should be used only for perfectly premixed cases since53
DESCRIPTION OF THE NUMERICAL TOOL AVBPmixing in the fresh gases, for example, is modified by thick<strong>en</strong>ing and not correctly handled with thefiltered terms of Eqs. 1.44 & 1.45. The actual transport equations for the TF mo<strong>de</strong>l are summarizedbelow.Use of the TF mo<strong>de</strong>l implies the following relation for the correction diffusion velocities:Ṽ ci+ Ṽ c,ti=N∑k=1E F µ W k ∂ ˜X k, (1.85)ρS c,k W ∂x i1.3.3 Final equations solved for the TF mo<strong>de</strong>lThe final set of LES equations solved for wh<strong>en</strong> performing LES of reacting flows with theTF mo<strong>de</strong>lfinally reads:∂ρ ũ i∂t∂ρ Ẽ∂t∂ρ Ỹk∂t+ ∂ (ρ ũ i ũ j ) = − ∂ [P δ ij − 2 (µ + µ t ) (∂x j ∂x ˜S ij − 1/3 ˜S]ll δ ij ) ,j+ ∂ (ρ∂x Ẽ ũ j) = − ∂ [ũ i P δ ij − 2 µ ũ i (j ∂x ˜S ij − 1/3 ˜S]ll δ ij )j[+ ∂ C p E F µ ∂ ˜T]∂x j P r ∂x j+ ∂∂x j(ρ Ỹk ũ j ) =+ ∂∂x j[ N∑+ E ˙ω TF ,k=1(E F µ W k ∂ ˜X)k− ρS c,k W ∂x Ỹk (Ṽ j c + Ṽ c,tj)j[∂E F µ W k ∂ ˜X k− ρ∂x j S c,k W ∂x Ỹk (Ṽ j c + Ṽ c,tj)j+ E ˙ω kF , 54]˜hs,k]
1.4 G<strong>en</strong>eral aspects of the Boundary Conditions in AVBP1.4 G<strong>en</strong>eral aspects of the Boundary Conditions in AVBPBoundary Conditions are an ess<strong>en</strong>tial part in any CFD co<strong>de</strong>, and especially in AVBP because of acousticspres<strong>en</strong>t in the governing equations [127],[104]. The time integration in AVBP is performed with a multistageRunge-Kutta (RK) method. For simplicity, we only consi<strong>de</strong>r here a single-stage RK, which isactually a simple Euler integration, ev<strong>en</strong>tually combined with a Lax-W<strong>en</strong>droff method for stability.Knowing the solution w n at time t, the solution w n+1 at time t + ∆t is computed for each no<strong>de</strong> i as:w n+1i= w n i − ∆tV i.dw n i (1.86)where wi n = w(t, ⃗x i ) and win+1 = w(t + ∆t, ⃗x i ); ⃗x i is the coordinate vector, V i is the nodal volumearound no<strong>de</strong> i and dwi n is the nodal residual at no<strong>de</strong> i, as computed by the numerical scheme.The n superscript is here to remind that AVBP is an explicit co<strong>de</strong>, h<strong>en</strong>ce this nodal residual only <strong>de</strong>p<strong>en</strong>dson quantities known at the timestep n.This formula is applied to each no<strong>de</strong> of the computational domain (Ω). If no physical BC was imposed,the computed solution at each timestep would only <strong>de</strong>p<strong>en</strong>d on the initial solution and on the numericalscheme.In or<strong>de</strong>r to impose a BC on the bor<strong>de</strong>r of the domain (∂Ω), we write:⎧⎨⎩w n+1i= w n i − ∆tV i· (dw n i ) scheme ∀x i ∈ Ω/∂Ωw n+1i= w n i − ∆tV i· (dw n i ) BC ∀x i ∈ ∂Ω(1.87)For each no<strong>de</strong> lying on the boundary, we have replaced the scheme-predicted residual by a BC-correctedresidual. This operation is known as imposing the BC in a “hard way”. A “weak” method is additionallyused in conjunction with this “hard” method for certain BC. In this case, some gradi<strong>en</strong>ts and fluxes aremodified before applying the numerical scheme. It is mainly used for “Von Neuman” like conditions, asadiabaticity or impermeability.The AVBP BC can be classified through two categories:• Non-characteristic BC, that work directly on conserved variables,• Characteristic BC, that use a wave <strong>de</strong>composition to modify residuals.55
DESCRIPTION OF THE NUMERICAL TOOL AVBP1.5 Artificial Viscosity in AVBPThe numerical discretization methods in AVBP are spatially c<strong>en</strong>tered. These types of schemes are knownto be naturally subject to small-scale oscillations in the vicinity of steep solution variations. This iswhy it is common practice to add a so-called artificial viscosity (AV) term to the discrete equations, toavoid these spurious mo<strong>de</strong>s (also known as “wiggles”) and in or<strong>de</strong>r to smooth very strong gradi<strong>en</strong>ts.We <strong>de</strong>scribe here the differ<strong>en</strong>t AV methods used in AVBP. These AV mo<strong>de</strong>ls are characterized by the“linear preserving” property which leaves unmodified a linear solution on any type of elem<strong>en</strong>t. Themo<strong>de</strong>ls are based on a combination of a “shock capturing” term (called 2 nd or<strong>de</strong>r AV) and a “backgrounddissipation” term (called 4 th or<strong>de</strong>r AV). In AVBP, adding AV is done in two steps:• first a s<strong>en</strong>sor <strong>de</strong>tects if AV is necessary, as a function of the flow characteristics,• th<strong>en</strong> a certain amount of 2 nd and 4 th AV is applied, <strong>de</strong>p<strong>en</strong>ding on the s<strong>en</strong>sor value and on user<strong>de</strong>finedparameters.1.5.1 The s<strong>en</strong>sorsA s<strong>en</strong>sor ζ Ωj is a scaled parameter which is <strong>de</strong>fined for every cell Ω j of the domain that takes values fromzero to one. ζ Ωj = 0 means that the solution is well resolved and that no AV should be applied whileζ Ωj = 1 signifies that the solution has strong local variations and that AV must be applied. This s<strong>en</strong>soris obtained by comparing differ<strong>en</strong>t evaluations (on differ<strong>en</strong>t st<strong>en</strong>cils) of the gradi<strong>en</strong>t of a giv<strong>en</strong> scalar(pressure, total <strong>en</strong>ergy, mass fractions, . . . ). If these gradi<strong>en</strong>ts are id<strong>en</strong>tical, th<strong>en</strong> the solution is locallylinear and the s<strong>en</strong>sor is zero. On the contrary, if these two estimations are differ<strong>en</strong>t, local non-linearitiesare pres<strong>en</strong>t, and the s<strong>en</strong>sor is activated. The key point is to find a suitable s<strong>en</strong>sor-function that is non-zeroonly at places where stability problems occur.The ‘Colin-s<strong>en</strong>sor’ (ζΩ C j) [28] used in this thesis is <strong>de</strong>scribed here.The Colin s<strong>en</strong>sorFor most unsteady turbul<strong>en</strong>t computations it is necessary to have a sharp s<strong>en</strong>sor, which is very smallwh<strong>en</strong> the flow is suffici<strong>en</strong>tly resolved, and which is nearly maximum wh<strong>en</strong> a certain level of nonlinearitiesoccurs.S is the scalar quantity the s<strong>en</strong>sor is based on (usually S is the pressure) ∆ k 1 and ∆k 2 functions are<strong>de</strong>fined as:∆ k 1 = S Ωj − S k ∆ k 2 = ( ∇S) ⃗ k .(⃗x Ωj − ⃗x k ) (1.88)where a k subscript d<strong>en</strong>otes cell-vertex values while Ω j is the subscript for cell-averaged values.( ∇S) ⃗ k is the gradi<strong>en</strong>t of S at no<strong>de</strong> k as computed in AVBP.∆ k 1 measures the variation of S insi<strong>de</strong> the cell Ω j (using only quantities <strong>de</strong>fined on this cell). ∆ k 2 is an56
Artificial Viscosity in AVBPestimation of the same variation but on a wi<strong>de</strong>r st<strong>en</strong>cil (using all the neighbouring cell of the no<strong>de</strong> k).the aim of the so-called Colin-s<strong>en</strong>sor is to preserve sharp gradi<strong>en</strong>ts in the computation. its propertiescan be summarized as follows:• ζΩ C jis very small wh<strong>en</strong> both ∆ k 1 and ∆k 2 are small compared to S Ω j. This corresponds to lowamplitu<strong>de</strong> numerical errors (wh<strong>en</strong> ∆ k 1 and ∆k 2 have opposite signs) or smooth gradi<strong>en</strong>ts that arewell resolved by the scheme (wh<strong>en</strong> ∆ k 1 and ∆k 2 have the same sign).• ζΩ C jis small wh<strong>en</strong> ∆ k 1 and ∆k 2 have the same sign and the same or<strong>de</strong>r of magnitu<strong>de</strong>, ev<strong>en</strong> if theyare quite large. This corresponds to stiff gradi<strong>en</strong>ts well resolved by the scheme.• ζΩ C jis big wh<strong>en</strong> ∆ k 1 and ∆k 2 have opposite signs and one of the two term is large compared to theother. This corresponds to a high-amplitu<strong>de</strong> numerical oscillation.• ζ C Ω jis big wh<strong>en</strong> either ∆ k 1 or ∆k 2 is of the same or<strong>de</strong>r of magnitu<strong>de</strong> as S Ω j. This corresponds to anon-physical situation that originates from a numerical problem.The exact <strong>de</strong>finition of the Colin-s<strong>en</strong>sor is:ζΩ C j= 1 ( ( )) Ψ − Ψ01 + tanh− 1 ( ( )) −Ψ01 + tanh2δ 2δ(1.89)with:(∆ k )Ψ = max 0,k∈Ω j |∆ k ζkJ | + ɛ 1 S k∆ k = |∆ k 1 − ∆ k 2| − ɛ k max( )|∆ k 1|, |∆ k 2|(ɛ k max ( |∆ k 1= ɛ 2 1 − ɛ |, |∆k 2 |))3|∆ k 1 | + |∆k 2 | + S k(1.90)(1.91)(1.92)The numerical values used in AVBP are:Ψ 0 = 2.10 −2 δ = 1.10 −2 ɛ 1 = 1.10 −2 ɛ 2 = 0.95 ɛ 3 = 0.5 (1.93)WARNING:Note, that these <strong>de</strong>finitions of Ψ and ɛ k apply only for the Navier-Stokes variables. For species, therefer<strong>en</strong>ce value is not S k but 1, which is the maximum value of a species mass fraction:(∆ k )Ψ = max 0,k∈Ω j |∆ k ζkJ | + ɛ 1and ɛ k = ɛ 2(max ( |∆ k 11 − ɛ |, |∆k 2 |))3|∆ k 1 | + |∆k 2 | + 1(1.94)57
DESCRIPTION OF THE NUMERICAL TOOL AVBP1.5.2 The operatorsThere are two AV operators in AVBP: a 2 nd or<strong>de</strong>r operator and a 4 th or<strong>de</strong>r operator. All AV mo<strong>de</strong>ls inAVBP are a bl<strong>en</strong>d of these two operators. These operators have the following properties:• 2 nd or<strong>de</strong>r operator: it acts just like a “classical” viscosity. It smoothes gradi<strong>en</strong>ts, and introducesartificial dissipation. It is thus associated to a s<strong>en</strong>sor which <strong>de</strong>termines where it must be applied.Doing this, the numerical scheme keeps its or<strong>de</strong>r of converg<strong>en</strong>ce in the zones where the s<strong>en</strong>sor isinactive, while <strong>en</strong>suring stability and robustness in the critical regions. Historically, it was used tocontrol shocks, but it can actually smooth any physical gradi<strong>en</strong>t.• 4 th or<strong>de</strong>r operator: it is a less common operator. It acts as a bi-Laplacian and is mainly used tocontrol spurious high-frequ<strong>en</strong>cy wiggles.The way they are combined is <strong>de</strong>termined both by the s<strong>en</strong>sor and by user-<strong>de</strong>fined parameters (smu2 andsmu4).Both operator contributions are first computed on each cell vertex, and are th<strong>en</strong> scattered back to no<strong>de</strong>s(there is no diverg<strong>en</strong>ce here, as it is done directly during the scattering operation).The 2 nd or<strong>de</strong>r operatorA cell contribution of the 2 nd or<strong>de</strong>r AV is first computed on each vertex of the cell Ω j :R k∈Ωj = − 1 N vV Ωj∆t Ωjsmu2 ζ Ωj (w Ωj − w k ) (1.95)The nodal residual is th<strong>en</strong> found by adding the surrounding cells contributions:dw k = ∑ jR k∈Ωj (1.96)For example, on a 1D uniform mesh, of mesh size ∆x, and for ζ Ωj = ζ = cste :which can be interpreted as:with:ν AV =smu2 ζ ∆x22∆t=dw k = − smu2 ζ2dw k = −ν AV ∫smu2 ζ ∆x|u + c|2 CFL∆x∆t (w k−1 − 2w k + w k+1 ) (1.97)(∆ F k,∆x D w) dx (1.98)and∆ F Dk,∆x w = w k−1 − 2w k + w k+1∆x 2 (1.99)where ∆ F k,∆x D is exactly the classical FD Laplacian operator evaluated at k and of size ∆x.This shows that ν AV can be se<strong>en</strong> as an “artificial” viscosity (it has the same units as a physical viscosity),which is controlled by the user-<strong>de</strong>fined parameter smu2. The smu2 parameter is therefore dim<strong>en</strong>sionless.58
Artificial Viscosity in AVBPThe 4 th or<strong>de</strong>r operatorThe technique used for the 4 th or<strong>de</strong>r operator is id<strong>en</strong>tical to the technique of the 2 nd or<strong>de</strong>r operator. Acell contribution is first computed on each vertex:R k∈Ωj = 1 V [Ωjsmu4 (N v ∆t ⃗ ]∇w) Ωj · (⃗x Ωj − ⃗x k ) − (w Ωj − w k )ΩjThe nodal value is th<strong>en</strong> found by adding every surrounding cells contributions:(1.100)dw k = ∑ jR k∈Ωj (1.101)For example, on a 1D uniform mesh, of mesh size ∆x, this yields:R k∈Ωleft = smu4 [(∆x 12 ∆t 2 (w k − w k−2+ w ) (k+1 − w k−1 −∆x) ·2∆x 2∆x2R k∈Ωright = smu4 [(∆x 12 ∆t 2 (w k+1 − w k−1+ w ) (k+2 − w k ∆x) ·2∆x 2∆x 2Adding these 2 contributions gives:which can be interpreted:with:) (wk−1 + w k−2)−− w k)]( (1.102) )]wk + w k+1− w k2(1.103)dw k = smu4 ∆x16∆t (w k−2 − 4w k−1 + 6w k − 4w k+1 + w k+2 ) (1.104)dw k = κ AV ∫(∆∆ F k,∆x D w) dx (1.105)κ AV = smu4.∆x416∆t= smu4.∆x3 |u + c|16 CFLand∆∆ F Dk,∆x w = w k−2 − 4w k−1 + 6w k − 4w k+1 + w k+2∆x 4 (1.106)where ∆∆ F k,∆x D is exactly the classical FD bi-Laplacian operator evaluated at k and of size ∆x.This shows that κ AV can be se<strong>en</strong> as an “artificial” 4 th or<strong>de</strong>r hyper-viscosity, which is controlled by theuser-<strong>de</strong>fined parameter smu4. Just like smu2, the smu4 parameter is dim<strong>en</strong>sionless.59
DESCRIPTION OF THE NUMERICAL TOOL1.6 Cell-Vertex DiscretizationThe flow solver used for the discretization of the governing equations is based on the “finite volume”(FV) method. There are two common techniques for implem<strong>en</strong>ting FV methods: the so called cellvertexand the cell-c<strong>en</strong>tered formulation. In the latter, not used in AVBP, discrete solution values arestored at the c<strong>en</strong>ter of the control volumes (or grid cells), and neighbouring values are averaged acrosscell boundaries in or<strong>de</strong>r to calculate fluxes. The alternative cell-vertex technique, used as un<strong>de</strong>rlyingnumerical discretization method of AVBP, the discrete values of the conserved variables are stored at thecell vertices (or grid no<strong>de</strong>s). The mean values of the fluxes are th<strong>en</strong> obtained by averaging along the celledges.1.6.1 Weighted Cell Residual ApproachFor the <strong>de</strong>scription of the weighted cell-residual approach the laminar Navier-Stokes equations are consi<strong>de</strong>redin their conservative formulation:∂w∂t + ∇ · ⃗F = 0, (1.107)where w is the vector of conserved variables and ⃗ F is the corresponding flux t<strong>en</strong>sor. For conv<strong>en</strong>i<strong>en</strong>ce,the latter is divi<strong>de</strong>d into an inviscid and a viscous part, ⃗ F = ⃗ F I (w) + ⃗ F V (w, ⃗ ∇w). The spatial termsof the equations are th<strong>en</strong> approximated in each control volume Ω j to give the residualR Ωj = 1V Ωj∫where ∂Ω j d<strong>en</strong>otes the boundary of Ω j with normal ⃗n.∂Ω j⃗ F · ⃗n dS, (1.108)This cell-vertex approximation is readily applicable to arbitrary cell types and is h<strong>en</strong>ce straightforwardto apply for hybrid grids. The residual (1.108) is first computed for each elem<strong>en</strong>t by making use of asimple integration rule applied to the faces. For triangular faces, a straightforward mid-point rule isused, which is equival<strong>en</strong>t to the assumption that the individual compon<strong>en</strong>ts of the flux vary linearly onthese faces. For quadrilateral faces, where the no<strong>de</strong>s may not be co-planar, in or<strong>de</strong>r to <strong>en</strong>sure that theintegration is exact for arbitrary elem<strong>en</strong>ts if the flux functions do in<strong>de</strong>ed vary linearly, each face is divi<strong>de</strong>dinto triangles and th<strong>en</strong> integrated over the individual triangles. The flux value is th<strong>en</strong> obtained from theaverage of four triangles (two divisions along the two diagonals). This so-called ’linear preservationproperty’ plays an important part in the algorithm for <strong>en</strong>suring that accuracy is not lost on irregularmeshes. Computationally, it is useful to write the discrete integration of (1.108) over an arbitrary cell asR Ωj = 1N d V Ωj∑i∈Ω j⃗ Fi · ⃗ dS i , (1.109)60
Cell-Vertex Discretizationwhere F ⃗ i is an approximation of F ⃗ at the no<strong>de</strong>s, N d repres<strong>en</strong>ts the number of space dim<strong>en</strong>sions and{i ∈ Ω j } are the vertices of the cell. In this formulation the geometrical information has be<strong>en</strong> factoredinto terms dS ⃗ i that are associated with individual no<strong>de</strong>s of the cell but not faces; dSi ⃗ is merely theaverage of the area-weighted normals for triangulated faces with a common no<strong>de</strong> i, i ∈ Ω j . Note, thatfor consist<strong>en</strong>cy one has ∑ i∈Ω dSi ⃗j= ⃗0. A linear preserving approximation of the diverg<strong>en</strong>ce operatoris obtained if the volume V Ωj is <strong>de</strong>fined consist<strong>en</strong>tly assince ∇ · ⃗x = N d .V Ωj = 1N 2 d∑⃗x i · dS ⃗ i , (1.110)i∈Ω jOnce the cell residuals are calculated, one may th<strong>en</strong> <strong>de</strong>fine the semi-discrete schemedw kdt= − 1 V k∑j|k∈Ω jD k Ω jV Ωj R Ωj , (1.111)where DΩ k jis a distribution matrix that weights the cell residual from cell c<strong>en</strong>ter Ω j to no<strong>de</strong> k (”scatteroperation”),∑and V k is a ‘control volume’ associated with each no<strong>de</strong>. Conservation is guaranteed ifk∈Ω jDΩ k j= I. In the pres<strong>en</strong>t context, (1.111) is solved to obtain the steady-state solution usingexplicit Euler or Runge-Kutta time–stepping.The family of schemes of interest makes use of the following <strong>de</strong>finition of the distribution matrix:D k Ω j= 1n n(I + C δt Ω jV Ωj⃗ AΩj · ⃗ dS k ), (1.112)where n n is the number of no<strong>de</strong>s of Ω j and ⃗ A is the Jacobian of the flux t<strong>en</strong>sor. The simplest ‘c<strong>en</strong>traldiffer<strong>en</strong>ce’ scheme is obtained by choosing C = 0 and is neutrally stable wh<strong>en</strong> combined with Runge-Kutta time-stepping. A Lax-W<strong>en</strong>droff type scheme may also be formulated in which case C is chos<strong>en</strong>to be a constant that <strong>de</strong>p<strong>en</strong>ds on the number of space dim<strong>en</strong>sions and the type of cells used — itmay be shown that this takes the simple form C = n 2 v/2N d .61
DESCRIPTION OF THE NUMERICAL TOOL62
Part IIFlame Transfer Functions
Table of Cont<strong>en</strong>ts2 Linear mo<strong>de</strong>ls for FTFs (Flame Transfer Functions) 692.1 Historical background . . . . . . . . . . . . . . . . . . . . . . . . . . . . . . . . . . . . 692.2 Mo<strong>de</strong>ls for FTF . . . . . . . . . . . . . . . . . . . . . . . . . . . . . . . . . . . . . . . 722.2.1 Laminar FTF . . . . . . . . . . . . . . . . . . . . . . . . . . . . . . . . . . . . 722.2.2 Turbul<strong>en</strong>t FTF . . . . . . . . . . . . . . . . . . . . . . . . . . . . . . . . . . . 74Convective τ hypothesis . . . . . . . . . . . . . . . . . . . . . . . . . . . . . . 74Global formulation for FTF mo<strong>de</strong>l . . . . . . . . . . . . . . . . . . . . . . . . . 75Local formulation . . . . . . . . . . . . . . . . . . . . . . . . . . . . . . . . . . 76Normalizations of FTF amplitu<strong>de</strong>s . . . . . . . . . . . . . . . . . . . . . . . . . 77Pressure/velocity FTF mo<strong>de</strong>l . . . . . . . . . . . . . . . . . . . . . . . . . . . . 78G<strong>en</strong>eral remarks . . . . . . . . . . . . . . . . . . . . . . . . . . . . . . . . . . 783 Measurem<strong>en</strong>t methods for FTF in LES 813.1 LES of FTF . . . . . . . . . . . . . . . . . . . . . . . . . . . . . . . . . . . . . . . . . 813.1.1 LES as the proper tool for FTF . . . . . . . . . . . . . . . . . . . . . . . . . . . 813.1.2 Introducing acoustic waves through the burner inlet . . . . . . . . . . . . . . . . 813.2 Postprocessing methods for local FTF . . . . . . . . . . . . . . . . . . . . . . . . . . . 823.2.1 ”Time <strong>de</strong>lay” or ”Flight time” method (TD method). . . . . . . . . . . . . . . . 833.2.2 Harmonic forcing; FFT postprocessed method (HF-FFT method). . . . . . . . . 833.2.3 White noise forcing; FFT postprocessed method (WN-FFT method). . . . . . . . 843.2.4 White noise forcing; Wi<strong>en</strong>er-Hopf postprocessed method (WN-WH method). . . 843.3 Preliminary comparisons of postprocessing methods. . . . . . . . . . . . . . . . . . . . 853.3.1 Validation of signal post-processing methods: FFT versus Wi<strong>en</strong>er-Hopf inversion. 86First test : influ<strong>en</strong>ce of a noisy response signal . . . . . . . . . . . . . . . . . . 86Second test : influ<strong>en</strong>ce of signal sampling . . . . . . . . . . . . . . . . . . . . . 87Third test : influ<strong>en</strong>ce of a shift of the response frequ<strong>en</strong>cy. . . . . . . . . . . . . . 87
TABLE OF CONTENTS3.3.2 Admittance of a diffuser : HF-FFT versus WN-WH methods. . . . . . . . . . . 89Mean flow . . . . . . . . . . . . . . . . . . . . . . . . . . . . . . . . . . . . . 89Admittance calculation . . . . . . . . . . . . . . . . . . . . . . . . . . . . . . . 914 Transfer functions of flames 954.1 Configuration A : laminar planar premixed flame (1D) . . . . . . . . . . . . . . . . . . 974.1.1 Description . . . . . . . . . . . . . . . . . . . . . . . . . . . . . . . . . . . . . 974.1.2 Amplitu<strong>de</strong> . . . . . . . . . . . . . . . . . . . . . . . . . . . . . . . . . . . . . 974.1.3 Time <strong>de</strong>lay . . . . . . . . . . . . . . . . . . . . . . . . . . . . . . . . . . . . . 984.2 Configuration B : laminar V flame (2D axi-symmetric) . . . . . . . . . . . . . . . . . . 1014.2.1 Comparison of global FTF (F norm ) . . . . . . . . . . . . . . . . . . . . . . . . 101Amplitu<strong>de</strong> . . . . . . . . . . . . . . . . . . . . . . . . . . . . . . . . . . . . . 101Phase . . . . . . . . . . . . . . . . . . . . . . . . . . . . . . . . . . . . . . . . 1024.3 Configuration C : turbul<strong>en</strong>t burner in cylindrical chamber (3D) . . . . . . . . . . . . . . 1044.3.1 Introduction . . . . . . . . . . . . . . . . . . . . . . . . . . . . . . . . . . . . . 1064.3.2 A double-swirler partially premixed burner . . . . . . . . . . . . . . . . . . . . 1074.3.3 Large Eddy Simulations for gas turbines . . . . . . . . . . . . . . . . . . . . . . 1074.3.4 Introducing acoustic waves through the burner inlet . . . . . . . . . . . . . . . . 1094.3.5 Reacting steady flow . . . . . . . . . . . . . . . . . . . . . . . . . . . . . . . . 1104.3.6 Forced reacting flow . . . . . . . . . . . . . . . . . . . . . . . . . . . . . . . . 1124.3.7 Coher<strong>en</strong>t structures . . . . . . . . . . . . . . . . . . . . . . . . . . . . . . . . . 1124.3.8 Comparison of LES, RANS and experim<strong>en</strong>t : global transfer function . . . . . . 1184.3.9 Comparison of LES, RANS and experim<strong>en</strong>t : local transfer function . . . . . . 1184.3.10 Conclusions . . . . . . . . . . . . . . . . . . . . . . . . . . . . . . . . . . . . . 1264.4 Configuration D : turbul<strong>en</strong>t burner in a 15 ◦ sector (3D) . . . . . . . . . . . . . . . . . . 1274.4.1 G<strong>en</strong>eral computational remarks. . . . . . . . . . . . . . . . . . . . . . . . . . . 1284.4.2 Refer<strong>en</strong>ce signals . . . . . . . . . . . . . . . . . . . . . . . . . . . . . . . . . . 129Comparison of global FTF. . . . . . . . . . . . . . . . . . . . . . . . . . . . . . 129Comparison of local FTF. . . . . . . . . . . . . . . . . . . . . . . . . . . . . . 1294.4.3 Comparison of global FTF (F norm ) . . . . . . . . . . . . . . . . . . . . . . . . 130Amplitu<strong>de</strong> . . . . . . . . . . . . . . . . . . . . . . . . . . . . . . . . . . . . . 130Phase . . . . . . . . . . . . . . . . . . . . . . . . . . . . . . . . . . . . . . . . 1314.4.4 Local comparison of FTF (F dim ) . . . . . . . . . . . . . . . . . . . . . . . . . . 132Amplitu<strong>de</strong> . . . . . . . . . . . . . . . . . . . . . . . . . . . . . . . . . . . . . 13266
TABLE OF CONTENTSTime <strong>de</strong>lay . . . . . . . . . . . . . . . . . . . . . . . . . . . . . . . . . . . . . 135Weighted Probability d<strong>en</strong>sity functions of time <strong>de</strong>lays. . . . . . . . . . . . . . . 1354.4.5 Concluding remarks for configuration D . . . . . . . . . . . . . . . . . . . . . . 1374.5 Evaluation of FTF measurem<strong>en</strong>ts methods in LES. . . . . . . . . . . . . . . . . . . . . 13867
TABLE OF CONTENTS68
Chapter 2Linear mo<strong>de</strong>ls for FTFs (Flame TransferFunctions)2.1 Historical backgroundSince the beginning of the 50’s, the <strong>de</strong>velopm<strong>en</strong>t of higher power propulsion systems has be<strong>en</strong> disruptedby the issue of thermoacoustic instabilities. Thanks to the use of mathematical tools from the field ofelectronics, like the notion of transfer functions, the un<strong>de</strong>rstanding of these instabilities has also grownat the same time. There are two main methods to study the stability of combustors:• the Purely Acoustic (PA) method. In this approach, the burner is consi<strong>de</strong>red as a black box and atwo-port formulation is used to reconstruct a transfer matrix linking acoustic fluctuations on bothsi<strong>de</strong>s of the burner [1, 95, 98, 99, 111]. Figure 2.1 illustrates the i<strong>de</strong>a that the whole combustionchamber can be treated as a black box and its acoustic response obtained from the four signals ofinlet and outlet velocity and pressure fluctuation signals. Uinlet ′ and U outlet ′ are respectively theFigure 2.1 - The combustion chamber se<strong>en</strong> with a two-port formulation.velocity fluctuations at the inlet and at the outlet of the configuration. Pinlet ′ and P outlet ′ are thepressure fluctuations at the inlet and at the outlet of the system. These quantities are linked by the
LINEAR MODELS FOR FTFS (FLAME TRANSFER FUNCTIONS)acoustic matrix M of the configuration by the following relation :( ) ( )U′outletU′Poutlet′ = M inletPinlet′(2.1)Note that the coeffici<strong>en</strong>ts of the M matrix are complex. The elem<strong>en</strong>t containing the flame is treatedlike all others so that the flame effect is inclu<strong>de</strong>d in the matrix of this elem<strong>en</strong>t. The major drawbackof this method is that in experim<strong>en</strong>ts, the measurem<strong>en</strong>t of unsteady pressure and velocities in burntgases can be a difficult task.• the Flame Transfer Function methods. With this method, the velocity and pressure signals after theburner are not used anymore. The transfer acoustic matrix is recovered using the inlet velocity (andpressure) signal(s) as well as the instantaneous heat release signal. Wh<strong>en</strong> using these methods, thedim<strong>en</strong>sional flame transfer function is called F dim (ω) = Ω′uand a priori <strong>de</strong>p<strong>en</strong>ds on the frequ<strong>en</strong>cy.′|F dim (ω)| is amplitu<strong>de</strong> of the response and Arg(F dim (ω))/(2πω) is the time <strong>de</strong>lay of the response.Dep<strong>en</strong>ding on the mo<strong>de</strong>l used, both can vary with frequ<strong>en</strong>cy or not.As shown by Truffin et Al.[150], both methods (PA and FTF) are mathematically equival<strong>en</strong>t and a twoportmatrix can be obtained by the knowledge of the transfer function F dim (ω).In the following, focus is mainly put on Flame Transfer Function mo<strong>de</strong>ls and measurem<strong>en</strong>t methods.Figure 2.2 illustrates the i<strong>de</strong>a that in a combustion chamber, the whole reaction zone can be treated asa ”black box” and that the global heat release response of the flame can be correlated to the incomingfluctuating velocity and/or pressure signal(s). The first introduction of flame transfer function is due toFigure 2.2 - FTF repres<strong>en</strong>tation of the reaction zone.the work on linear stability of combustor of Gun<strong>de</strong>r et al. [49] for whom the flame is se<strong>en</strong> as a reacting<strong>de</strong>vice with a fixed time <strong>de</strong>lay to mass flow fluctuations coming from the inlet. Following this workand assuming that heat release fluctuations are mostly due to the inlet velocity fluctuations 1 ; Crocco etal. [31] introduced and <strong>de</strong>veloped in 1951 the i<strong>de</strong>a that the heat release fluctuation is linked to the inletvelocity fluctuation by a simple relation known as the ”n−τ” mo<strong>de</strong>l. The n−τ mo<strong>de</strong>l is the simplest FTFapproach. It assumes the following relation betwe<strong>en</strong> the heat release fluctuation in the whole chamberΩ ′ Tand the inlet velocity fluctuation:∫Ω ′ T = ˙ω T ′ (t)dv ∝ nu ′ (t − τ) (2.2)V1 This assumption comes from experim<strong>en</strong>ts where the flame surface varies linearly with the velocity in front of the flame.70
2.1 Historical backgroundwhere ˙ω ′ T is the local heat release fluctuation and u′ the refer<strong>en</strong>ce (inlet) velocity fluctuation. n and τare constant over time and do not <strong>de</strong>p<strong>en</strong>d on the frequ<strong>en</strong>cy of the fluctuation. This mo<strong>de</strong>l implies thatany inlet velocity fluctuation ”acts” on the flame after a time <strong>de</strong>lay τ un<strong>de</strong>r the shape of a heat releasefluctuation whose amplitu<strong>de</strong> is proportional to n times the initial velocity perturbation. The previousrelation assumes that the incoming perturbation is harmonic. It is intrinsically linked to the linear stabilitystudies of combustion systems.In these first studies, n and τ are constant. This mo<strong>de</strong>l therefore has the drawback of consi<strong>de</strong>ring allfrequ<strong>en</strong>cies equival<strong>en</strong>t concerning the flame transfer function. But it is known for a long time (De Soetein 1964 [142] for laminar flames and Becker et al. in 1971 for turbul<strong>en</strong>t flames [6]) that FTF are notconstant and can be approximated in amplitu<strong>de</strong> by a frequ<strong>en</strong>cy low-pass filter. Figure 2.3 repres<strong>en</strong>tsFigure 2.3 - Typical shape of the flame transfer function. The flame behaves as a low pass filter with a giv<strong>en</strong>cut-off frequ<strong>en</strong>cya typical amplitu<strong>de</strong> of the FTF as observed experim<strong>en</strong>tally. More rec<strong>en</strong>tly, Le Helley [52] and Noirayet al. [94] also confirmed this fact experim<strong>en</strong>tally showing that the amplitu<strong>de</strong> of the flame response<strong>de</strong>creases with the frequ<strong>en</strong>cy.The n − τ mo<strong>de</strong>l has be<strong>en</strong> ext<strong>en</strong><strong>de</strong>d and refined in many aspects and pres<strong>en</strong>t FTF mo<strong>de</strong>ls use varyingmodulus and phase with frequ<strong>en</strong>cy. Variables n and τ are linked to the FTF by the following relations :n(ω) = |F dim (ω)| (2.3)τ(ω) = Arg(F dim(ω))(2.4)2πωYet, the <strong>de</strong>p<strong>en</strong>dance of the time <strong>de</strong>lay (τ(ω)) to the frequ<strong>en</strong>cy ( ω 2π) is not clear. Other authors [14, 67, 66]have measured almost linearly increasing phase of the flame response with frequ<strong>en</strong>cy or, in other words,almost constant time <strong>de</strong>lays of the response of the flame. This observation leads to an hybrid mo<strong>de</strong>lwhere the modulus of F varies with the frequ<strong>en</strong>cy but the time <strong>de</strong>lay (τ) is the mean convective tim<strong>en</strong>ee<strong>de</strong>d by the perturbation to go from the inlet of the combustion chamber to the flame. As shown inSection 2.2, this leads to a particular method to measure the phase response of the flame : the ”Time<strong>de</strong>lay” or ”Flight time” method (TD).71
LINEAR MODELS FOR FTFS (FLAME TRANSFER FUNCTIONS)2.2 Mo<strong>de</strong>ls for FTFThe response of turbul<strong>en</strong>t flames to acoustic forcing is studied in the pres<strong>en</strong>t work. This section focuseson hypothesis and ph<strong>en</strong>om<strong>en</strong>ological mo<strong>de</strong>ls that have be<strong>en</strong> <strong>de</strong>veloped for such flows. Great progresshas rec<strong>en</strong>tly be<strong>en</strong> ma<strong>de</strong> in the compreh<strong>en</strong>sion of the linear and non-linear response of laminar flames toacoustic disturbances [42, 74, 134]. The <strong>de</strong>rived mo<strong>de</strong>ls will be m<strong>en</strong>tioned since they illustrate the workin progress in the <strong>de</strong>rivation of mo<strong>de</strong>ls for FTF of turbul<strong>en</strong>t flames. First, the mo<strong>de</strong>l of Ducruix et al. [42]is discussed as a particular example of a theoretical laminar FTF mo<strong>de</strong>l and its main tr<strong>en</strong>ds are analyzed(Section 2.2.1). Th<strong>en</strong> ph<strong>en</strong>om<strong>en</strong>ological mo<strong>de</strong>ls for turbul<strong>en</strong>t FTF are discussed along with their mainhypothesis (Section 2.2.2).2.2.1 Laminar FTFThe laminar flame transfer function mo<strong>de</strong>l proposed by EM2C in a series of publications [42, 94, 134]is <strong>de</strong>dicated to laminar flames anchored as V flames. The flame movem<strong>en</strong>t is studied analytically orusing the so-called G-equation. The fluctuation of the flame surface is correlated to the fluctuation of theincoming velocity and the fluctuation of heat release is directly linked with the fluctuation of the flamesurface. Ducruix et al. [42] and Schuller et al. [134] <strong>de</strong>velop the following theoretical mo<strong>de</strong>l for theresponse of laminar conical-flame :Ω ′ TΩ ¯= ā 2T u ω⋆2 [(1 − cosω ⋆ )cos(ωt) + (ω ⋆ − sinω ⋆ )sin(ωt)] (2.5)Ω ′ TΩ ¯= u′T ū F norm(ω) (2.6)where ω ⋆ ≈ ωL f α 0 /S l is a reduced pulsation. L f , S l and α 0 are respectively the flame l<strong>en</strong>gth, thelaminar flame velocity and the half angle of the cone <strong>de</strong>fined by the flame front (see fig 2.4). Ω ′ T and Ω ¯ Tare respectively the fluctuation and the mean value of the volumic integrated heat release. u ′ = acos(ωt)and ū are the fluctuation and the mean value of the velocity field. Equation 2.6 leads to the followingvalues for |F norm (ω)| and Arg(F norm (ω)):|F norm (ω)| = 2/ω 2 ⋆ ∗ [(1 − cosω ⋆ ) 2 + (ω ⋆ − sinω ⋆ ) 2 ] 1 2Arg(F norm (ω)) = tan −1 [(ω ⋆ − sinω ⋆ )/1 − cosω ⋆ )]Figure 2.5 shows a sketch of the results obtained both theoretically and experim<strong>en</strong>tally. It shows a goodagreem<strong>en</strong>t betwe<strong>en</strong> experim<strong>en</strong>tal results and mo<strong>de</strong>l both for the amplitu<strong>de</strong> and the phase of the FTF forlow reduced pulsations ω ⋆ . These results point out some of the main features of the FTF to be met withturbul<strong>en</strong>t FTF.• The FTF can be well reproduced using a first-or<strong>de</strong>r low-pass filter at least for low frequ<strong>en</strong>cies. Athigher frequ<strong>en</strong>cies, the heat release fluctuation and the velocity fluctuation at the burner mouth canbe out of phase whereas the maximum phase is π/2 for a first or<strong>de</strong>r low-pass filter. Obviously, theFTF phase in turbul<strong>en</strong>t cases will take any value betwe<strong>en</strong> 0 and 2π making it hard to repres<strong>en</strong>t it72
2.2 Mo<strong>de</strong>ls for FTFFigure 2.4 - Theroretical experim<strong>en</strong>t used for the <strong>de</strong>rivation of the laminar FTF mo<strong>de</strong>l. a) steady state. b) forcedcase ([42])Figure 2.5 - Sketch of the amplitu<strong>de</strong> and phase of the laminar FTF. Experim<strong>en</strong>t First-or<strong>de</strong>r mo<strong>de</strong>l([42])73
LINEAR MODELS FOR FTFS (FLAME TRANSFER FUNCTIONS)with low-or<strong>de</strong>r low-pass filter mo<strong>de</strong>ls which are limited to less than 2π for the maximum phase ofthe FTF.• Ev<strong>en</strong> with no reflections, the FTF amplitu<strong>de</strong> is not continuously <strong>de</strong>creasing with the frequ<strong>en</strong>cy andshows peaks. One might infer that if any reflection on walls should occur, the flame might supportinstabilities at the proper frequ<strong>en</strong>cies.Yet, this laminar FTF theoretical mo<strong>de</strong>l cannot be directly applied to turbul<strong>en</strong>t combustion because ofmultiple hypothesis that cannot be used with turbul<strong>en</strong>t combustion.• Velocity fluctuations are directly correlated to pressure oscillations. In other words, the baselineflow is laminar and no turbul<strong>en</strong>t uncorrelated velocity fluctuations are pres<strong>en</strong>t.• The speed of the flame front is assumed to be in<strong>de</strong>p<strong>en</strong>d<strong>en</strong>t of the local curvature and is equal tothe laminar flame velocity.• The flame front is continuous. No local extinction occur, which will be the case for turbul<strong>en</strong>tflames.• The flame is anchored to the burner lip. No movem<strong>en</strong>t of the flame base is consi<strong>de</strong>red.• The incoming acoustic perturbation is one-dim<strong>en</strong>sional which is not the case for turbul<strong>en</strong>t combustionwhere the flow field is greatly perturbed by the flame.If one of the previous hypothesis is relaxed, the equations that lead to the laminar FTF become toocomplex to be solved by hand and need to be solved numerically. Other mo<strong>de</strong>ls of FTF for laminarflames have be<strong>en</strong> <strong>de</strong>scribed by Hathout et al [51] or Lieuw<strong>en</strong> [73] but they have similar limitations.2.2.2 Turbul<strong>en</strong>t FTFMethods used for laminar FTF cannot be directly applied to FTF of turbul<strong>en</strong>t flames. One therefore needsto consi<strong>de</strong>r more ph<strong>en</strong>om<strong>en</strong>ological hypothesis along with numerical tools to obtain the turbul<strong>en</strong>t FTF.This section focuses on mo<strong>de</strong>ls for turbul<strong>en</strong>t Flame Transfer Function. These mo<strong>de</strong>ls are all ext<strong>en</strong>tions ofthe classical n − τ mo<strong>de</strong>l [31] and therefore suppose that the response to a harmonic forcing of the inletvelocity is a harmonic heat release fluctuation at the same frequ<strong>en</strong>cy. Still, it is of interest to m<strong>en</strong>tionthe work of Armitage et al. [5] who rec<strong>en</strong>tly investigated the non-linear response of turbul<strong>en</strong>t premixedflames.Convective τ hypothesisAs pres<strong>en</strong>ted in the introduction, most qualitative analysis of the instability ph<strong>en</strong>om<strong>en</strong>on oft<strong>en</strong> m<strong>en</strong>tionthat it is <strong>en</strong>ough to know the time <strong>de</strong>lay since this parameter will impose the frequ<strong>en</strong>cy of the instability.Therefore most efforts have be<strong>en</strong> ma<strong>de</strong> to <strong>de</strong>termine the phase of the flame transfer function and not the74
2.2 Mo<strong>de</strong>ls for FTFgain. Mo<strong>de</strong>ling the time <strong>de</strong>lay of the flame response as being constant is something wi<strong>de</strong>ly done wh<strong>en</strong>constructors want to have a rough i<strong>de</strong>a of the stability of their combustor [77].The assumptions used in this case are:• that the upstream g<strong>en</strong>erated perturbation has a convective nature and therefore that the flame respondsto a propagation of an <strong>en</strong>tropy, a vorticity or a mass flow rate fluctuation which is convectedby the mean flow,• <strong>de</strong>p<strong>en</strong>ding on the authors, differ<strong>en</strong>t distributions of time <strong>de</strong>lays betwe<strong>en</strong> heat release fluctuationsand forcing velocity fluctuations are chos<strong>en</strong>, from continuous [39] to discrete [66] distributions. Atleast a distribution for τ should be chos<strong>en</strong> for partially premixed flames as argued by Dowling [39]who gives a simple explanation in the case of lean combustors. At lean conditions, the equival<strong>en</strong>ceratio fluctuation in front of the flame is the main reason for heat release fluctuation. A simple flametransfer function is in this case :Ω ′ TΩ ¯= k φ′(2.7)T¯φIf there is a uniform convection time τ from the fuel injection to the flame, th<strong>en</strong>φ ′ (t)¯φ = −u′ (t − τ)ū(2.8)where u is the fuel injection velocity. But substituting relation 2.8 into relation 2.7 leads to a FTFamplitu<strong>de</strong> which is in<strong>de</strong>p<strong>en</strong>d<strong>en</strong>t of the frequ<strong>en</strong>cy; which cannot be true, as argued in the previoussection. Choosing an homog<strong>en</strong>eous repartition of the convective time betwe<strong>en</strong> τ − δτ and τ + δτleads to the following relation betwe<strong>en</strong> heat release fluctuations and inlet velocity fluctuations.ˆ Ω ′ T (ω)¯ Ω T= −k û(ω)ū12δτ∫ τ+δττ−δτe −iωt = −k sin(ωδτ) û(ω)ωδτ ū e−iωτ (2.9)The shape of the FTF obtained from this mo<strong>de</strong>l better fits the experim<strong>en</strong>tal and numerical measurem<strong>en</strong>tsof Flame Transfer Function amplitu<strong>de</strong>s which state that the FTF amplitu<strong>de</strong> <strong>de</strong>creaseswith the frequ<strong>en</strong>cy of forcing.Global formulation for FTF mo<strong>de</strong>lA normalized version of this mo<strong>de</strong>l is oft<strong>en</strong> used to compare the global heat release in the burner and theinlet velocity. It <strong>en</strong>ables to compare results from one configuration to an other. In this case, the transferfunction F is <strong>de</strong>fined by:γ − 1˙ω Tγp 0 S inj∫V′ (t)dv = F (ω)u ′ (t) (2.10)where S inj is the forced refer<strong>en</strong>ce inlet surface, ˙ω ′ T and u′ are respectively the local heat release andthe inlet velocity fluctuations tak<strong>en</strong> at the refer<strong>en</strong>ce point. This normalization is introduced by analyticalcalculation of the asymptotic behavior for infinitely low frequ<strong>en</strong>cy flame response as <strong>de</strong>rived in [61] andpres<strong>en</strong>ted below : for premixed flames, this asymptotic value links the ratio of burnt gas temperature (T b )75
LINEAR MODELS FOR FTFS (FLAME TRANSFER FUNCTIONS)and fresh gas temperature (T f ) with the amplitu<strong>de</strong> of the flame response to infinitively low frequ<strong>en</strong>cyforcing.Replacing integral heat release by fuel consumption in Eq.(2.10) and balancing fuel consumption withfuel supply leads to :∫QS inj u inj ρ 0 Y F = ˙ω T dv (2.11)where Q is the heat released by the combustion of 1kg of fuel. Th<strong>en</strong> in the low frequ<strong>en</strong>cy limit (ω → 0),an estimate can be <strong>de</strong>rived for the limit value of the amplitu<strong>de</strong> of the FTF (|F (ω)|) :V|F (ω)|(ω → 0) = γ − 1γp 0Qρ 0 Y 0 F min(1, 1/φ) (2.12)Assuming constant heat capacity (c p (T b − T f ) = QYF 0 min(1, 1/φ)), the previous equation can be writt<strong>en</strong>:lim |F (ω)| = T b− 1 (2.13)ω→0 T fwhich can be a useful upper limit for F (ω). For typical methane flames, it lies betwe<strong>en</strong> 1 and 10,<strong>de</strong>p<strong>en</strong>ding on the inlet temperature.Local formulationConv<strong>en</strong>tional FTF mo<strong>de</strong>l focus on the correlation betwe<strong>en</strong> the volumic integral of heat release fluctuationswith a refer<strong>en</strong>ce point velocity fluctuation. It implies that the flame is compact compared to thecharacteristic wavel<strong>en</strong>gth of the perturbation. But although the flame is acoustically compact, it is oft<strong>en</strong>not compact compared to the velocity fluctuation characteristic l<strong>en</strong>gths. For such cases, an ext<strong>en</strong>sion ofthese global mo<strong>de</strong>ls can be obtained by linking the correlation of the local heat release fluctuation withthe refer<strong>en</strong>ce velocity fluctuation. The objective of this ext<strong>en</strong>sion of the FTF mo<strong>de</strong>l is therefore to givethe spatial distribution of the Flame Transfer Function. Experim<strong>en</strong>ts can also be used to provi<strong>de</strong> thesame information by measuring unsteady heat release in 1-D sections (using a moveable slit (Varoquieet al [152])) or in 3-D using local diagnostics (Poinsot et al [103]).This ext<strong>en</strong>sion can give either 1-D or3-D repres<strong>en</strong>tations of the FTF :• For the 3D ext<strong>en</strong>sion, the relation is :γ − 1γ ¯pS injˆ˙ ω ′ T (x, y, z) = F (ω, x, y, z)û′ (2.14)where ω ˆ˙T ′ (x, y, z) is the local fourier transform of the heat release fluctuation. This mo<strong>de</strong>l isdirectly linked with the usual FTF mo<strong>de</strong>l by :∫|F (ω)| =∣ F (ω, x, y, z)dv∣ (2.15)v(∫)Arg(F (ω)) = Arg F (ω, x, y, z)dv(2.16)76v
2.2 Mo<strong>de</strong>ls for FTF• For the 1D ext<strong>en</strong>sion, the relation is :γ − 1Ω′ˆγ ¯pS T(x) = F (ω, x)û′ (2.17)injwhere Ω ˆ′T(x) is now the Fourier transform of the integrated (over y,z) heat release fluctuation. Thismo<strong>de</strong>l is directly linked with the usual FTF mo<strong>de</strong>l by :∫|F (ω)| =∣ F (ω, x)dx∣ (2.18)x(∫ )Arg(F (ω)) = Arg F (ω, x)dx(2.19)xThis mo<strong>de</strong>l ext<strong>en</strong>sion gives 1D curves of the flame transfer function which can be used in 1Dacoustic co<strong>de</strong>s to gives eig<strong>en</strong> mo<strong>de</strong>s of reacting configurations where the flame cannot be consi<strong>de</strong>redas compact anymore (for example in the ICLEAC experim<strong>en</strong>t of Varoquié [151] or Truffin[149].)Normalizations of FTF amplitu<strong>de</strong>sTwo other normalizations both for the global and local formulations of the FTF are used in this work.The dim<strong>en</strong>sional FTF amplitu<strong>de</strong> is also used.• The FTF can be normalized by the ratio betwe<strong>en</strong> the mean velocity at the refer<strong>en</strong>ce point andthe integral of the mean heat release over the whole volume leading to a non-dim<strong>en</strong>sional FTFamplitu<strong>de</strong>. In other words :F norm (ω) = ū¯ Ω TˆΩ′ Tû ′ (2.20)This normalization is used for the analysis of global FTF in sections 4.2 and 4.4.• For the local formulation, the FTF amplitu<strong>de</strong> can also be normalized by its maximum value in thecombustor. This normalization is introduced in section 4.1 for the analysis of the main features ofthe response of 1D flames to inlet velocity forcing. It is <strong>de</strong>scribed by the following relation:|F norm2 (ω)(x, y, z)| =∣∣ ˆω ′ Tû′∣∣max x,y,z( ˆω′ Tû′)∣ ∣∣(2.21)• Finally, the dim<strong>en</strong>sional amplitu<strong>de</strong> FTF is also used in section 4.3 and 4.4 for the local analysis ofthe flame response. The following relation links the amplitu<strong>de</strong> of the FTF in this case with heatrelease and velocity fluctuations:|F dim (x, y, z)| =∣ˆω ′ Tû ′ ∣ ∣∣∣∣(2.22)77
LINEAR MODELS FOR FTFS (FLAME TRANSFER FUNCTIONS)Note that all the ( formulations ) for the amplitu<strong>de</strong> of the FTF ( do)not influ<strong>en</strong>ce the FTF phase which remainsequal to ArgˆΩ′ Tûfor the global analysis and to Argˆω′ T′ ûfor the local one.′Pressure/velocity FTF mo<strong>de</strong>lAll the previously exposed ext<strong>en</strong>sions for the FTF mo<strong>de</strong>l heavily rely on the choice of the refer<strong>en</strong>ce point.Truffin and Poinsot [150] have shown that the distance betwe<strong>en</strong> the refer<strong>en</strong>ce point and the flame zone hasto be compact compared to the acoustic wave l<strong>en</strong>gth to give relevant amplitu<strong>de</strong> and phase values wh<strong>en</strong>only the velocity is measured at the refer<strong>en</strong>ce point. These values can th<strong>en</strong> be used to reconstruct theacoustic matrix of the combustor. This can be an issue for experim<strong>en</strong>talists since measuring a velocityfield near the flame front requires exp<strong>en</strong>sive heat resistant probes. Truffin and Poinsot show that thisissue can be avoi<strong>de</strong>d by measuring also pressure fluctuation at the refer<strong>en</strong>ce point. In this case, theglobal mo<strong>de</strong>l has four parameters :∫ωˆ˙T ′ dv = F u (ω)û′ + F p (ω) ˆp ′ (2.23)Vwhere F u , F p respectively repres<strong>en</strong>t the transfer function of the response due to the velocity and pressurefluctuations. Wh<strong>en</strong> ∫ ˆ˙VωT ′ is expressed as a function of û′ and ˆp ′ at the refer<strong>en</strong>ce point, this refer<strong>en</strong>cepoint can be anywhere and the difficulty of the classical mo<strong>de</strong>l (based on ∫ ˆ˙VωT ′ versus û′ ) disappears.However there is a drawback to this approach : to <strong>de</strong>termine F u and F p , two in<strong>de</strong>p<strong>en</strong>d<strong>en</strong>t calculationsmust be performed or two differ<strong>en</strong>t forced experim<strong>en</strong>tal cases must be set : one forced at the inlet andthe other one forced at the outlet. Truffin and Poinsot show that in this case, the flame transfer functioncan be used to reconstruct the global acoustic matrix of the combustion chamber linking pressure andvelocity fluctuations upstream and downstream of the flame. To assess this achievem<strong>en</strong>t, in [150] theacoustic matrix is reconstructed with two methods.• The first method uses the pressure and velocities upstream and downstream of the flame front. Theacoustic matrix is recovered using usual acoustic relations.• The second method uses only pressure and velocity measurem<strong>en</strong>ts upstream from the flame. Finallythe FTF obtained from their mo<strong>de</strong>l is used to reconstruct the acoustic matrix of the combustionchamber.The two methods give similar results and these results do not <strong>de</strong>p<strong>en</strong>d on the distance betwe<strong>en</strong> the refer<strong>en</strong>cepoint and the flame front.G<strong>en</strong>eral remarksAll previously pres<strong>en</strong>ted formulations (except the pressure/velocity FTF mo<strong>de</strong>l) rely on the compacityof the flame front compared to the acoustic wave l<strong>en</strong>gth. If the flame is not compact, the obtained FTF isnot compatible with the PA approach. This means that there is a lower limit to the acoustic wavel<strong>en</strong>gth78
2.2 Mo<strong>de</strong>ls for FTFthat can be handled properly by these mo<strong>de</strong>ls. For actual combustion chambers used in gas turbines, thecharacteristic l<strong>en</strong>gth of the flame is a few <strong>de</strong>cimeters. This means that those mo<strong>de</strong>ls can be applied foracoustic waves which have at least a wavel<strong>en</strong>gth (L) of a few meters. In hot gases (c = 900m.s −1 ), thefrequ<strong>en</strong>cy cut-off (f off ) is therefore of a few hundred Hz only (f off = c L). Using other mo<strong>de</strong>ls than the”pressure/velocity FTF mo<strong>de</strong>l”, the system id<strong>en</strong>tification of combustion chambers is therefore limited tofrequ<strong>en</strong>cies lower than a few hundred Hz.79
LINEAR MODELS FOR FTFS (FLAME TRANSFER FUNCTIONS)80
Chapter 3Measurem<strong>en</strong>t methods for FTF in LES3.1 LES of FTFThis section <strong>de</strong>scribes how simulation can be used to measure FTF in flames (laminar or turbul<strong>en</strong>t).3.1.1 LES as the proper tool for FTFConsi<strong>de</strong>ring the measurem<strong>en</strong>t of turbul<strong>en</strong>t FTF, the advantage of LES is clear. Turbul<strong>en</strong>t FTF are mainlynee<strong>de</strong>d for acoustic study purposes in complex geometries. Typical acoustic frequ<strong>en</strong>cies are of the or<strong>de</strong>rof 500 Hz in gas turbines corresponding to a period of 2 ms which correspond to time scales that ar<strong>en</strong>ow affordable for LES ev<strong>en</strong> in complex geometries thanks to the use of unstructured meshes.To <strong>de</strong>termine FTF, one needs either the instantaneous volumic integral of the heat release fluctuation(to <strong>de</strong>termine the global response of the flame) or the instantaneous field of heat release fluctuations(to <strong>de</strong>termine the local response of the flame). In this work, LES (AVBP co<strong>de</strong> from CERFACS(www.cerfacs.fr/cfd)) is chos<strong>en</strong> to get these fields.3.1.2 Introducing acoustic waves through the burner inletTo <strong>de</strong>termine the transfer function of a burner, the usual procedure is to introduce an acoustic wave intothe burner (usually through the inlet) and measure the perturbation of heat release. The phase betwe<strong>en</strong>the incoming unsteady flow rate and the unsteady heat release is an ess<strong>en</strong>tial ingredi<strong>en</strong>t of acousticapproaches for combustor stability [32, 55, 69, 96, 107, 113]. However, the exact numerical procedureto introduce acoustic waves in a computation is a difficult topic and may lead to numerical artefacts[41, 105]. In subsonic compressible LES, each boundary must be specified in terms of mean conditions(velocity or pressure for example) but also in terms of acoustic impedance. Many methods for such
MEASUREMENT METHODS FOR FTF IN LESproblems are based on characteristic methods [48, 107] but must be used with care: the well - known‘non reflecting’ conditions actually impose an impedance (which is oft<strong>en</strong> unknown) and can have astrong influ<strong>en</strong>ce on the results [138]. For a simple laminar flame, Kaufmann et al [61] show that a propermethod to excite a combustion chamber is to pulsate the incoming acoustic wave and not the incominglocal velocity. This procedure is used here and avoids false numerical resonances wh<strong>en</strong> the chamber isforced. The acoustic wave is therefore introduced into the combustion chamber through the inlet. Notethat wh<strong>en</strong> this forcing technique is used, the velocity evolution at the inlet is not fixed anymore and<strong>de</strong>p<strong>en</strong>ds on the combination of the imposed wave (A + ) <strong>en</strong>tering the domain and the one coming back(A − ) from the burner. The inlet velocity and pressure are linked to the acoustic waves at the inlet thoughthe following relation:u ′ = 1 ρc (A + − A − ) (3.1)p ′ = (A + + A − ) (3.2)That means that the inlet velocity fluctuation can only be known before the run if the acoustic wavecoming from the combustor is negligible.Another issue wh<strong>en</strong> forcing such a configuration comes from the amplitu<strong>de</strong> of the waves reflected at thechamber outlet which must remain low in or<strong>de</strong>r to minimise self-excited oscillations. This is done usingthe NSCBC boundary method [86, 105, 107] which allows the control of the acoustic impedances onthe boundaries.3.2 Postprocessing methods for local FTFThis section pres<strong>en</strong>ts four methods related to the id<strong>en</strong>tification of turbul<strong>en</strong>t combustors. These fourmethods are expected to give the local FTF. Table 3.1 summarizes their characteristics. Sections 3.2.1 to3.2.4 pres<strong>en</strong>t their principles.Method Inlet forcing Inlet data Outlet dataTDHF-FFTWN-FFTWN-WHNoneSinglefrequ<strong>en</strong>cyFilteredwhite noiseFilteredwhite noisePositionrefer<strong>en</strong>cepointofMean flamepositionPost processingmethodMeasure flight timeu ′ (t) ˙ωT ′ (x, y, z, t) Fast Fourier Transformu ′ (t) ˙ωT ′ (x, y, z, t) Fast Fourier Transformu ′ (t) ˙ωT ′ (x, y, z, t) Wi<strong>en</strong>er-Hopf inversionAdvantageNo forcedcomputationnee<strong>de</strong>dPreciseFastFastTable 3.1 - Characteristics of methods for system id<strong>en</strong>tification.82
3.2.1 ”Time <strong>de</strong>lay” or ”Flight time” method (TD method).3.2 Postprocessing methods for local FTFThis method only focuses on the <strong>de</strong>termination of the time <strong>de</strong>lay betwe<strong>en</strong> heat release and inlet velocityforcing fluctuations using a steady state CFD result [14]. As explained in the introduction, the <strong>de</strong>laybetwe<strong>en</strong> these two fluctuations is consi<strong>de</strong>red as the main information for the stability of the combustor.This method consists of three main steps:• First a steady state simulation of the configuration is done (using RANS) or the mean field of anunsteady computation is post-processed (using LES or URANS).• The mean position of the flame is extracted from the field of heat release.• Using the stream lines of the mean flow, the convection time betwe<strong>en</strong> the inlet and the flame isid<strong>en</strong>tified as the time at the intersection of these lines with the mean flame position. This provi<strong>de</strong>s aprobability d<strong>en</strong>sity function of the <strong>de</strong>lay betwe<strong>en</strong> heat release and inlet velocity fluctuations. Notethat the probability d<strong>en</strong>sity function is therefore in<strong>de</strong>p<strong>en</strong>d<strong>en</strong>t of the frequ<strong>en</strong>cy: the same <strong>de</strong>lay isused for all frequ<strong>en</strong>cies.This method is not as straigthforward as it seems: infinite time <strong>de</strong>lays can be obtained in recirculatingzones. Moreover, <strong>de</strong>termining the ”age” of flow particules as they move in the combustor oft<strong>en</strong> requiresto add Lagrangian formulations to the co<strong>de</strong> or an additional conservation equation.3.2.2 Harmonic forcing; FFT postprocessed method (HF-FFT method).This method consists in introducing a downstream acoustic wave at a fixed pulsation (ω) as <strong>de</strong>scribed insection 3.1.2. It assumes that the response to a harmonic perturbation of the flow is a harmonic fluctuationof heat release. The local flame transfer function is th<strong>en</strong> obtained through the following relation:F dim (ω) =where F dim compares the local fluctuation of heat release to the fluctuation of refer<strong>en</strong>ce velocity, ˆ˙ ω ′ T isthe Fourier transform of the local heat release fluctuation and û′ is the Fourier transform of the forcedinlet velocity.The method to retrieve the FTF can be <strong>de</strong>scribed as follows.• Harmonically forced Large Eddy Simulations of the configuration are done for a discrete set ofexcitation frequ<strong>en</strong>cies.• 3D fields of heat release fluctuation are extracted as well as the refer<strong>en</strong>ce (usually the inlet) velocityfluctuation.• 3D fields of F dim (ω) are obtained using FFTs of ˙ω ′ T (t) and u′ (t) and constructing F dim (ω)through equation 3.3. F dim (ω) is a local information about the location and the phase of theflame response.83ˆ˙ ω ′ Tû′(3.3)
MEASUREMENT METHODS FOR FTF IN LESThis method requires FFTs of ˙ωT ′ at all points of the combustor during its forced operation. In thepres<strong>en</strong>t work, this is obtained by using typically 100 snapshots with 10 snapshots per period which givesa frequ<strong>en</strong>cy resolution of 1/10th of the forcing frequ<strong>en</strong>cy. Section 4.3 will pres<strong>en</strong>t a comparison betwe<strong>en</strong>the TD, HF-FFT methods and experim<strong>en</strong>tal results. This method is exp<strong>en</strong>sive because it must be repeatedfor a repres<strong>en</strong>tative set of discrete frequ<strong>en</strong>cies (typically 10 to 50), leading to many forced LES.3.2.3 White noise forcing; FFT postprocessed method (WN-FFT method).This method consists in introducing a downstream filtered white noise at the inlet and to obtain the FTFusing one LES only. The local flame transfer function is th<strong>en</strong> obtained through relation 3.3. The methodto retrieve the FTF for the concerned configuration can be <strong>de</strong>scribed as follows.• A filtered white-noise forced Large Eddy Simulation of the configuration is done.• 3D fields of heat release fluctuation are extracted as well as the refer<strong>en</strong>ce (usually the inlet) velocityfluctuation.• 3D fields of F dim (ω) are obtained using equation 3.3 and FFTs of ˙ω ′ T (t) and u′ (t)This method requires FFTs of ˙ωT ′only one forced LES is required.at all points of the combustor but is much faster than HF-FFT because3.2.4 White noise forcing; Wi<strong>en</strong>er-Hopf postprocessed method (WN-WH method).This method using white-noise forcing and the Wi<strong>en</strong>er-Hopf relation inversion was introduced in FTFmeasurem<strong>en</strong>ts by Schuermans et al. [131] and used for real <strong>de</strong>vices by many authors [113, 110, 156,130]. To use this method, the inlet has to be forced with a filtered white-noise including all frequ<strong>en</strong>ciesbetwe<strong>en</strong> 0 and a cut-off frequ<strong>en</strong>cy. This method takes advantage of the Wi<strong>en</strong>er-Hopf equation linkingthe autocorrelation matrix Γ of the inlet signal (inlet velocity), and the cross-correlation vector c :Γh = c (3.4)where h is the impulse response filter (i.e the filter corresponding to the unit response of the system).However, in the pres<strong>en</strong>t work, h corresponds to the white-noise response filter.The method to retrieve the FTF(F dim ) for the concerned configuration can be <strong>de</strong>scribed as follows:• A LES forced with filtered white noise is performed.• The response signal (local heat release) and the refer<strong>en</strong>ce signal (inlet velocity) are stored.• Knowing the white noise inlet velocity signal (s), the autocorrelation matrix Γ can be <strong>de</strong>termined:Γ i,j = 1 MN∑s l−i s l−j for i, j = 0, ..., L. (M=N−L+1) (3.5)l=L84
3.3 Preliminary comparisons of postprocessing methods.• Using the inlet (velocity)(s) and the response (heat release)(r) signals, the cross-correlation vectorcan be obtained :c i = 1 N∑s l−i r l for i = 0, ..., L. (3.6)Ml=Lso that the equation 3.4 can be inverted to obtain h.• Using relation 3.7, the FTF is obtained from the filter h.L∑h k e −iω∆tk = 1 + F dim (ω) (3.7)k=0where F dim is the dim<strong>en</strong>sional FTF giv<strong>en</strong> by the following relation :F dim (ω) =The parameter L is the l<strong>en</strong>gth of the filter and is critical to the validity of this analysis. ∆tL repres<strong>en</strong>tsthe time memory of the filter. It means that the biggest time <strong>de</strong>lay τ max available is <strong>de</strong>termined by thevalue of L (τ max = ∆tL). Att<strong>en</strong>tion has also to be paid not to choose L too big to avoid numericalproblems during the inversion of the Γ matrix since its size varies like L 2 .The greatest advantage of this method is that it gives full three dim<strong>en</strong>sional fields of the amplitu<strong>de</strong> andthe phase response of the flame. It is also able to give the response parameters at all frequ<strong>en</strong>cies betwe<strong>en</strong>0Hz and the cut-off frequ<strong>en</strong>cy. This work will focus on the validation of this method against the singlefrequ<strong>en</strong>cyforcing method (comparison WN-WH/HF-FFT (Section 4.4)).Another interest of the WN-WH method compared to the HF-FFT method is that it can give the FTF atall frequ<strong>en</strong>cies below the cut-off frequ<strong>en</strong>cy with only one LES.ˆ˙ ω ′ Tû′(3.8)3.3 Preliminary comparisons of postprocessing methods.Preliminary comparisons are ma<strong>de</strong> to assess the validity of the post-processing methods for system id<strong>en</strong>tification<strong>de</strong>scribed in Section 3.2. Two main tests are computed :• The first type of id<strong>en</strong>tification procedures is based on FFT of response and refer<strong>en</strong>ce signals. Thesecond type is based on the inversion of the Wi<strong>en</strong>er-Hopf relation. Therefore, in a first test, theinflu<strong>en</strong>ce of the signal properties on the response of the signal post-processing method (FFT/WHinversion) is studied.• Th<strong>en</strong> HF-FFT and WN-WH post-processing methods are compared on the id<strong>en</strong>tification of theadmittance of a diffuser.None of these examples inclu<strong>de</strong> combustion or FTF but they allow the verification of the post-processingmethods.85
MEASUREMENT METHODS FOR FTF IN LES3.3.1 Validation of signal post-processing methods: FFT versus Wi<strong>en</strong>er-Hopf inversion.To test the validity of each signal post-processing method used for the id<strong>en</strong>tification, differ<strong>en</strong>t simpletests cases are done. For all tests, the refer<strong>en</strong>ce signal is s(t) = cos(ωt) with ω = 2πf and f = 100Hz.The total signal is composed of t<strong>en</strong> periods with tw<strong>en</strong>ty points per period except for the second test wherethe number of samples per period is changed. The response signal (mimicking heat release) is alwayscomposed of a signal equal to r(t) = 2.3cos(ω(t − 0.004)) with ω = 2πf and f = 100Hz, except forthe third test where the frequ<strong>en</strong>cy of the response signal is shifted. The goal of this section is thereforeto verify in which cases these methods are able to get the known amplitu<strong>de</strong> of the response (i.e. |F dim | =2.3) and its phase (i.e. Arg(F dim ) = 2πωτ = 2.5133 rad).First test : influ<strong>en</strong>ce of a noisy response signalOther frequ<strong>en</strong>cies are progressively ad<strong>de</strong>d in the response signal to test the capacity of each methodto retrieve the information from a noisier signal. Table 3.2 and 3.3 sum up the differ<strong>en</strong>ts frequ<strong>en</strong>cycompon<strong>en</strong>ts of the response signals. Note that signal 5 is very differ<strong>en</strong>t from the refer<strong>en</strong>ce signal andthat its compon<strong>en</strong>t at 100 Hz is not the most important.Table 3.4 sums up the amplitu<strong>de</strong>s and phases obtained with both methods from the differ<strong>en</strong>t responsesignals. Both methods give good results with an error lower than 5% ev<strong>en</strong> for the signal 5. FFT resultsare better, retrieving the exact amplitu<strong>de</strong> and phase with an error lower than one perc<strong>en</strong>t.Freq.(Hz) Refer<strong>en</strong>ce signal : n, τ Signal 1: n, τ Signal 2: n, τ100 2.3, 4.10 −3 2.3, 4.10 −3 2.3, 4.10 −350 0, 0 0, 0 0, 0180 0, 0 0.03, 2.10 −3 0.4, 2.10 −3300 0, 0 0.02, 1.10 −3 0.05, 1.10 −3500 0, 0 0.01, 5.10 −4 0.2, 5.10 −4Table 3.2 - Composition of the differ<strong>en</strong>t response signals : Part 1Freq.(Hz) Signal 3: n, τ Signal 4: n, τ Signal 5: n, τ100 2.3, 4.10 −3 2.3, 4.10 −3 2.3, 4.10 −350 0, 0 1.5, 2.10 −3 1.5, 2.10 −3180 1.5, 2.10 −3 1.5, 2.10 −3 1.5, 2.10 −3300 0.5, 1.10 −3 0.5, 1.10 −3 0.5, 1.10 −3500 1.0, 5.10 −4 1.0, 5.10 −4 3.0, 5.10 −4Table 3.3 - Composition of the differ<strong>en</strong>t response signals : Part 286
3.3 Preliminary comparisons of postprocessing methods.Signal W-H inversion method: |F dim |, Arg(F dim ) (rad) FFT method : |F dim |, Arg(F dim ) (rad)Refer<strong>en</strong>ce Signal 2.229, 2.508 2.304, 2.508Signal 1 2.3, 2.512 2.304, 2.508Signal 2 2.31, 2.515 2.3, 2.507Signal 3 2.34, 2.521 2.285, 2.504Signal 4 2.229, 2.548 2.295, 2.507Signal 5 2.23, 2.549 2.286, 2.505Table 3.4 - Results : amplitu<strong>de</strong> and phase obtained with both methods. Exact results : |F dim | = 2.3,Arg(F dim ) = 2.5133radSecond test : influ<strong>en</strong>ce of signal samplingFor this test, the discretisation of both source and response signals is lowered progressively from 20points per period to the Shannon criterion limit of two time samples per period. The amplitu<strong>de</strong> of theresponse is still 2.3 and the time <strong>de</strong>lay 4 ms, corresponding to a phase of 2.5133 rad. Table 3.5 sums upthe number of samples per period for all the signals used in this test. This table also show the resultsgiv<strong>en</strong> by both methods for the amplitu<strong>de</strong> and the phase of the response. Table 3.5, Fig.(3.1) a) and b)Refer<strong>en</strong>ce signal Signal 1 Signal 2 Signal 3Sampling (Points/Period) 20 10 4 5FFT : |F dim |, Arg(F dim ) (rad) 2.304, 2.508 2.3, 2.503 2.29, 2.507 2.302, 2.514WH : |F dim |, Arg(F dim ) (rad) 2.229, 2.508 2.3, 2.513 2.288, 2.498 2.289, 2.519Signal 4 Signal 5 Signal 6 Signal 7Sampling (Points/Period) 3 2.5 2.3 2FFT : |F dim |, Arg(F dim ) (rad) 2.354, 2.514 2.397, 2.496 2.404, 2.481 2.373, 2.454WH : |F dim |, Arg(F dim ) (rad) 2.3, 2.513 2.311, 2.522 2.3, 2.513 2.3, 2.513Table 3.5 - Decreasing sampling for source and response signals : results in amplitu<strong>de</strong> and phase. Exact results :|F dim | = 2.3, Arg(F dim ) = 2.5133radshow that both methods give good results ev<strong>en</strong> near or at the Shannon limit. They are robust to the<strong>de</strong>crease of the time sampling. Note that for the Wi<strong>en</strong>er-Hopf inversion method, the size of the filter (Lparameter) has be<strong>en</strong> <strong>de</strong>creased with the time sampling to keep the same time memory of the system (seeSection 3.2). This test shows that these methods can be used ev<strong>en</strong> with poorly discretized signals.Third test : influ<strong>en</strong>ce of a shift of the response frequ<strong>en</strong>cy.For this test, the frequ<strong>en</strong>cy of the response signal is shifted progressively from 100 to 120Hz. Thetotal time of the response signal is kept constant and is equal to 0.1s which corresponds to a frequ<strong>en</strong>cy87
MEASUREMENT METHODS FOR FTF IN LESa) b)Figure 3.1 - a) Amplitu<strong>de</strong> of the FTF versus time sampling of signals (number of points per period)b) Phase (rad) of the FTF versus time sampling of signals (number of points per period):Theory FFT ◦ WH.resolution of 10Hz. Since the refer<strong>en</strong>ce signal frequ<strong>en</strong>cy is 100Hz, the FFT is therefore supposed toconsi<strong>de</strong>r all frequ<strong>en</strong>cies lower than 110Hz as being 100 Hz for the resulting amplitu<strong>de</strong> and phase. Forfrequ<strong>en</strong>cies very differ<strong>en</strong>t from 100 Hz , the amplitu<strong>de</strong> and phase should <strong>de</strong>crease to 0 for both methods.Table 3.6 gives the frequ<strong>en</strong>cies of all the response signals consi<strong>de</strong>red. It compares the results obtainedwith both methods in amplitu<strong>de</strong> and phase. Fig.(3.2) shows that both methods show a selectivity of aboutRefer<strong>en</strong>ce signal Signal 1 Signal 2 Signal 3Frequ<strong>en</strong>cy (Hz) 100 101 103 107FFT 2.304, 2.508 2.27, 2.224 1.968, 1.654 0.87, 0.463WH 2.229, 2.508 2.26, 2.195 2.02, 1.545 1.105, 0.252Signal 4 Signal 5Frequ<strong>en</strong>cy (Hz) 110 120FFT 0.022, 6.118 0.023, 6.126WH 0.25, 5.627 0.233, 5.587Table 3.6 - Increasing frequ<strong>en</strong>cy of the response signal : results in amplitu<strong>de</strong> and phase. Exact results :|F dim | = 2.3, Arg(F dim ) = 2.5133rad3Hz with an error lower than 10%. The residual amplitu<strong>de</strong> at 120Hz is 1% of the signal amplitu<strong>de</strong> forthe Fourier coeffici<strong>en</strong>t method and 10% for the wi<strong>en</strong>er-Hopf inversion method. This test shows that theFourier method has a better selectivity than the Wi<strong>en</strong>er-Hopf method. This means that for real signals,close frequ<strong>en</strong>cies might pollute each other for short signals wh<strong>en</strong> the post-processing uses the Wi<strong>en</strong>er-Hopf inversion relation.88
3.3 Preliminary comparisons of postprocessing methods.Figure 3.2 - Amplitu<strong>de</strong> of the FTF versus frequ<strong>en</strong>cy of the response signal : Exact FFT ◦ WH.3.3.2 Admittance of a diffuser : HF-FFT versus WN-WH methods.This section pres<strong>en</strong>ts a preliminary validation of the WN-WH and HF-FFT methods against the theoryfor the calculation of the admittance at the outlet of a subsonic diffuser. The admittance of a diffuser iscomputed using AVBP and forcing the outlet section (Fig.3.3). Results are post-processed using eitherHF-FFT or WN-WH. Ev<strong>en</strong> though this example is not a flame yet, it corresponds to an important issuein combustion instability studies : the measurem<strong>en</strong>t of impedance of diffusers and distributors. And forthis example like for FTF computation, post-processing methods are crucial so that this case constitutesa good accuracy check of the post-processing HF-FFT and WN-WH techniques. An other advantage ofthis case is that a theoretical solution is available : here, the theoretical admittance can be evaluated withNOZZLE, a co<strong>de</strong> which solves the analytical relations of Marble and Can<strong>de</strong>l [81]. Computations havebe<strong>en</strong> done by M. Myrczik [89] during an internship at CERFACS. NOZZLE is a software writt<strong>en</strong> byLamarque [71]. It provi<strong>de</strong>s the impedance of the diffuser. The mesh used for this comparison is shownin figure 3.3. Table 3.7 pres<strong>en</strong>ts the geometry, mesh and boundary conditions of the diffuser.Figure 3.3 - Mesh of the diffuserMean flowThe validation starts by making sure that NOZZLE provi<strong>de</strong>s the same values for the steady flow asthe LES co<strong>de</strong> AVBP. In or<strong>de</strong>r to be able to compare the results obtained by AVBP and NOZZLE, itis important to remind that NOZZLE uses a quasi-1D mo<strong>de</strong>l in contrast to AVBP (2D). Therefore, thevalues provi<strong>de</strong>d by the stabilized AVBP calculation are averaged for each section (here: averaging along89
MEASUREMENT METHODS FOR FTF IN LESGeometry Value Boundary conditions ValuesL x (m) 0,2 u in ( m s ) 30L y (m) 0,015 p in (bar) 0,9292059n x 101 ρ in ( kg ) 1,07478m 3n y 11 T in (K) 300,0γ 1,399 r (J.kg/K) 288,19In AVBP the walls are assumed to be adiabatic with zero normal velocityTable 3.7 - Characteristics of the diffuser and boundary conditionsy) to finally compare them to the values obtained with NOZZLE. Note that the boundary conditions intable 3.7 are imposed on the averaged values, which are th<strong>en</strong> fed to the NOZZLE co<strong>de</strong>.Figure 3.4 pres<strong>en</strong>ts the compared mean flow. The values obtained with NOZZLE coinci<strong>de</strong> very well withAVBP.Figure 3.4 - Comparison betwe<strong>en</strong> AVBP/NOZZLE for the mean flow in diffuser.90
3.3 Preliminary comparisons of postprocessing methods.Admittance calculationAs shown in the previous section, the mean flows in AVBP and NOZZLE are the same. This sectionpres<strong>en</strong>ts now the calculation of admittance with three methods:• NOZZLE which is based on an analytical mo<strong>de</strong>l.• LES computations with AVBP using the HF-FFT method.• LES computations with AVBP using the WN-WH method.Figure 3.5 shows how the comparisons proceed. A major question for this calculation is which boundaryFigure 3.5 - Procedure for the comparison of post-processing techniques.condition to select at the <strong>en</strong>trance of the diffuser. If the diffuser was choked, the admittance would not<strong>de</strong>p<strong>en</strong>d on the compressor elem<strong>en</strong>ts located upstream of the choked section. Unfortunately, most diffusersare not choked and computing the diffuser outlet admittance requires to know its inlet admittance.Here, in a first step, one assumes a zero acoustic velocity at the <strong>en</strong>trance.91
MEASUREMENT METHODS FOR FTF IN LESThus, several calculations have be<strong>en</strong> performed with the HF-FFT method. Every calculation startsfrom the initial solution <strong>de</strong>scribed in section 3.3.2.An upstream acoustic wave A − e −iωt = ip 0 e −iωt is injected at t = 0 in the exit plane. Once the flow isestablished (after a few acoustic times), the admittance calculation can be done using u ′ and p ′ in theexit plane at the forcing frequ<strong>en</strong>cy. 18 frequ<strong>en</strong>cies from 0 to 3000 Hz are used for the HF-FFT method.For the WN-WH method a low-pass-filtered white-noise (0 < f < 4000Hz) is injected at the outletof the domain. One computation of 50 ms is done in or<strong>de</strong>r to match a frequ<strong>en</strong>cy resolution of 20Hz.In this case, the WN-WH method is approximately 10 times faster than the HF-FFT method because itrequires only one unsteady computation instead of 18.Fig.(3.6) shows the comparison betwe<strong>en</strong> the three methods (WN-WH/ HF-FFT/ NOZZLE). Resultsobtained with the HF-FFT method match very well the results obtained with NOZZLE. With the WN-WH method, one finds the peaks around the same frequ<strong>en</strong>cies, with a phase shift for higher ones. Inaddition, betwe<strong>en</strong> 1000 and ∼ 1200 Hz, the results of WN-WH <strong>de</strong>viate significantly from the analyticalsolution.Figure 3.6 - Comparison WN-WH/HF-FFT/NOZZLE for the diffuser (real and imaginary part of admittance). Thesolution obtained by NOZZLE is the refer<strong>en</strong>ce solution.As m<strong>en</strong>tioned before in section 3.2.4, the quality of results obtained with the WN-WH method,<strong>de</strong>p<strong>en</strong>ds on the filter size L used for the Wi<strong>en</strong>er-Hopf signal id<strong>en</strong>tification method. The influ<strong>en</strong>ce of thediffer<strong>en</strong>t L (190, 170, 130) is examined. Fig.(3.7) shows that the values obtained with L = 130 differthe most from the NOZZLE solutions. The filter appears to be too small and h<strong>en</strong>ce triggers only small<strong>de</strong>lay times.L = 170 and L = 190 seem to be appropriate quantities. As shown on Fig. 3.7, it is not obvious whichis the best one; because for one range of frequ<strong>en</strong>cy L = 170 gives better results, but for another rangeL = 190 fits better.92
3.3 Preliminary comparisons of postprocessing methods.The overall conclusion is that WN-WH methods are faster than HF-FFT methods but they will alsorequire more care.93
MEASUREMENT METHODS FOR FTF IN LESFigure 3.7 - Comparison of three WN-WH results for L= 190, 170 and 130 for the diffuser (Top: Real part ofadmittance; Bottom: Imaginary part of admittance)94
Chapter 4Transfer functions of flamesResults pres<strong>en</strong>ted in this chapter have be<strong>en</strong> obtained in four configurations (see Fig.(4.1)):• Configuration A : a laminar planar premixed flame (1D)• Configuration B : a laminar conical flame (2D axi-symmetric)• Configuration C : a turbul<strong>en</strong>t gas turbine burner installed in a round combustion chamber at EBIKarsruhe [14] (3D)• Configuration D : a turbul<strong>en</strong>t gas turbine burner installed in a sector of an annular gas turbine,repres<strong>en</strong>tative of a real machine (3D)The 4 methods pres<strong>en</strong>ted in chapter 3.2 will be applied to some or all of these set-ups:• Time Delay or Flight Time (TD) method• Harmonically forced ; FFT post-processed (HF-FFT) method• White Noise forced ; Wi<strong>en</strong>er-Hopf post-processed (WN-WH) method• White Noise forced ; FFT Post-processed (WN-FFT) methodTable 4.1 summarizes the differ<strong>en</strong>t tests which were performed. In most cases, two methods were usedto allow comparisons. The pres<strong>en</strong>tation is organized by experim<strong>en</strong>tal set-ups. For each case, the configurationis <strong>de</strong>scribed first and results on FTF follow.
TRANSFER FUNCTIONS OF FLAMESFigure 4.1 - Configurations used for FTF tests.Method TD HF-FFT WN-WH WN-FFTConfiguration A XConfiguration B X X XConfiguration C X XConfiguration D X X XTable 4.1 - Summary of methods and configurations.96
4.1 Configuration A : laminar planar premixed flame (1D)4.1 Configuration A : laminar planar premixed flame (1D)4.1.1 DescriptionThe goal of this section is to <strong>de</strong>termine the main features of the 1D flame response to an incomingacoustic fluctuation in terms of amplitu<strong>de</strong> and time <strong>de</strong>lays. A 1D flame is forced with an incomingacoustic wave at 200Hz with an amplitu<strong>de</strong> of 0.5m.s −1 . The refer<strong>en</strong>ce point for velocity is the domaininlet so that the distance betwe<strong>en</strong> this point and the mean flame front is 1mm. The mean inlet velocity isequal to the laminar flame speed so that the flame is stable wh<strong>en</strong> there is no forcing. The structured meshis composed of 1000 quadrilateral elem<strong>en</strong>ts and 2002 no<strong>de</strong>s. Its dim<strong>en</strong>sions are 2.10 −2 m × 2.10 −9 m.Figure 4.2 sums up the numerical experim<strong>en</strong>t and shows the location of three sample points A, B andC. The flame width is 0.5mm and the pulsated flame ”ext<strong>en</strong>sion” (the zone over which the flame movesduring forcing) is 1mm.Figure 4.2 - numeric experim<strong>en</strong>tal setup.Signals of heat release are collected along a line crossing the flame. Figure 4.3 gives the heat releasesignals at points A, B and C (normalized by the maximum value) as well as the refer<strong>en</strong>ce inlet velocity.It is interesting to note that signals of heat release are not harmonic because the pulsated flame ext<strong>en</strong>sionis greater than the flame width. This particular feature will be <strong>en</strong>countered in 3D turbul<strong>en</strong>t configurationssince the pulsated velocity amplitu<strong>de</strong> at the flame front will be ev<strong>en</strong> higher than the pres<strong>en</strong>t value.Only the HF-FFT post-processing technique is applied to the instantaneous signals of velocity and heatrelease collected along the line crossing the flame to <strong>de</strong>termine the g<strong>en</strong>eral behavior of the local responseof the flame.4.1.2 Amplitu<strong>de</strong>Figure 4.3 shows that the maximum instantaneous heat release is the same for all three points. But theamplitu<strong>de</strong> of the response (|F norm2 | <strong>de</strong>fined in Eq.(2.21)) differs betwe<strong>en</strong> A and B and C, as pres<strong>en</strong>ted on97
TRANSFER FUNCTIONS OF FLAMESFigure 4.3 - a) Signals of heat release at points A, B and C. b) Refer<strong>en</strong>ce velocity signaltable 4.2. The response at point C which is in the mean flame is almost negligible because the frequ<strong>en</strong>cyof the heat release fluctuating signal at that point is not 200Hz. Actually, the flame passes exactly twice atthat location during a period, so that the response at the mean flame position is mainly at 400Hz. The 200Hz compon<strong>en</strong>t increases as one approaches from the maximum ext<strong>en</strong>sion position of the forced flamefront as shown on figure 4.4.Point A Point B Point CNormalized response amplitu<strong>de</strong> 0.462 0.555 0.068Table 4.2 - Normalized amplitu<strong>de</strong> of the response at points A, B and C (HF-FFT)4.1.3 Time <strong>de</strong>layAt points A and B, the flame has almost the same amplitu<strong>de</strong> of response, but very differ<strong>en</strong>t time <strong>de</strong>lays.Point B is closer to the forced inlet. One therefore expects that the time <strong>de</strong>lay at that point will be smaller.It is not the case and table 4.3 sums up the time <strong>de</strong>lays for points A and B . Point A has the lowest time<strong>de</strong>lay, and since this point is farer than B from the inlet, it is interesting to explain this result.In the pres<strong>en</strong>t case, the pulsated flame zone is compact wh<strong>en</strong> compared to the acoustic wavel<strong>en</strong>gth which98
4.1 Configuration A : laminar planar premixed flame (1D)Figure 4.4 - Normalized amplitu<strong>de</strong> of the response (|F norm2 |) along the axial line.is 1.7m long. Therefore, the velocity fluctuation at point C (which is at the mean flame position) isalmost in phase with the inlet velocity. Wh<strong>en</strong> the velocity at the inlet increases, it pushes the flame fromC to A. The flame first reaches that point before the inlet velocity <strong>de</strong>creases and comes back to C. Aftermore than half a period, the flame reaches B. In this case the flame mean position therefore separatestwo differ<strong>en</strong>ts zones of time <strong>de</strong>lays with a discontinuity of half the time period. Figure 4.5 repres<strong>en</strong>ts thevalues of time <strong>de</strong>lays along the axial line crossing the mean flame position. This type of behavior willalso be observed in 3D cases where time <strong>de</strong>lays exhibit abrupt changes at the mean flame position.Point A Point BTime <strong>de</strong>lay (ms) 1.228 3.761Table 4.3 - Time <strong>de</strong>lays at points A, B99
TRANSFER FUNCTIONS OF FLAMESFigure 4.5 - Time <strong>de</strong>lay (ms) of the flame response along the axial line.100
4.2 Configuration B : laminar V flame (2D axi-symmetric)4.2 Configuration B : laminar V flame (2D axi-symmetric)This configuration has be<strong>en</strong> ext<strong>en</strong>sively studied experim<strong>en</strong>tally by Le Helley [52] and numerically byKaufmann [61] and Truffin [149]. This burner corresponds to a laminar flame. The structured meshused for this study is axisymmetric and takes into account for a large part of the feeding line for acousticreasons (see Figure 4.6). It consists of 19189 no<strong>de</strong>s and 9318 quadrilateral elem<strong>en</strong>ts.Figure 4.6 - Laminar configuration B. Le Helley [52]This configuration is used here to compare FTF obtained using either HF-FFT, WN-FFT and WN-WHmethods (see section 4.2.1). The configuration is forced at five frequ<strong>en</strong>cies betwe<strong>en</strong> 100 and 500 Hz.4.2.1 Comparison of global FTF (F norm )Computations have be<strong>en</strong> ma<strong>de</strong> at CERFACS by Patrick Schmitt and post-processing has be<strong>en</strong> doneby the thermodynamic group at Munich University. Only a global comparison will be ma<strong>de</strong> for thisconfiguration.Amplitu<strong>de</strong>Figures 4.7 pres<strong>en</strong>ts the amplitu<strong>de</strong>s of the FTF (|F norm |) obtained with HF-FFT, WN-FFT and WN-WHmethods. The three methods reasonably agree for all frequ<strong>en</strong>cies. Yet, HF-FFT and WN-WH methodmatch very well and the WN-FFT method gives a noisy response which shows un<strong>de</strong>sired peaks. Notethat all methods give values of |F norm | above unity for all frequ<strong>en</strong>cies. This means that the relativefluctuation of the integrated heat release is bigger than the relative fluctuation of inlet velocity. Forexample, if the amplitu<strong>de</strong> of the fluctuation of the inlet velocity repres<strong>en</strong>ts 10% of the average inletvelocity, the fluctuation of the total heat release in the system repres<strong>en</strong>ts 11% of the mean power releasedby the flame at 100Hz and 16% at 400Hz.Using Eqs.(2.10) and (2.20), the amplitu<strong>de</strong> |F | of the normalized FTF at 100Hz can also be estimated.It is equal to 8.02. This value can be compared to the asymptotic value giv<strong>en</strong> by Eq.(2.13). With a meantemperature of 2387K in burnt gases and a temperature of 300K at the inlet, the asymptotic value of theinteraction in<strong>de</strong>x for low frequ<strong>en</strong>cies is equal to 6.96. The value for |F | at 100Hz therefore overestimates101
TRANSFER FUNCTIONS OF FLAMESby 15% this theoretical amplitu<strong>de</strong>.Note that in this case, the amplitu<strong>de</strong> response is not <strong>de</strong>p<strong>en</strong>dant of the filter size for the Wi<strong>en</strong>er-Hopfinversion and the black curve repres<strong>en</strong>ts the mean response for L parameter varying from 20 to 40.Figure 4.7 - Amplitu<strong>de</strong> of FTF : ◦ HF-FFT WN-FFT WN-WH.PhaseFigure 4.8 compares the times <strong>de</strong>lays (Arg(F norm )/(2πω)) obtained with the three differ<strong>en</strong>t methods.It shows that HF-FFT and WN-WH methods give almost the same time <strong>de</strong>lay for all frequ<strong>en</strong>cies. TheWN-FFT method gives strongly varying results at least for frequ<strong>en</strong>cies lower than 200 Hz.It is interesting to note that for all methods the global time <strong>de</strong>lay of the FTF is not constant over thefrequ<strong>en</strong>cy range for this configuration. This implies that the heat release fluctuation can not be due onlyto a pure convective ph<strong>en</strong>om<strong>en</strong>on. With values for the time <strong>de</strong>lay varying from 0.05 ms to 0.3 ms, theheat release signal goes from an almost ”in phase” fluctuation to a phase of more than π/4.102
4.2 Configuration B : laminar V flame (2D axi-symmetric)Figure 4.8 - Time <strong>de</strong>lay of FTF : ◦ HF-FFT WN-FFT WN-WH.103
TRANSFER FUNCTIONS OF FLAMES4.3 Configuration C : turbul<strong>en</strong>t burner in cylindrical chamber (3D)The burner used for this study is a modified version of a Siem<strong>en</strong>s hybrid burner used here at atmosphericpressure (maximum power = 400 kW). The burner (Fig. 4.9) is mounted on a cylindrical combustionchamber (Fig. 4.10). The non-reacting and reacting flows (Fig. 4.11) for this burner installed ina slightly differ<strong>en</strong>t combustion chamber have be<strong>en</strong> computed in previous studies and successfully comparedto experim<strong>en</strong>ts in terms of axial and tang<strong>en</strong>tial velocities (mean and RMS) and mean temperaturefields [137, 138]. The mesh used in this study contains 311047 no<strong>de</strong>s and 1777730 elem<strong>en</strong>ts.This configuration is used in the pres<strong>en</strong>t work to compare time <strong>de</strong>lays obtained with the TD and HF-FFTmethods.Figure 4.9 - Burner geometry.This section pres<strong>en</strong>ts a comparison of time <strong>de</strong>lay of turbul<strong>en</strong>t FTFs obtained with TD and HF-FFTmethods. Both results are successfully compared with experim<strong>en</strong>tal results in terms of time <strong>de</strong>lay. Thissection mainly shows that the TD method fails to predict the global <strong>de</strong>lay betwe<strong>en</strong> heat release andforcing velocity fluctuations. Besi<strong>de</strong>s, it also shows that the response of the turbul<strong>en</strong>t flame is highly nonhomog<strong>en</strong>eous and the HF-FFT method gives access to the spatial variations of the turbul<strong>en</strong>t FTF bothfor the amplitu<strong>de</strong> and phase. It therefore indicates locations where the flame responds the most to theincoming acoustic wave <strong>de</strong>p<strong>en</strong>ding on its frequ<strong>en</strong>cy.This section follows almost exactly the paper published in Journal of Turbul<strong>en</strong>ce, 6(21):1-20, 2005.104
4.3 Configuration C : turbul<strong>en</strong>t burner in cylindrical chamber (3D)Figure 4.10 - Burner mounted on a circular combustion chamberFigure 4.11 - Iso-surface of heat release colored by axial velocity.105
TRANSFER FUNCTIONS OF FLAMES4.3.1 IntroductionBeing able to predict the forced response of a combustion <strong>de</strong>vice is a mandatory step to <strong>de</strong>sign ‘stable’burners, which exhibit as little s<strong>en</strong>sitivity to acoustic waves as possible. In<strong>de</strong>ed, flame acoustic couplingis a ph<strong>en</strong>om<strong>en</strong>on which is found in multiple combustors[155, 114, 138, 133]: it creates a consi<strong>de</strong>rableindustrial risk if it cannot be avoi<strong>de</strong>d at the <strong>de</strong>sign stage. However, predicting flame / acoustics couplingis still a chall<strong>en</strong>ge [65, 93, 150]. Only sophisticated numerical methods can be used to characteriseburner responses in real geometries while at the <strong>de</strong>sign stage. LES (Large Eddy Simulations) is nowthe most precise numerical tool for turbul<strong>en</strong>t flames as shown by numerous rec<strong>en</strong>t examples [138, 34,57]. However, the validation of LES as a tool to study acoustics / flame coupling is far from complete.Few comparisons including experim<strong>en</strong>ts and simulations can be found in the literature on LES of flametransfer functions in complex configurations. The main reason for this, is that flame / acoustics studiesrequire the computation of turbul<strong>en</strong>t combustion (something that LES can do reasonably well) but alsoof acoustics. Ev<strong>en</strong> in co<strong>de</strong>s <strong>de</strong>dicated to acoustics in flames where turbul<strong>en</strong>t combustion mo<strong>de</strong>lling isextremely simplified, the prediction of flame responses to acoustic perturbations is a difficult topic [114,65, 30, 15, 17, 107]. Therefore coupling such acoustic analysis with state-of-the-art LES is still an op<strong>en</strong>field of investigation and one objective of this study is to investigate this issue.This study shows how experim<strong>en</strong>ts and Large Eddy Simulations (LES) can be used in realistic geometriesto provi<strong>de</strong> one parameter controlling flame stability: the flame response to acoustic waves <strong>en</strong>tering theburner. This response is an ess<strong>en</strong>tial ingredi<strong>en</strong>t of most acoustic tools for flame / acoustics co<strong>de</strong>s. It ischaracterised through the transfer function betwe<strong>en</strong> unsteady heat release in the chamber and oscillatinginlet velocity. Using simultaneously LES and experim<strong>en</strong>ts also allows an investigation of the variouscoher<strong>en</strong>t structures found in swirling combustors [56]:• It is well known [50, 10] that non-reacting swirled flows exhibit strong hydrodynamic mo<strong>de</strong>s calledPVC (Precessing Vortex Core). These spiral mo<strong>de</strong>s induce a rotation of the swirl motion axis andhave oft<strong>en</strong> be<strong>en</strong> suspected of g<strong>en</strong>erating instabilities wh<strong>en</strong> combustion is activated ev<strong>en</strong> thoughcertain rec<strong>en</strong>t LES [138] actually suggest that the PVCs are sometimes damped wh<strong>en</strong> combustionstarts.• Wh<strong>en</strong> a combustor (swirled or not) <strong>en</strong>ters a self-excited mo<strong>de</strong> or wh<strong>en</strong> it is forced at large amplitu<strong>de</strong>s,another vortical structure appears: it has a mushroom shape in two-dim<strong>en</strong>sional burners[106] and a ring shape in swirled axisymmetric burners [15]. This structure is typical of impulsivelystarting jets and appears only at suffici<strong>en</strong>tly large amplitu<strong>de</strong>s of the velocity fluctuations.Determining wh<strong>en</strong> these structures are found in real combustors and what their impact can be, is still anop<strong>en</strong> field of investigation which can be addressed with LES and advanced experim<strong>en</strong>tal diagnostics asproposed here. For the pres<strong>en</strong>t study, the target configuration is a large-scale industrial turbine burner(400 kW) to be as repres<strong>en</strong>tative as possible of real combustion <strong>de</strong>vices. This partially premixed systemwas studied both experim<strong>en</strong>tally (at Univ. Karlsruhe) and numerically (at CERFACS).The experim<strong>en</strong>talconfiguration is <strong>de</strong>scribed in Section 4.3.2. The LES tools and the numerical methodology used tointroduce acoustic waves through boundaries are th<strong>en</strong> pres<strong>en</strong>ted (Sections 4.3.3, 4.3.4) before <strong>de</strong>scribingresults in terms of mean flow (Section 4.3.5, 4.3.6). The coher<strong>en</strong>t structures appearing during forcingare discussed in Section 4.3.7 while a comparison of LES and experim<strong>en</strong>tal data is performed in Section106
4.3 Configuration C : turbul<strong>en</strong>t burner in cylindrical chamber (3D)4.3.8 in terms of phase betwe<strong>en</strong> inlet velocity and global heat release. Finally, a local analysis of flameresponse is <strong>de</strong>scribed in Section 4.3.9 to compare LES results with other estimates of combustion phasesused in Reynolds Averaged (RANS) co<strong>de</strong>s [65] which are based on a measurem<strong>en</strong>t of ’flight times’ alongfluid trajectories betwe<strong>en</strong> burner inlet and combustion zone.4.3.2 A double-swirler partially premixed burnerThe burner used for this study is a modified version of a single Siem<strong>en</strong>s hybrid burner used here atatmospheric pressure (maximum power = 400 kW). This burner (Fig. 4.9) is mounted on a cylindricalcombustion chamber (Fig. 4.10). The configuration used for experim<strong>en</strong>ts is <strong>de</strong>scribed on Fig. 4.12. Fullypremixed methane / air is injected through two coaxial swirlers (diagonal and axial) at an equival<strong>en</strong>ceratio of 0.8 for the axial and 0.5 for the diagonal swirler. The flow rates injected in the combustionchamber are respectively 0.018kg.s −1 for the axial and 0.162kg.s −1 for the diagonal swirler. The pulsatingunit is a rotating valve modulating the diagonal mass flow rate up to amplitu<strong>de</strong>s of 30 perc<strong>en</strong>t. Theunsteady velocity induced by forcing is measured using a hot wire probe located in the diagonal swirler(Fig. 4.12) while the global unsteady heat release is evaluated through a measurem<strong>en</strong>t of the OH* radical.Since 90% of the injected mixture is at a constant equival<strong>en</strong>ce ratio, the OH* signal can be reliablylinked to the unsteady heat release [79]. Figure 4.13 displays phase-locked OH* images obtained usingan ICCD camera and an appropriate OH* filter (λ = 307.8nm). Typical flame shapes are observedwithout forcing or with low-frequ<strong>en</strong>cy forcing (left), and with high-frequ<strong>en</strong>cy forcing (right). The flameis quasi-steady as long as the frequ<strong>en</strong>cy of the excitation remains below 50Hz. Beyond this limit, ringvortices interact with the flame imposing their axis-symmetrical shape to the flame.4.3.3 Large Eddy Simulations for gas turbinesRec<strong>en</strong>t studies [138, 3, 19, 29, 102, 124, 117] have shown that Large Eddy Simulations (LES) are powerfultools to study the dynamics of turbul<strong>en</strong>t flames and especially their response to acoustic forcing.However, the ext<strong>en</strong>sion of LES methods to complex geometries creates new problems to adapt highprecisionnumerical techniques (required for LES) to arbitrarily complex meshes. Here a parallel LESsolver called AVBP (see www.cerfacs.fr/cfd/) is used to solve the full compressible Navier Stockes equationson hybrid (structured and unstructured) grids with second or third-or<strong>de</strong>r spatial and temporal accuracy[29]. Subgrid stresses are <strong>de</strong>scribed by the WALE mo<strong>de</strong>l [92]. The subgrid flame / turbul<strong>en</strong>ceinteraction is mo<strong>de</strong>lled by the Thick<strong>en</strong>ed Flame (TF) mo<strong>de</strong>l [3, 28]. The validity of the TF mo<strong>de</strong>l usedhere has be<strong>en</strong> checked in many rec<strong>en</strong>t papers [138, 121] and will not be discussed here. For the pres<strong>en</strong>tapplication, methane / air combustion is mo<strong>de</strong>lled using six species (CH 4 ,O 2 , CO 2 , CO, H 2 O and N 2 )107
TRANSFER FUNCTIONS OF FLAMESFigure 4.12 - Experim<strong>en</strong>tal setup.quasi-steady flamering vorticesFigure 4.13 - Instantaneous Phase-locked OH* images of the flame structure.108
4.3 Configuration C : turbul<strong>en</strong>t burner in cylindrical chamber (3D)and two reactions [137]. These reactions are :The forward rate of the first irreversible reaction is:and the rate of the second reaction is:CH 4 + 3/2O 2 => CO + 2H 2 O (4.1)CO + 1/2O 2 CO 2 (4.2)q 1 = AY 0.9CH 4Y 1.1O 2exp(−T 1 a /T )q 2 = B[Y CO Y 0.5O 2− (1/K y ) Y CO2 ] exp(−T 2 a /T )where A = 6.1.10 8 mol.m −3 .s −1 , B = 6.1.10 5 mol.m −3 .s −1 , T 1 a = 17613 K, T 2 a = 6038 K andK y (T ) is the equilibrium constant of reaction (2).The mesh used for the burner of this study contains 1.7 million elem<strong>en</strong>ts. The characteristic size of themesh in the combustion chamber is 3mm which has to compared to the laminar flame thickness (1.5mm).The simulations were achieved in ’C<strong>en</strong>tre Informatique <strong>National</strong> <strong>de</strong> l’Enseignem<strong>en</strong>t Superieur’ (CINES)and the average computing time nee<strong>de</strong>d is around 10 hours on 64 processors on SGI 03800 for one periodat the forcing frequ<strong>en</strong>cy of 120Hz.4.3.4 Introducing acoustic waves through the burner inletTo <strong>de</strong>termine the transfer function of a burner, the usual procedure is to introduce an acoustic waveinto the burner (usually through the inlet) and measure the perturbation of heat release. The phasebetwe<strong>en</strong> the incoming unsteady flow rate and the unsteady heat release is an ess<strong>en</strong>tial ingredi<strong>en</strong>t ofacoustic approaches for combustor stability [107, 32, 55, 69, 96, 113]. Experim<strong>en</strong>tally, this is usuallydone with loudspeakers forcing the flow upstream or downstream of the combustion chamber. At highchamber powers, however, rotating valves are required as done here. Because of the cost of such <strong>de</strong>vicesand the danger of pulsating large flow rates of premixed gases, performing the same task with LES isan obvious alternative path. However, the exact numerical procedure to introduce acoustic waves in acomputation is a difficult topic and may lead to numerical artefacts [105, 41]. In subsonic compressibleLES, each boundary must be specified in terms of mean conditions (velocity or pressure for example)but also in terms of acoustic impedance. Many methods for such problems are based on characteristicmethods [107, 48] but must be used with care: the well - known ‘non reflecting’ conditions actuallyimpose an impedance (which is oft<strong>en</strong> unknown) and can have a strong influ<strong>en</strong>ce on the results [138]. Fora simple laminar flame, Kaufmann et al [62] show that a proper method to excite a combustion chamber isto pulsate the incoming acoustic wave and not the local velocity. This procedure is used here and avoidsfalse numerical resonances wh<strong>en</strong> the chamber is forced. Another issue wh<strong>en</strong> forcing such a configurationcomes from the amplitu<strong>de</strong> of the waves reflected at the chamber outlet which must remain low in or<strong>de</strong>rto minimise self-excited oscillations. This is done using the NSCBC boundary method [107, 105, 86]which allows the control of the acoustic impedances on the boundaries.109
TRANSFER FUNCTIONS OF FLAMES4.3.5 Reacting steady flowSince the focus of this section is the forced response of the burner, no experim<strong>en</strong>tal results will be provi<strong>de</strong>dfor the unforced case. The non-reacting and reacting flow for this burner installed in a slightly differ<strong>en</strong>tcombustion chamber have be<strong>en</strong> computed in previous studies and successfully compared to experim<strong>en</strong>tsin terms of axial and tang<strong>en</strong>tial velocities (mean and RMS) and mean temperature fields [138, 137]this validation is not repeated here.The reacting case corresponds to a global equival<strong>en</strong>ce ratio of 0.51, air flow rate of 180 g/s, a Reynoldsnumber of 120000 (based on bulk velocity and burner diameter) and power of 277 kW. A 2D snapshotof the axial velocity field (Fig. 4.14) shows a strongly turbul<strong>en</strong>t flow. The swirled motion creates a largerecirculation zone in the c<strong>en</strong>tre of the combustion chamber and a circular outer recirculation zone (whichappears as two separates zones on the 2D axial cut). An iso-line of temperature (1100K) reveals the flameposition close to the burner mouth, stabilised both on the inner recirculation zone created by swirl and onthe outer recirculation zone. A temperature isosurface at 1000 K (Fig. 4.15) in an unsteady non-pulsatedcase shows the typical flame shape: the edges of the flame are disturbed but the c<strong>en</strong>tral zone, near theaxial inlet, is very stable due to the injection of richer premixed gases (equival<strong>en</strong>ce ratio of 0.8) throughthe axial swirler.Figure 4.14 - Example of instantaneous field of axial velocity in the axial plane,(1100K). Unforced flow.iso-line of temperature110
4.3 Configuration C : turbul<strong>en</strong>t burner in cylindrical chamber (3D)Figure 4.15 - Snapshot of temperature isosurface (1000 K) coloured by axial velocity. Unforced flow.111
TRANSFER FUNCTIONS OF FLAMES4.3.6 Forced reacting flowIn the experim<strong>en</strong>t, the combustor was forced at frequ<strong>en</strong>cies changing from 10 to 120 Hz while the LESwere performed at 80, 120 and 250 Hz. 1The inlet forcing immediately drives a heat release oscillation. Figure 4.16 compares evolutions ofheat release, diagonal inlet velocity and total mass of fuel in the chamber for the 120Hz case. Theinlet velocity (circles) and the <strong>en</strong>closed fuel mass (<strong>de</strong>ltas) oscillate sinusoidally, perfectly correlatedto the inlet acoustic pulsation. Heat release exhibits more nonlinearities, especially betwe<strong>en</strong> instants”φ = 0” and ”φ = π/2”. The fast <strong>de</strong>creasing of the heat release occurs wh<strong>en</strong> the fresh gases previouslyinjected burn out. This ”main ev<strong>en</strong>t” during the cycle of excitation has be<strong>en</strong> observed experim<strong>en</strong>tallyfor pulsated and self-excited combustors at the origins of the study of combustion instability. mettre<strong>de</strong>s refs. The flame shape (visualised by an isosurface of temperature) is displayed for four phases ofthe cycle (Fig. 4.17) (φ = 0, π/2, π, 3π/2). The phase φ = 0 corresponds to the minimum valueof the axial velocity whereas φ = π corresponds to the maximum value of the axial velocity. Theflame surface varies through the cycle and exhibits various complex structures especially at φ = 3π/2(Fig. 4.17d) where the ring vortex dislocates into smaller structures. The total heat release oscillatesfrom 0.7 to 1.3 times its steady value (Fig. 4.16) at π of the inlet velocity. The flame goes through phasesof rapid expansion (betwe<strong>en</strong> instants ”φ = π” and ”φ = 3π/2” on Fig 4.17 for example) during whichring vortices created by the forcing distort the flame front and expand it. Later in the cycle, the flameshrinks very fast (betwe<strong>en</strong> instants ”φ = 0” and ”φ = π/2” on fig 4.17) as already pointed out on fig 4.16.4.3.7 Coher<strong>en</strong>t structuresLES reveals that two coher<strong>en</strong>t structures <strong>de</strong>termine the flame shape and the structure of the flow duringforcing. Figure 4.18 displays the classical ring vortex structure observed in this configuration. Thesestructures are displayed for four phases of the cycle (Fig. 4.18) (φ = 0, π/2, π, 3π/2). The phase φ = 0corresponds to the minimum value of the axial velocity whereas φ = π corresponds to the maximumvalue of the axial velocity. The excitation creates a large axisymetrical ring which is convected by themean flow and interacts with the flame, increasing the flame surface as it passes through. This ring isvisualised here using an iso-surface of the <strong>de</strong>tection criterion of Hussain and Jeong which is based on thesecond invariant of the velocity t<strong>en</strong>sor [59]. Wh<strong>en</strong> the values of this criterion is positive, the rotation rateis greater than the <strong>de</strong>formation rate, which implies the pres<strong>en</strong>ce of a coher<strong>en</strong>t structure. LES shows thatthis ring is coher<strong>en</strong>t and axisymmetric. At times ”φ = π” and ”φ = 3π/2”, the structure is ring-shapedand well id<strong>en</strong>tified in Figure 4.18. This ring structure directly shapes the flame surface leading to themushroom-shaped flame of Figure 4.17 ”φ = π” and ”φ = 3π/2”. At instants ”φ = 0i” and ”φ = π/2”however, the ring becomes unstable and loses coher<strong>en</strong>ce. At instant ”φ = π/2” , it almost disappears.A second structure g<strong>en</strong>erated by the axial forcing is the precessing vortex core. This instability is typicalof non-reacting swirling flows [80] but was not observed for the unforced reacting case. Visualising an1 At low forcing frequ<strong>en</strong>cies, the flame response is quasi-steady. Moreover, LES of low frequ<strong>en</strong>cy cases become exp<strong>en</strong>siveas characteristic physical times increase. This explains why LES were not performed at frequ<strong>en</strong>cies smaller than 80 Hz.112
4.3 Configuration C : turbul<strong>en</strong>t burner in cylindrical chamber (3D)Figure 4.16 - Heat release (squares), inlet normal velocity (circles) and <strong>en</strong>closed fuel mass (<strong>de</strong>ltas) fluctuations inperc<strong>en</strong>ts of mean values versus phase angle for the 120Hz LES.113
TRANSFER FUNCTIONS OF FLAMESφ = 0 φ = π/2φ = 3π/2φ = πFigure 4.17 - Snapshots of temperature isosurface (1000 K) coloured by the axial velocity for four differ<strong>en</strong>tphases of the cycle : f = 120Hz.114
4.3 Configuration C : turbul<strong>en</strong>t burner in cylindrical chamber (3D)iso-surface of the vortex criterion (Fig. 4.19) in an inner cone excluding the large vortex ring of Fig. 4.18reveals a coher<strong>en</strong>t structure rotating around the chamber axis. The frequ<strong>en</strong>cy of this precessing structureis in<strong>de</strong>p<strong>en</strong>d<strong>en</strong>t of the pulsation frequ<strong>en</strong>cy and remains around 75 Hz.115
TRANSFER FUNCTIONS OF FLAMES(a) φ = 0 (b) φ = π/2(d) φ = 3π/2(c) φ = πFigure 4.18 - Snapshots of vortex criterion coloured by the temperature (Hussain [59]) for four differ<strong>en</strong>t phases ofthe cycle : f = 120Hz.116
4.3 Configuration C : turbul<strong>en</strong>t burner in cylindrical chamber (3D)(a) φ = 0 (b) φ = π/2(d) φ = 3π/2(c) φ = πFigure 4.19 - Snapshots of vortex criterion coloured by the axial velocity visualising the precessing vortex corefor four differ<strong>en</strong>t phases of the cycle : f = 120Hz.117
TRANSFER FUNCTIONS OF FLAMES4.3.8 Comparison of LES, RANS and experim<strong>en</strong>t : global transfer functionFigure 4.20 compares numerical predictions and experim<strong>en</strong>tal measurem<strong>en</strong>ts of the flame transfer functionusing the n − τ mo<strong>de</strong>l [107, 32]. This mo<strong>de</strong>l, commonly used wh<strong>en</strong> <strong>de</strong>aling with reacting systemid<strong>en</strong>tification, is based on a first harmonic analysis. Therefore it does not account for non-linear ph<strong>en</strong>om<strong>en</strong>awhich could be relevant in case of self-excited flames configurations [133, 75]. This mo<strong>de</strong>l linksthe Fourier transform of the volume-integrated heat release fluctuation ˙Ω ′ T to the Fourier transform ofthe velocity fluctuation at the inlet u ′ by :ne iwτ = γ − 1S D γp 0ˆ˙Ω ′ Tû′(4.3)where w is the forcing pulsation (w = 2π ∗ f), p 0 is the mean pressure in the combustion chamber andS D the diagonal swirler inlet surface of fuel injection. Note that the phase φ is directly calculated fromτ, by multiplying by −w. As no time <strong>de</strong>p<strong>en</strong>d<strong>en</strong>t variables are available in RANS results, φ is extractedusing the ”flight time” method <strong>de</strong>scribed in subsection 4.3.9. Experim<strong>en</strong>tal results are giv<strong>en</strong> by the phasecomparison betwe<strong>en</strong> the signal giv<strong>en</strong> by a photomultiplier (with a OH* frequ<strong>en</strong>cy filter) which is directlylinked to the heat release, and a hot wire probe signal at the inlet of the combustion chamber. Values ofthe LES phase φ are in good agreem<strong>en</strong>t with experim<strong>en</strong>tal values (Fig. 4.20). The experim<strong>en</strong>tal phasebetwe<strong>en</strong> heat release and velocity fluctuations is of the or<strong>de</strong>r of −3.5 rad at 120 Hz.No comparison of the amplitu<strong>de</strong>s of the Flame Transfer Function giv<strong>en</strong> by the HF-FFT method and theexperim<strong>en</strong>t is provi<strong>de</strong>d. The reason is that the amplitu<strong>de</strong> of the FTF giv<strong>en</strong> by the HF-FFT method greatlychanges with the acoustic boundary conditions. Since the experim<strong>en</strong>tal acoustic boundary conditions areunknown, no trustful amplitu<strong>de</strong> can be obtained with the HF-FFT method.Experim<strong>en</strong>t LES RANSφ (rad) -3.5 -3.2 -1.1Table 4.4 - Comparison of phases (rad) for the 120Hz case.4.3.9 Comparison of LES, RANS and experim<strong>en</strong>t : local transfer functionThe previous subsection has shown differ<strong>en</strong>ces in terms of global phase betwe<strong>en</strong> LES, RANS and experim<strong>en</strong>ts.To analyse these differ<strong>en</strong>ces, local transfer function must be studied. The usual n w -τ w mo<strong>de</strong>llinks inlet velocity perturbations to global heat release providing one <strong>de</strong>lay τ w (expressed here as a phaseφ w = −τ w ∗ w) and one interaction in<strong>de</strong>x n w . In simulations, it is possible, however, to construct a mapof local n w -φ w values linking the inlet velocity perturbation to the local heat release variation to have alocal phase φ w (x, y, z) and a local in<strong>de</strong>x n w (x, y, z). These quantities are <strong>de</strong>fined by:n w (x, y, z) = MOD( ˆω ′ Tû ′ ) (4.4)118
4.3 Configuration C : turbul<strong>en</strong>t burner in cylindrical chamber (3D)Figure 4.20 - Comparison of LES, RANS and experim<strong>en</strong>t phases.φ w (x, y, z) = ARG( ˆω ′ Tû ) (4.5)where ˆω ′ T and û′ are the Fourier transforms of the local heat release and of the inlet velocity fluctuationsrespectively. MOD and ARG are respectively the real and imaginary part of the complex Fouriercoeffici<strong>en</strong>t of the transfer function at pulsation w.Two methods can be used to evaluate n w and φ w :• direct method (using time-resolved fields of the forced flow): using the <strong>de</strong>finitions of equations 4.4and 4.5, ω ˙ ′ T (t, x, y, z) and u ′ (t) inlet can be used to evaluate φ w (x, y, z) and n w (x, y, z) for eachforcing frequ<strong>en</strong>cy. This method is possible wh<strong>en</strong> LES forced fields are available as done here.• ”flight time” method (using averaged fields of the unforced flow): quite oft<strong>en</strong>, φ w is extracted fromaveraged fields, simply by measuring the time nee<strong>de</strong>d for one particle to travel from the diagonalswirler inlet to a giv<strong>en</strong> location in the combustor. In this case, convection <strong>de</strong>lays to the flame frontare evaluated for example by picking flight time values to the isosurface Y CH4 = 0.004 (where themaximum mean heat release occurs.). This method is common wh<strong>en</strong> RANS co<strong>de</strong>s are used andno forced response has be<strong>en</strong> computed. It is based on the calculation of the dispersion of a passivescalar in a stationary field. More <strong>de</strong>tailed information about the approach is giv<strong>en</strong> by Krebs et al.in [65]. It can also be tested here using the averaged fields giv<strong>en</strong> by LES.To avoid ambiguities due to the mean flow used for the ”flight time” method, the averaged LES fieldwas used and no direct RANS co<strong>de</strong> was run. This <strong>en</strong>sures that the ”flight time” and the direct methods119
TRANSFER FUNCTIONS OF FLAMESare applied on exactly the same flows.Figure 4.21 shows a longitudinal cut coloured by the amplitu<strong>de</strong> response at 120Hz using the directmethod. Since the area including the mean position of the flame mainly responds at twice the frequ<strong>en</strong>cyof excitation, the two flame-shaped like structures show the maximum ext<strong>en</strong>sion of the flame through acycle of excitation (where the flame only goes once during a period of excitation). The flame in front ofthe axial swirler has the strongest response as shown by the high n w values in this zone (Fig 4.21). Thismay be due to the equival<strong>en</strong>ce ratio differ<strong>en</strong>ce betwe<strong>en</strong> the two flames, the richer one producing moreheat release and therefore more heat release fluctuation wh<strong>en</strong> excited by the acoustic wave.Figure 4.22 displays the same cut coloured by the phase (φ w (x, y, z) giv<strong>en</strong> by equation 4.5) betwe<strong>en</strong>heat release and inlet velocity fluctuations and obtained by the direct method. It appears that the flamedoes not move in a compact way but rather gets stretched by the incoming acoustic excitation.Figure 4.23 displays again the same axial 2D cut coloured by the phase φ w obtained with the ”flighttime” method. It is assumed in this analysis that only convective time lower than two periods ofexcitation are worth being consi<strong>de</strong>red (i.e. 16.6ms) [65]. It can be observed that certain regions of themean flame are not reached by the flow within two periods after the start of the excitation. This impliesthat the heat release fluctuation is not linked to the convection of an initial perturbation but is the resultof a complex interaction betwe<strong>en</strong> acoustics and the flow in the chamber. The resulting structures mayappear in the recirculation zone (located in the c<strong>en</strong>tre of the combustion chamber (Fig 4.14)) before anypurely convective ph<strong>en</strong>om<strong>en</strong>on reaches it.Figure 4.24 shows the isosurface of control (Y CH4 = 0.004) coloured by φ w (x, y, z) obtained with thedirect method. It can be se<strong>en</strong> that the axi-symmetry of the flow is conserved in terms of combustionphase.Figure 4.25 shows the isosurface of control coloured by φ w (x, y, z) obtained with the ”flight time”method. The phases obtained with this method still have an axisymmetrical repartition. As already donefor the axial 2D cut (Figure 4.23), non-repres<strong>en</strong>ted phases correspond to convective times greater thantwo periods of excitation.Figure 4.26 compares the PDF of phases and its cumulant measured either by the direct methodnecessarily issued from LES (thin line) or by the ”flight time” method (thick line) on the isosurfaceof control Y CH4 = 0.004. The PDF of phases obtained by LES exhibit a few peaks around -3.5 and0 rad while the ”flight time” method gives a most probable value of φ w around -1.1 rad. This meansthat according to this last method the heat release fluctuation should be in phase with the inlet velocityfluctuation signal which is incompatible with the results of Figure 4.16 or with the experim<strong>en</strong>tal data .Figure 4.26 is obtained from unweighed phases but it is reasonable to expect that points wherelarge unsteady heat release takes place, will have the largest effect on the instability and that they shouldaccount for a larger part in the average phase. This means that another method to post-process phases isto weigh them using the local n w in<strong>de</strong>x value.120
4.3 Configuration C : turbul<strong>en</strong>t burner in cylindrical chamber (3D)Figure 4.27 compares the two weighted PDF 2 of phases using the following weighted phase:P w (φ 0 ≤ φ w ≤ φ 0 + dφ 0 ) =∑ ndφ01 norm i∑ N1 norm iin the region <strong>de</strong>fined by:n w (x, y, z) > n w(x, y, z) max100n dφ0 is the number of mesh points for which φ 0 ≤ φ w ≤ φ 0 + dφ 0 , N is the total number of mesh pointsin the volume andnorm i = Int( 100 ∗ n(x i, y i , z i )n max)One can observe that the two weighted PDF (Figure 4.27) do not match. Although the ”flight time”method shows a wi<strong>de</strong> maximum betwe<strong>en</strong> -3.5 and 0 rad, the phases obtained with equation 4.5 havean evid<strong>en</strong>t maximum at -3.2. This last most repres<strong>en</strong>ted value of φ w is in agreem<strong>en</strong>t with a global heatrelease fluctuation (i.e.. integrated over the whole volume) out of phase with the inlet velocity fluctuation(Figure 4.16 ). Clearly in this example, the ”flight time” method does not give accurate results.2 Note that this normalisation is usually not available in ”flight time” method, because the local n w values of the flametransfer function are nee<strong>de</strong>d.121
TRANSFER FUNCTIONS OF FLAMESFigure 4.21 - Longitudinal cut coloured by response amplitu<strong>de</strong> n w (x, y, z) at 120Hz. (Direct method)122
4.3 Configuration C : turbul<strong>en</strong>t burner in cylindrical chamber (3D)Figure 4.22 - Longitudinal cut coloured by phase φ w (x, y, z) (rad) betwe<strong>en</strong> heat release and inlet velocityfluctuations (wrapped betwe<strong>en</strong> -2π and 0). iso-line Y CH4 = 0.004. (Direct method)Figure 4.23 - Longitudinal cut coloured by convection phase for diagonal injection (wrapped betwe<strong>en</strong> -2π and0). iso-line Y CH4 = 0.004. (Flight time method)123
TRANSFER FUNCTIONS OF FLAMESFigure 4.24 - Isosurface of Y CH4 = 0.004 coloured by phase (rad) betwe<strong>en</strong> heat release and inlet velocityfluctuations. (Direct method)Figure 4.25 - Isosurface of Y CH4 = 0.004 coloured by convection phase (rad) for diagonal injection. (Flighttime method)124
4.3 Configuration C : turbul<strong>en</strong>t burner in cylindrical chamber (3D)Figure 4.26 - Comparison of the phases’PDF and its cumulant on the isosurface Y CH4 = 0.004.PDF : ”flight time” method. ”direct” method.Cumulant : ”flight time” method . ”direct” method.Figure 4.27 - Comparison of the phases’PDF and its cumulant obtained insi<strong>de</strong> maximum ext<strong>en</strong>sion flame zone.PDF : ”flight time” method. ”direct” method.Cumulant : ”flight time” method . ”direct” method.125
TRANSFER FUNCTIONS OF FLAMES4.3.10 ConclusionsLarge Eddy Simulations are used to compute the forced response of an acoustically excited swirledburner. The configuration is a 1:1 repres<strong>en</strong>tation of a prototype gas turbine provi<strong>de</strong>d by Siem<strong>en</strong>s and inwhich premixed gases are injected through two complex-geometry swirlers at two differ<strong>en</strong>t equival<strong>en</strong>ceratios (0.5 and 0.8). The LES solver uses hybrid meshes and high-or<strong>de</strong>r schemes. Combustion/turbul<strong>en</strong>ceinteraction is mo<strong>de</strong>lled using the thick<strong>en</strong>ed flame mo<strong>de</strong>l. A two-step scheme for methane/air combustionis used to repres<strong>en</strong>t chemistry. A comparison of combustion phases giv<strong>en</strong> by LES and measurem<strong>en</strong>tsperformed in Karlsruhe yields good agreem<strong>en</strong>t. Exciting the main inlet at frequ<strong>en</strong>cies varying from 80to 250 Hz, two main flow structures are evid<strong>en</strong>ced by LES:• A toroidal structure which modulates the global heat release by interacting with the flame surface.• A precessing vortex core attached to the c<strong>en</strong>tre of the axial swirler and whose frequ<strong>en</strong>cy is in<strong>de</strong>p<strong>en</strong>d<strong>en</strong>tof the inlet excitation frequ<strong>en</strong>cy.Finally, the maps of combustion phase and response amplitu<strong>de</strong> obtained by LES show that the phasebetwe<strong>en</strong> heat release and inlet velocity fluctuations cannot be simply related to a convective phase fromthe burner inlet to the flame front as curr<strong>en</strong>tly done wh<strong>en</strong> no LES results are available.More g<strong>en</strong>erally, this study confirms the pot<strong>en</strong>tial of LES to study unsteady turbul<strong>en</strong>t combustion incomplex geometries.126
4.4 Configuration D : turbul<strong>en</strong>t burner in a 15 ◦ sector (3D)4.4 Configuration D : turbul<strong>en</strong>t burner in a 15 ◦ sector (3D)This configuration uses almost the same burner as configuration C but mounted on a sector of an annularchamber (see Figure 4.28). The simulation inclu<strong>de</strong>s a 15 ◦ sector of the whole combustion chamber.Si<strong>de</strong> faces are <strong>en</strong>closed with slip adiabatic rigid walls. The mesh contains 339417 no<strong>de</strong>s and 1859248tetrahedral elem<strong>en</strong>ts. Validation concerning mean and RMS results will not be pres<strong>en</strong>ted here. This sameFigure 4.28 - Burner mounted on an annular combustion chamber.mesh has be<strong>en</strong> used to explore the influ<strong>en</strong>ce of piloting on combustion stability [140]. By adding twosi<strong>de</strong> burners to this configuration, it is also used by Staffelbach et al. [144] to evaluate the influ<strong>en</strong>ce ofthe ext<strong>en</strong>sion of the mesh on the resulting unstable mo<strong>de</strong>s of the configuration.Configuration D is used here to compare results of FTF (F dim and F norm ) using HF-FFT, WN-FFT andWN-WH methods.127
TRANSFER FUNCTIONS OF FLAMES4.4.1 G<strong>en</strong>eral computational remarks.Two main methods using LES to get the FTF are compared. The first method (HF method) requires theinjection of a harmonic signal at the main inlet of the configuration. The frequ<strong>en</strong>cy of forcing is changedto get the <strong>de</strong>p<strong>en</strong>dance of the FTF to frequ<strong>en</strong>cy. The configuration is forced at six frequ<strong>en</strong>cies betwe<strong>en</strong>90 and 540 Hz.With an explicit resolution of the Navier-Stokes equations and a time step of the or<strong>de</strong>r of 4.0e −7 s,25000 iterations are nee<strong>de</strong>d to compute one period if the configuration is forced with a 100 Hz acousticwave. Since the HF-FFT method uses the Fourier transform of signals, the spectral resolution is equalto the inverse of the total computed time. Therefore, to get a resolution of 20Hz, 0.05s have to becomputed, which corresponds to 125000 explicit iterations. On 64 processors on a CRAY XD1, itrepres<strong>en</strong>ts 50h of computation. Therefore, no calculations for lower frequ<strong>en</strong>cies than 90Hz have be<strong>en</strong>ma<strong>de</strong> to save computational time.Since WN-WH method is based on the correlation of signals and not on their Fourier transform,theoretically only one period has to be resolved to state for the time <strong>de</strong>lay, ev<strong>en</strong> if the third simple testshows a selectivity issue concerning the Wi<strong>en</strong>er-Hopf inversion method (see Section 3.3). Therefore, to<strong>en</strong>able a simpler comparison betwe<strong>en</strong> the three methods and to avoid this issue, they are applied on thesame fields of heat release and velocity fluctuations corresponding to a minimum of five periods for allconcerned frequ<strong>en</strong>cies.Table 4.5 summarizes the physical simulated times and CPU costs for the turbul<strong>en</strong>t case and forthe three methods. All computations have be<strong>en</strong> done on a CRAY XD1 (120 processors).Forced casesHF-FFT 90 HzHF-FFT 180 HzHF-FFT 270 HzHF-FFT 360 HzHF-FFT 450 HzHF-FFT 540 HzHF-FFT (global)WN-WH or WN-FFT (F cut = 600Hz)Turbul<strong>en</strong>t combustorPhysical time: 55ms Cpu Cost : 54hPhysical time: 44ms Cpu Cost : 43hPhysical time: 33ms Cpu Cost : 32hPhysical time: 22ms Cpu Cost : 21hPhysical time: 22ms Cpu Cost : 21hPhysical time: 22ms Cpu Cost : 21hTotal Cpu Cost : 192hPhysical time: 55ms Cpu Cost : 54hTable 4.5 - Computational costs and simulated times for the differ<strong>en</strong>t runs of the turbul<strong>en</strong>t configuration.Note that the physical simulated time can be <strong>de</strong>creased as the frequ<strong>en</strong>cy increases because the periodof the forcing also <strong>de</strong>creases. Also note that the frequ<strong>en</strong>cy resolution is not kept constant. No less thanfive periods have be<strong>en</strong> computed for the harmonically forced cases. The last two lines compare the globalcomputational cost of the two types of methods. Since differ<strong>en</strong>t computations have to be done for each128
4.4 Configuration D : turbul<strong>en</strong>t burner in a 15 ◦ sector (3D)frequ<strong>en</strong>cy wh<strong>en</strong> using HF-FFT method, the cost of this method is four times bigger. The goal of thefollowing section is therefore to validate WN-FFT and WN-WH methods in an industrial configuration.4.4.2 Refer<strong>en</strong>ce signalsFor both methods, investigations of global and local FTF are done. Dep<strong>en</strong>ding on global or local FTFanalysis, differ<strong>en</strong>t response signals have to be compared to the refer<strong>en</strong>ce signal.Comparison of global FTF.In this case, the refer<strong>en</strong>ce inlet velocity signal is the harmonic or white-noise fluctuating velocity, andthe response signal is the integrated heat release fluctuation over the whole volume. Figure 4.29 pres<strong>en</strong>tsthese signals for the turbul<strong>en</strong>t configuration and for the white noise forced case. Inlet velocity and heatrelease signals are normalized by their mean values. There is a clear correlation betwe<strong>en</strong> these twosignals. One can observe that a maximum of inlet velocity induces a maximum of heat release afterapproximately 2-3 ms .Figure 4.29 - Normalized signals of refer<strong>en</strong>ce for the white-noise forced case: inlet velocity heatreleaseComparison of local FTF.In this case, 3D fields of heat release fluctuation are used. The transfer function of each grid pointis calculated using HF-FFT, WN-FFT and WN-WH methods. Figure 4.30 shows a 2D longitudinalcut colored with the instantaneous local heat release. The LES are done using the optimal local flamethick<strong>en</strong>ing mo<strong>de</strong>l [125] with 7 points in the flame front. It leads to a thick<strong>en</strong>ing factor ranging from129
TRANSFER FUNCTIONS OF FLAMESapproximately 5 to 50 <strong>de</strong>p<strong>en</strong>ding on the local refining of the mesh. A point shows the location of therefer<strong>en</strong>ce inlet point. This local treatm<strong>en</strong>t <strong>en</strong>ables amplitu<strong>de</strong> and time <strong>de</strong>lay from FTF 3D fields to becompared using differ<strong>en</strong>t system id<strong>en</strong>tification techniques.Figure 4.30 - 2D longitudinal cut colored by instantaneous heat release. Black point marks the refer<strong>en</strong>ce inletpoint.4.4.3 Comparison of global FTF (F norm )Amplitu<strong>de</strong>Figures 4.31 pres<strong>en</strong>t the amplitu<strong>de</strong>s of the FTF obtained with HF-FFT, WN-FFT and WN-WH methodsfrom signals of Fig.(4.29). It appears that HF-FFT and WN-WH methods give similar results for theamplitu<strong>de</strong> of the turbul<strong>en</strong>t FTF, with a minimum tak<strong>en</strong> from the Wi<strong>en</strong>er-Hopf curve at approximately300Hz. In this case, the WN-FFT results are not in agreem<strong>en</strong>t with the other results. Figure 4.31 alsoshows that the result obtained with WN-WH method is s<strong>en</strong>sitive to the size of the filter used to computeauto-correlation matrix and cross-correlation vectors. Dep<strong>en</strong>ding on the value chos<strong>en</strong> for the filter l<strong>en</strong>gthL, the response experi<strong>en</strong>ces a variation of approximately 10 perc<strong>en</strong>t. Wh<strong>en</strong> approaching the cut-offfrequ<strong>en</strong>cy (600 Hz) of the low pass filter used to obtain the white noise signal, the discrepancy betwe<strong>en</strong>results for differ<strong>en</strong>t L values increases. In contrary to what is observed for the laminar FTF amplitu<strong>de</strong>in chapter 4.2, the amplitu<strong>de</strong> of the FTF is not greater than one for the frequ<strong>en</strong>cies of interest. It meansthat the relative fluctuation of heat release is lower than the relative fluctuation of the inlet velocity forall frequ<strong>en</strong>cies. Figure 4.31 shows that a maximum of the FTF amplitu<strong>de</strong> is reached around 500Hz. If130
4.4 Configuration D : turbul<strong>en</strong>t burner in a 15 ◦ sector (3D)the inlet velocity is forced at 10% of its mean value at 500Hz, the heat release will fluctuate with anamplitu<strong>de</strong> of 8% of its mean value.Using Eqs.(2.10) and (2.20), the amplitu<strong>de</strong> |F | at 100Hz can be estimated. It is equal to 1.77. This valuecan be compared to the asymptotic value giv<strong>en</strong> by Eq.(2.13). With a mean temperature of 1835K inburnt gases and a temperature of 685K at the inlet, the asymptotic value of the interaction in<strong>de</strong>x for lowfrequ<strong>en</strong>cies is equal to 1.68. The value for |F | at 100Hz therefore compares well with this theoreticalamplitu<strong>de</strong>.Figure 4.31 - Amplitu<strong>de</strong> of FTF : ◦ HF-FFT method. + WN-FFT method. .... WN-WH method for various valuesof the filter size L.PhaseFigure 4.32 compares the times <strong>de</strong>lays for the configuration D obtained with HF-FFT, WN-FFT and WN-WH methods. As for configuration B, it shows that HF-FFT and WN-WH time <strong>de</strong>lays almost match forall frequ<strong>en</strong>cies. WN-FFT method gives almost incoher<strong>en</strong>t time <strong>de</strong>lays that can hardly be compared to theother results. Results show a discontinuity around 300Hz. This artefact is only due to the phase crossingthe 2π limit and going back to zero. Without refer<strong>en</strong>ce time for the <strong>de</strong>lay, values above 300 Hz are eitherτ or T + τ without changing the phase betwe<strong>en</strong> the heat release fluctuation and the refer<strong>en</strong>ce velocityfluctuation. Though, fluctuations (<strong>de</strong>p<strong>en</strong>ding on L) of the results of Wi<strong>en</strong>er-Hopf relation’s inversion areimportant near 300 Hz and 600 Hz. The last frequ<strong>en</strong>cy corresponds to the cut-off frequ<strong>en</strong>cy and hasalready be<strong>en</strong> pointed out concerning the amplitu<strong>de</strong> analysis. The source of fluctuations around 300 Hz isnot clear but corresponds to the fact that the phase crosses the 2π limit for slightly differ<strong>en</strong>t frequ<strong>en</strong>cies<strong>de</strong>p<strong>en</strong>ding on the value of the L parameter.131
TRANSFER FUNCTIONS OF FLAMESFigure 4.32 - Time <strong>de</strong>lay of FTF : ◦ HF-FFT method. + WN-FFT method. .... WN-WH method (for various valuesof the filter size L).4.4.4 Local comparison of FTF (F dim )It has be<strong>en</strong> shown in the previous section that the global response of the system is almost id<strong>en</strong>tical wh<strong>en</strong>forced with a harmonic signal or with a filtered white noise. It is therefore interesting to focus on thelocal response of the flame. The analysis is done by comparing results obtained with the two methodsHF-FFT and WN-WH at 90 Hz. the WN-WH method gives the FTF for all the frequ<strong>en</strong>cy range inclu<strong>de</strong>din the spectrum of the imposed filtered white noise. Results at 90 Hz are therefore extracted from thetotal resolved spectrum for the WN-WH method. The frequ<strong>en</strong>cy of 90Hz was chos<strong>en</strong> because it is thevalue observed experim<strong>en</strong>tally in the full combustor (it is an azimutal mo<strong>de</strong>). Longitudinal cuts coloredby the local amplitu<strong>de</strong> and time <strong>de</strong>lay are used to support this analysis. Finally the weighted probabilityd<strong>en</strong>sity function of time <strong>de</strong>lays for both cases is comm<strong>en</strong>ted.Amplitu<strong>de</strong>Figures 4.33 and 4.34 show 2D longitudinal plane cuts colored by the amplitu<strong>de</strong> of the FTF at 90Hz,respectively obtained using the HF-FFT and WN-WH methods. Note that the mean flame position isslightly differ<strong>en</strong>t whether the flame is forced using HF-FFT method or WN-WH method. This is dueto the fact that the simulation time is not long <strong>en</strong>ough to <strong>en</strong>sure a perfect converg<strong>en</strong>ce of the mean heatrelease field.Figure 4.33 shows that the response amplitu<strong>de</strong> to the 90Hz acoustic excitation is almost axi-symmetricalthough the geometry of the combustion chamber is not. It means that the shape of the forced flameis mostly imposed by the injector which is axi-symmetric. The 2D plane cut colored by the responseamplitu<strong>de</strong> is separated in two zones which react differ<strong>en</strong>tly to the excitation.• In Zone 1, the response amplitu<strong>de</strong> is int<strong>en</strong>se. It corresponds to high values of local heat release132
4.4 Configuration D : turbul<strong>en</strong>t burner in a 15 ◦ sector (3D)fluctuations. This is due to the equival<strong>en</strong>ce ratio of the axial swirler (φ = 0.8) which is higherthan the equival<strong>en</strong>ce ratio of the diagonal swirler (φ = 0.5). The mean heat release in this zone istherefore higher and leads to more heat release fluctuations for a giv<strong>en</strong> incoming velocity fluctuation.• In Zone 2 the level of mean heat release is almost constant along the flame front but the si<strong>de</strong>anchored at the burner mouth and the si<strong>de</strong> stabilized by the precessing vortex core [47, 147] showdiffer<strong>en</strong>ces in their response amplitu<strong>de</strong> to the fluctuation. The part of the flame front attached tothe outer part of the burner reacts more weakly to the perturbation showing that this part of theflame is well anchored and less prone to instability.The separation of the response of the white noise forced flame in two zones is not so clear on figure 4.34: some parts of the zone 2 show a response which has the same amplitu<strong>de</strong> as in zone 1. The responseamplitu<strong>de</strong> is not perfectly axi-symetric. This can be due to the effects of the geometry in the case of thewhite-noise forced flame. Also note that as for the harmonically forced case, the outer flame front reactsless int<strong>en</strong>sively to the incoming perturbation than the inner si<strong>de</strong>.133
TRANSFER FUNCTIONS OF FLAMESFigure 4.33 - 2D longitudinal cut colored with the amplitu<strong>de</strong> of FTF: HF-FFT method. Black line marks themean flame position.Figure 4.34 - 2D longitudinal cut colored with the amplitu<strong>de</strong> of FTF: WN-WH method. Black line marks themean flame position.134
4.4 Configuration D : turbul<strong>en</strong>t burner in a 15 ◦ sector (3D)Time <strong>de</strong>layFigures 4.35 and 4.36 show 2D longitudinal plane cuts colored by the time <strong>de</strong>lay of the FTF at 90Hzrespectively obtained using the HF-FFT and WN-WH methods. The <strong>de</strong>lays change betwe<strong>en</strong> 0 and 11 ms(the forcing period at 90Hz).The zones <strong>de</strong>scribed for the amplitu<strong>de</strong> analysis are also pres<strong>en</strong>t on those figures. They also correspondto differ<strong>en</strong>t types of responses:• In zone 2, the behaviour of the time <strong>de</strong>lay for the pres<strong>en</strong>t flame is well <strong>de</strong>scribed by the 1D analysis,with lower time <strong>de</strong>lays after the mean flame front and higher time <strong>de</strong>lays in the inner fluctuatingarea.• In zone 1, the distribution of time <strong>de</strong>lays is reversed: shorter time <strong>de</strong>lays are observed before themean flame front. It is due to the fact that the flame first contracts in the cycle, burning nearer tothe injection, and th<strong>en</strong> expands to reach the black zone which corresponds to higher time <strong>de</strong>lays.The dim<strong>en</strong>sions of the two zones are differ<strong>en</strong>t whether the flame is forced with a harmonic signal or withfiltered white noise. It shows that ev<strong>en</strong> if the global time <strong>de</strong>lay is almost the same for the two forcingmethods, the influ<strong>en</strong>ce of the other frequ<strong>en</strong>cies pres<strong>en</strong>t with WN-WH method changes the local responseof the flame (i.e. the localisation of zones 1 and 2) at 90Hz.The maps of amplitu<strong>de</strong>s (Fig.(4.33) and (4.34)) and of local time <strong>de</strong>lays (Fig.(4.35) and (4.36)) exhibitobvious structures. Their interpretation however is difficult. Zone 1 seems to be the place where the mostint<strong>en</strong>se interaction takes place, while zone 2 yields more diffuse flame responses but with time <strong>de</strong>layswhich exhibit the pattern of oscillating flames se<strong>en</strong> in Fig.(4.5) for 1D flames. This suggests that theinner flame, stabilized on the axial swirler hub, is the most unstable one and the first source of the flameresponse. Being more precise is difficult and using these results to study stability requires an acousticco<strong>de</strong> and is done in other PhDs [8].Weighted Probability d<strong>en</strong>sity functions of time <strong>de</strong>lays.The 3D fields of amplitu<strong>de</strong> and time <strong>de</strong>lay obtained with both methods are used to reconstruct theWeighted-PDF of time <strong>de</strong>lays. The way these PDF of time <strong>de</strong>lays are obtained is <strong>de</strong>scribed in section4.3. Figure 4.37 compares the two weighted PDF of time <strong>de</strong>lays. Both show a maximum around2 ms which is the global value of the time <strong>de</strong>lay at 90Hz. They also both show a peak around 6ms. Itmeans that ev<strong>en</strong> if the global value of the time <strong>de</strong>lay is 2ms a non negligible part of the fluctuations ofheat release that occur out of phase with the inlet velocity. Figure 4.35 shows that this value correspondsto heat release fluctuations occurring insi<strong>de</strong> the mean flame position in zone 1 and 2. The main differ<strong>en</strong>cebetwe<strong>en</strong> the two pdf of time <strong>de</strong>lays is the probability of finding a time <strong>de</strong>lay around 1 ms which is muchsmaller wh<strong>en</strong> the flame is forced with filtered white-noise. This may be due to the influ<strong>en</strong>ce of higherfrequ<strong>en</strong>cies on the 90Hz turbul<strong>en</strong>t FTF using WN-WH method.135
TRANSFER FUNCTIONS OF FLAMESFigure 4.35 - 2D longitudinal cut colored with the time <strong>de</strong>lay of FTF: HF-FFT method. Black line marks themean flame position.Figure 4.36 - 2D longitudinal cut colored with the time <strong>de</strong>lay of FTF: WN-WH method. Black line marks themean flame position.136
4.4 Configuration D : turbul<strong>en</strong>t burner in a 15 ◦ sector (3D)Figure 4.37 - PDF of weighted time <strong>de</strong>lays : WN-WH method. HF-FFT method.4.4.5 Concluding remarks for configuration DThe influ<strong>en</strong>ce of frequ<strong>en</strong>cy on the FTF of a turbul<strong>en</strong>t combustor has be<strong>en</strong> studied using three differ<strong>en</strong>tmethods of forcing and post-processing. The first output of this study concerns the global FTF comparison.The WN-WH method gives results that are similar to the results obtained using the harmonicmethod though its computational cost is much lower (4 times in this case). Yet, it has to be noticed thatthe white-noise forcing method requires the use of the Wi<strong>en</strong>er-Hopf relation inversion and therefore hasspecific drawbacks that have to be carefully addressed.• First the WH method is very s<strong>en</strong>sitive to the size of the filter used for the inversion. The numberof elem<strong>en</strong>ts of the filter multiplied by the time sampling of the signal repres<strong>en</strong>ts the time memoryof the system. Wh<strong>en</strong> inverted, this time repres<strong>en</strong>ts the minimum frequ<strong>en</strong>cy this method will beable to treat. But due to the matrix inversion, the size of the filter also has to remain as low aspossible to give precise results. This leads to an optimal value of the size of the filter which maybe sometimes hard to find.• Wh<strong>en</strong> forcing with white noise, extreme care has to be giv<strong>en</strong> to the filter cut-off frequ<strong>en</strong>cy and tothe type of filter used. In this study, the cut-off frequ<strong>en</strong>cy is set to 600Hz which has be<strong>en</strong> shown astoo close to the frequ<strong>en</strong>cies of interest. A fourth-or<strong>de</strong>r low-pass filter has also be<strong>en</strong> used to avoidany unwanted high frequ<strong>en</strong>cy influ<strong>en</strong>ces on the measured FTF.The local response of the turbul<strong>en</strong>t flame is studied at 90Hz. Both methods (HF-FFT and WN-WH) givesimilar FTF and probability d<strong>en</strong>sity functions of time <strong>de</strong>lays. They both show that as already observed inchapter 4.3 the local response of the turbul<strong>en</strong>t flame can be very differ<strong>en</strong>t from its global response, withlocations where the fluctuations of HR can be out of phase with the fluctuations of velocity ev<strong>en</strong> thoughthe global response is almost in phase.137
TRANSFER FUNCTIONS OF FLAMES4.5 Evaluation of FTF measurem<strong>en</strong>ts methods in LES.Four differ<strong>en</strong>t methods for the measurem<strong>en</strong>t of FTF in LES have be<strong>en</strong> tested. Table 4.6 summarizes themain advantages and drawbacks of these differ<strong>en</strong>t methods that <strong>de</strong>rive from the previous results. + and- signs un<strong>de</strong>r the name of each method is the global author evaluation for their use in the measum<strong>en</strong>t ofFTF in LES. Signs ” ! ” emphasize the major advantages and drawbacks of the diffr<strong>en</strong>t methods.An important aspect of this study is their link with stability analysis of combustors. Obviously,FTF do have an influ<strong>en</strong>ce on the frequ<strong>en</strong>cy and amplification rates of mo<strong>de</strong>s in the numerical methodsused for combustor stability [9, 91]. The pres<strong>en</strong>t results show that methods like WN-WH and HF-FFTprovi<strong>de</strong> slightly differ<strong>en</strong>t local FTF maps. Whether these differ<strong>en</strong>ces will affect or not significantly thefrequ<strong>en</strong>cies and amplification rates of mo<strong>de</strong>s remains to be studied. What this study has shown is howto construct FTFs which is the important ”brick” of acoustic analysis : further studies are nee<strong>de</strong>d to<strong>de</strong>termine which method will be the most precise. Note also that experim<strong>en</strong>tal results on global FTF areavailable but that no-one has studied local FTF yet. This is obviously a required step for the future.138
4.5 Evaluation of FTF measurem<strong>en</strong>ts methods in LES.Methods Advantages DrawbacksTD method- -• Computational cost: Only requires the simulationof the steady state solution.• Complexity: Injection of a passive scalar to get theflow time history• ! Results: Only recovers time <strong>de</strong>lays• ! Precision: Lack of precision wh<strong>en</strong> time <strong>de</strong>lay isnot directly linked with convective ph<strong>en</strong>om<strong>en</strong>a• ! Precision: compares well with experim<strong>en</strong>tsin terms of time <strong>de</strong>laysHF-FFT method+ +• ! Precision: compares well with analyticalmo<strong>de</strong>ls• ! Computational cost: each frequ<strong>en</strong>cy requires adiffer<strong>en</strong>t computation• Results: gives access to the local response ofthe flameWN-FFT method- -• Computational cost: only one computationof the white-noise forced configuration isnee<strong>de</strong>d• Precision: lack of precision due to FFT postprocessingof non-harmonic signal on configurationB• ! Results: Totally incoher<strong>en</strong>t results for configurationDWN-WH method+ + (+)• ! Computational cost: only one computationof the white-noise forced configuration isnee<strong>de</strong>d• ! Precision: compares well with HF-FFT results• Results: gives access to the local response ofthe flame• Precision: results are <strong>de</strong>p<strong>en</strong>d<strong>en</strong>t to the L parameterfor the Wi<strong>en</strong>er-Hopf inversion• ! Complexity: difficulties in finding the optimalvalue of the L parameter.Table 4.6 - Comparison of the advantages and drawbacks of TD,HF-FFT,WN-FFT and WN-WH methods.139
TRANSFER FUNCTIONS OF FLAMES140
<strong>Lire</strong>la secon<strong>de</strong> partie<strong>de</strong> la thèse