PhD Nele Somers 2009 - Ghent Ecology - Universiteit Gent
PhD Nele Somers 2009 - Ghent Ecology - Universiteit Gent
PhD Nele Somers 2009 - Ghent Ecology - Universiteit Gent
- No tags were found...

Create successful ePaper yourself
Turn your PDF publications into a flip-book with our unique Google optimized e-Paper software.
Feeding facilitation, the hidden interactionin mammalian herbivore assemblages?A case-study on rabbits (Oryctolagus cuniculus L.)and large grazers<strong>Nele</strong> SOMERS
Supervisor: Prof. Dr. Maurice Hoffmann (U<strong>Gent</strong> & INBO)Co-supervisor: Prof. Dr. Luc Lens (U<strong>Gent</strong>)Reading committee:Prof. Dr. Sip van Wieren (WUR, Wageningen)Dr. Liesbeth Bakker (NIOO-KNAW)Dr. Luc Maertens (ILVO)Dr. Rein Brys (U<strong>Gent</strong>)Other members of the exam committee:Prof. Dr. Wim Vyverman, president (U<strong>Gent</strong>)Prof. Dr. Dominique Adriaens (U<strong>Gent</strong>),Prof. Dr. Paul Goetghebeur (U<strong>Gent</strong>)Cover photograph by Pieter Espeel
Feeding facilitation, the hidden interactionin mammalian herbivore assemblages?A case-study on rabbits (Oryctolagus cuniculus L.) and large grazers<strong>Nele</strong> SOMERS<strong>Universiteit</strong> <strong>Gent</strong>, Academiejaar 2008-<strong>2009</strong>Proefschrift voorgelegdtot het behalen van de graad vanDoctor in de Wetenschappen, Biologie
voor papa
DankwoordWie een doctoraat maakt over konijnen, leert al heel snel dat een konijn heel watmeer is dan een schattig, stil, dom wezentje met lange oren. Al tijdens mijn eerste weken inhet konijnenonderzoek werd ik geconfronteerd met literatuur waarin “onderzoekertje pesten”als één van de favoriete hobby’s van konijnen werd aangehaald. Ik heb de afgelopen jarenheel vaak teruggedacht aan die woorden... Nu, zoveel jaren later, weet ik dat konijnenlevendige, karaktervolle, koppige, eigenwijze, grappige en verstandige dieren zijn. En ja,toch ook wel schattig... Bij deze is dan ook het moment aangebroken om mijn dank terichten aan alle konijntjes, wilde én tamme, die op één of andere manier, constructief ofdestructief, een bijdrage hebben geleverd aan dit proefschrift! We komen elkaar ongetwijfeldnog vaak tegen!Dat dit doctoraat ooit werd opgestart heb ik in de eerste plaats te danken aan mijnpromotor Maurice Hoffmann. Ongetwijfeld heeft hij nu en dan ook wel eens gedacht: “Nooitmeer konijnen!”. Maar al bij al bleef hij er steeds in geloven en daar wil ik hem bij dezehartelijk voor bedanken! Mijn co-promotor Luc Lens werd pas later in de strijd gegooid, envulde de laatste maanden heel wat van zijn tijd met het doorworstelen van hoofdstukkenover konijnen. Waarvoor mijn oprechte dank!Heel wat instanties maakten dit werk financieel en/of logistiek mogelijk. Het Fondsvoor Wetenschappelijk Onderzoek – Vlaanderen (FWO-Vlaanderen) ondersteunde ditonderzoek financieel. Dit werd aangevuld door fondsen van het Instituut voor deAanmoediging van Innovatie door Wetenschap en Technologie in Vlaanderen (IWT-Vlaanderen) en het Bijzonder Onderzoeksfonds (BOF) van de <strong>Universiteit</strong> <strong>Gent</strong> (U<strong>Gent</strong>).Dankzij het Agentschap voor Natuur en Bos (ANB), de IntercommunaleWaterleidingsmaatschappij van Veurne Ambacht (IWVA), le Conservatoire du Littoral, leConseil Général du Nord, en de Provincie Oost-Vlaanderen kregen we de mogelijkheid omveldwerk te verrichten op hun terreinen. Met speciale dank aan Rika Driessens (IWVA) enSandra Van Steerteghem (Provincie Oost-Vlaanderen). Dankzij het Vlaams Instituut voor deZee (VLIZ) (met speciale dank aan André Catrijsse) was het mogelijk de infrastructuur inWenduine te gebruiken voor het huisvesten en onderhouden van de tamme konijnen, voorhet opzetten van de plantenkweek en voor het drogen van ingezameld plantenmateriaal.Daarnaast werd ook heel wat logistieke steun geboden door het Instituut voor Natuur- enBosonderzoek (INBO) en werden een groot deel van de plantanalyses uitgevoerd door hetInstituut voor Landbouw- en Visserijonderzoek (ILVO).
Naast financiële steun was ook technische hulp vaak onontbeerlijk. Een eervollevermelding voor Frank Broucke (VLIZ) is hier dan ook ten zeerste op zijn plaats! Frank, devele uren die je hebt doorgebracht met het verzorgen van de konijntjes en de planten zijn allang niet meer op te tellen. De vrolijke babbels tussendoor deden altijd deugd en het wasaltijd fijn om in Wenduine aan te komen! Een zeer welgemeende en ongelooflijk dikke merci!Daarnaast was er ook Ward Vercruysse (INBO) die heel wat te verduren kreeg: van pijnlijkeknieën na het tellen van keutels, over koude en harde regenbuien tot het vol metschrammen staan na alweer een dagje te midden van de duindoorn... Gelukkig was hetmeestal ook gewoon gezellig en leutig – dankjewel! Ook Tanja Milotic (INBO) en Wim DeBelder (INBO) sprongen nu en dan in de bres.En dan zijn er nog de vele mensen die misschien niet steeds rechtstreeks kondenhelpen met het konijnenonderzoek, maar die er steeds waren om zware loodjes wat lichterte maken en de dagen op te vrolijken met hun aanwezigheid!Daarom uiteraard een oprechte merci aan al de TEREC-collega’s! (Ook zij die er inhet begin bij waren, maar ondertussen elders een stekje hebben gevonden.) De vrolijkekoffiepauzes en gekke gedachtenkronkels plaatsten nu en dan het belang van een doctoraatweer eens in perspectief. Een opsomming van iedereen zou me te ver leiden, maar toch eenspeciale vermelding voor Bea, de Bram-bureaugenootjes, Els (mijn last-minute nieuwbureaugenootje), Viki en Angelica (voor administratieve en praktische hulp) en Nathalie,Greet en Debbie (voor de opbeurende woorden op tijd en stond!). Uiteraard ben ik de S8-collega’s (lang vervlogen tijden...) nog niet vergeten; vooral Christelle en Kathy stondensteeds voor me klaar. To my Iranian colleagues Ata, Reza and Pejman: thank you very muchto learn me about the hospitality and kindness of your people! I wish you are all doing wellback home, and maybe, we will once meet again? Omdat onderzoek soms toch een eenzamezaak kan zijn, heb ik ook ten volle genoten van de vlotte samenwerking met de studentenMarie-Alix, Binke, Esther en Arne!Een oprechte dankjewel ook aan mijn dansvrienden! Een paar uurtjes (of dagen...?)stevig dansen, gevolgd door een onder alle omstandigheden zeer geslaagde après is debeste remedie tegen eigenzinnige konijnenstreken!Wie absoluut niet mag ontbreken op het danklijstje is de bioloogjesbende (jaja,archeologen, geschiedkundigen en biochemici ook meegerekend!)! Alexander, Elisabeth &Bram, Jeroen & An, Marie-Stéphanie, Sofie, Stephan, Tom, Valérie & Toon, superbedanktvoor alle leuke weekendjes, excursies, reizen, etentjes, voor sommigen het delen van onzedoctoraatsjaren en voor allemaal de zeer deugddoende steun op moeilijke momenten! Ook
mijn andere vrienden Anneleen & Peter, Leen & Tim, Liesbeth, Linde, Sabrina & Bart warener op echt alle momenten voor me! En last but not least: een heel dikke merci aan Leen &Pieter, voor alles!Hoe ontzettend belangrijk familie kan zijn heb ik het afgelopen jaar heel vaak mogenervaren: mijn tante, mijn nonkel, mijn nichtje, Rik, Carine, Lennert en Lars. Mijn grootoudersen de groottantes en –nonkels die er helaas niet meer zijn. De Pevenagekes om me metopen armen te ontvangen in hun gekke bende, en in het speciaal Els & Jeroen.Een heel diepe, welgemeende dankjewel is er uiteraard voor mijn ouders. Ze gavenme de liefde voor de natuur en het leven mee, hebben me altijd gesteund en op allemogelijke manieren geholpen tijdens mijn studies en doctoraatsjaren. Papa, het lijkt al zolang geleden dat we samen de eerste Steenkonijntjes gingen kopen. Ik had zo graag gewilddat je het einde van m’n doctoraat had kunnen meemaken. Ik hoop dat je, ergens, waar danook, toch kan meekijken en trots kan zijn. Ik mis je ontzettend. Mama, het leven voert onsniet altijd naar de plaats die we ons hadden voorgesteld. Ik hoop desondanks dat de weg nurechtstreeks leidt naar geluk, en dat we die weg samen nog heel veel jaren zullen mogenbewandelen! Ik hou van jullie!En tenslotte... Maarten, toen je me een aantal jaren geleden leerde kennen, wist jevaag dat ik “iets met konijntjes” deed. Ondertussen heb je het allemaal meegemaakt: hettellen van keutels, het vangen (of net niet?) van konijnen, het bouwen van konijnenvilla’s,het in elkaar knutselen van camera-opstellingen, het mengen van zand en potgrond, hettypen van cijfertjes en nog zoveel meer. Maar vooral, je steunende en aanmoedigendewoorden waren er altijd voor me. Ik weet zeker dat dit boekje er zonder jou niet hadgelegen. Dankjewel! En nu... op naar nieuwe dromen!
Table of contentsCHAPTER 1 - General introduction.....................................................................................3CHAPTER 2 - The effect of rabbits (Oryctolagus cuniculus L.) and large herbivores on drydune grassland structure and composition ....................................................................... 21CHAPTER 3 - Does vegetation height predict spatial foraging activity of the rabbit(Oryctolagus cuniculus L.)? ............................................................................................. 71CHAPTER 4 - Food quality affects diet preference of rabbits: experimental evidence .......... 99CHAPTER 5 - The determination of the diet of rabbits (Oryctolagus cuniculus L.) usingmicrohistological faecal analysis: an experimental evaluation .......................................... 115CHAPTER 6 - The diet of the wild rabbit (Oryctolagus cuniculus L.): selection of plant speciesin an acid dune grassland ............................................................................................. 135CHAPTER 7 - General discussion ................................................................................... 153Summary..................................................................................................................... 169Samenvatting............................................................................................................... 1731
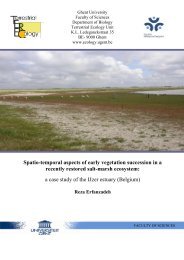
How can species using the same or a similar limiting resource live together? (Photograph byN. <strong>Somers</strong> - Maasai Mara, Kenya, 2005)2
CHAPTER 1General introduction3
Feeding facilitation in herbivore assemblagesCoexistence of different terrestrial grazer species is an important topic in ecology,leading to the question: how can species using the same or a similar limiting resource livetogether (e.g. PRINS & OLFF, 1998; FARNSWORTH et al., 2002)? In this context, the concept ofcompetition and niche differentiation has been extensively investigated (for a generaloverview: see BEGON et al., 1990). However, positive interactions are far less extensivelystudied and deserve greater attention from ecologists (KRUEGER, 1986; ARSENAULT & OWEN-SMITH, 2002). This thesis is focussing on the positive interspecific interaction called‘facilitation’. Facilitation between animal species is a process or action, undertaken by onespecies, by which “something” is facilitated for the other species. This positive interactionhas been suggested to play an important role in understanding coexistence of grazers withdifferent body mass (PRINS & OLFF, 1998): smaller grazer species may benefit from thegrazing impacts of larger species that modify the vegetation (ARSENAULT & OWEN-SMITH,2002). This is called ‘feeding facilitation’.Feeding facilitation may arise for several reasons. When grazing by one speciesstimulates grass re-growth, it may thereby enhance the nutritional quality of forage foranother species (ARSENAULT & OWEN-SMITH, 2002): the creation of low, high-productive andhigh-qualitative vegetation (MCNAUGHTON, 1984). Secondly, feeding facilitation may arisewhen grazing by one species makes more forage accessible to another species (ARSENAULT &OWEN-SMITH, 2002). For example, a tall sward might be more difficult to handle (FRYXELL,1991; VAN DE KOPPEL et al., 1996; VAN DER GRAAF et al., 2002). A third form of feedingfacilitation was mentioned by KUIJPER et al. (2008): in the long term, large herbivores maynot only alter vegetation structure (and eventually forage quality) but also alter plant speciescomposition. This could lead to a long term form of feeding facilitation: smaller grazerswould be facilitated by large grazers because other plant species emerge, which was shownin a herbivore assemblage of cattle and hares (KUIJPER et al., 2008). As far as feedingfacilitation is concerned, we should further consider the option that medium-sized herbivoresare able to maintain favourable grazing swards themselves, without the help of largeherbivores. This is the concept of self facilitation (ARSENAULT & OWEN-SMITH, 2002) whichmight interfere with interspecific feeding facilitation.Additionally, there might be a lower cost of vigilance in short grazed swards, becauseof increased predator detection capacity (VAN DE KOPPEL et al., 1996; IASON et al., 2002; VANDER GRAAF et al., 2002). Finally, more difficult locomotion might be at hand too (VAN DERGRAAF et al., 2002): a low sward makes it easier for smaller herbivores to flee from4 Chapter 1
predators (BAKKER et al., <strong>2009</strong>) as in the case of rabbits that are bound to burrows.Adversely, a higher sward gives better hiding opportunities for still smaller herbivores likevoles (BAKKER et al., <strong>2009</strong>).This multitude of facilitation mechanisms makes it clear that this herbivore interactionis not yet completely understood. The first type of feeding facilitation (facilitation byenhancement of forage quality) has been considered one of the most likely facilitationphenomena (ARSENAULT & OWEN-SMITH, 2002). However, more recognition should be given tothe effective mechanisms through which feeding facilitation operates (ARSENAULT & OWEN-SMITH, 2002). This thesis focuses on the mechanisms of feeding facilitation by the creation ofshort, supposedly high quality swards.Feeding facilitation by the creation of short, high quality swardsGrazing optimization hypothesisHow large grazers create nutritionally advantageous swards was first described in theSerengeti ecosystem (MCNAUGHTON, 1979; 1984): moderate grazing by large herbivores notonly reduced the height of the vegetation, but also stimulated re-growth. Therefore, biomassproduction and nitrogen concentration were enhanced. This was due to several plantcompensatory re-growth mechanisms that occur after defoliation (for an overview: seeMCNAUGHTON, 1983). Grazing might maintain the phenologically young plant stages leadingto a high nutrient concentration in leaf material; re-growth may be stimulated by grazingleading to increased biomass; tillering might be promoted, increasing shoot density; grazingmight reduce standing dead biomass (VAN DER GRAAF et al., 2005; TAHMASEBI KOHYANI et al.,2008). The low, high-productive and high-qualitative vegetation resulting from this processhas been named ‘grazing lawns’; the hypothesis predicting increased production and qualityof plants grazed at intermediate grazing pressures is called the ‘grazing optimizationhypothesis’ (e.g. VAN DER GRAAF et al., 2005). Although the positive effects of grazing orgrazing simulation on forage quality (COPPOCK et al., 1983; RUESS, 1984; CHENG & RITCHIE,2006) and forage availability (VAN DER GRAAF et al., 2005) have been observed, thishypothesis has been doubted by BELSKY (1986). At least, many factors may influence theeffect of grazing on plant productivity and quality, e.g. soil nutrient availability, shading,intensity and frequency of defoliation (MILCHUNAS et al., 1995). Also, simulated grazing mightresult in positive effects on only certain plant parts and the frequency of grazing or clippinginfluences the outcome (FOX et al., 1998).General introduction 5
Quality threshold hypothesisBy creating grazing lawns, large grazers promote the availability of high-qualityforage for other (smaller) herbivores. For allowing feeding facilitation of the type that westudied, these other herbivores should be sensitive for these short, high quality swards andshould preferentially forage in this type of vegetation (OLFF et al., 1997). These qualitysensitiveherbivores are typically smaller animals, as larger grazers tolerate lower plantnutrient concentration (but require greater plant abundance (OLFF et al., 2002)) and thus arenot very quality-sensitive. This phenomenon is expounded by DEMMENT & VAN SOEST (1984):the proportion of the metabolic needs and the capacity of the digestive system of largerherbivores is very low. As a result, these grazers can have relatively long retention times,and consequently digest low quality food very slowly, in order to acquire sufficient nutrients.Some large herbivores even developed the very efficient system of being ruminant. Smallherbivores have a very low capacity of the digestive system, and a very high metabolic need.As food is passing very quickly through their digestive tract, they should primarily feed onhigh quality plants to fulfil their metabolic needs.Quality-sensitive herbivores would therefore not forage in vegetation patches wherebiomass intake is maximized as was traditionally predicted by the Type II-functionalresponse (classical ‘exploitation theory’ - OKSANEN et al., 1981; LUNDBERG, 1988; LUNDBERG &ÅSTRÖM, 1990; GROSS et al., 1993). Instead, the medium-sized herbivores should forageaccording to a unimodal, dome-shaped Type IV functional response (BOS et al., 2002a;DURANT et al., 2003; DEKKER & VAN LANGEVELDE, 2007; VAN LANGEVELDE et al., 2008): as avegetation with a high standing crop would decrease in forage quality (see above), grossdaily food intake should decrease at higher vegetation biomass (PRINS & OLFF, 1998). The‘quality threshold hypothesis’ (OLFF et al., 1997; KUIJPER, 2004) predicts that the mediumsizedherbivore populations are rather controlled by bottom-up effects than by top-downeffects (predation - VAN DE KOPPEL et al., 1996; KUIJPER, 2004). The ‘green world’ hypothesis(HAIRSTON et al., 1960) predicts that terrestrial grazing herbivore populations are not limitedby their food supply and are generally controlled by predators. In contrast, the qualitythreshold hypothesis fits better in the ‘optimal foraging theory’ (BELOVSKY et al., 1999), whichpredicts animals to forage in order to optimize their fitness by a maximal net nutritionalintake, thereby coping with several constraints.6 Chapter 1
Factors influencing the occurrence of facilitationSeveral factors may influence the occurrence of facilitation by the creation of grazinglawns and its balance with competition in mammalian grazer assemblages. There might be atemporal (seasonal) trade-off between facilitation and competition (ARSENAULT & OWEN-SMITH, 2002, RUEDA et al., 2008) as forage maturation especially occurs during the growingseason (FRYXELL, 1991). Whether facilitation does occur or not also depends on the densityof the large grazers and of the facilitated grazers (BAKKER et al., <strong>2009</strong>). There should be anincrease of the importance of facilitation at declining density of the smaller grazers. Also,there should be an optimal difference between the body mass of the herbivores involved(PRINS & OLFF, 1998): when the difference is too large, smaller species are not expected tobenefit (e.g. KEESING, 1998; BAKKER et al., <strong>2009</strong>), while resource competition occurs whenthe difference is too small. This was especially shown in African grazers assemblages (PRINS& OLFF, 1998). In this case, a grazer with a large body mass was per definition a grazer with(relatively) lower energy and protein requirements and a higher capacity to ingest and digestthe vegetation. We could however doubt whether this relationship between body mass andthe occurrence of facilitation is universal, as feeding facilitation has been detected inassemblages of bison (Bison bison L.) and prairie dog (Cynomys ludovicianus ORD) (largedifference in body size - KRUEGER, 1986), Barnacle geese (Branta leucopsis BECHSTEIN) andhare (Lepus europaeus PALLAS) (small difference in body mass - STAHL et al., 2006). Finally,habitat productivity may be important for the balance between facilitation and competition inherbivore assemblages (CHENG & RITCHIE, 2006): facilitation by vegetation modification ismore likely in productive habitats (DEKKER & VAN LANGEVELDE, 2007).Examples of feeding facilitation in grazer assemblagesFeeding facilitation by limiting forage maturation has been mentioned to occur insome terrestrial herbivore assemblages. The most famous example is that of the migratorywildebeest (Connochaetes taurinus BURCHELL) and Thomson’s gazelle (Eudorcas thomsoniiGÜNTHER) in the Serengeti-Mara-ecosystem in Tanzania and Kenya (MCNAUGHTON, 1976; butsee SINCLAIR & NORTON-GRIFFITHS, 1982). Other examples in assemblages consisting only ofwild herbivores are bison (Bison bison L.) and prairie dog (Cynomys ludovicianus ORD)(KRUEGER, 1986), Barnacle geese (Branta leucopsis BECHSTEIN) and hare (Lepus europaeusPALLAS) (STAHL et al., 2006)). In North-Western Europe, the wild large grazers have mostlybeen replaced by livestock. Although the communities of domestic and wild herbivores haveGeneral introduction 7
not been co-evolving for a long time (as in the savannah-ecosystem (MCNAUGHTON, 1979)),feeding facilitation between domestic herbivores and wild herbivores has been observed aswell. Some examples are red deer (Cervus elaphus L.) and cattle (GORDON, 1988), geese andcattle (BOS et al., 2002b), hares and cattle (KUIJPER, 2004), rodents and sheep (AUSTRHEIM etal., 2007) and alpine reindeer (Rangifer tarandus L.) and sheep (MYSTERUD & AUSTRHEIM,2008).Also wild rabbits (Oryctolagus cuniculus L.) have been widely assumed to befacilitated by larger domestic grazers (e.g. WILLIAMS et al., 1974; WALLAGE-DREES, 1982;OOSTERVELD, 1983; DREES, 1989; DREES, 1998). However, supporting evidence is mainlyanecdotic or indirect. Descriptive field studies indicate a preference for swards of mediumplant standing crop (VAN DE KOPPEL et al., 1996) or find no consistent effect of largeherbivores on rabbits (OLFF & BOERSMA, 1998); more recent (field-)experimental studies atleast suggest the preference of the rabbit for shorter swards (IASON et al., 2002; BAKKER etal., <strong>2009</strong>).Aims of this researchIn this thesis, the assemblage of wild rabbits and introduced large grazers serve as amodel to gain insights in the occurrence and mechanisms of feeding facilitation by thecreation of grazing lawns. We focused on a limited number of aspects concerning feedingfacilitation in this grazer assemblage. First, we studied the effect of large herbivores andrabbits on vegetation (effects on vegetation structure, on vegetation composition and onfood quality for rabbits). Second, we studied some factors possibly determining the food andforaging choice of rabbits, with a focus on food quality and vegetation height.The main hypothesis of the research is that introduced large herbivores facilitaterabbits (medium-sized herbivores) by modification of the vegetation. This modificationinvolves creating short swards, creating denser (more productive) swards, creating swardsthat have a high food quality for rabbits and influencing vegetation composition. We expectthat these modifications are not completely independent from each other: shorter swards areexpected to have a higher food quality and to be more productive. This main hypothesis hasbeen subdivided into several partial hypotheses:• Large herbivores modify vegetation structure by grazing, thereby creating short anddense swards.• Medium-sized herbivores (represented by rabbits) preferentially forage in short swards.• These short swards are of a higher nutritional quality (for rabbits) than ungrazed swards.8 Chapter 1
• When foraging, food quality is an important factor determining the diet choices of therabbit.• Rabbits prefer the short swards created by large herbivores because of the highernutritional value of these swards.• Rabbits are able to create short and high qualitative swards, thereby facilitatingthemselves.• Large herbivores can modify vegetation composition. This has an influence on rabbits asthey prefer certain plants species above others when foraging.We therefore performed several research projects with different levels of environmentalcontrol. We performed field observations in two coastal dune areas (IJzermonding and DuneFossile de Ghyvelde - see “Study areas and large herbivores”). Here, herbivore assemblagesconsisting of rabbits and large grazers were studied to obtain information about:o the possibility of vegetation modification (vegetation structure, vegetationcomposition, food quality for rabbits) by the large herbivoreso the occurrence of facilitation in these communitieso plants species selection by rabbits (when foraging)As these dune areas are structurally very heterogeneous, there was a need for another studyarea were a semi-controlled field experiment could be performed. This study area wasPuyenbroeck (see “Study areas and large herbivores”). In this area, it was possible toexperimentally study preferences of rabbits for certain sward heights, because of:o the straight forest borderso the relatively flat reliefo the large surface of a homogeneous and relatively simple vegetationcomposition and structureo the presence of large rabbit populationso the possibility to easily control vegetation height by mowing machines.Finally, also entirely controlled experiments in laboratory conditions were performed to studydiet preferences of rabbits when controlling for vegetation height, but not for food quality.General introduction 9
Outline of the thesisThe following chapters of this thesis describe the research that was conductedin order to test the hypotheses or parts of the hypotheses mentioned above, including onemethodological chapter.Chapter 2 describes the results of a six-year exclosure study in the coastal dunenature reserves the IJzermonding and Ghyvelde. The exclosures had three treatments:accessibility for all herbivores (large grazers included), accessibility for rabbit but not forlarge grazers, and no accessibility to rabbits and large grazers. Several vegetationcharacteristics were measured in subsequent periods, in order to learn more about theinfluence of the different herbivore combinations on vegetation structure and vegetationcomposition. The possible importance of different grazer combinations for these dunegrasslands will be discussed.Chapter 3 examines the expected preference of rabbits for short swards. A mowingexperiment, simulating extreme large grazer impact on vegetation sward, was conducted intwo flat, monotonous lawns in the Flemish Provincial Domain ‘Puyenbroeck’ (Wachtebeke,Belgium). Short and high sward strips were created by differential mowing. We evaluated theuse of the short and high strips by the wild rabbits in this study area. The second part of thischapter tests the preference of rabbits in Ghyvelde and IJzermonding for plots that had beengrazed by the large herbivores in this area. Vegetation height and vegetation quality ofgrazed and ungrazed plots was measured.Chapter 4 experimentally tests whether rabbits prefer high-quality forage. As swardheight and food quality can be correlated under natural conditions, we experimentallyeliminated differences in sward height between swards of different quality and offered theplants to some rabbits during a controlled feeding trial. Originally, we planned a full factorialexperiment in which also swards of different height, but with equal food quality, wereoffered to the rabbits. However, as the short and long swards did not prove to have a similarfood quality, these data could not be used for statistical analysis. Therefore, this part of theexperiment was omitted from Chapter 4.Chapter 5 is a methodological study, checking the use of epidermal plant fragmentsin rabbit pellets to determine the diet composition of rabbits. The method has severaladvantages, but some limitations have been mentioned in the past. So we performed afeeding trial with rabbits to compare the known diet with the results obtained by faecalanalysis. The main goal of the study was to find out whether the diet composition can be10 Chapter 1
eliably derived from faecal analysis (despite problems of differential digestion). The methodof faecal analysis was used for the research described in Chapter 6.Chapter 6 is a field study that compares the diet of wild rabbits in Ghyvelde (by usingfaecal analysis) with the availability of food plants in the study area. We tested whether foodpreferences of rabbits would occur on the plant species level. Plant quality was considered asa possible explanatory variable for diet preference.Chapter 7 synthesizes the results of the previous chapters. The results arecommented within the framework of feeding facilitation. The hypotheses of the thesis areconfronted with the field observations and experimental results.Description of the ecological model systems used in this researchThe wild rabbitThe wild rabbit is one of the approximately 40 contemporary living species of thefamily Leporidae. This family comprises all rabbit and hare species. The Leporidae belong tothe order of Lagomorpha, which is part of the class of Mammalia (CORBET, 1994).After the last glacial, rabbits were withdrawn to Spain and South-Western France(TACK et al., 1993). The Romans introduced the rabbits in Italy, but especially abbeys andconvents are responsible for the large-scale distribution in Western-Europe during the MiddleAges (TACK et al., 1993). The monks domesticated the animals (ROGERS et al., 1994), andfrom the 2 nd half of the Middle Ages (10 th -11 th century), they were kept in large parks, also inFlanders (DREES et al., 2007) and Northern French coastal dune areas (TERMOTE, 1992). Theirpopulations expanded, partly caused by destruction of their predators by hunters (ROGERS etal., 1994). This expansion was stopped in the 1950’s when the disease myxomatosis wassuccessfully introduced in Europe (LOCKLEY, 1976). Originally, 99% of the animals died fromthe disease; nowadays, only 50% of the ill animals die (PROVOOST & BONTE, 2004). However,the rabbit populations now suffer from the outbreak of RHD (Rabbit Haemorrhagic Disease -VANDEKERCHOVE & PEETERS, 2002) and are generally supposed to be small nowadays (JANSSEN,2004; DREES et al., 2007).Rabbits are medium-sized hindgut fermenters (DEMMENT & VAN SOEST, 1984); theirmedium-sized statue forces them to feed on high qualitative, quickly digestible forage. As aconsequence of the quick digestion of these animals, some nutrients are lost through theirfaeces, which is partly compensated by caecotrophy (DEMMENT & VAN SOEST, 1984): rabbitsare known to re-ingest soft faeces, directly after excretion and directly from the anusGeneral introduction 11
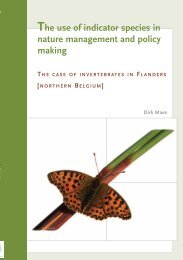
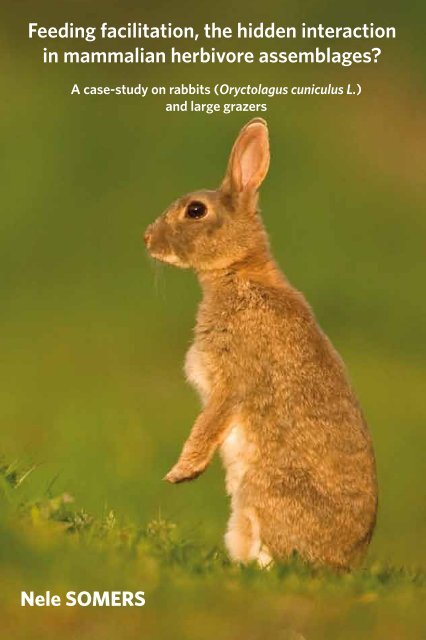
(HIRAKAWA, 2001). The two types of pellets (hard and soft faeces) are formed by aseparation mechanism in the proximal colon. During hard faeces excretion, water-solublesubstances and fine particles (including micro-organisms) from the colon are brought back tothe caecum by means of antiperistaltic movements. During soft faeces formation, the motilityof the caecal base and proximal colon decrease and the caecal contents are covered by amucous envelope (CARABAŃO & PIQUER, 1998). So the difference between the soft and hardfaeces is not due to the food having passed once or twice (HIRAKAWA, 2001), as is sometimesmisinterpreted.Study areas and large herbivoresThe field work of this thesis was conducted in two coastal dune areas (Figure 1): theFlemish Nature Reserve ‘IJzermonding’ (Nieuwpoort, Belgium; 51°9’4” N, 2°43’57” E;managed by the Agency for Nature and Forest (ANB) of the Flemish Government) and theFrench Nature Reserve ‘Dune Fossile de Ghyvelde’ (Ghyvelde, France, 51°2’48” N, 2°33’02”E; managed by Conservatoire du Littoral); they are ca. 25 km apart. The nearness of theNorth Sea mitigates climatological extremes in these areas (mild winters and mild summers).In addition, relief, exposition and the oligotrophic, porous and quickly warming sandysubstrate create microclimatological differentiation, resulting in a wide variety of abioticconditions and communities. The area of the original open coastal dune landscape has beenreduced drastically by man (PROVOOST & BONTE, 2004). Since the abandonment of agropastoraluse of the coastal landscape since the mid 20th century, a general encroachment ofscrub and monospecific rough grasslands is taking place, leading to a general loss ofbiodiversity of blond dune, grey dune and dry dune grassland communities. One of thenature management measures taken for this reason was large-scale cutting of scrubs andthe consecutive introduction of large herbivores. Grazing by large grazers in the study areasstarted between 1996 and 1999, in order to prevent further encroachment of shrubs andcompetitive grass species. A large variety of herbivore species were used for this purposeand at different sites: at the two study sites, these are sheep (Mergelland sheep, Ovis ariesL.) in the IJzermonding and horses (Haflinger pony, Equus caballus L.) in Dune Fossile deGhyvelde (Table 1). Sheep are ruminant grazers, having a very efficient digestion, enablingthem to forage on lower quality plants (DEMMENT & VAN SOEST, 1984). The horses can beconsidered large bulk feeders. They are not ruminants, but large hindgut fermenters, with along retention time, allowing them to feed on low quality food (DEMMENT & VAN SOEST, 1984).12 Chapter 1
Besides, wild rabbits are the most important “natural” grazers in the study sites, althoughthey appear at different densities at the two study sites.Figure 1: This map indicates the position of the two coastal dune study sites (IJzermonding and DuneFossile de Ghyvelde) and a few other important (grazed) nature reserves in the Belgian and northernFrench coastal dune area.Area Large herbivores Introduced Grazed Grazing regimein surfaceIJzermonding 5-25 Mergelland sheepuntil 2003 accompanied by 3-4 goats1999 5-10 ha winter grazing(August - March)Dune Fossile deGhyvelde10-15 Haflinger horses 1996 75 ha year round grazingTable 1: Introduction of large herbivores in the study areas (according to HOFFMANN et al., 2005) withindications on grazer densities and grazing regime.In each of these areas, we selected a dry dune grassland, neighbouring a scrubvegetation of Hippophae rhamnoides (IJzermonding) or Ligustrum vulgare (Ghyvelde). Thesegrasslands have a sandy substrate that is originally calcareous. This is still the case in theGeneral introduction 13
elatively young dunes of the IJzermonding that are situated very close to the coast. In DuneFossile de Ghyvelde, situated at ca. 3 km from the coast line and of older age (BAETEMAN,2001) compared to the IJzermonding, local decalcification of the substrate resulted inmoderately acid conditions (TAHMASEBI KOHYANI, 2008).Vegetation composition in the two dry grasslands differ as follows (based onHOFFMANN et al. (2005), combined with personal observations). A grey dune-like pioneervegetation on a young dune area that was artificially flattened some fifty years ago and witha still very limited organic top soil layer, characterizes the dry IJzermonding dune grassland.The vegetation can be classified as a Tortulo-Koelerion (Phleo-Tortuletum ruraliformis,SCHAMINÉE et al., 1996). It contains several annual and biennial plant species (e.g. Cerastiumsemidecandrum, Phleum arenarium, Crepis capillaris), accompanied by some perennials (likeSedum acre) and some smaller graminoid species (e.g. Festuca rubra, Carex arenaria).Stabilisation of the substrate results in dense moss patches, dominated by Homalotheciumlutescens and Tortula ruralis var. ruraliformis, in which also other annual species as Myosotisramosissima, Veronica arvensis, Arenaria serpyllifolia and perennial herbs like Galium verumappear. Some parts of the grassland have been overgrown by increasingly dominantCalamagrostis epigejos and Hippophae rhamnoides.As mentioned before, the grassland in Ghyvelde is fundamentally different from thegrassland in the IJzermonding by its acid soil. The vegetation can be assigned to thePlantagini-Festucion (Festuco-Galietum veri, SCHAMINÉE et al., 1996) and Corynephorioncanescentis (Violo-Corynephoretum, SCHAMINÉE et al., 1996). More or less acidophytic mossspecies (e.g. Dicranum scoparium, Polytrichum juniperinum) and lichens dominate largesurfaces. Carex arenaria, Anthoxanthum odoratum, Luzula campestris and Rumex acetosellaare the more important herb and grass species, accompanied by, for example, Viola curtisiiand Mibora minima. The dominant shrub species here is Ligustrum vulgare.The semi-controlled mowing experiment was carried out in another study area (seeabove): ‘Puyenbroeck’. The Flemish Provincial Domain Puyenbroeck (Wachtebeke, Belgium,51°9’11” N, 3°52’43” E) is managed by the Provincial Government East-Flanders. The area issituated ca. 75 km W from Nieuwpoort. At this site, wild rabbits are the dominant naturalgrazers (absence of large grazers). We selected two flat, monotonous lawns in the studyarea Puyenbroeck, both bordered by a Poplar plantation and mown at regular intervals.14 Chapter 1
ReferencesARSENAULT, R. & N. OWEN-SMITH (2002). Facilitation versus competition in grazing herbivoreassemblages. Oikos 97: 313-318.AUSTRHEIM, G., A. MYSTERUD, K. HASSEL, M. EVJU & R.H. ØKLAND (2007). Interactions between sheep,rodents, graminoids, and bryophytes in an oceanic alpine ecosystem of low productivity.Ecoscience 14: 178-187.BAETEMAN, C. (2001). The Holocene development of De Moeren and the Inland Dunes (Westerncoastal plain of Belgium). Excursiegids Field Meeting 2nd June 2001 to the Western CoastalPlain, De Moeren and Inland Dunes. Belgian Geological Survey.BAKKER, E.S., H. OLFF & J.M. GLEICHMAN (<strong>2009</strong>). Contrasting effects of large herbivore grazing on smallerherbivores. Basic and Applied <strong>Ecology</strong> 10: 141-150.BEGON, M., J.L. HARPER & C.R. TOWNSEND (1990). <strong>Ecology</strong>. Individuals, populations and communities.Second edition. Blackwell Scientific Publications: 945 pp.BELOVSKY, G.E., J. FRYXELL & O.J. SCHMITZ (1999). Natural selection and herbivore nutrition: optimalforaging theory and what it tells us about the structure of ecological communities. In: JUNG,H.J.G. & G.C. FAHEY (eds), Nutritional <strong>Ecology</strong> of Herbivores. Proceedings of the VthInternational Symposium on the Nutrition of Herbivores. American Society of Animal Science,Savoy, Illinois, USA: 1-70.BELSKY, A.J. (1986). Does herbivory benefit plants? A review of the evidence. The American Naturalist127: 870-892.BOS, D., J. VAN DE KOPPEL, & F.J. WEISSING (2002a). Brent Geese aggregate to cope with increased levelsof primary production. In BOS, D., Grazing in coastal grasslands, Brent Geese and facilitation byherbivory, <strong>PhD</strong> dissertation, Rijksuniversiteit Groningen, Groningen, the Netherlands: 85-106.BOS, D., M. LOONEN, M. STOCK, F. HOFEDITZ, S. VAN DER GRAAF & J.P. BAKKER (2002b). Utilisation ofWadden Sea salt marshes by geese in relation to livestock grazing. In BOS, D., Grazing incoastal grasslands, Brent Geese and facilitation by herbivory, <strong>PhD</strong> dissertation, RijksuniversiteitGroningen, Groningen, the Netherlands:131-153.CARABAŃO, R. & J. PIQUER (1998). The digestive System of the Rabbit. In DE BLAS, C. & J. WISEMAN J(eds), The nutrition of the rabbit, CABI Publishing, Wallingford, UK: 1-16.CHENG, E. & M.E. RITCHIE (2006). Impacts of simulated livestock grazing on Utah prairie dogs (Cynomysparvidens) in a low productivity ecosystem. Oecologia 147: 546-555.COPPOCK, D.L., J.K. DETLING, J.E. ELLIS & M.I. DYER (1983). Plant-herbivore interactions in a North-American mixed-grass prairie. I. Effects of black-tailed prairie dogs on intraseasonalaboveground plant biomass and nutrient dynamics and plant species diversity. Oecologia 56: 1-9.CORBET, G.B. (1994). Chapter 1. Taxonomy and origins. In THOMPSON, H.V. & C.M. KING (eds), TheEuropean rabbit. The history and biology of a successful colonizer. Oxford University Press: 1-7.General introduction 15
DEKKER, J.J.A. & F. VAN LANGEVELDE (2007). Plant productivity and free-ranging herbivores impact spatialforaging patterns and population dynamics of refuge-living herbivores. In: DEKKER, J.J.A.,Rabbits, refuges and resources. How foraging of herbivores is affected by living in burrows. <strong>PhD</strong>dissertation, Wageningen <strong>Universiteit</strong>, Wageningen, the Netherlands: 65-84.DEMMENT, M.W. & P.J. VAN SOEST (1985). A nutritional explanation for body-size patterns of ruminantand nonruminant herbivores. The American Naturalist 125: 641-672.DREES, M, H. GODDIJN, S. BROEKHUIZEN, J. DEKKER & D. KLEES (2007). Wilde konijnen. KNNV Uitgeverij,Zeist, the Netherlands, 93 pp.DREES, M. (1989). Konijnen als grazers. Duin 12: 156-158.DREES, M. (1998). Langoor. Over konijnen en vegetatie in de duinen. Duin 21: 4-6.DURANT, D., H. FRITZ, S. BLAIS & P. DUNCAN (2003). The functional response in three species ofherbivorous Anatidae: effects of sward height, body mass and bill size. Journal of Animal<strong>Ecology</strong> 72: 220-231.FARNSWORTH, K.D., S. FOCARDI & J.A. BEECHAM (2002). Grassland-herbivore interactions: how do grazerscoexist? The American Naturalist 159: 24-39.FOX, A.D., J.N. KRISTIANSEN, D.A. STROUD & H. BOYD (1998). The effect of simulated spring goosegrazing on the growth rate and protein content of Phleum pratense leaves. Oecologia 116: 154-159.FRYXELL, J.M. (1991). Forage quality and aggregation by large herbivores. The American Naturalist138:478-498.GORDON, I.J. (1988). Facilitation of red deer grazing by cattle and its impact on red deer performance.Journal of Applied <strong>Ecology</strong> 25: 1-10.GROSS, J.E., L.A. SHIPLEY, N.T. HOBBS, D.E. SPALINGER & B.A. WUNDER (1993). Functional response ofherbivores in food-concentrated patches: tests of a mechanistic model. <strong>Ecology</strong> 74: 778-791.HAIRSTON, N.G., F.E. SMITH & L.B. SLOBODKIN (1960). Community structure, population control andcompetition. The American Naturalist 94: 421-425.HIRAKAWA, H. (2001). Coprophagy in leporids and other mammalian herbivores. Mammal Review 31:61-80.HOFFMANN, M., BONTE, D., COSYNS, E., CRIEL, P., MAELFAIT, J.-P., PROVOOST, S., SOMERS, N. & STRUYVE, T.,2005. Evaluatie Begrazing Kustduinen, 1997-2004. Onderzoek en evaluatie van de biologischegevolgen van acht jaar begrazing in de Vlaamse Westkustreservaten. <strong>Ghent</strong>, <strong>Ghent</strong> Universityand Brussels, Instituut of Nature Conservation, under the authority of AMINAL, Dept. Nature,447 pp.IASON, G.R., T. MANSO, D.A. SIM & F.G. HARTLEY (2002). The functional response does not predict thelocal distribution of European Rabbits (Oryctolagus cuniculus) on grass swards: experimentalevidence. Functional <strong>Ecology</strong> 16: 394-402.JANSSEN, M. (2004). Op de bres voor het konijn. Duin 27: 3-4.KEESING, F. (1998). Impacts of ungulates on the demography and diversity of small mammals incentral Kenya. Oecologia 116: 381-389.16 Chapter 1
KRUEGER, K. (1986). Feeding relationships among bison, pronghorn, and prairie dogs: an experimentalanalysis. <strong>Ecology</strong> 67: 760-770.KUIJPER, D.P.J. (2004). Small herbivores losing control. Plant-herbivore interactions along a naturalproductivity gradient. <strong>PhD</strong> dissertation, Rijksuniversiteit Groningen, Groningen, the Netherlands.KUIJPER, D.P.J., P. BEEK, S.E. VAN WIEREN & J.P. BAKKER (2008). Time-scale effects in the interactionbetween a large and a small herbivore. Basic and Applied <strong>Ecology</strong> 9: 126-134.LOCKLEY, R.M. (1976). The private life of the rabbit. Het Spectrum, Utrecht, the Netherlands, 179pp.LUNDBERG, P. & M. ASTRÖM (1990). Functional response of optimally foraging herbivores. Journal ofTheoretical Biology 144: 367-377.LUNDBERG, P. (1988). Functional response of a small mammalian herbivore: the disc equation revisited.Journal of Animal <strong>Ecology</strong> 57: 999-1006.MCNAUGHTON, S.J. (1976). Serengeti migratory wildebeest: facilitation of energy flow by grazing.Science 191: 92-94.MCNAUGHTON, S.J. (1979) Grazing as an optimization process: grass-ungulate relationships in theSerengeti. The American Naturalist 113: 691-703.MCNAUGHTON, S.J. (1983) Compensatory plant growth as a response to herbivory. Oikos 40: 329-336.MCNAUGHTON, S.J. (1984) Grazing lawns: animals in herds, plant form and co-evolution. The AmericanNaturalist 124: 863-886.MILCHUNAS, D.G., A.S. VARNAMKHASTI, W.K. LAUENROTH & H. GOETZ (1995). Forage quality in relation tolong-term grazing history, current-year defoliation, and water resource. Oecologia 101: 366-374.MYSTERUD, A. & G. AUSTRHEIM (2008). The effect of domestic sheep on forage plants of wild reindeer; alandscape scale experiment. European Journal of Wildlife Research 54: 461-468.OKSANEN, L., S.D. FRETWELL, J. ARRUDA & P. NIEMELÄ (1981). Exploitation ecosystems in gradients ofprimary productivity. The American Naturalist 118: 240-261.OLFF, H. & S.F. BOERSMA (1998). Langoor. Lange termijn veranderingen in de konijnenstand vanNederlandse duingebieden. Oorzaken en gevolgen voor de vegetatie. LandbouwuniversiteitWageningen, Leerstoelgroep Natuurbeheer en Plantenoecologie, Wageningen, the Netherlands.OLFF, H., J. DE LEEUW, J.P. BAKKER, R.J. PLATERINK, H.J. VAN WIJNEN & W. DE MUNCK (1997). Vegetationsuccession and herbivory in a salt marsh: changes induced by sea level rise and silt depositionalong an elevational gradient. Journal of <strong>Ecology</strong> 85: 799-814.OLFF, H., M.E. RITCHIE & H.H.T. PRINS (2002). Global environmental controls of diversity in largeherbivores. Nature 415: 901-904.OOSTERVELD, P. (1983). Eight years of monitoring of rabbits and vegetation development onabandoned arable fields grazed by ponies. Acta Zoologica Fennica 174: 71-74.PRINS, H.H.T. & H. OLFF (1998). Species-richness of African grazer assemblages: towards a functionalexplanation. In: NEWBERY, D.M., H.H.T. PRINS & N. BROWN (eds), Dynamics of TropicalCommunities, 37th Symposium of The British Ecological Society, Blackwell Science, UK: 449-490.General introduction 17
PROVOOST, S. & D. BONTE (2004). Levende duinen: een overzicht van de biodiversiteit aan de Vlaamsekust. Mededelingen van het Instituut voor Natuurbehoud 22, Brussel, 420 pp.ROGERS, P.M., C.P. ARTHUR & R.C. SORIGUER (1994). Chapter 3. The rabbit in continental Europe. InTHOMPSON, H.V. & C.M. KING (eds), The European rabbit. The history and biology of a successfulcolonizer. Oxford University Press: 22-62.RUEDA, M., S. REBOLLO, L. GÁLVEZ-BRAVO & A. ESCUDERO (2008). Habitat use by large and smallherbivores in a fluctuating Mediterranean ecosystem: implications of seasonal changes. Journalof Arid Environments 72: 1698-1708.RUESS, R.W. (1984). Nutrient movement and grazing: experimental effects of clipping and nitrogensource on nutrient uptake in Kyllinga nervosa. Oikos 43: 183-188.SCHAMINÉE, J.H.J., A.H.F. STORTELDER & E.J. WEEDA (1996). De Vegetatie van Nederland. Deel 3.Plantengemeenschappen van graslanden, zomen en droge heiden. Opulus Press, Uppsala,Leiden, 356 pp.SINCLAIR, A.R.E. & M. NORTON-GRIFFITHS, M. (1982). Does competition or facilitation regulate migrantungulate populations in the Serengeti? A test of hypotheses. Oecologia 53: 364-369.STAHL, J., A.J. VAN DER GRAAF, R.H. DRENT & J.P. BAKKER (2006). Subtle interplay of competition andfacilitation among small herbivores in coastal grasslands. Functional <strong>Ecology</strong> 20: 908-915.TACK, G., P. VAN DEN BREMT & M. HERMY (1993). Bossen van Vlaanderen. Een historische ecologie.Uitgeverij Davidsfonds, Leuven, Belgium, 320 pp.TAHMASEBI KOHYANI, P. (2008). Grazer induced changes in dry, low-productive grassland plantcommunities. <strong>PhD</strong> dissertation, U<strong>Gent</strong>, <strong>Ghent</strong>, Belgium, 136 pp.TAHMASEBI KOHYANI, P., B. BOSSUYT, D. BONTE & M. HOFFMANN (submitted). Plant performance plasticity asa mechanism of grazing tolerance.TERMOTE, J. (1992). Wonen op het duin. De bewoningsgeschiedenis van het duingebied tot aan deFranse revolutie. In TERMOTE, J. (eds), Tussen land en zee. Het duingebied van Nieuwpoort totDe Panne, Lannoo, Tielt, Belgium: 46-87.VAN DE KOPPEL, J., J. HUISMAN, R. VAN DER WAL & H. OLFF (1996). Patterns of herbivory along aproductivity gradient: an empirical and theoretical investigation. <strong>Ecology</strong> 77: 736-745.VAN DER GRAAF, A.J., D. BOS, M.J.J.E. LOONEN, M. ENGELMOER & R.H. DRENT (2002). Short and long-termfacilitation of goose grazing by livestock. In BOS, D., Grazing in coastal grasslands, Brent Geeseand facilitation by herbivory, <strong>PhD</strong> dissertation, Rijksuniversiteit Groningen, Groningen, theNetherlands:63-83.VAN DER GRAAF, A.J., J. STAHL & J.P. BAKKER (2005). Compensatory plant growth of Festuca rubra aftergrazing: can migratory herbivores increase their own harvest during staging? Functional <strong>Ecology</strong>19: 961-969.VAN LANGEVELDE, F., M. DRESCHER, I.M.A. HEITKÖNIG & H.H.T. PRINS (2008). Instantaneous intake rate ofherbivores as function of forage quality and mass: effects on facilitative and competitiveinteractions. Ecological Modelling 213: 273-284.VANDEKERCHOVE, D. & J.E. PEETERS (2002). Onderzoek naar ziektes bij wilde konijnen in het Vlaamse18 Chapter 1
gewest. CODA-CERVA, Belgium.WALLAGE-DREES, J.M. (1988). Rabbits in coastal sand dunes; weighed and counted. <strong>PhD</strong> dissertationUniversity of Leiden, Leiden, the Netherlands.WILLIAMS, O.B., T.C.E. WELLS & D.A. WELLS (1974). Grazing management of Woodwalton fen: seasonalchanges in the diet of cattle and rabbits. Journal of Applied <strong>Ecology</strong> 11: 499-516.General introduction 19
Mergelland sheep (IJzermonding, 2005) Exclosure (IJzermonding, 2001)Exclosure (Dune Fossile de Ghyvelde, 2005) Haflinger horses (Dune Fossile de Ghyvelde, 2004)(Photographs by N. <strong>Somers</strong>)20
CHAPTER 2The effect of rabbits(Oryctolagus cuniculus L.)and large herbivores on dry dune grasslandstructure and composition<strong>Nele</strong> <strong>Somers</strong>, Katrien De Maeyer, Beatrijs Bossuyt, Luc Lens & Maurice Hoffmann21
AbstractThe wild rabbit (Oryctolagus cuniculus L.) has often been mentioned as an important speciesfor vegetation structure and composition in European coastal dune landscapes, throughconsumption of plants, digging, latrines, zoochory and effects on below-ground biota. Thisstudy focuses on grazing and digging effects of rabbits, when in combination with largeherbivores. An exclosure experiment was carried out to measure the effect of rabbits and thecombination of large herbivores and rabbits on vegetation structure and composition in twodifferent coastal dune areas. We hypothesized that progressively excluding grazers wouldlead to a more rough vegetation structure (higher vegetation, higher litter cover, higher baresoil cover, expansion of shrubs and competitive graminoids, leading to a decline of annualplant species and mosses). We expected these structural differences to result in changes invegetation composition, due to competitive effects and changing possibilities forgermination. In all cases, the combination of rabbits and large grazers as well as rabbitswithout large grazers were able to diminish vegetation height and litter cover. Additionally,rabbits created bare soil patches, giving extra structural diversity. Through these structuralimpacts, grazer activity maintained plant species diversity in only one of the study areas. Theeffect of rabbits on vegetation was smaller than the combined effect of rabbits and largegrazers. Therefore, it is concluded that rabbit presence is not sufficient to stop succession ofthe open, species rich dune grassland to rough grass or shrub dominated, species poorgrassland. Because of the added effect of digging activity of rabbits, a combination ofgrazing by large herbivores and rabbits is the best grazing management option for thesecoastal dune areas.22 Chapter 2
IntroductionSince maintaining plant diversity is a central goal in the management of biodiversitythroughout the world (OLFF & RITCHIE, 1998), the effect of herbivores on the vegetationdeserves our attention, even when it concerns medium-sized herbivores. Different herbivorespecies may have different effects and assemblages of different herbivores may havecompensatory or additive effects (RITCHIE & OLFF, 1997). In this study we will specificallyfocus on the effect of grazing and digging activity of the rabbit (Oryctolagus cuniculus L.),both separately and in combination with large herbivore grazing.The wild rabbit is often considered to be an important species for vegetation (LEES &BELL, 2008): DREES (1989, 1998), DE BRUIJN (1991) and VAN DER HAGEN (1994) stated thatrabbits would be necessary to preserve the general structural and compositional diversity ofcoastal dune vegetation in the Netherlands. Variation in rabbit density in space and in time isan important environmental factor in a dune area (ZEEVALKING & FRESCO, 1977). Also inFlanders, moderate rabbit grazing was shown to be positive for dune grassland conservation(VAN STEERTEGEM, 1982). Rabbits influence vegetation by different mechanisms, of whichgrazing is the most direct mechanism. Herbivores are generally thought to enhance plantdiversity by direct consumption of competitively dominant plant species, causing diminishedcompetition for less competitive species (OLFF & RITCHIE, 1998). The second mechanism isdigging: soil disturbances can be created, thereby enhancing possibilities for (ruderal,annual) plants to colonize and establish themselves (OLFF & RITCHIE, 1998). Third, grazing atselected sites and dunging at others causes nutrient re-distribution: rabbit pellets have beenshown to locally fertilize the vegetation via latrines (WILLOT et al., 2000). Latrines makesignificant localised contributions to soil fertility and may therefore be important inestablishing and maintaining plant cover. Zoochory is a fourth mechanism: seeds can survivethe rabbit gut, hence enabling plants to be dispersed by the rabbits (PAKEMAN et al., 2002;COSYNS et al., 2005). Finally, it has been described that rabbits can structure below-groundbiota. WEARN & GANGE (2007) showed that moderate grazing by rabbits had a rapid andpersistent positive effect on mycorrhizal colonization of the roots of three grass species.Rabbit grazing was found to diminish vegetation height (THOMAS, 1960; RANWELL,1960; VAN STEERTEGEM, 1982), resulting in a decreasing the cover of litter (accumulation ofdead plant biomass - VAN STEERTEGEM, 1982; BAKKER et al., 2003b). Litter accumulation inungrazed situations was observed to lead to decreased moss cover (TEN HARKEL & VAN DERMEULEN, 1995) and a decrease of the cover of annual grasses and forbs (TEN HARKEL & VANDER MEULEN, 1995). Shrub enhancement can be retarded by rabbit grazing (WATT, 1957;Impact on vegetation 23
THOMAS, 1960; BAKKER et al., 2004b). Also, rabbits create bare soil patches (VAN STEERTEGEM,1982; TEN HARKEL & VAN DER MEULEN, 1995; BAKKER & OLFF, 2003). These structural changes invegetation caused by rabbits, combined with their selective grazing behaviour (Chapter 6)could lead to alterations in species composition of the grasslands. Grazing can cause a shiftin plant composition towards an annual life history and an increasing relative abundance offorbs and annual grasses in dune grasslands (TAHMASEBI KOHYANI, 2008). This is partiallydepending on the individual plant tolerance to herbivory and on competitive relationsbetween competitive plant species and subordinate species: small annual plants can bereleased from competition when highly competitive grasses are suppressed by grazing ordigging. An enhancement of thick grass layers when excluding rabbits has indeed beenobserved (WATT, 1957; VAN DER HAGEN, 1994), as well as negative changes in speciescomposition (decreasing diversity, ZEEVALKING & FRESCO, 1977; VAN STEERTEGEM, 1982). Thesetrends are not universal: the variation in rabbit density (ZEEVALKING & FRESCO, 1977; VANSTEERTEGEM, 1982), soil conditions (WATT, 1962; TAHMASEBI KOHYANI, 2008) and productivity(BAKKER et al., 2006) can also be critical factors in an ecosystem, affecting the extent of theeffect of grazing on vegetation.After the collapse of the rabbit populations following the introduction of myxomatosisin 1952 (LOCKLEY, 1976), there was a lot of interest in studying the effects of rabbits onvegetation in Western Europe. WATT (1957; 1962) studied the impact of rabbit grazing byusing exclosures; ZEEVALKING & FRESCO (1977) compared plots with variable degrees of rabbitgrazing; several authors (RANWELL, 1960; THOMAS, 1960; WHITE, 1961; THOMAS, 1963) usedthe advent of myxomatosis as a kind of “natural experiment”, analysing the changes in thevegetation after the disease caused a major crash of the rabbit populations. Little is knownabout whether rabbits nowadays are still important in dune grasslands. The rabbitpopulations are generally supposed to be small nowadays, partly as a consequence of theoutbreak of RHD (Rabbit Haemorrhagic Disease - VANDEKERCHOVE & PEETERS, 2002; JANSSEN,2004). Also, there is a recent trend of introducing large herbivores in nature reserves(HOFFMANN et al., 2005) and the question is raised whether the presence of rabbits hasbecome superfluous for the conservation of the dune grassland structure and composition.Recent studies of BAKKER (2003) in the Netherlands suggest that this is not the case in analluvial plain grassland situation in the Netherlands: a combination of cattle and rabbitswould be the best grazer combination to enhance species as well as structural diversity.This paper describes a similar study, carried out in two different coastal dune areasalong the Belgian and Northern French coast, which are grazed by rabbits on the one hand,and sheep or horses on the other. The areas differ significantly in soil pH (largely due to24 Chapter 2
differences in calcium concentration of the soil) and associated age, leading to differentkinds of grassland types, belonging to respectively Tortulo-Koelerion (Phleo-Tortuletumruraliformis, SCHAMINÉE et al., 1996) and Plantagini-Festucion (Festuco-Galietum veri,SCHAMINÉE et al., 1996). We hypothesize that the rabbit is a crucial species for the vegetationin these dry sand dune areas: rabbit grazing is expected to cause a lower vegetation height,a higher bare soil cover, a decrease in shrub cover and a decrease of litter cover. Wehypothesize that these effects lead to a shift in vegetation composition, whereby perennialgrasses cover decreases, thereby promoting annual plant species and moss cover, whichwould eventually lead to a higher number of species in the vegetation. We furtherhypothesize that rabbit impact is quite similar to the combined impact of large grazers andrabbits and that rabbit impact is largely similar in both areas, despite their large soilconditional differences and different accompanying large herbivores.Materials & MethodsStudy areaExclosure experiments were conducted in coastal dune grasslands at the FlemishNature Reserve ‘IJzermonding’ (Nieuwpoort, Belgium; 51°9’4” N, 2°43’57” E; managed byANB, Flemish Government) and the French Nature Reserve ‘Dune Fossile de Ghyvelde’(Ghyvelde, France, 51°2’48” N, 2°33’02” E; managed by Conservatoire du Littoral). Bothsites were located ca. 25 km apart from each other. At both sites, wild rabbits comprise thedominant natural grazers while large domestic herbivores are used for grazing management(IJzermonding: Mergelland sheep, Ovis aries L.; Ghyvelde: Haflinger pony, Equus caballusL.). More information about these dune areas and the introduced large grazers can be foundin Chapter 1.Exclosure-experimentBetween August 1999 - April 2000, a total of five exclosures (each consisting of threetreatments of 350 x 350 cm) were set up along shrub-grassland edges in coastal dunegrasslands at IJzermonding and Ghyvelde (Figure 1). Within each exclosure treatment, six 75x 75 cm permanent quadrates (pqs) were delineated and assigned to one of the threetreatments: (i) larger herbivores, rabbits and smaller herbivores allowed (L+R+S); (ii) largerherbivores excluded (R+S); (iii) larger herbivores and rabbits excluded (S). L+R+SImpact on vegetation 25
treatments were not fenced, R+S treatments were fenced with non rabbit-proof wire, Streatments were fenced with rabbit-proof wire.Figure 1: Schematic presentation of one exclosure-group. Each group is positioned near shrubs andconsists of one L+R+S-treatment (accessible to all herbivores), one R+S-treatment (accessible torabbits and smaller herbivores, not to larger herbivores) and one S-treatment (accessible to smallherbivores but not to rabbits and larger herbivores). Six pqs of 75 cm by 75 cm are marked off withineach treatment.Vegetation measurements in all pqs were carried out four times: spring 2000 (April2000), summer 2000 (June – September 2000), summer 2001 (July – September 2001) andsummer 2005 (August – September 2005). As horses did enter the S treatment in exclosures3 and 5 in Dune Fossile de Ghyvelde in 2005, no measurements were done in this pqs insummer 2005.Vegetation height was measured at 25 fixed points in each pq by lowering down adisc (diameter 15 cm) with a central slot around a vertically held ruler, measuring the heightat which the disc touched the vegetation first. This method is a combination of the “drop discmethod” and “sward stick method”, both described and evaluated in STEWART et al. (2001).The 25 measurements were averaged, resulting in one average vegetation height for eachpq.In each pq, all plant species (including mosses and lichens) were determined(following HENNIPMAN (1978), VAN DOBBEN & KOEMAN (1978), LANDWEHR (1984), TOUW &RUBERS (1989), VAN DER MEIJDEN (1996), LAMBINON et al. (1998) and VAN DORT et al. (1998) –Appendix 11 and 12) and their cover was estimated using the Londo scale (LONDO 1975). We26 Chapter 2
also estimated the percentage of bare soil cover, cover of woody plants (shrubs), cover ofnon-woody plants, cover of graminoid species (Poaceae, Cyperaceae and Juncaceaetogether), cover of mosses (including lichens) and cover of litter.Between April-September 2000 and August 2001- September 2005, monthly or bimonthlycounts of rabbit pellets were performed in L+R+S and R+S pqs. To estimate therate of pellet decay, 100 freshly collected pellets were placed in the S treatment within eachexclosure and the remaining pellets were counted during the following visit. To estimatelocal rabbit densities, we used the method of TAYLOR & WILLIAMS (1956), taking into accountdaily production of pellets per individual, rate of pellet decay, and time interval betweenconsecutive counts:number of rabbits/ha = m2.k1 – m1.k2 . ln(k1 / k2)g.(k1 – k2) (t2 – t1)in whichm1, m2: mean number of pellets per plot during the first (1) and second (2) count, atthe level of the study site; as pellets were removed from each plot after each count, m1=0;t2-t1: time interval between two consecutive counts; k1, k2: rate of pellet decay based onsamples of 100 pellets exposed away from rabbits; g: number of pellets produced per rabbitand per day, estimated at 333 which was the average of 360 pellets/ind/day reported byLOCKLEY (1962; 1976) and 305 pellets/ind/day based on nine days’ counts of pellets of sixdomestic rabbits (Chapter 5). Local rabbit densities were calculated per counting date andstudy area.Statistical analysisAs the data did not meet the assumptions for parametric analysis, non-parametricanalyses (Kruskal-Wallis-tests) were carried out to test whether the grazing treatmentsresulted in significant differences in vegetation structure and composition. All tests wereperformed per season and per study area with TREATMENT as the independent variable.Various response variables were tested: mean vegetation height, the percentage of bare soilcover, cover of woody plants (shrubs), cover of non-woody plants, percentage of graminoidspecies cover in the non-woody cover, cover of mosses, cover of litter, number of speciesper plot, percentage of annual plant species cover in the non-woody cover and the cover ofImpact on vegetation 27
plant species that were present in 120 or more plots per year and over the four seasons(except for the shrub species which would be very strongly correlated with woody plantcover and some less clearly identifiable species). Also, Simpson’s index of diversity wascalculated and tested statistically the same way. Simpson’s index of diversity was calculatedas:1 – Σn (n-1)N (N-1)in which n = the total cover of a particular species and N = the total cover of all species(after SIMPSON, 1949). Sequential Bonferroni correction was applied for every four tests of adependent variable per study area. For example, Bonferroni correction was applied for thefour tests of mean vegetation height in IJzermonding in spring 2000, summer 2000, summer2001 and summer 2005. The correction was applied sequential, which means that forexample the most significant p-value was multiplied by 4, while the least significant p-valuewas multiplied by 1.Non-parametric Spearman correlations were performed to test the dependence ofspecies richness (total number of species) or species diversity (Simpson’s index of diversity)and bare soil cover (global analysis per study area).Species composition and abundance data were also analysed with multivariateordination techniques. DCA was used when the length of gradient was larger than 2.3; PCAwas used in the other cases (JONGMAN et al., 1987). Differences between the scores of thepqs along the first ordination axis per exclosure group and per season were tested byKruskal-Wallis-test, with TREATMENT as the independent variable. As differences betweenexclosure groups, resulting from the ordinations, were larger than differences betweentreatments within an exclosure group, these analyses were performed separately for eachexclosure group. PC-ord 4 was used for ordinations. The non-parametric analyses wereperformed using SAS 9.1. Sequential Bonferroni correction was applied for every five tests ofa dependent variable per study area and per period (e.g. the five tests for the five exclosuresin IJzermonding in summer 2000).The analyses from spring 2000 were shown separately in Appendix 1, 2, 3, 4 and 5,as these were considered to represent more or less the original state of the vegetation(comparable to the situation before the establishment of exclosures).28 Chapter 2
ResultsRabbit activityThe rabbit activity in IJzermonding and Dune Fossile de Ghyvelde shows a cyclicalcourse, generally with peaks in spring and summer months (Figure 2). From April 2000 untilthe summer of 2002, rabbit activity is higher in IJzermonding compared to Dune Fossile deGhyvelde, but since the beginning of 2003, the pattern is reversed with higher rabbit activityin Ghyvelde than in the IJzermonding. This pattern remains stable until the last counts in2005.Figure 2: Presence of rabbits in the two study areas, expressed as number of rabbits/ha, calculated bythe formula of TAYLOR & WILLIAMS (1956). No data are available for November 2000 until July 2001.Impact on vegetation 29
Vegetation structureSeveral characteristics of the vegetation structure in IJzermonding have been influenced bythe grazing treatment (Figure 3, Appendix 6 and 8, see also Appendix 1 and 3). As woodyplant cover and moss cover are already significantly different in spring 2000, we cannot becertain that these differences were due to the grazing treatment and we will not drawconclusions from these results. Trends originating during the course of the experiment andstill visible in summer 2005 are: i) significant differences in vegetation height (highest invegetation in S, lowest in L+R+S); ii) a significantly different bare soil cover percentagebetween the treatments (lower percentage in S); iii) significant differences in annual plantspecies cover (with a different pattern in different years); iv) a significantly higher litter coverin S. The percentage cover of non-woody plants (higher cover in S) and of graminoid species(higher cover in S) showed significant differences during the course of the field experiment,but not in 2005. Comparing averages from year to year, we can see that the cover of baresoil, annuals and mosses has declined over the years in general, while the other vegetationvariables have generally increased over the years.Also in Ghyvelde, vegetation structure has been influenced by the grazing treatments(Figure 4, Appendix 7 and 9, see also Appendix 2 and 4). Parameters already significantlydiffering since spring 2000 are mean vegetation height, percentage cover of woody and nonwoodyplants and cover of annuals, so these are not further discussed. Bare soil cover, coverof graminoids and cover of litter are significantly different between treatments in 2005: baresoil cover in 2005 is highest in R+S, while graminoid and litter cover are highest in S. Thecover of mosses shows no significant differences at all. When we compare the averages ofthe different years, we can see that the cover of annuals has declined, while meanvegetation height, cover of woody plants and cover of litter generally have increased.Vegetation compositionOverall differences in plant species composition and abundance (Appendix 10, seealso Appendix 5) indicate that significant differences between the three treatments in bothareas are already present since spring 2000, in the IJzermonding as well as in Ghyvelde.However, the differences between treatments in spring 2000 in the IJzermonding are smallerthan the differences in the subsequent periods (Figure 5), indicating that differencesbetween the treatments are not only spatial differences, but could be related to thetreatments. This is not the case in Ghyvelde. Therefore, it is hard to attribute the general30 Chapter 2
plant species composition differences in Ghyvelde really to the treatments. Although thereare differences between two consecutive grazing treatments (L+R+S versus R+S, or R+Sversus S), these differences are not consistent. Contrary, in almost all the cases, the L+R+Streatment is significantly different from the S treatment.The total number of species per plot in the IJzermonding significantly differs betweenalmost all treatments since summer 2001 (Figure 3, Appendix 6 and 8, see also Appendix 1and 3). The number of species is generally lowest in S, and higher in L+R+S and R+S. Thenumber of species per plot has declined over the years. Simpson’s index of diversity show asignificantly lower species diversity in S. In Ghyvelde (Figure 4, Appendix 7 and 9, see alsoAppendix 2 and 4), the average number of species is statistically different betweentreatments only in summer 2005, when comparing L+R+S and S, with the highest number ofspecies in L+R+S and the lowest number of species in S. Also here, the average number ofspecies per plots has been declining. Simpson’s index of diversity was not significantlyinfluenced by the grazing treatments in summer 2005 (but see summer 2001). TheSpearman correlation showed a positive relation between number of species and bare soilcover percentage in IJzermonding (Rho = 0.21, p < 0.0001), but not in Ghyvelde (Rho =0.08, p = 0.16). The correlation between bare soil cover and Simpson’s index of diversitywas not significant in IJzermonding (Rho = -0.10, p = 0.06), but was significant in Ghyvelde(Rho = 0.13, p = 0.0006).Qualitative plant species composition has changed during the subsequent years:certain species have disappeared; others have appeared (Appendix 13). For example, inIJzermonding, some annuals (Erodium cicutarium, Vulpia sp.) disappeared from S, while theperennial grass species Arrhenatherum elatius appeared in S and expanded to R+S. Also,quantitative differences are observed. In IJzermonding (Appendix 6 and 8), several speciesshow significant differences between treatments in summer 2005: Arenaria serpyllifolia,Bromus hordeaceus subsp. thominei, Calamagrostis epigejos, Hypochaeris radicata, Lotuscorniculatus, Phleum arenarium, Poa pratensis, Sedum acre, Senecio jacobaea, Tortularuralis var. ruraliformis and Veronica arvensis; some of them already earlier (Carex arenariain summer 2000, Crepis capillaris and Leontodon species in summer 2001). A global trend isdetectable for the majority of these significantly different species: the significant differencesare noticed when comparing L+R+S and S, or R+S and S, but seldom when comparingL+R+S and R+S. Most of these species have the lowest percentage of cover in S and ahigher percentage of cover in L+R+S and R+S in the period of significant differences, oftenintermediate in R+S. During the course of the study, especially shrub cover (Hippophaerhamnoides) has increased, which was apparently at the expense of annual and perennialImpact on vegetation 31
Figure 3 (part I)32 Chapter 2
Figure 3 (part II): Mean and standard error of mean vegetation height, percentage of bare soil cover,percentage of litter cover, number of species per plot and Simpson’s index of diversity in theexclosures in IJzermonding, per treatment and per season. L+R+S = all grazers. R+S = rabbits andsmaller herbivores, but no larger grazers. S = only herbivores that are smaller than rabbits. Standarderrors are shown. Different letters stand for significant differences.Impact on vegetation 33
Figure 4 (part I)34 Chapter 2
Figure 4 (part II): Mean and standard error of mean vegetation height, percentage of bare soil cover,percentage of litter cover, number of species per plot and Simpson’s index of diversity in theexclosures in Dune Fossile de Ghyvelde, per treatment and per season. L+R+S = all grazers. R+S =rabbits and smaller herbivores, but no larger grazers. S = only herbivores that are smaller thanrabbits. Standard errors are shown. Different letters stand for significant differences.Impact on vegetation 35
non-woody plant species cover. In Ghyvelde (Appendix 7 and 9), species differingsignificantly between treatments after spring 2000 are: Carex arenaria (not significantlydifferent in 2005), Plagiomnium affine (significantly different between R+S and S, highestcover in S), Pseudoscleropodium purum (significantly different between L+R+S and the twoother treatments, highest cover in L+R+S) and Senecio jacobaea (significantly differentbetween all the treatments, highest cover in L+R+S).Figure 5: The scores along the first DCA-axis of all relevés per study area. The scores were averagedper season and per treatment. Standard errors are shown.36 Chapter 2
DiscussionVegetation structureThe exclosure experiment in the IJzermonding and Ghyvelde reveals that differentgrazing treatments result in a different vegetation structure: effect on vegetation height,bare soil cover and litter cover. These three parameters globally are intermediate in thegrazing treatment with only rabbits and smaller grazers.The intermediate vegetation height in R+S in the IJzermonding is varying: sometimesvery close to L+R+S, sometimes more similar with S. In Ghyvelde, the differences werealready significant in spring 2000 and they increased in the subsequent periods. Although itis not possible to prove that these were caused by the grazing treatment alone, thishypothesis seems nonetheless very probable because of the latter observation. So rabbits atthe given densities are able to reduce vegetation height significantly, confirming earlierfindings of RANWELL (1960), THOMAS (1960), CRAWLEY (1990), CRAWLEY & WEINER (1991), VANDER HAGEN (1994) and BAKKER et al. (2003a). However, their impact on vegetation height isless important than in combination with larger herbivores.Related to this increase of vegetation height by excluding rabbits and largerherbivores, there is also an increase in litter accumulation. This effect was also observed byBAKKER et al. (2003b) in a much more nutrient rich alluvial plain grassland in theNetherlands. Although the effect of R+S is intermediate between L+R+S and S, R+Sresembles L+R+S more, indicating that rabbits play an important role in diminishing litterquantity. This is true for the calcareous, dry pioneer grassland vegetation in theIJzermonding as well as for the acidophytic dry grassland in Ghyvelde. Litter accumulation ishowever much higher in IJzermonding (compared to Ghyvelde), which was probably due tothe high litter accumulation in the expanding Hippophae-layer in IJzermonding. The shrublayerin Ghyvelde had a lower cover percentage and was expanding more slowly.The third important significant difference between the treatments concerns the baresoil cover percentage. In the IJzermonding, bare soil cover percentage is clearly lower in S;while in Ghyvelde, especially R+S has a high bare soil cover percentage in 2005. Theabsence of rabbits and larger herbivores makes the amount of bare soil almost disappear. InIJzermonding, it is not very clear whether the rabbits or the larger herbivores are responsiblefor the bare soil patches, but the results of Ghyvelde make clear that rabbits are able tocreate them, which is also observed in the studies of TEN HARKEL & VAN DER MEULEN (1995),BAKKER & OLFF (2003) and BAKKER et al. (2004a). BAKKER & OLFF (2003) observed that almostImpact on vegetation 37
half of the bare soil patches in their study area were created by rabbits, slightly less than aquarter by moles. Anthills and cattle trampling contributed least to the occurrence of baresoil and also resulted in the smallest gaps.It was expected that the increasing vegetation height and litter cover would bedisadvantageous for mosses (competition for light and space). The cover of mosses seems tobe influenced by the grazing treatments in IJzermonding, but since the significant differencesare already observed in spring 2000, this cannot be proven. In Ghyvelde, where mosses arean important part of plant diversity, moss cover was not influenced by the treatments.Therefore, it is not possible to draw straightforward conclusions about the effect of grazingboth by rabbits and large grazers on moss cover. Although it should be mentioned that TENHARKEL & VAN DER MEULEN (1995) observed a decrease of mosses after excluding rabbits, theeffect of rabbit grazing on mosses is disputable: moss cover increased in some areas afterthe advent of myxomatosis (THOMAS, 1960) and WHITE (1961) shows that the effect ofrabbits on moss cover largely depends on the moss species under consideration. Tounderstand the effect of rabbits on moss vegetation, an analysis at species level isnecessary.It is hard to come to a conclusion about the effect of the treatments on the cover ofwoody plants, non-woody plants, graminoid species and annual species in our study areas.The results are either already significant at the start of the experiment, or not veryconsistent in time. Only in Ghyvelde, grasses become more dominant in the non-woody layerof the S treatment, compared to L+R+S and R+S. Other authors noticed effects of rabbitgrazing on woody plants (ZEEVALKING & FRESCO, 1977; BAKKER et al., 2004b) and an increasein the frequency of perennial graminoids and a decrease in the frequency of annualgraminoids and herbs (TEN HARKEL & VAN DER MEULEN, 1995).Vegetation compositionAlthough not all vegetation structure parameters are significantly different betweenthe treatments, the fact that vegetation height, litter cover and bare soil cover areinfluenced, has possible implications for plant species composition, abundance and diversity.The most diverse vegetation is found at a low vegetation height. Light limitation related toincreased living biomass negatively affects plant species richness due to reduced localcolonization (BAKKER et al., 2003b). According to LAMB (2008), litter is the primary mechanismstructuring grassland diversity, with both richness and evenness declining with increasinglitter cover. In dry habitats, litter may have several effects on species richness, i.e. through38 Chapter 2
microclimate effects or providing nutrients (BAKKER et al., 2003b). Finally, by creatingburrows, rabbits are loosening up the soil, increasing aeration (BAKKER et al., 2004a) andcreating patches were germination success is strongly improved (compared to anundisturbed vegetation or to dung pats of large herbivores). As a result, a significant positivecorrelation between the occurrence of bare soil and plant species richness has been proven(BAKKER & OLFF, 2003). Our results only partially confirm this finding, but when a significantcorrelation was found, it was indicated that bare soil cover and number of species/speciesdiversity are positively correlated. Therefore, we could expect that plant species diversity,composition and abundance would be dependent on the grazing treatments in theIJzermonding and Ghyvelde.In IJzermonding, plant diversity has indeed decreased in S. R+S is again intermediatein position. This fact confirms the importance of rabbits in maintaining the diversity of dunegrasslands, which was already mentioned by e.g. ZEEVALKING & FRESCO (1977) and VANSTEERTEGEM (1982), who stated that species diversity is highest in the plots with moderaterabbit grazing; lowest in species number were the plots without rabbit grazing. In Ghyvelde,the number of species per plot has been influenced only since 2005. It is possible that theimportance of the grazers for this ecosystem will become only clear after a longer period oftime, but by now, the effect of vegetation structure differences in IJzermonding andGhyvelde does not lead to the same effect on diversity.Grazing seemed to have influenced plant species composition and abundance inIJzermonding (Figure 5). These effects seemed to be really due to the grazer treatments, asthe spatial differences in species composition present in spring 2000 had become larger overthe years. As the vegetation became more rough when progressively excluding herbivores,we expected perennial graminoids cover to increase in S and also in R+S in a lesser extent,causing annual plant species to decrease in these treatments due to competitive effects.Also, bare soil cover creation by rabbits in L+R+S and R+S should have offered moregerminating possibilities to annuals. During the course of the experiment, several plantspecies, of which the abundance in the three treatments was quite similar in 2000, declinedin S, while staying more abundant in R+S and certainly in L+R+S. Several of them (e.g.Arenaria serpyllifolia, Bromus hordeaceus subsp. thominei, Phleum arenarium, Veronicaarvensis) were indeed annuals. Some typical plants of the Tortulo-Koelerion (Phleo-Tortuletum ruraliformis, SCHAMINÉE et al., 1996), like Phleum arenarium, Sedum acre, Tortularuralis var. ruraliformis and Arenaria serpyllifolia decreased in S or even disappeared from S(Erodium cicutarium), suggesting that the maintenance of this vegetation type wasdependent on the indirect effects of grazing and digging of the herbivores. Also the perennialImpact on vegetation 39
grass species Calamagrostis epigejos had decreased in S, probably due to increasingcompetition from the expanding shrub layer. Although this rough grass had a higher cover inL+R+S than in S, the typical vegetation of the grassland (see above) is globally bestpreserved in the L+R+S treatment, intermediately in R+S, although this last treatment has areasonably similar vegetation composition as L+R+S. This situation is equivalent to thesituation observed by RANWELL (1960) after the disappearance of the rabbits by myxomatosisand indicates the importance of grazing for the typical dune vegetation.As mentioned before, in Ghyvelde results about species composition and abundanceshould be approached with caution as many differences were already present in spring 2000(Figure 5). In this area, only three species differ significantly between treatments(differences which were not already present in 2000). One of them is Senecio jacobaea,which is decreasing in S. This phenomenon has been confirmed by other authors (THOMAS,1960; WHITE, 1961) and was mentioned as one of the most noticeable changes after theadvent of myxomatosis. The vegetation structure in S is rougher than in the othertreatments: the higher graminoid cover probably outcompeted Senecio jacobaea. This plantwas however favoured in L+R+S (and intermediately in R+S) as vegetation structure wasmore open in these treatments, and the plant species was probably hardly touched by theherbivores (unpalatable plant species). Plagiomnium affine seems to increase after theexclusion of rabbits and large grazers. The opposite was the case for Pseudoscleropodiumpurum, which is contrary to the observations of RANWELL (1960). Although plant speciescomposition and abundance are influenced by the grazing treatments, the extent of thisinfluence is smaller in the closed acidophytic dune grasslands of Ghyvelde than in the openpioneer lime-rich grasslands of the IJzermonding. It should be noted that studies in areassimilar to Ghyvelde did find significant effects of the exclusion or disappearance of rabbits.CRAWLEY (1990) did find an increase of Anthoxanthum odoratum, Rumex acetosella andLuzula campestris in rabbit-grazed grassland and a decrease of Festuca rubra and Agrostiscapillaris. In his case, there was only little change in the total number of plant species withgrazing. Excluding rabbits in the study area of VAN DER HAGEN (1994) resulted in an increaseof Luzula campestris (contrary to CRAWLEY (1990)) and a decrease of Cladonia furcata, Airapraecox and Rumex acetosella. In his study, species diversity declined in the rabbit-proofexclosures.The question remains why the importance of grazing for plant diversity, compositionand abundance is different between both study areas. In a global study, BAKKER et al. (2006)stress the importance of habitat productivity in predicting the importance of mammalianherbivores on grassland diversity. However, when studying only small herbivores, the effect40 Chapter 2
of grazing on plant species richness was not consistent. Also OLFF & RITCHIE (1998) indicatethe importance of the soil fertility, combined with other factors (e.g. precipitation):contrasting results of grazing studies may be dependent on several factors. Our two studyareas have a different soil acidity, which may be the critical difference between the twoareas. It was shown that the mechanisms underlying vegetation responses to grazing maybe primarily determined by edaphic factors (SASAKI et al., 2008). Also, IJzermonding has anopen pioneer vegetation which is different from the more or less stable closed-canopygrassland in Ghyvelde (Chapter 1). Another factor possibly causing differences between thetwo areas is the number of grazers. The rabbit populations in the two areas evolveddifferently. The large rabbit population in IJzermonding in 2001 and 2002 crashed, so thattheir numbers were quite low from autumn 2002 until the end of the experiment. Thepopulation in Ghyvelde was quite low in 2001, but expanded and came to a climax in 2004.The importance of the number of grazers and severity of the grazing pressure can be derivedfrom the studies of ZEEVALKING & FRESCO (1977), BOWERS (1993) and ALBON et al. (2007).Moreover, the large grazers involved in the two areas and their grazing regimes were verydifferent (winter grazing of sheep in IJzermonding, year round grazing of horses inGhyvelde). All these factors and the possible interactions between them make it impossibleto find a straightforward explanation for the differences between both areas.ConclusionsDifferent grazing treatments in our two study areas lead to significant differences incertain aspects of vegetation structure (vegetation height, litter cover, bare soil cover).Generally, we can conclude that progressively excluding herbivore species leads towards amore rough vegetation. We expected these structural differences to influence plant speciesdiversity, composition and abundance. This was indeed the case in IJzermonding, but onlyvery limited in Ghyvelde. In IJzermonding, grazing seemed to be necessary to preserve thetypical dune vegetation composition.In most cases the influence of the rabbits is weaker than the combination with theimpact of larger grazers. This intermediate position is similar to the findings of BAKKER et al.(2003a), and indicates that the rabbit populations in our study areas during the study periodare not able to maintain the characteristic dune grassland vegetation. It seems that theintroduction of large herbivores in these areas was indeed necessary to preserve vegetationdiversity and structure.Impact on vegetation 41
However, effects of herbivores on different aspects of grassland ecology cannot begeneralised: different herbivore species have different effects (BAKKER, 2003). The creationof bare soil patches is a property of rabbits, much more than of non-burrowing large grazers:large herbivores may create the conditions under which high species richness is possible, butrabbits are the main creators of bare soil patches (BAKKER, 2003): the combination of largeherbivores and rabbit grazing will probably result in a higher structural diversity andsometimes also higher species richness in dry dune grasslands, than in a system with largegrazers but without rabbits. Therefore, the rabbit still has the potential to be an importantspecies in coastal dune succession, although not being able to preserve the dry dunegrassland vegetation composition and structure on its own.AcknowledgementsWe thank the Agency for Nature and Forest (ANB, Flemish Government) and theConservatoire du Littoral for allowing access to the study areas and making it possible to perform theexperiments. Technical support was provided by Ward Vercruysse (INBO), Wim De Belder (INBO),Patrick Geers (INBO) and Maarten Pevenage. The first author is supported by the ResearchFoundation – Flanders (Aspirant of the FWO-Vlaanderen).ReferencesALBON, S.D., M.J. BREWER, S. O'BRIEN, A.J. NOLAN & D. COPE (2007). Quantifying the grazing impactsassociated with different herbivores on rangelands. Journal of Applied <strong>Ecology</strong> 44: 1176-1187.BAKKER, E.S. (2003). Herbivores as mediators of their environment. The impact of large and smallspecies on vegetation dynamics. <strong>PhD</strong> dissertation, Wageningen <strong>Universiteit</strong>, Wageningen, theNetherlands.BAKKER, E.S. & H. OLFF (2003). The impact of different-sized herbivores on recruitment opportunitiesfor subordinate herbs in grasslands. In: BAKKER, E.S., Herbivores as mediators of theirenvironment. The impact of large and small species on vegetation dynamics. <strong>PhD</strong> dissertation,Wageningen <strong>Universiteit</strong>, Wageningen, the Netherlands: 13-29.BAKKER, E.S., H. OLFF & J.M. GLEICHMAN (2003a). Compositional constancy in grazed plant communitiesincreases with herbivore size. In: BAKKER, E.S., Herbivores as mediators of their environment.The impact of large and small species on vegetation dynamics. <strong>PhD</strong> dissertation, Wageningen<strong>Universiteit</strong>, Wageningen, the Netherlands: 55-77.BAKKER, E.S., H. OLFF, J.M. GLEICHMAN & F. BERENDSE (2003b). The interactive effects of grazing andlitter on grassland plant diversity. In: BAKKER, E.S., Herbivores as mediators of theirenvironment. The impact of large and small species on vegetation dynamics. <strong>PhD</strong> dissertation,42 Chapter 2
Wageningen <strong>Universiteit</strong>, Wageningen, the Netherlands: 31-52.BAKKER, E.S., H. OLFF, M. BOEKHOFF, J.M. GLEICHMAN & F. BERENDSE (2004a). Impact of herbivores onnitrogen cycling: contrasting effects of small and large species. Oecologia 138: 91-101.BAKKER, E.S., H. OLFF, C. VANDENBERGHE, K. DE MAEYER, R. SMIT, J.M. GLEICHMAN & F.W.M. VERA (2004b).Ecological anachronisms in the recruitment of temperate light-demanding tree species inwooded pastures. Journal of Applied <strong>Ecology</strong> 41: 571-582.BAKKER, E.S., M.E. RITCHIE, H. OLFF, D.G. MILCHUNAS & J.M. KNOPS (2006). Herbivore impact on grasslandplant diversity depends on habitat productivity and herbivore size. <strong>Ecology</strong> Letters 9: 780-788.BOWERS, M.A. (1993). Influence of herbivorous mammals on an old-field plant community: years 1-4after disturbance. Oikos 67: 129-141.COSYNS, E., A. DELPORTE, L. LENS & M. HOFFMANN (2005). Germination success of temperate grasslandspecies after passage through ungulate and rabbit guts. Journal of <strong>Ecology</strong> 93: 353-361.CRAWLEY, M.J. (1990). Rabbit grazing, plant competition and seedling recruitment in acid grassland.Journal of Applied <strong>Ecology</strong> 27: 803-820.CRAWLEY, M.J. & J. WEINER (1991). Plant size variation and vertebrate herbivory: winter wheat grazedby rabbits. Journal of Applied <strong>Ecology</strong> 28: 154-172.DE BRUIJN, G.-J. (1991). Konijnen. Hoveniers in de duinen. Duin 14: 23-24.DREES, M. (1989). Konijnen als grazers. Duin 12: 156-158.DREES, M. (1998). Langoor. Over konijnen en vegetatie in de duinen. Duin 21: 4-6.HENNIPMAN, E. (1978). Korstmossen - Lichenes. De Nederlandse Cladonia's. Wetenschappelijkemededelingen K.N.N.V., nr. 124.HOFFMANN, M., BONTE, D., COSYNS, E., CRIEL, P., MAELFAIT, J.-P., PROVOOST, S., SOMERS, N. & STRUYVE, T.(2005). Evaluatie Begrazing Kustduinen, 1997-2004. Onderzoek en evaluatie van de biologischegevolgen van acht jaar begrazing in de Vlaamse Westkustreservaten. <strong>Ghent</strong>, <strong>Ghent</strong> Universityand Brussels, Instituut of Nature Conservation, under the authority of AMINAL, Dept. Nature.JANSSEN, M. (2004). Op de bres voor het konijn. Duin 27: 3-4.JONGMAN, R.H.G., C.J.F. TER BRAAK & O.F.R. VAN TONGEREN (1987). Data analysis in community andlandscape ecology. Pudoc, Wageningen.LAMB, E.G. (2008). Direct and indirect control of grassland community structure by litter, resources,and biomass. <strong>Ecology</strong> 89: 216-225.LAMBINON, J., J.-E. DE LANGHE, L. DELVOSALLE & J. DUVIGNEAUD (1998). Flora van België, hetGroothertogdom Luxemburg, Noord-Frankrijk en de aangrenzende gebieden (Pteridofyten enSpermatofyten). Nationale Plantentuin van België, Meise.LANDWEHR, J. (1984). Nieuwe Atlas Nederlandse Bladmossen. Stichting Uitgeverij K.N.N.V., nr. 38.LEES, A.C. & D.J. BELL (2008). A conservation paradox for the 21 st century: the European wild rabbitOryctolagus cuniculus, an invasive alien and an endangered native species. Mammal Review 38:304-320.LOCKLEY, R.M. (1976). The private life of the rabbit. Het Spectrum, Utrecht.LOCKLEY, R.M. (1962). Production of faecal pellets in the wild rabbit. Nature 194: 988-989.Impact on vegetation 43
LONDO, G. (1975). De decimale schaal voor vegetatiekundige opnamen van permanente kwadraten.Gorteria 7: 101-106.OLFF, H. & M.E. RITCHIE (1998). Effects of herbivores on grassland plant diversity. Trends in <strong>Ecology</strong>and Evolution 13: 261-265.PAKEMAN, R.J., G., DIGNEFFE, & J.L. SMALL (2002). Ecological correlates of endozoochory by herbivores.Functional <strong>Ecology</strong> 16: 296-304.RANWELL, D.S. (1960). Changes in the vegetation on parts of the dune system after the loss of rabbitsby myxomatosis. Journal of <strong>Ecology</strong> 48: 385-395.RITCHIE, M.E. & H. OLFF (1997). Chapter 6. Herbivore diversity and plant dynamics: compensatory andadditive effects. In: OLFF, H., V.K. BROWN & R.H. DRENT (eds), Herbivores: Between plants andpredators. The 38th symposium of the British Ecological Society in cooperation with theNetherlands Ecological Society held at the Wageningen Agricultural University, The Netherlands.Blackwell Science, Oxford: 175-204.SASAKI, T., T. OKAYASU, Y. SHIRATO, U. JAMSRAN, S. OKUBO & K. TAKEUCHI (2008). Can edaphic factorsdemonstrate landscape-scale differences in vegetation responses to grazing? Plant <strong>Ecology</strong> 194:51-66.SCHAMINÉE, J.H.J., A.H.F. STORTELDER & E.J. WEEDA (1996). De Vegetatie van Nederland. Deel 3.Plantengemeenschappen van graslanden, zomen en droge heiden. Opulus Press, Uppsala,Leiden, 356 pp.SIMPSON, E.H. (1949). Measurement of diversity. Nature 163: 688.STEWART, K.E.J., N.A.D. BOURN & J.A. THOMAS (2001). An evaluation of three quick methods commonlyused to assess sward height in ecology. Journal of Applied <strong>Ecology</strong> 38: 1148-1154.TAHMASEBI KOHYANI, P. (2008). Grazer induced changes in dry, low-productive grassland plantcommunities. <strong>PhD</strong> dissertation, U<strong>Gent</strong>, <strong>Ghent</strong>, Belgium, 136 pp.TAYLOR, R.H. & R.M. WILLIAMS (1956). The use of pellet counts for estimating the density of populationsof the wild rabbit (Oryctolagus cuniculus L.). New Zealand Journal of Science and Technology,Section B 38: 236-256.TEN HARKEL, M. & F. VAN DER MEULEN (1995). Impact of grazing and atmospheric nitrogen deposition onthe vegetation of dry coastal dune grasslands. Journal of Vegetation Science 6: 445-452.THOMAS, A.S. (1960). Changes in vegetation since the advent of myxomatosis. Journal of <strong>Ecology</strong> 48:287-306.THOMAS, A.S. (1963). Further changes in vegetation since the advent of myxomatosis. Journal of<strong>Ecology</strong> 51: 151-183.TOUW, A. & W.V. RUBERS (1989). De Nederlandse Bladmossen. Flora en verspreidingsatlas van deNederlandse Musci (Sphagnum uitgezonderd). Stichting Uitgeverij K.N.N.V., nr. 50.VAN DER HAGEN, H.G.J.M. (1994). Konijnen als beheerders van de Harstenhoek in Meijendel? DeLevende natuur 95: 4-8.VAN DER MEIJDEN, R. (1996). Heukels' Flora van Nederland. Wolters-Noordhoff, Groningen.VAN DOBBEN, H. & R. KOEMAN (1978). Korstmossentabel. De Nederlandse macrolichenen.44 Chapter 2
Jeugdbondsuitgeverij, Amsterdam.VAN DORT, K., C. BUTER & P. VAN WIELINK (1998). Veldgids Mossen. Stichting Uitgeverij K.N.N.V.,Veldgids nr. 10.VANDEKERCHOVE, D. & J.E. PEETERS (2002). Onderzoek naar ziektes bij wilde konijnen in het Vlaamsegewest. CODA-CERVA, Belgium.VAN STEERTEGEM, M. (1982). Invloed van konijnenbegrazing op een duingraslandcomplex (Groenendijk,Oostduinkerke), Unpublished master dissertation, <strong>Ghent</strong> University, <strong>Ghent</strong>, Belgium, 116 pp.WATT, A.S. (1957). The effect of excluding rabbits from grassland B (Mesobrometum) in Breckland.Journal of <strong>Ecology</strong> 45: 861-878.WATT, A.S. (1962). The effect of excluding rabbits from grassland A (Xerobrometum) in Breckland,1936-60. Journal of <strong>Ecology</strong> 50: 181-198.WEARN, J.A. & A.C. GANGE (2007). Above-ground herbivory causes rapid and sustained changes inmycorrhizal colonization of grasses. Oecologia 153: 959-971.WHITE, D.J.B. (1961). Some observations on the vegetation of Blakeney Point, Norfolk, following thedisappearance of the rabbits in 1954. Journal of <strong>Ecology</strong> 49: 113-118.WILLOTT, S.J., A.J. MILLER, L.D. INCOLL & S.G. COMPTON (2000). The contribution of rabbits (Oryctolaguscuniculus L.) to soil fertility in semi-arid Spain. Biology and Fertility of Soils 31: 379-384.ZEEVALKING, H.J. & L.F.M. FRESCO (1977). Rabbit grazing and species diversity in a dune area. Vegetatio35: 193-196.Impact on vegetation 45
AppendicesIJzermonding spring 2000Treatment L+R+S R+S SMean ± SE Mean ± SE Mean ± SEmean vegetation height (cm) 4.90 ± 0.47 4.78 ± 0.42 5.36 ± 0.34% bare soil cover 8.83 ± 1.99 8.83 ± 1.91 6.83 ± 1.00% cover of woody plants 3.50 ± 1.46 2.73 ± 0.79 4.87 ± 1.05% cover of non-woody plants 51.00 ± 2.62 62.17 ± 4.81 62.83 ± 4.59% graminoid species cover in the non-woody cover 35.87 ± 2.77 39.76 ± 3.81 41.42 ± 3.93% annual plant species cover in the non-woodycover 28.48 ± 2.72 26.07 ± 2.57 21.67 ± 2.37% cover of mosses 86.00 ± 2.51 70.00 ± 4.84 67.50 ± 4.12% cover of litter 2.30 ± 0.27 2.07 ± 0.37 2.17 ± 0.29number of species per plot 20.73 ± 0.51 19.23 ± 0.54 20.63 ± 0.65Simpson's index of diversity 0.78 ± 0.02 0.78 ± 0.02 0.81 ± 0.02Arenaria serpyllifolia 5.47 ± 0.81 3.83 ± 0.53 3.83 ± 0.53Bromus hordeaceu ssubsp. thominei 4.63 ± 0.65 5.40 ± 0.73 5.83 ± 0.81Calamagrostis epigejos 7.97 ± 1.79 3.70 ± 0.71 3.10 ± 0.65Carex arenaria 3.10 ± 0.49 4.03 ± 0.57 4.37 ± 0.53Cladonia furcata 1.87 ± 0.52 0.50 ± 0.13 0.97 ± 0.40Crepis capillaris 0.03 ± 0.03 0.17 ± 0.08 0.00 ± 0.00Elymus repens 1.17 ± 0.38 0.07 ± 0.05 1.37 ± 0.53Erodium cicutarium 5.90 ± 0.81 3.53 ± 0.68 3.53 ± 0.68Festuca species 3.70 ± 0.71 7.27 ± 1.53 9.40 ± 1.87Galium verum 0.97 ± 0.36 1.47 ± 0.48 2.43 ± 0.66Geranium molle 7.13 ± 0.80 8.60 ± 0.80 8.40 ± 0.88Hypochaeris radicata 0.23 ± 0.11 1.20 ± 0.45 1.37 ± 0.49Leontodon species 3.93 ± 0.90 4.73 ± 1.15 5.00 ± 0.87Lotus corniculatus 1.13 ± 0.44 1.10 ± 0.49 1.67 ± 0.56Myosotis ramosissima 3.87 ± 0.49 4.40 ± 0.50 5.63 ± 0.51Ononis repens 2.13 ± 0.70 3.67 ± 1.07 3.37 ± 1.06Phleum arenarium 2.20 ± 0.52 1.57 ± 0.47 1.27 ± 0.39Poa pratensis 5.00 ± 0.90 13.37 ± 4.02 11.80 ± 2.88Sedum acre 8.17 ± 0.81 8.63 ± 0.95 9.53 ± 1.15Senecio jacobaea 2.80 ± 0.63 5.43 ± 1.32 6.50 ± 1.12Tortula ruralis var. ruraliformis 61.67 ± 5.23 51.83 ± 6.01 55.67 ± 5.07Veronica arvensis 2.70 ± 0.53 2.90 ± 0.48 2.70 ± 0.43Appendix 1: Mean and standard error (SE) of the cover of some plant species and some othervegetation parameters in the exclosures in IJzermonding, per treatment in spring 2000. L+R+S = allgrazers. R+S = rabbits and smaller herbivores, but no larger grazers. S = only herbivores that aresmaller than rabbits.46 Chapter 2
Dune Fossile de Ghyvelde spring 2000Treatment L+R+S R+S SMean ± SE Mean ± SE Mean ± SEmean vegetation height (cm) 7.89 ± 3.60 4.74 ± 0.16 8.45 ± 0.47% bare soil cover 9.50 ± 2.87 8.17 ± 2.01 5.33 ± 1.31% cover of woody plants 0.53 ± 0.16 0.07 ± 0.05 0.10 ± 0.06% cover of non-woody plants 70.33 ± 2.94 77.00 ± 3.11 84.50 ± 2.08% graminoid species cover in the non-woody cover 72.45 ± 3.91 56.80 ± 4.89 62.40 ± 4.55% annual plant species cover in the non-woodycover 46.10 ± 5.69 61.61 ± 5.11 64.40 ± 5.18% cover of mosses 61.83 ± 4.72 49.83 ± 5.58 43.33 ± 4.61% cover of litter 8.70 ± 2.63 9.40 ± 1.42 8.00 ± 1.17number of species per plot 15.73 ± 0.59 15.37 ± 0.38 17.17 ± 0.58Simpson's index of diversity 0.80 ± 0.01 0.80 ± 0.01 0.83 ± 0.01Agrostis capillaris 23.73 ± 2.88 15.97 ± 3.64 19.57 ± 3.53Aira praecox 9.80 ± 3.34 12.07 ± 4.24 3.70 ± 0.70Carex arenaria 8.53 ± 0.83 10.33 ± 1.00 13.23 ± 1.81Cladonia furcata 2.00 ± 0.58 2.50 ± 0.56 1.67 ± 0.44Dicranum scoparium 17.57 ± 4.56 12.37 ± 3.91 7.03 ± 2.07Festuca species 3.83 ± 0.80 4.73 ± 1.28 10.20 ± 1.83Galium verum 0.73 ± 0.19 0.63 ± 0.17 0.73 ± 0.16Geranium molle 7.27 ± 1.41 7.60 ± 1.92 15.20 ± 3.79Hypnum cupressiforme 26.67 ± 5.85 24.47 ± 5.37 22.17 ± 4.58Luzula campestris 11.00 ± 1.88 4.53 ± 1.28 8.63 ± 1.95Plagiomnium affine 2.90 ± 1.12 2.83 ± 1.02 6.67 ± 2.39Pseudoscleropodium purum 14.00 ± 4.89 9.90 ± 4.26 3.37 ± 1.42Rumex acetosella 2.97 ± 0.51 4.13 ± 0.58 3.07 ± 0.47Senecio jacobaea 2.80 ± 0.89 4.10 ± 1.28 3.10 ± 0.86Veronica arvensis 4.13 ± 0.58 4.03 ± 0.59 3.47 ± 0.47Appendix 2: Mean and standard error (SE) of the cover of some plant species and some othervegetation parameters in the exclosures in Dune Fossile de Ghyvelde, per treatment in spring 2000.L+R+S = all grazers. R+S = rabbits and smaller herbivores, but no larger grazers. S = only herbivoresthat are smaller than rabbits.Impact on vegetation 47
Appendix 3 (part I)IJzermonding All treatments L+R+S versus R+S L+R+S versus S R+S versus SChisquareDF PChisquareDF PChisquareDF PChisquareDF Pmean vegetation height (cm) 2.81 2 0.25 0.01 1 0.94 1.91 1 0.17 2.27 1 0.13% bare soil cover 0.00 2 1.00 0.00 1 0.99 0.00 1 1.00 0.00 1 0.98% cover of woody plants 6.50 2 0.04 0.00 1 0.97 4.77 1 0.03 4.82 1 0.03% cover of non-woody plants 5.50 2 0.06 3.99 1 0.05 4.24 1 0.04 0.01 1 0.92% graminoid species cover in the non-woody cover 0.42 2 0.81 0.02 1 0.89 0.46 1 0.50 0.16 1 0.69% annual plant species coverin the non-woody cover 2.34 2 0.31 1.64 1 0.20 1.85 1 0.17 0.02 1 0.88% cover of mosses 16.43 2 0.00 * 9.51 1 0.00 * 14.36 1 0.00 * 0.80 1 0.37% cover of litter 1.83 2 0.40 1.90 1 0.17 0.36 1 0.55 0.48 1 0.49number of species per plot 5.02 2 0.08 4.36 1 0.04 0.01 1 0.92 3.18 1 0.07Simpson's index of diversity 3.29 2 0.19 0.00 1 0.98 2.36 1 0.12 2.55 1 0.11Arenaria serpyllifolia 2.13 2 0.34 1.63 1 0.20 1.53 1 0.22 0.00 1 0.96Bromus hordeaceus subsp. thominei 1.00 2 0.61 0.38 1 0.54 1.00 1 0.32 0.12 1 0.73Calamagrostis epigejos 5.17 2 0.08 3.82 1 0.05 3.81 1 0.05 0.01 1 0.93Carex arenaria 2.64 2 0.27 1.03 1 0.31 2.65 1 0.10 0.24 1 0.62Cladonia furcata 7.42 2 0.02 * 6.00 1 0.01 * 4.77 1 0.03 * 0.02 1 0.88Crepis capillaris 5.48 2 0.06 1.97 1 0.16 1.00 1 0.32 4.21 1 0.04Elymus repens 11.70 2 0.00 * 12.58 1 0.00 * 1.78 1 0.18 3.72 1 0.05Erodium cicutarium 6.59 2 0.04 5.44 1 0.02 4.32 1 0.04 0.10 1 0.75Festuca species 7.93 2 0.02 * 4.02 1 0.05 6.96 1 0.01 * 0.86 1 0.35Galium verum 2.81 2 0.25 0.19 1 0.66 2.48 1 0.12 1.40 1 0.24Geranium molle 2.13 2 0.34 1.79 1 0.18 1.40 1 0.24 0.01 1 0.91Hypochaeris radicata 4.92 2 0.09 4.34 1 0.04 3.76 1 0.05 0.01 1 0.94Leontodon species 0.83 2 0.66 0.06 1 0.81 0.89 1 0.35 0.30 1 0.58Lotus corniculatus 0.83 2 0.66 0.06 1 0.81 0.89 1 0.35 0.30 1 0.58Myosotis ramosissima 6.09 2 0.05 0.38 1 0.54 5.64 1 0.02 * 3.17 1 0.07Ononis repens 1.10 2 0.58 1.09 1 0.30 0.38 1 0.54 0.18 1 0.67Phleum arenarium 2.07 2 0.36 1.47 1 0.23 1.54 1 0.21 0.00 1 1.00Poa pratensis 3.06 2 0.22 0.55 1 0.46 3.53 1 0.06 0.55 1 0.46Sedum acre 0.62 2 0.73 0.19 1 0.66 0.56 1 0.45 0.18 1 0.6848 Chapter 2
Senecio jacobaea 3.73 2 0.15 0.25 1 0.62 4.60 1 0.03 0.86 1 0.35Tortula ruralis var. ruraliformis 1.68 2 0.43 1.31 1 0.25 1.19 1 0.28 0.01 1 0.93Veronica arvensis 0.37 2 0.83 0.24 1 0.62 0.31 1 0.58 0.00 1 0.96Appendix 3 (part II): Results of Kruskal-Wallis-tests of the cover of some plant species and some other vegetation parameters in the exclosures inIJzermonding, with treatment as independent variable, in spring 2000. Chi-square = chi-square-value obtained by the test. DF = degrees of freedom. P =significance value obtained by the test. * indicates that P is still significant after sequential Bonferroni correction. L+R+S = all grazers. R+S = rabbits andsmaller herbivores, but no larger grazers. S = only herbivores that are smaller than rabbits.Impact on vegetation 49
Dune Fossile de Ghyvelde All treatments L+R+S versus R+S L+R+S versus S R+S versus SChisquareDF PChisquareDF PChisquareDF PChisquareDF Pmean vegetation height (cm) 48.20 2
Study area Exclosure ordination All treatments L+R+S versus R+S L+R+S versus S R+S versus StechniqueChisquareDF PChisquareDF PChisquareDF PChisquareDF PIJzermonding Excl 1 PCA 10.05 2 0.01 * 0.64 1 0.42 8.31 1 0.00 * 5.77 1 0.02Excl 2 PCA 15.16 2 0.00 * 8.31 1 0.00 * 8.31 1 0.00 * 8.31 1 0.00 *Excl 3 PCA 7.52 2 0.02 * 0.23 1 0.63 5.77 1 0.02 * 5.03 1 0.03Excl 4 PCA 6.77 2 0.03 1.26 1 0.26 6.56 1 0.01 * 2.08 1 0.15Excl 5 PCA 11.66 2 0.00 * 8.31 1 0.00 * 8.31 1 0.00 * 0.64 1 0.42Ghyvelde Excl 1 PCA 8.57 2 0.01 * 0.41 1 0.52 6.56 1 0.01 * 5.77 1 0.02 *Excl 2 PCA 13.05 2 0.00 * 8.31 1 0.00 * 3.69 1 0.05 8.31 1 0.00 *Excl 3 PCA 7.52 2 0.02 * 0.23 1 0.63 5.77 1 0.02 * 5.03 1 0.03 *Excl 4 PCA 11.66 2 0.00 * 0.64 1 0.42 8.31 1 0.00 * 8.31 1 0.00 *Excl 5 DCA 14.00 2 0.00 * 8.31 1 0.00 * 8.31 1 0.00 * 5.77 1 0.02 *Appendix 5: Results of Kruskal-Wallis-tests on the scores of the pqs on the first ordination axis, with treatment as independent variable, in spring 2000 perexclosure. Chi-square = chi-square-value obtained by the test. DF = degrees of freedom. P = significance value obtained by the test. * indicates that P is stillsignificant after sequential Bonferroni correction. L+R+S = all grazers. R+S = rabbits and smaller herbivores, but no larger grazers. S = only herbivores thatare smaller than rabbits.Impact on vegetation 51
IJzermonding summer 2000 summer 2001 summer 2005Treatment L+R+S R+S S L+R+S R+S S L+R+S R+S SMean ± SE Mean ± SE Mean ± SE Mean ± SE Mean ± SE Mean ± SE Mean ± SE Mean ± SE Mean ± SEmean vegetation height (cm) 17.71 ± 1.81 19.03 ± 1.95 28.45 ± 1.80 21.53 ± 2.11 24.88 ± 2.18 41.74 ± 1.92 49.71 ± 4.29 67.52 ± 4.94 80.60 ± 3.70% bare soil cover 11.50 ± 1.75 8.67 ± 1.40 5.33 ± 1.04 17.60 ± 4.06 7.77 ± 2.17 2.10 ± 0.95 9.87 ± 4.41 4.97 ± 1.73 0.17 ± 0.10% cover of woody plants 15.50 ± 2.91 13.20 ± 2.50 21.33 ± 3.16 17.10 ± 3.11 15.97 ± 3.21 33.83 ± 5.58 63.80 ± 5.86 63.50 ± 5.07 73.53 ± 4.59% cover of non-woodyplants 53.67 ± 3.83 64.50 ± 5.04 76.00 ± 3.04 48.40 ± 4.49 54.43 ± 4.97 74.90 ± 4.87 52.33 ± 2.92 60.17 ± 5.08 48.67 ± 5.33% graminoid species coverin the non-woody cover 60.39 ± 3.41 69.04 ± 3.04 63.64 ± 3.23 69.01 ± 3.91 75.69 ± 3.30 83.47 ± 4.49 89.17 ± 2.44 87.37 ± 3.76 93.09 ± 2.67% annual plant speciescoverin the non-woody cover 19.87 ± 4.31 18.35 ± 3.14 11.03 ± 2.03 22.71 ± 4.33 16.71 ± 2.60 10.19 ± 2.56 5.52 ± 1.06 8.79 ± 2.53 7.68 ± 3.16% cover of mosses 79.00 ± 1.89 65.00 ± 5.70 47.90 ± 5.69 75.70 ± 4.11 70.13 ± 6.76 66.97 ± 6.48 52.43 ± 6.43 36.63 ± 6.64 9.87 ± 4.50% cover of litter 7.50 ± 0.82 14.17 ± 2.96 18.67 ± 2.53 2.93 ± 0.55 7.03 ± 3.13 54.80 ± 8.03 44.43 ± 5.76 51.93 ± 6.87 89.77 ± 3.51number of species per plot 15.90 ± 0.49 15.07 ± 0.44 14.77 ± 0.55 21.43 ± 0.46 19.93 ± 0.41 18.20 ± 0.55 16.03 ± 1.00 15.30 ± 0.93 8.97 ± 0.56Simpson's index of diversity 0.76 ± 0.02 0.75 ± 0.02 0.82 ± 0.01 0.75 ± 0.01 0.72 ± 0.01 0.76 ± 0.01 0.73 ± 0.01 0.74 ± 0.02 0.61 ± 0.03Arenaria serpyllifolia 1.67 ± 0.34 0.87 ± 0.09 1.20 ± 0.18 1.17 ± 0.11 0.97 ± 0.12 0.77 ± 0.12 0.60 ± 0.12 0.57 ± 0.09 0.03 ± 0.03Bromus hordeaceussubsp. thominei 0.40 ± 0.24 1.97 ± 0.67 1.10 ± 0.38 0.90 ± 0.06 0.93 ± 0.07 1.00 ± 0.14 0.47 ± 0.09 0.60 ± 0.09 0.10 ± 0.06Calamagrostis epigejos 10.10 ± 2.03 5.63 ± 1.41 6.67 ± 1.34 13.20 ± 2.68 11.87 ± 2.16 13.97 ± 3.28 15.07 ± 1.68 14.73 ± 2.35 9.63 ± 2.14Carex arenaria 6.20 ± 0.84 14.00 ± 2.02 9.77 ± 1.32 7.83 ± 1.03 13.70 ± 1.55 13.23 ± 2.67 10.40 ± 1.61 14.60 ± 1.93 3.97 ± 1.20Cladonia furcata 3.87 ± 0.84 0.87 ± 0.34 0.40 ± 0.24 1.93 ± 0.39 0.90 ± 0.27 0.53 ± 0.10 1.00 ± 0.34 0.40 ± 0.11 0.07 ± 0.05Crepis capillaris 0.63 ± 0.15 0.93 ± 0.32 0.53 ± 0.25 1.43 ± 0.19 1.70 ± 0.29 0.63 ± 0.16 0.57 ± 0.10 0.57 ± 0.12 0.17 ± 0.07Elymus repens 0.93 ± 0.51 0.03 ± 0.03 0.00 ± 0.00 2.03 ± 0.39 1.77 ± 0.70 6.23 ± 1.64 5.57 ± 1.37 12.03 ± 2.69 17.33 ± 4.51Erodium cicutarium 2.70 ± 0.68 3.30 ± 0.74 1.43 ± 0.53 0.60 ± 0.13 0.67 ± 0.11 0.23 ± 0.09 0.13 ± 0.06 0.20 ± 0.07 0.00 ± 0.00Festuca species 10.43 ± 1.80 17.67 ± 3.43 24.43 ± 2.84 17.80 ± 3.64 21.57 ± 4.07 37.53 ± 4.82 8.20 ± 1.50 6.17 ± 1.67 0.97 ± 0.40Galium verum 1.97 ± 0.74 2.23 ± 0.76 8.00 ± 2.68 1.63 ± 0.73 5.90 ± 2.39 9.47 ± 3.75 0.90 ± 0.25 6.90 ± 2.75 4.33 ± 1.53Geranium molle 0.43 ± 0.10 0.57 ± 0.09 0.50 ± 0.10 0.37 ± 0.09 0.53 ± 0.10 0.47 ± 0.10 0.33 ± 0.09 0.40 ± 0.09 0.37 ± 0.09Hypochaeris radicata 1.00 ± 0.42 2.20 ± 0.65 0.63 ± 0.28 0.97 ± 0.14 1.63 ± 0.36 0.80 ± 0.21 0.40 ± 0.24 0.53 ± 0.18 0.07 ± 0.07Leontodon species 4.70 ± 0.70 4.47 ± 0.66 4.10 ± 0.73 2.53 ± 0.41 3.10 ± 0.46 1.50 ± 0.32 1.10 ± 0.34 0.70 ± 0.20 0.10 ± 0.07Lotus corniculatus 2.53 ± 0.70 2.17 ± 0.66 4.67 ± 1.39 1.47 ± 0.51 1.33 ± 0.40 3.43 ± 1.22 0.60 ± 0.17 2.57 ± 1.67 0.37 ± 0.25Myosotis ramosissima 0.00 ± 0.00 0.00 ± 0.00 0.03 ± 0.03 0.87 ± 0.06 0.90 ± 0.09 0.50 ± 0.10 0.47 ± 0.09 0.20 ± 0.07 0.07 ± 0.05Ononis repens 5.93 ± 2.12 5.57 ± 1.65 9.33 ± 2.47 3.77 ± 1.79 4.30 ± 1.27 4.37 ± 1.49 0.90 ± 0.40 0.67 ± 0.37 0.13 ± 0.08Phleum arenarium 1.43 ± 0.42 0.57 ± 0.10 0.43 ± 0.12 0.67 ± 0.10 0.63 ± 0.13 0.40 ± 0.12 0.23 ± 0.08 0.27 ± 0.08 0.03 ± 0.03Appendix 6 (part I)52 Chapter 2
Poa pratensis 7.97 ± 1.67 7.33 ± 1.47 9.80 ± 1.89 1.67 ± 0.24 1.90 ± 0.30 6.00 ± 2.27 2.97 ± 0.99 2.53 ± 1.16 0.13 ± 0.06Sedum acre 3.87 ± 0.57 3.40 ± 0.66 3.47 ± 0.61 4.20 ± 0.70 3.13 ± 0.52 2.50 ± 0.50 0.73 ± 0.14 0.77 ± 0.18 0.07 ± 0.07Senecio jacobaea 5.70 ± 0.79 5.73 ± 0.89 8.67 ± 1.21 2.73 ± 0.33 4.07 ± 0.50 3.23 ± 0.53 7.40 ± 1.31 3.83 ± 0.61 1.03 ± 0.30Tortula ruralis var.ruraliformis 52.93 ± 5.64 49.60 ± 6.50 41.07 ± 5.80 50.40 ± 5.48 54.40 ± 7.51 51.50 ± 7.53 21.77 ± 5.88 11.40 ± 4.56 0.67 ± 0.67Veronica arvensis 0.03 ± 0.03 0.10 ± 0.06 0.07 ± 0.05 0.97 ± 0.03 0.93 ± 0.05 0.87 ± 0.06 0.20 ± 0.07 0.30 ± 0.09 0.03 ± 0.03Appendix 6 (part II): Mean and standard error (SE) of the cover of some plant species and some other vegetation parameters in the exclosures inIJzermonding, per treatment and per season. L+R+S = all grazers. R+S = rabbits and smaller herbivores, but no larger grazers. S = only herbivores that aresmaller than rabbits.Impact on vegetation 53
Dune Fossilede Ghyvelde summer 2000 summer 2001 summer 2005Treatment L+R+S R+S S L+R+S R+S S L+R+S R+S SMean ± SE Mean ± SE Mean ± SE Mean ± SE Mean ± SE Mean ± SE Mean ± SE Mean ± SE Mean ± SEmean vegetation height (cm) 17.82 ± 2.02 29.58 ± 2.18 36.32 ± 1.31 16.48 ± 1.94 28.11 ± 1.88 29.26 ± 1.71 24.56 ± 4.92 32.07 ± 3.02 31.89 ± 4.26% bare soil cover 7.17 ± 1.99 14.33 ± 3.01 10.33 ± 1.87 1.27 ± 0.60 6.90 ± 2.63 3.97 ± 1.45 4.90 ± 2.14 15.87 ± 3.97 0.22 ± 0.17% cover of woody plants 5.17 ± 1.56 4.00 ± 1.47 0.33 ± 0.23 4.47 ± 1.87 4.77 ± 1.58 0.67 ± 0.32 13.80 ± 4.38 20.43 ± 5.66 8.61 ± 3.72% cover of non-woody plants 77.50 ± 2.28 70.83 ± 3.75 81.00 ± 2.47 68.13 ± 3.06 65.90 ± 4.11 68.63 ± 4.00 81.57 ± 4.18 68.77 ± 4.72 91.94 ± 3.43% graminoid species coverin the non-woody cover 92.65 ± 1.18 91.77 ± 1.54 92.24 ± 1.37 74.19 ± 1.55 74.06 ± 1.61 76.96 ± 1.70 80.33 ± 2.53 80.98 ± 3.53 96.75 ± 1.43% annual plant species coverin the non-woody cover 8.25 ± 1.20 9.52 ± 1.54 4.70 ± 0.73 2.26 ± 0.28 2.95 ± 0.51 4.40 ± 1.07 1.09 ± 0.20 1.34 ± 0.46 0.52 ± 0.15% cover of mosses 67.83 ± 4.36 60.17 ± 4.74 61.50 ± 4.97 77.77 ± 4.02 69.33 ± 5.05 70.43 ± 4.92 59.07 ± 6.91 38.13 ± 7.15 60.22 ± 8.41% cover of litter 9.37 ± 1.41 13.67 ± 1.61 13.33 ± 1.50 34.40 ± 4.31 40.23 ± 5.25 53.13 ± 5.71 7.27 ± 2.91 14.17 ± 4.32 69.78 ± 7.83number of species per plot 13.73 ± 0.50 13.20 ± 0.40 13.73 ± 0.54 14.60 ± 0.60 14.50 ± 0.45 13.70 ± 0.57 13.43 ± 0.47 12.13 ± 0.73 11.22 ± 0.67Simpson's index of diversity 0.79 ± 0.01 0.79 ± 0.01 0.77 ± 0.01 0.75 ± 0.02 0.78 ± 0.01 0.72 ± 0.02 0.76 ± 0.01 0.72 ± 0.02 0.75 ± 0.02Agrostis capillaris 31.63 ± 4.65 23.20 ± 4.81 31.90 ± 5.16 31.50 ± 4.52 16.33 ± 3.60 29.57 ± 5.48 13.67 ± 2.76 8.30 ± 1.55 38.00 ± 5.43Aira praecox 2.57 ± 0.63 3.97 ± 0.73 1.80 ± 0.54 0.43 ± 0.10 0.57 ± 0.12 0.53 ± 0.27 0.03 ± 0.03 0.00 ± 0.00 0.00 ± 0.00Carex arenaria 26.93 ± 4.49 30.40 ± 4.64 28.60 ± 5.62 16.83 ± 3.28 24.67 ± 2.57 14.37 ± 2.41 31.47 ± 2.31 31.60 ± 3.91 27.50 ± 4.94Cladonia furcata 2.40 ± 0.62 4.67 ± 1.17 2.03 ± 0.58 0.87 ± 0.16 1.27 ± 0.30 1.83 ± 0.54 0.60 ± 0.12 0.47 ± 0.13 0.28 ± 0.14Dicranum scoparium 10.67 ± 4.18 4.57 ± 2.52 3.37 ± 1.42 8.13 ± 3.55 4.33 ± 2.63 5.23 ± 3.08 0.53 ± 0.27 0.57 ± 0.36 1.50 ± 1.12Festuca species 8.53 ± 1.57 10.73 ± 2.19 21.90 ± 3.88 3.70 ± 0.80 8.13 ± 2.27 17.23 ± 4.26 0.33 ± 0.10 1.00 ± 0.66 4.61 ± 2.44Galium verum 3.37 ± 0.71 3.33 ± 0.74 3.57 ± 0.69 2.30 ± 0.64 2.03 ± 0.55 2.83 ± 0.82 2.03 ± 0.59 1.83 ± 0.57 1.50 ± 0.58Geranium molle 1.47 ± 0.42 0.73 ± 0.16 0.50 ± 0.10 0.97 ± 0.18 0.80 ± 0.22 2.37 ± 0.90 0.60 ± 0.13 0.27 ± 0.08 0.28 ± 0.11Hypnum cupressiforme 29.90 ± 6.19 26.30 ± 5.51 24.67 ± 5.32 27.00 ± 6.66 26.53 ± 5.77 25.50 ± 5.97 10.10 ± 3.04 8.33 ± 3.33 11.89 ± 5.53Luzula campestris 8.60 ± 2.29 2.10 ± 0.72 3.13 ± 0.76 10.87 ± 2.17 2.87 ± 1.07 3.27 ± 1.01 19.40 ± 2.80 6.00 ± 1.91 3.44 ± 1.80Plagiomnium affine 5.97 ± 1.91 10.33 ± 3.50 19.20 ± 5.41 7.43 ± 2.97 9.37 ± 3.02 12.57 ± 4.23 5.13 ± 1.64 5.83 ± 2.36 22.56 ± 6.12Pseudoscleropodium purum 17.90 ± 5.44 12.83 ± 4.58 7.77 ± 2.23 28.67 ± 6.48 16.80 ± 5.36 17.33 ± 5.59 41.37 ± 6.95 20.87 ± 5.55 12.61 ± 5.41Rumex acetosella 4.23 ± 0.57 3.33 ± 0.56 4.43 ± 0.65 2.93 ± 0.47 2.97 ± 0.48 2.80 ± 0.40 8.07 ± 2.91 7.00 ± 1.92 3.11 ± 1.19Senecio jacobaea 3.83 ± 1.01 6.60 ± 2.03 5.53 ± 1.41 2.93 ± 0.42 3.83 ± 0.84 2.97 ± 0.75 16.77 ± 2.98 7.93 ± 2.02 2.89 ± 1.37Veronica arvensis 0.53 ± 0.09 0.53 ± 0.09 0.63 ± 0.09 0.00 ± 0.00 0.13 ± 0.06 0.03 ± 0.03 0.07 ± 0.05 0.03 ± 0.03 0.11 ± 0.08Appendix 7: Mean and standard error (SE) of the cover of some plant species and some other vegetation parameters in the exclosures in Dune Fossile deGhyvelde, per treatment and per season. L+R+S = all grazers. R+S = rabbits and smaller herbivores, but no larger grazers. S = only herbivores that aresmaller than rabbits.54 Chapter 2
IJzermonding All treatments L+R+S versus R+S L+R+S versus S R+S versus SPeriodChisquareDF P Chi-square DF PChisquareDF PChisquareDF Pmean vegetation height (cm) summer 2000 16.80 2 0.00 * 0.52 1 0.47 14.16 1 0.00 * 10.39 1 0.00 *summer 2001 35.51 2
Arenaria serpyllifolia summer 2000 4.37 2 0.11 4.92 1 0.03 0.46 1 0.50 1.63 1 0.20summer 2001 5.56 2 0.06 1.44 1 0.23 5.53 1 0.02 1.35 1 0.25summer 2005 21.11 2
Hypochaeris radicata summer 2000 4.12 2 0.13 1.52 1 0.22 0.61 1 0.44 3.89 1 0.05summer 2001 3.94 2 0.14 0.48 1 0.49 2.04 1 0.15 3.46 1 0.06summer 2005 7.33 2 0.03 1.07 1 0.30 3.75 1 0.05 7.30 1 0.01 *Leontodon species summer 2000 0.49 2 0.78 0.04 1 0.83 0.47 1 0.49 0.21 1 0.64summer 2001 8.43 2 0.01 * 0.72 1 0.40 3.94 1 0.05 7.97 1 0.00 *summer 2005 16.29 2 0.00 * 1.51 1 0.22 16.42 1
Veronica arvensis summer 2000 1.06 2 0.59 1.05 1 0.30 0.35 1 0.56 0.21 1 0.64summer 2001 2.14 2 0.34 0.35 1 0.56 1.93 1 0.16 0.73 1 0.39summer 2005 7.37 2 0.03 0.79 1 0.38 3.98 1 0.05 7.55 1 0.01 *Appendix 8 (part IV): Results of Kruskal-Wallis-tests of the cover of some plant species and some other vegetation parameters in the exclosures inIJzermonding, with treatment as independent variable, analysed per season. Chi-square = chi-square-value obtained by the test. DF = degrees of freedom. P= significance value obtained by the test. * indicates that P is still significant after sequential Bonferroni correction. L+R+S = all grazers. R+S = rabbits andsmaller herbivores, but no larger grazers. S = only herbivores that are smaller than rabbits.58 Chapter 2
Dune Fossile de Ghyvelde All treatments L+R+S versus R+S L+R+S versus S R+S versus SPeriodChisquareDF PChisquareDF PChisquareDF PChisquareDF Pmean vegetation height (cm) summer 2000 32.95 2
Agrostis capillaris summer 2000 4.17 2 0.12 3.61 1 0.06 0.04 1 0.84 2.58 1 0.11summer 2001 6.21 2 0.04 6.89 1 0.01 * 0.60 1 0.44 1.87 1 0.17summer 2005 16.69 2 0.00 * 0.98 1 0.32 11.42 1 0.00 * 14.47 1 0.00 *Aira praecox summer 2000 4.41 2 0.11 1.76 1 0.18 0.54 1 0.46 4.22 1 0.04summer 2001 3.19 2 0.20 0.48 1 0.49 1.42 1 0.23 3.00 1 0.08summer 2005 1.60 2 0.45 1.00 1 0.32 0.60 1 0.44 0.00 1 1.00Carex arenaria summer 2000 0.73 2 0.70 0.20 1 0.66 0.43 1 0.51 0.51 1 0.48summer 2001 9.32 2 0.01 * 6.34 1 0.01 * 0.15 1 0.70 7.48 1 0.01 *summer 2005 1.63 2 0.44 0.26 1 0.61 1.76 1 0.18 0.57 1 0.45Cladonia furcata summer 2000 1.05 2 0.59 0.74 1 0.39 0.00 1 0.97 0.80 1 0.37summer 2001 0.13 2 0.93 0.19 1 0.66 0.02 1 0.88 0.00 1 0.95summer 2005 3.32 2 0.19 1.02 1 0.31 3.27 1 0.07 0.78 1 0.38Dicranum scoparium summer 2000 1.66 2 0.44 0.67 1 0.41 0.14 1 0.70 1.73 1 0.19summer 2001 1.66 2 0.44 1.58 1 0.21 0.58 1 0.45 0.28 1 0.60summer 2005 0.37 2 0.83 0.00 1 0.95 0.25 1 0.62 0.32 1 0.57Festuca species summer 2000 6.73 2 0.03 0.21 1 0.64 5.91 1 0.02 * 3.89 1 0.05summer 2001 3.78 2 0.15 0.32 1 0.57 3.60 1 0.06 1.70 1 0.19summer 2005 1.21 2 0.54 0.03 1 0.86 1.08 1 0.30 0.80 1 0.37Galium verum summer 2000 0.06 2 0.97 0.02 1 0.88 0.06 1 0.80 0.01 1 0.92summer 2001 0.57 2 0.75 0.02 1 0.88 0.33 1 0.57 0.50 1 0.48summer 2005 0.09 2 0.96 0.06 1 0.81 0.07 1 0.79 0.01 1 0.94Geranium molle summer 2000 1.90 2 0.39 0.28 1 0.60 1.68 1 0.19 0.92 1 0.34summer 2001 4.17 2 0.12 1.44 1 0.23 0.72 1 0.40 4.12 1 0.04summer 2005 4.24 2 0.12 3.42 1 0.06 2.25 1 0.13 0.01 1 0.93Hypnum cupressiforme summer 2000 0.21 2 0.90 0.05 1 0.83 0.20 1 0.65 0.06 1 0.80summer 2001 1.15 2 0.56 0.04 1 0.84 1.16 1 0.28 0.62 1 0.43summer 2005 2.40 2 0.30 2.53 1 0.11 0.15 1 0.70 0.67 1 0.41Luzula campestris summer 2000 6.43 2 0.04 * 5.86 1 0.02 * 2.34 1 0.13 1.45 1 0.23summer 2001 13.63 2 0.00 * 10.64 1 0.00 * 9.15 1 0.00 * 0.16 1 0.69summer 2005 21.28 2
Pseudoscleropodium purum summer 2000 0.41 2 0.82 0.26 1 0.61 0.34 1 0.56 0.00 1 0.95summer 2001 2.68 2 0.26 2.07 1 0.15 1.85 1 0.17 0.00 1 0.98summer 2005 9.53 2 0.01 * 4.96 1 0.03 8.34 1 0.00 * 0.78 1 0.38Rumex acetosella summer 2000 1.43 2 0.49 1.35 1 0.25 0.00 1 0.99 0.80 1 0.37summer 2001 0.09 2 0.96 0.06 1 0.80 0.00 1 0.95 0.06 1 0.80summer 2005 4.33 2 0.11 0.54 1 0.46 2.53 1 0.11 3.82 1 0.05Senecio jacobaea summer 2000 0.52 2 0.77 0.06 1 0.81 0.71 1 0.40 0.05 1 0.82summer 2001 0.59 2 0.75 0.01 1 0.93 0.72 1 0.40 0.19 1 0.66summer 2005 17.41 2 0.00 * 6.29 1 0.01 * 15.18 1
Study area Period Exclosure ordination All treatments L+R+S versus R+S L+R+S versus S R+S versus StechniqueChisquareDF PChisquareDF PChisquareDF PChisquareDF PIJzermonding Summer 2000 Excl 1 PCA 13.20 2 0.00 * 8.31 1 0.00 * 7.41 1 0.01 * 5.03 1 0.03Excl 2 PCA 13.05 2 0.00 * 3.69 1 0.05 8.31 1 0.00 * 8.31 1 0.00 *Excl 3 PCA 2.84 2 0.24 0.92 1 0.34 0.23 1 0.63 3.69 1 0.05Excl 4 DCA 12.77 2 0.00 * 8.31 1 0.00 * 5.03 1 0.03 6.56 1 0.01 *Excl 5 PCA 11.56 2 0.00 * 0.41 1 0.52 8.31 1 0.00 * 8.31 1 0.00 *Summer 2001 Excl 1 PCA 13.56 2 0.00 * 8.31 1 0.00 * 7.41 1 0.01 * 5.77 1 0.02Excl 2 PCA 10.05 2 0.01 * 1.26 1 0.26 6.56 1 0.01 * 7.41 1 0.01 *Excl 3 PCA 2.29 2 0.32 0.10 1 0.75 1.64 1 0.20 1.64 1 0.20Excl 4 DCA 10.98 2 0.00 * 8.31 1 0.00 * 7.41 1 0.01 * 0.64 1 0.42Excl 5 PCA 12.77 2 0.00 * 6.56 1 0.01 * 8.31 1 0.00 * 5.03 1 0.03Summer 2005 Excl 1 DCA 12.54 2 0.00 * 2.56 1 0.11 8.31 1 0.00 * 8.31 1 0.00 *Excl 2 PCA 13.93 2 0.00 * 6.56 1 0.01 * 8.31 1 0.00 * 7.41 1 0.01 *Excl 3 PCA 10.05 2 0.01 * 0.64 1 0.42 8.31 1 0.00 * 5.77 1 0.02 *Excl 4 PCA 2.29 2 0.32 0.23 1 0.63 2.08 1 0.15 1.26 1 0.26Excl 5 PCA 14.75 2 0.00 * 8.31 1 0.00 * 8.31 1 0.00 * 7.41 1 0.01 *Ghyvelde Summer 2000 Excl 1 PCA 7.52 2 0.02 * 0.41 1 0.52 5.03 1 0.03 5.77 1 0.02 *Excl 2 PCA 10.98 2 0.00 * 8.31 1 0.00 * 7.41 1 0.01 * 0.41 1 0.52Excl 3 PCA 2.84 2 0.24 0.92 1 0.34 0.23 1 0.63 3.69 1 0.05Excl 4 PCA 14.36 2 0.00 * 6.56 1 0.01 * 8.31 1 0.00 * 8.31 1 0.00 *Excl 5 PCA 13.13 2 0.00 * 6.56 1 0.01 * 8.31 1 0.00 * 5.77 1 0.02Summer 2001 Excl 1 DCA 6.14 2 0.05 * 3.10 1 0.08 5.03 1 0.03 0.92 1 0.34Excl 2 PCA 11.82 2 0.00 * 8.31 1 0.00 * 6.56 1 0.01 * 3.10 1 0.08Excl 3 PCA 8.64 2 0.01 * 5.03 1 0.03 6.56 1 0.01 * 1.26 1 0.26Excl 4 DCA 13.56 2 0.00 * 7.41 1 0.01 * 8.31 1 0.00 * 5.77 1 0.02Excl 5 DCA 6.74 2 0.03 8.31 1 0.00 * 0.92 1 0.34 0.92 1 0.34Summer 2005 Excl 1 PCA 12.78 2 0.00 * 3.10 1 0.08 8.31 1 0.00 * 8.31 1 0.00 *Excl 2 PCA 5.19 2 0.07 2.08 1 0.15 4.33 1 0.04 * 1.26 1 0.26Excl 3 PCA 5.77 1 0.02 * 5.77 1 0.02 - - - - - -Excl 4 DCA 10.05 2 0.01 * 5.77 1 0.02 8.31 1 0.00 * 0.64 1 0.42Excl 5 DCA 0.10 1 0.75 0.10 1 0.75 - - - - - -62 Chapter 2
Appendix 10: Results of Kruskal-Wallis-tests on the scores of the pqs on the first ordination axis, with treatment as independent variable, per season and perexclosure. Chi-square = chi-square-value obtained by the test. DF = degrees of freedom. P = significance value obtained by the test. * indicates that P is stillsignificant after sequential Bonferroni correction. L+R+S = all grazers. R+S = rabbits and smaller herbivores, but no larger grazers. S = only herbivores thatare smaller than rabbits.Impact on vegetation 63
Species name Dutch name FamilyAgrostis capillaris Gewoon struisgras PoaceaeAgrostis stolonifera Fioringras PoaceaeAmmophila arenaria Helm PoaceaeAnthriscus caucalis Fijne kervel ApiaceaeArenaria serpyllifolia Zandmuur CaryophyllaceaeArrhenatherum elatius Glanshaver PoaceaeAvenula pubescens Zachte haver PoaceaeBrachythecium albicans Bleek dikkopmos BrachytheciaceaeBrachythecium rutabulum Gewoon dikkopmos BrachytheciaceaeBromus hordeaceus subsp.thominei Duindravik PoaceaeBromus sterilis IJle dravik PoaceaeBryonia dioica Heggenrank CucurbitaceaeBryum species Knikmos BryaceaeCalamagrostis epigejos Duinriet PoaceaeCarex arenaria Zandzegge CyperaceaeCerastium species Hoornbloem CaryophyllaceaeCeratodon purpureus Purpersteeltje DitrichaceaeCirsium species Vederdistel AsteraceaeCladonia furcataCladoniaceaeCladonia pyxidataCladoniaceaeCrepis capillaris Klein streepzaad AsteraceaeCynoglossum officinale Veldhondstong BoraginaceaeDactylis glomerata Gewone kropaar PoaceaeElymus athericus Strandkweek PoaceaeElymus repens Kweek PoaceaeErigeron canadensis Canadese fijnstraal AsteraceaeErodium cicutarium Gewone reigersbek GeraniaceaeErophila verna Vroegeling BrassicaceaeEurhynchium praelongum Fijn laddermos BrachytheciaceaeKiemplant FabaceaeFabaceaeFestuca species Zwenkgras PoaceaeGalium aparine Kleefkruid RubiaceaeGalium verum Geel walstro RubiaceaeGeranium molle Zachte ooievaarsbek GeraniaceaeHippophae rhamnoides Duindoorn ElaeagnaceaeHolcus lanatus Gestreepte witbol PoaceaeHomalothecium lutescens Smaragdmos BrachytheciaceaeHypochaeris radicata Gewoon biggenkruid AsteraceaeHypnum cupressiforme Gewoon klauwtjesmos HypnaceaeKiemplant dicotylKiemplant monocotylKoeleria macrantha Smal fakkelgras PoaceaeLamium purpureum Paarse dovenetel LamiaceaeLeontodon species Leeuwentand AsteraceaeLolium perenne Engels raaigras PoaceaeLotus corniculatus Gewone rolklaver FabaceaeAppendix 11 (part I)64 Chapter 2
Medicago minima Kleine rupsklaver FabaceaeMyosotis arvensis Akkervergeet-mij-nietje BoraginaceaeMyosotis ramosissima Ruw vergeet-mij-nietje BoraginaceaeOnonis repens Kruipend stalkruid FabaceaePeltigera caninaPeltigeraceaePhleum arenarium Zanddoddengras PoaceaePhleum pratense Gewoon timoteegras PoaceaePlantago coronopus Hertshoornweegbree PlantaginaceaePlantago lanceolata Smalle weegbree PlantaginaceaePoa pratensis Veldbeemdgras PoaceaeRhynchostegium megapolitanum Duinsnavelmos BrachytheciaceaeRubus caesius Dauwbraam RosaceaeRumex acetosella Schapenzuring PolygonaceaeSaxifraga tridactylites Kandelaartje SaxifragaceaeSedum acre Muurpeper CrassulaceaeSenecio jacobaea Jacobskruiskruid AsteraceaeSonchus species Melkdistel AsteraceaeStellaria media Vogelmuur CaryophyllaceaeTaraxacum species Paardenbloem AsteraceaeTortula ruralis var ruraliformis Groot duinsterretje PottiaceaeTragopogon pratensis Gele morgenster AsteraceaeTrifolium arvense Hazenpootje FabaceaeTrifolium campestre Liggende klaver FabaceaeTrifolium dubium Kleine klaver FabaceaeTrifolium repens Witte klaver FabaceaeTrifolium scabrum Ruwe klaver FabaceaeValerianella locusta Gewone veldsla ValerianaceaeVeronica arvensis Veldereprijs ScrophulariaceaeVicia species Wikke FabaceaeVulpia species Langbaardgras PoaceaeAppendix 11 (part II): Species list of the plant species found in the pqs in IJzermonding (from spring2000 until summer 2005).Impact on vegetation 65
Species name Dutch name FamilyAcer platanoides Noorse esdoorn SapindaceaeAgrostis capillaris Gewoon struisgras PoaceaeAira praecox Vroege haver PoaceaeAnthoxanthum odoratum Gewoon reukgras PoaceaeAphanes inexspectata Kleine leeuwenklauw RosaceaeArenaria serpyllifolia Zandmuur CaryophyllaceaeAvenula pubescens Zachte haver PoaceaeBrachythecium rutabulum Gewoon dikkopmos BrachytheciaceaeKiemplant BrassicaceaeBrassicaceaeBromus hordeaceus subsp.thominei Duindravik PoaceaeBryum species Knikmos BryaceaeCalamagrostis epigejos Duinriet PoaceaeCalliergonella cuspidata Gewoon puntmos AmblystegiaceaeCardamine hirsuta Kleine veldkers BrassicaceaeCarex arenaria Zandzegge CyperaceaeKiemplant CaryophyllaceaeCaryophyllaceaeCerastium species Hoornbloem CaryophyllaceaeCeratodon purpureus Purpersteeltje DitrichaceaeCladina arbusculaCladoniaceaeCladonia furcataCladoniaceaeCladonia pyxidataCladoniaceaeClaytonia perfoliata Witte winterpostelein PortulacaceaeClimacium dendroides Boompjesmos ClimaciaceaeCrataegus monogyna Eénstijlige meidoorn RosaceaeCrepis capillaris Klein streepzaad AsteraceaeCynoglossum officinale Veldhondstong BoraginaceaeDicranum scoparium Gewoon gaffeltandmos DicranaceaeErodium cicutarium Gewone reigersbek GeraniaceaeErophila verna Vroegeling BrassicaceaeEurhynchium praelongum Fijn laddermos BrachytheciaceaeKiemplant FabaceaeFabaceaeFestuca species Zwenkgras PoaceaeGalium aparine Kleefkruid RubiaceaeGalium verum Geel walstro RubiaceaeGeranium molle Zachte ooievaarsbek GeraniaceaeHieracium umbellatum Schermhavikskruid AsteraceaeHolcus lanatus Gestreepte witbol PoaceaeHypochaeris radicata Gewoon biggenkruid AsteraceaeHypnum cupressiforme Gewoon klauwtjesmos HypnaceaeKiemplant dicotylKiemplant monocotylLeontodon species Leeuwentand AsteraceaeLigustrum vulgare Wilde liguster OleaceaeLuzula campestris Gewone veldbies JuncaceaeMuscari comosum Kuifhyacint HyacinthaceaeMyosotis ramosissima Ruw vergeet-mij-nietje BoraginaceaePeltigera speciesPeltigeraceaePhleum arenarium Zanddoddengras PoaceaeAppendix 12 (part I)66 Chapter 2
Plagiomnium affineRondbladigboogsterrenmosMniaceaePleurochaete squarrosa Hakig kronkelbladmos PottiaceaePoa pratensis Veldbeemdgras PoaceaePolytrichum juniperinum Zandhaarmos PolytrichaceaePopulus tremula Ratelpopulier SalicaceaePseudoscleropodium purum Groot laddermos BrachytheciaceaeRacomitrium canescens Grijze bisschopmuts GrimmiaceaeRanunculus bulbosus Knolboterbloem RanunculaceaeRosa canina Hondsroos RosaceaeRubus species Braam RosaceaeRumex acetosella Schapenzuring PolygonaceaeSambucus nigra Gewone vlier AdoxaceaeSaxifraga tridactylites Kandelaartje SaxifragaceaeSedum acre Muurpeper CrassulaceaeSenecio jacobaea Jacobskruiskruid AsteraceaeSenecio sylvaticus Boskruiskruid AsteraceaeSonchus species Melkdistel AsteraceaeStellaria media Vogelmuur CaryophyllaceaeTaraxacum species Paardenbloem AsteraceaeTeesdalia nudicaulis Klein tasjeskruid BrassicaceaeTortula ruralis var ruraliformis Groot duinsterretje PottiaceaeUrtica dioica Grote brandnetel UrticaceaeVeronica arvensis Veldereprijs PlantaginaceaeVeronica officinalis Mannetjesereprijs PlantaginaceaeVicia species Wikke FabaceaeViola curtisii Duinviooltje ViolaceaeAppendix 12 (part II): Species list of the plant species found in the pqs in Dune Fossile de Ghyvelde(from spring 2000 until summer 2005).Impact on vegetation 67
IJzermondingAmmophila arenaria was present in the three treatments in spring and summer 2000,but disappeared from L+R+S and R+S in 2001 and had completely gone in 2005.Anthriscus caucalis, which was not present in each treatment in spring 2000 (missing inL+R+S) and summer 2001 (absent in L+R+S and R+S), and even completely lacking insummer 2000, was present in the three treatments in summer 2005.Arrhenatherum elatius and Bromus sterilis, completely absent in 2000, appeared in S in2001 and were present in R+S and S in 2005.Erodium cicutarium is present in all treatments until 2001, but disappeared from S in2005.During the four field periods, Peltigera canina was never found in S and in summer 2000and summer 2005, it was also not found in R+S.Plantago lanceolata was found in R+S only in spring 2000 and summer 2001; however,it was missing in S only in summer 2000 and was present in all the treatments insummer 2005.Trifolium campestre, totally absent in summer 2000, is present in all treatments inspring 2000 and summer 2001, but disappeared from S in summer 2005.Vulpia sp. was found only in R+S in spring 2000, but was present in the threetreatments in summer 2000 and 2001. Nevertheless, in summer 2005, it haddisappeared from S.GhyveldeIn 2000 and 2001, Aira praecox is present in all treatments, but in 2005, it is onlyobserved in L+R+S. Erodium cicutarium was not found in R+S in spring 2000 and wasabsent from S in summer 2000. In summer 2001, it was not seen at all, and in 2005, weobserved it again in R+S.Myosotis ramosissima was present in all treatments in 2000, but was missing in S in2001 and was observed in L+R+S only in 2005.Until 2001, Peltigera sp. was observed in the three treatments, but it completelydisappeared from the pqs in 2005.Seedlings of Populus tremula were completely absent in spring 2000, but appeared in Sin summer 2000. In summer 2005, they had also expanded to R+S.Tortula ruralis var. ruraliformis was found in all treatments in 2000, disappeared fromL+R+S in 2001 and had completely gone in 2005.Urtica dioica, found only in S in spring 2000 and only in L+R+S in summer 2000, wasobserved in L+R+S and S in 2001 and in all treatments in 2005.Viola curtisii, observed in all treatments in 2000, was missing in S in 2001. In 2005, itcould only be seen in R+S.Appendix 13: Qualitative differences in species composition between the treatments in IJzermondingand Ghyvelde.68 Chapter 2
Impact on vegetation 69
70Grasslands in Puyenbroeck, 2006 (Photographs by N. <strong>Somers</strong>)
CHAPTER 3Does vegetation height predictspatial foraging activityof the rabbit (Oryctolagus cuniculus L.)?<strong>Nele</strong> <strong>Somers</strong>, Katrien De Maeyer, Beatrijs Bossuyt, Luc Lens & Maurice Hoffmann71
AbstractThe wild rabbit (Oryctolagus cuniculus L.) is predicted to forage according to an unimodalfunctional response curve, which means that they would prefer a short to intermediatevegetation height for foraging rather than a high vegetation where food availability is higher.The higher food quality of a short-grazed vegetation is supposed to be responsible for this. Apossible consequence is the occurrence of facilitation: by grazing, large herbivores can makethe vegetation more suitable for smaller grazers. By performing two different studies in twostudy areas, we tested whether rabbits indeed prefer to graze in shorter vegetation, bycomparing rabbit activity in short (grazed or mown) and ungrazed vegetation. Mownvegetation in the most productive grassland site proved to be preferred by the animals, asindicated by an experimental set-up. There were no indications that this was due to adifference in forage quality. In a more complex, natural situation, rabbits were not facilitatedby large grazers: they did not prefer to graze in the shorter vegetation. We suggest thatexperimental studies might reveal phenomena that are masked under more complex fieldconditions, for instance due to variation in productivity of the grassland or the occurrence ofself-facilitation.72 Chapter 3
IntroductionGenerally, food intake by mammalian herbivores is predicted to increaseasymptotically with food density (Type II functional response, HOLLING, 1959) (OKSANEN etal., 1981; LUNDBERG, 1988; LUNDBERG & ÅSTRÖM, 1990; GROSS et al., 1993). Foodrequirements, however, can be expected to differ among taxa. While larger herbivores maytolerate forage of low nutritional quality if available in sufficiently large quantities, the highmetabolic rate and small digestive system of medium-sized grazers (DEMMENT & VAN SOEST,1985) entail a need for higher-quality forage, albeit in smaller quantities (PRINS & OLFF, 1998;OLFF et al., 2002). As fibre concentration of above-ground vegetation increases and nitrogenconcentration decreases during the process of ageing (BOS, 2002), a vegetation consisting offully-grown, mature plants is on average of lower nutritional quality than short swardsconsisting of regrown plants (‘grazing lawns’ sensu MCNAUGHTON, 1984). Hence, food intakerate of medium-sized grazers can be expected to be lower under high availability of lowqualityfood, and higher under low to intermediate availability of high-quality food (Type IVfunctional response; DEKKER & VAN LANGEVELDE, 2007), as reflected by unimodal, domeshapedresponse curves (BOS et al., 2002b; DURANT et al., 2003; VAN LANGEVELDE et al.,2008).Presumed differences in functional response between smaller and large herbivoreshave given rise to the concept of ‘feeding facilitation’ among herbivore assemblages, i.e.larger herbivores creating ‘grazing lawns’ for smaller species (ARSENAULT & OWEN-SMITH,2002). If coexistence of herbivore communities would partly (or entirely) depend onfacilitation (PRINS & OLFF, 1998; FARNSWORTH et al., 2002), removal or extinction of one ormore bulk feeders might directly affect persistence of smaller-sized species (HUISMAN & OLFF,1998) and, in the longer term, have significant evolutionary-ecological implications(MCNAUGHTON, 1984; CARDINALE et al., 2002). Evidence in favour of feeding facilitation hasbeen provided by studies on natural herbivore assemblages (MCNAUGHTON, 1976; KRUEGER,1986; STAHL et al., 2006) as well as on assemblages consisting of wild and domesticherbivores (e.g. GORDON, 1988; BOS et al., 2002c; KUIJPER, 2004; AUSTRHEIM et al., 2007;MYSTERUD & AUSTRHEIM, 2008). Other studies, however, failed to support such relationships(SINCLAIR & NORTON-GRIFFITHS, 1982) or revealed trends opposite to those predicted (VAN DERWAL et al., 1998). Apart from methodological grounds, heterogeneity in support of facilitationin medium-sized herbivores may stem from ecological differences among studies. First, thebalance of facilitation and competition may depend on plant productivity (KUIJPER et al.,2004; DEKKER & VAN LANGEVELDE, 2007), i.e. with decreasing plant productivity, interspecificVegetation height and rabbit foraging activity 73
competition for food can be expected to increase. Second, facilitation may show strongseasonality, e.g. only occur during the plant growing seasons (FRYXELL, 1991; ARSENAULT &OWEN-SMITH, 2002) or when food resources become limited (RUEDA et al., 2008). Third,feeding facilitation can be expected to be function of the difference in body mass amongcoexisting herbivores (PRINS & OLFF, 1998); i.e. when differences are either very small orvery large, smaller species may not (or to a lesser extent) benefit from the presence oflarger ones. Body mass can here be considered as a global measure determining energy andprotein requirements of the herbivore and its capacity to ingest and digest the vegetation.Fourth, the density of the large and medium-sized herbivores influences the outcome of theinteraction (BAKKER et al., <strong>2009</strong>). Facilitation is expected to be stronger at moderate largeherbivore grazing intensity and at a low medium-sized herbivore density. Finally, if highdensitygrazing by medium-sized herbivores results in grazing lawns, as has been observedin geese (VAN DER GRAAF et al., 2002) and rabbits (BAKKER et al., 2005), facilitation by largerherbivores may be replaced by self-facilitation (ARSENAULT & OWEN-SMITH, 2002).While rabbits are widely assumed to be facilitated by larger grazers (e.g. WILLIAMS etal., 1974; WALLAGE-DREES, 1982; OOSTERVELD, 1983; DREES, 1989; DREES, 1998; BOS et al.,2002a), supporting evidence is mainly anecdotic or indirect. Only limited systematic researchis available about the putative preference of rabbits for previously grazed (or clipped)vegetation and the hence deductible facilitative effect of large grazers on rabbits: purelyexperimental studies suggest the preference of the rabbit for shorter swards (IASON et al.,2002; BAKKER et al., <strong>2009</strong>); more descriptive field studies indicate a preference for swards ofmedium plant standing crop (VAN DE KOPPEL et al., 1996) or find no consistent effect of largeherbivores on rabbits (OLFF & BOERSMA, 1998). We conducted two field experiments to test if,and to what extent, wild rabbits (Oryctolagus cuniculus L.) are facilitated by domesticherbivores deployed in nature management. One experiment was a short-term experimentunder strictly controlled conditions in a homogeneous grazing habitat, while the secondexperiment was performed during a long-term period, in a complex natural environment witha spatially heterogeneous grazing habitat. We hypothesized that rabbits will prefer grazing invegetation that has been kept at low to intermediate height (by means of grazing ormowing) above grazing in higher vegetation.74 Chapter 3
Materials and methodsStudy areaExperiments were carried out in three study sites. Grazing-simulating mowingexperiments were conducted in the Flemish Provincial Domain ‘Puyenbroeck’ (Wachtebeke,Belgium, 51°9’11” N, 3°52’43” E, managed by the Provincial Government East-Flanders) ca.75 km W from Nieuwpoort. At this site, wild rabbits are the dominant natural grazers(absence of large grazers). Exclosure experiments were conducted in coastal dunegrasslands at the Flemish Nature Reserve ‘IJzermonding’ (Nieuwpoort, Belgium; 51°9’4” N,2°43’57” E; managed by ANB, Flemish Government) and the French Nature Reserve ‘DuneFossile de Ghyvelde’ (Ghyvelde, France, 51°2’48” N, 2°33’02” E; managed by Conservatoiredu Littoral), ca. 25 km apart. At both sites, wild rabbits comprise the dominant naturalgrazers while large domestic herbivores are used for grazing management (IJzermonding:Mergelland sheep, Ovis aries L.; Ghyvelde: Haflinger pony, Equus caballus L.). Moreinformation about these dune areas can be found in Chapter 1.Mowing experimentWe selected two flat, monotonous lawns (henceforth referred to as ‘grassland 1’ and‘grassland 2’) in the study area Puyenbroeck, both bordered by a Poplar plantation andmown at regular intervals. In each grassland, a single 72 x 30 m study plot was delineated,immediately bordering the woodland (grassland 1) or ca. 2 m away from it (grassland 2).Both plots were divided into eight strips of equal width (numbered 1-8 in Fig. 1), and twelve75 x 75 cm pqs were distributed evenly across each strip (totalling 96 pqs per grassland). Ina first experimental period (spring 2006), all grassland strips were mown at equal height(‘equal’ treatment). In the second period (spring-summer 2006), even strips were mown atequal height, while odd strips were left untouched (‘even’ treatment). In the third period(summer-autumn 2006), even strips were left untouched, and odd strips were mown atequal height (‘odd’ treatment).Vegetation height and rabbit foraging activity 75
Figure 1: Schematic presentation of one grassland of the mowing experiment. There are eight stripsof 9 m by 30 m, all bordering the forest. Within each strip, 12 pqs of 75 cm by 75 cm are marked off.Before the onset of the experiment, all rabbit pellets were removed in each pq. At theend of the three experimental periods (‘equal’ 25-26 April 2006; ‘even’ 10-12 July 2006; ‘odd’26-27 September 2006), the total numbers of pellets in each pq were counted andsubsequently removed. To estimate the rate of pellet decay, a total of 50 freshly collectedpellets were exposed in two small rabbit-proof exclosures in each grassland at the beginningof each experimental period and were counted at the end of this experimental period. On 8November 2006, x,y-coordinates of all rabbit burrows located in and around each grasslandwere recorded using GPS (Garmin GPS map 76 – see Fig.2) The mean distance betweeneach pq and the ten most close by rabbit holes was calculated.On every counting date, vegetation height was measured at the centre of each pq, bylowering down a disc (diameter 15 cm) with a central slot around a vertical ruler, measuringthe height at which the disc touches the vegetation first (combination of “drop disc method”and “sward stick method” described in STEWART et al. 2001). The mowing treatments provedto be adequate to establish significant differences in vegetation height between odd andeven strips during the ‘even’ and ‘odd’ treatment, while vegetation height was similar in allstrips during the ‘equal’ treatment (see Appendix 1).In addition, four plant samples per grassland were collected by clipping abovegroundvegetation. We collected on average 12 g dry weight per sample, consisting of a mix of the76 Chapter 3
present plant species. The samples were distributed equally over short and long strips. Theywere dried at 60°C (WTB Binder with controller RD 2 EED/FED; Binder, Tuttlingen, Germany)until no further mass loss was detected, after which the dried plants were grinded. Thepercentage of crude protein (CP) and of cell wall constituents (cellulose, hemicellulose andlignin, which were derived from NDF (neutral detergent fibre), ADF (acid detergent fibre)and ADL (acid detergent lignin)) were obtained by Near Infrared Spectroscopy (NIRS – formore information see GIVENS et al. (1997)). A FOSS Feed and Forage Analyzer was used,combined with Winisi software (FOSS, Brussels, Belgium). The calibration for the NIRS wascarried out by performing wet analyses for approximately 10% of the samples, following themethod of Kjeldahl for CP and GOERING & VAN SOEST (1970) and VAN SOEST et al. (1991) forcell wall constituents. Forage quality for rabbits was approximated by DP (digestible proteinpercentage) and DE (digestible energy). Amounts of digestible protein were estimated bymultiplying CP with the mean digestibility coefficient of CP for grasses (value of 0.70; MAFF,1986). Digestible energy was estimated by multiplying Gross Energy (based on MAFF 1986)with a coefficient of digestibility, quantified as 0.867 – 0.0012 ADF (g/kg DM) (DE BLAS et al.,1992).Vegetation height and rabbit foraging activity 77
Figure 2: Presentation of the two grasslands of the mowing experiment, based on coordinatesobtained by GPS. The rabbit holes, the forest border and the sticks (marking off the strips in eachgrassland) are indicated. In grassland 1, a separate group of rabbit holes can be seen near strip 8. Allother rabbit holes are situated in or near the forest.78 Chapter 3
Exclosure experimentBetween August 1999 - April 2000, a total of five exclosures (each consisting of threetreatments of 350 x 350 cm) were set up along shrub-grassland edges in coastal dunegrasslands at IJzermonding and Ghyvelde (Fig. 3). Within each exclosure treatment, six 75 x75 cm permanent quadrants (pqs) were delineated and assigned to one of the threetreatments: (i) larger herbivores, rabbits and smaller herbivores allowed (L+R+S); (ii) largerherbivores excluded (R+S); (iii) larger herbivores and rabbits excluded (S). L+R+Streatments were not fenced, R+S treatments were fenced with non rabbit-proof wire, Streatments were fenced with rabbit-proof wire.Figure 3: Schematic presentation of one exclosure-group. Each group is positioned near shrubs andconsists of one L+R+S-treatment (accessible to all herbivores), one R+S-treatment (accessible torabbits and smaller herbivores, not to larger herbivores) and one S-treatment (accessible to smallherbivores but not to rabbits and larger herbivores). Six pqs of 75 cm by 75 cm are marked off withineach treatment.Between April-September 2000 and August 2001- September 2005, monthly or bimonthlycounts of rabbit pellets were performed in L+R+S and R+S pqs. To estimate therate of pellet decay, 100 freshly collected pellets were placed in the S treatment within eachexclosure and the remaining pellets were counted during the following visit.During April 2000 (spring season), June-September 2000, July-September 2001, andAugust-September 2005 (summer season), vegetation height in each pq was measured(Appendix 2) at 25 randomly selected points by lowering down a disc (diameter 15 cm) withVegetation height and rabbit foraging activity 79
a central slot around a vertical ruler, measuring the height at which the disc touches thevegetation first (see higher). We did not measure vegetation height during the otherseasons, but it was visually observed that the patterns in those other seasons were similar tothose measured in the earlier mentioned seasons. As the grazing treatment did not result insignificant differences in vegetation height in IJzermonding (except for summer 2005), theresults of this study area (Appendix 3) are not discussed further. In Ghyvelde, the grazingtreatment did significantly influence the vegetation height, except for spring 2000.Therefore, spring 2000 was omitted from the analyses of the data of Ghyvelde. Additionalvegetation measurements are described in Chapter 2.In August-September 2005 (summer season), the aboveground vegetation of arandom selection of pqs was totally clipped. Generally, two pqs per exclosure and pertreatment were sampled. (By exception, 3 extra samples were taken in IJzermonding (2 inL+R+S and 1 in S) and 5 samples from Ghyvelde are missing (1 accidentally in L+R+S and 4in S because some ponies succeeded to graze the vegetation of these plots).) The foodquality of these samples was analysed as described above.Preference for vegetation heightTo assess preference for low versus high vegetation in the exclosure and mowingexperiments, we used the method of TAYLOR & WILLIAMS (1956) to estimate rabbit densities,taking into account daily production of pellets per individual, rate of pellet decay, and timeinterval between consecutive counts:number of rabbits/ha = m2.k1 – m1.k2 . ln(k1 / k2)g.(k1 – k2) (t2 – t1)in whichm1, m2: mean number of pellets per plot during the first (1) and second (2) count, at thelevel of the study site (exclosure experiment) or individual pq (mowing experiment); aspellets were removed from each plot after each count, m1=0; t2-t1: time interval betweentwo consecutive counts; k1, k2: rate of pellet decay based on samples of 50 (mowingexperiments) or 100 (exclosure experiments) pellets exposed away from rabbits; g: numberof pellets produced per rabbit and per day, estimated at 333 which was the average of 360pellets/ind/day reported by LOCKLEY (1962; 1976) and 305 pellets/ind/day based on nine80 Chapter 3
days’ counts of pellets of six domestic rabbits (Chapter 5). Rabbit densities were calculatedper date, grassland and plot for mowing experiments and per date, study area andtreatment (L+R+S, R+S) for exclosure experiments.Statistical analysisEffects of mowing on rabbit activity in Puyenbroeck was evaluated with generalizedmixed models, one for the control period (when even and odd strips both were mown) andone for the two treatment periods together. Fixed factors included TREATMENT (even or oddstrip (control) or long or short strip (treatment)), DISTANCE (the mean distance from the pq tothe ten most close rabbit holes) and SEASON (only for the ‘treatment’-model, in order tocorrect for the seasonal differences between the two treatment periods). The GRASSLAND (1-2), STRIP (1-16) and PQ (1-192) were included as random factors. Pqs in which the number ofrabbit pellets equalled zero during both of the two treatment periods have been omittedfrom the analysis. Treatment effects on DP and DE were evaluated by Kruskal-Wallis-tests.After applying square root transformation of rabbit activity in the dune areas, weused paired t-tests to evaluate differences between exclosure treatments. Treatment effectson DP and DE were evaluated by a general linear model, with TREATMENT as the only factor.The statistical tests were performed with SAS 9.1 (SAS Institute Inc., Cary, NorthCarolina).ResultsThe mowing experimentThe estimated presence of rabbits was similar for even and odd strips in the controlperiod (similar vegetation height – Table 1 and Table 2). The vegetation height was alsosimilar for the odd and even strips (Appendix 1), although significantly higher in grassland 2than in grassland 1. As the vegetation was quite low in the control period, ‘long’ strips duringthe following experimental periods would originate from fresh, regrowing vegetation. Thedistance between the pq and the rabbit burrows negatively influenced the rabbit activity.Therefore, this measure was also included in the mixed model for the treatment periods.Significant differences in rabbit presence between the short and long strips wereobserved during the mowing treatments (Table 2): the number of rabbits was higher in thestrips mown short than in the unmown strips. There was also a significant differenceVegetation height and rabbit foraging activity 81
etween the presence of rabbits between season 1 and 2: the rabbit presence was muchhigher in season 1. No effect of distance could be observed here.The Kruskal-Wallis-tests comparing DP and DE for the even and odd strips indicatethat there were no significant differences between the strips.82 Chapter 3
Number of rabbitsDP (%)DE (MJ / kg DM)Grassland121212Description oftreatmentSimilar vegetationheightAverage ± standardStriperrorEven =similar 100 ± 67Odd = similar 100 ± 62'Even' treatment Even = short 228 ± 65Odd = long 102 ± 59'Odd' treatment Odd = short 61 ± 31Even = long 0 ± 0Similar vegetationheightEven =similar 91 ± 34Odd = similar 200 ± 54'Even' treatment Even = short 263 ± 93Odd = long 99 ± 20'Odd' treatment Odd = short 29 ± 9Even = long 16 ± 8Similar vegetationheightEven =similar 11.23 ± 0.96Odd = similar 10.17 ± 1.33'Even' treatment Even = short 9.51 ± 1.13Odd = long 7.47 ± 0.16'Odd' treatment Odd = short 14.40 ± 0.30Even = long 13.16 ± 0.91Similar vegetationheightEven =similar 14.03 ± 1.56Odd = similar 14.22 ± 1.28'Even' treatment Even = short 8.30 ± 0.93Odd = long 6.70 ± 0.17'Odd' treatment Odd = short 11.94 ± 0.33Even = long 11.43 ± 1.11Similar vegetationheightEven =similar 11.67 ± 0.00Odd = similar 11.30 ± 0.43'Even' treatment Even = short 10.97 ± 0.08Odd = long 9.49 ± 0.05'Odd' treatment Odd = short 11.02 ± 0.20Even = long 11.05 ± 0.00Similar vegetationheightEven =similar 12.26 ± 0.06Odd = similar 12.15 ± 0.17'Even' treatment Even = short 11.10 ± 0.18Odd = long 11.84 ± 0.00'Odd' treatment Odd = short 10.44 ± 0.20Even = long 11.22 ± 0.24Table 1: Averages and standard error of the number of rabbits, DP (percentage of digestible protein)and DE (MJ per kg dry matter) of the mowing experiment. The results are presented per grassland,per treatment period and subdivided by even and odd strips (which also represents the short and longvegetation height in the two last treatment periods).Vegetation height and rabbit foraging activity 83
Effect on the number of rabbitsEffect on DPEffect on DEEffectNum DF Den DF F-value Prob EstimateControl Even or odd strip 1 76 0.89 0.349 Even: -83.89; Odd: 0.00Distance 1 76 4.78 0.032 -8.42Covariance parameter estimatesGrassland 0.00Strip 18457.00PQ 0.00Residual 52071.00Num DF Den DF F-value Prob EstimateTreatment Short or long strip 1 167 5.43 0.021 Long: -87.72; Short: 0.00Season 1 167 16.38
and summer 2005 (Appendix 2). There were no significant differences in DP and DE betweenthe treatments.GHYVELDEAverage ± standard error Paired t-test or GLML+R+S R+S DF t-value or F-value ProbRabbits peryear 2000 22 ± 1 25 ± 6 1 -0.42 0.7492001 5 ± 2 6 ± 2 4 -0.93 0.4062002 21 ± 4 23 ± 5 11 -0.95 0.3652003 35 ± 5 31 ± 5 9 1.12 0.2922004 59 ± 10 62 ± 12 9 -0.75 0.4702005 22 ± 4 27 ± 5 6 -2.40 0.053Rabbits Spring 57 ± 10 61 ± 11 8 -0.94 0.373per season Summer 33 ± 6 37 ± 7 13 -1.74 0.106Autumn 21 ± 5 19 ± 4 11 0.54 0.599Winter 17 ± 4 16 ± 3 10 0.28 0.785Rabbits Summer 2000 22 ± 1 25 ± 6 1 -0.42 0.749per season and Summer 2001 6 ± 2 8 ± 3 1 -13.09 0.049year Autumn 2001 4 ± 3 5 ± 2 2 -0.30 0.792Winter 2002 3 ± 1 5 ± 2 2 -1.27 0.331Spring 2002 37 ± 4 45 ± 7 2 -2.82 0.106Summer 2002 27 ± 4 27 ± 7 2 0.11 0.925Autumn 2002 15 ± 6 13 ± 3 2 0.34 0.767Winter 2003 24 ± 2 16 ± 2 2 11.70 0.007Spring 2003 56 ± 22 47 ± 1 1 0.34 0.793Summer 2003 38 ± 12 46 ± 21 1 -0.83 0.558Autumn 2003 29 ± 1 26 ± 1 2 3.46 0.075Winter 2004 36 ± 16 33 ± 11 1 0.37 0.775Spring 2004 86 ± 19 94 ± 22 2 -1.39 0.299Summer 2004 78 ± 5 90 ± 3 1 -1.50 0.374Autumn 2004 36 ± 14 32 ± 8 2 0.35 0.761Winter 2005 13 ± 3 14 ± 3 2 -0.55 0.638Spring 2005 27 ± n.a. 38 ± n.a. n.a. n.a. n.a.Summer 2005 30 ± 1 36 ± 3 2 -3.21 0.085Rabbits - alldata 31 ± 4 32 ± 4 45 -1.10 0.277DP (%) Summer 2005 7.28 ± 0.35 6.99 ± 0.28 1/17 0.45 0.513DE (MJ / kgDM) Summer 2005 9.01 ± 0.44 8.24 ± 0.23 1/17 2.52 0.131Table 3: Results of the rabbit counts and DP and DE in Ghyvelde. Averages and standard errors arepresented per treatment (L+R+S = accessible to all herbivores; R+S: accessible to rabbits and smallerherbivores, but not to large grazers). Rabbit counts are presented by year, by season, by season andyear or all together. The results of the paired t-tests (for the rabbit counts) and the GLM (for DP andDE) are presented. DF = degrees of freedom. T-value or F-value = test statistic obtained by the test.Prob = the significance level obtained by the test. n.a. = not applicable (only one data pointavailable).Vegetation height and rabbit foraging activity 85
DiscussionThe results of the clipping experiment in Puyenbroeck indicate that the rabbitspreferred a lower vegetation, while this pattern was not observed in the dune area ofGhyvelde. A drastic, short-term experimental mowing regime confirmed our hypothesis thatrabbits do prefer shorter swards (leading to facilitation), but a long-term grazing trial undermore complex natural circumstances did not confirm the hypothesis (and did neither indicatethe opposite possibility of competition). Two remarkable considerations concerningPuyenbroeck are 1. that after reversing the place of the treatment (the reversal of the evenand the odd strips), the results are still significant and 2. that during the control period(similar vegetation height in all strips), a period in which vegetation height was notsignificantly different between the strips, there was no such preference for the odd or evenstrips. This makes the finding that facilitation of rabbits in Puyenbroeck is probable evenstronger. Considering the significant differences of the vegetation height during the twoexperimental periods, in both grasslands, we can conclude that vegetation height determinedthe activity pattern of the rabbits in Puyenbroeck. This is consistent with the findings ofBAKKER et al., (<strong>2009</strong>) and IASON et al. (2002).However, our results do not suggest that this preference is caused by a difference invegetation quality, when comparing the lower and higher vegetation. Despite the fact thatwe earlier proved that rabbits are able to distinguish between food samples of differentquality (SOMERS et al., 2008; Chapter 4), this quality does not seem to interfere with theirpreference for short swards. Table 1 shows that overall the average DP of short vegetation isslightly higher than that of the taller vegetation, suggesting a higher quality of the shortervegetation. These differences proved to be not significant though. As the sample size of thequality measurements is rather low, we could wonder whether the differences are really notsignificant or whether the sample size was simply too small to detect significant differences.Nevertheless, even five years of different grazing regimes in Ghyvelde also did notsignificantly alter the food quality between the treatments, so we should consider somealternative hypotheses to explain the preference of the rabbits for short vegetation. IASON etal. (2002) propose that the preference of their study rabbits for short vegetation originatedfrom antipredator considerations of the animals (better visibility of predators in an openvegetation). Also, short swards could improve communication with other rabbit individuals incase of predator detection (warning by upturned white tail). Foraging decisions are assumedto be titrations of costs and benefits within and across patches; herbivores would balanceconflicting demands for food acquisition and safety (KOTLER & BLAUSTEIN, 1995). This means86 Chapter 3
that it is possible that the unimodal functional response curve of rabbits is not caused byfood quality considerations, but is simply the price to pay when they want to graze in a safeway: a large return of high biomass is not possible because it is too dangerous. However,the experiments of BAKKER et al. (2005) and DEKKER et al. (2007) show that rabbits aresensitive to perceived predation risk, but this does not influence the average spatialdistribution of their grazing pressure. Rather, the rabbits shifted the time of foraging or didincrease total foraging time (spending more time on vigilance). Another suggestion is thatforage efficiency (handling time) in a dense vegetation is higher than in a low, openvegetation (VAN DE KOPPEL et al., 1996). It is clear that further research on these hypothesesis necessary.In Ghyvelde, facilitation does not seem to be present yet, but maybe there is achance that it would start to occur in future years: the balance between competition andfacilitation might have shifted towards a neutral point due to the growing difference betweenthe vegetation height during the experiment, and maybe, it will further shift towardsfacilitation in the future? According to KUIJPER et al. (2008), species competing each other forthe same resources on short time-scale might well be facilitating each other when looking atlarger time-scales (e.g. while taking plant species replacement into account). Also, whenfacilitation occurs, its effect becomes stronger over the years (BAKKER et al., <strong>2009</strong>). However,at present, we have no indications that facilitation will occur in Ghyvelde while facilitation inthe mowing experiment at Puyenbroeck is already occurring after a few months.So we consider some possible factors masking or preventing facilitation in the dunearea. A first possible explanation is that vegetation height in Ghyvelde in L+R+S is mostlynot that much lower than unmown strips in Puyenbroeck. Maybe, the vegetation in Ghyveldeshould simply be shorter to allow facilitation. However, mean vegetation height in Ghyveldeis probably quite high as a consequence of the height of the shrub layer. The grass layeritself was probably not that much higher than the mown strips in Puyenbroeck.An important possible explanation comes from the different plant productivity levelsof the two study areas. The study sites in Ghyvelde have a relatively low productivity.Possibly, each herbivore is just taking what it can get, as the availability of food is quite low.In the highly productive grasslands of Puyenbroeck, regrowth is occurring much quicker, andafter mowing, the stimulation of the formation of a grazing lawn is starting directly, leadingto the occurrence of rabbit facilitation.Seasonality did not seem to have any effect on the grazing behaviour of the rabbits.The rabbits in IJzermonding and Ghyvelde did not change their vegetation preferencesduring the different seasons, neither during the growing season, neither in the season whenVegetation height and rabbit foraging activity 87
esources are limiting, which is the winter season for the rabbits in our study areas(WALLAGE-DREES, 1988). The experiment in Puyenbroeck was stopped before the start of thewinter, but it would be an interesting suggestion for further research to extend thisexperiment during a longer period, in order to investigate whether seasonality is influencingthe behaviour of rabbits towards short and high vegetation.An alternative explanation involves the type of herbivore involved in the differentareas. When there is no optimum difference in body mass to allow facilitation (PRINS & OLFF,1998), facilitation cannot be expected. This is shown by the decrease of rodents in thepresence of cattle (KEESING, 1998; BAKKER et al., <strong>2009</strong>; STEEN et al., 2005) and the decreaseof insects in the presence of lagomorphs (GRAYSON & HASSALL, 1985; HUNTZINGER et al.,2008), although sometimes the abundance of insects is increased by vertebrate grazing(RAMBO & FAETH, 1999). The herbivores involved in Ghyvelde (ponies) are not the same asthe ’large herbivore’ in Puyenbroeck (an artificial one: the mowing machine). However, sincethis artificial ‘grazer’ was ‘grazing’ large quantities of forage, we could consider it a model fora large, generalist herbivore (a bulk feeder) present in large densities. As this bulk feederwas facilitating the rabbits of Puyenbroeck, we have no reason to assume that the bodymass of the ponies of Ghyvelde would be too large to allow for facilitation. We can concludethat body mass differences between the herbivores of our two areas are not sufficient toexplain the different results of these areas.We could not compare the densities of large herbivores in both study areas, as the“large herbivore” was artificial in Puyenbroeck. We can however compare rabbit densitybetween the areas. As facilitation would indeed be more important in areas with low rabbitdensity (BAKKER et al., <strong>2009</strong>), we would expect that facilitation would occur in Ghyvelderather than in Puyenbroeck. This was however not the case, so we conclude that rabbitdensity in Ghyvelde is not too high to obtain facilitation.Finally, self-facilitation (ARSENAULT & OWEN-SMITH, 2002) could be a valuablealternative explanation for the lack of visible feeding facilitation in Ghyvelde. It might bepossible that the grazing pressure inside the exclosures of Ghyvelde is so high that theyprefer to maintain a grazing lawn inside this exclosure, thereby avoiding possible competitiveinteractions with herbivores outside the exclosure. Nevertheless, as the vegetation height inGhyvelde is increasing over the years, we can assume that the rabbits are not able tomaintain the grazing lawns themselves and in the future, facilitation will be more necessarythan ever before.This research aimed to investigate whether rabbits indeed do prefer short vegetationabove longer vegetation, as predicted by an unimodal functional response. Clearly, the88 Chapter 3
conditions under which facilitation is tested are determining for the research outcome.Straight experimental conditions are able to reveal clear patterns, which is probably due tothe simplicity of the environment. In complex natural situations, many more factors couldinfluence the behaviour of the animals, thereby possibly masking trends that couldeffectively be present. Also, we cannot exclude that some biological factors (like largeherbivore species, grassland productivity, season, herbivore density) are the reason for theobserved differences between Puyenbroeck and Ghyvelde, which stresses our opinion thatfacilitation should be tested under various conditions, and that one study indicating nofacilitation in a herbivore assemblage should not be considered decisive. Further, our resultsdid not indicate a higher food quality to be responsible for the rabbits’ preference for shortvegetation in a high-productive grassland. Although some plausible alternative explanationshave been discussed, none of them seem to be entirely satisfying on their own. Also on thistopic, further research is clearly necessary.AcknowledgementsWe thank the Agency for Nature and Forest (ANB, Flemish Government), the Conservatoire duLittoral and the Provincie Oost-Vlaanderen for allowing access to the study areas and making itpossible to perform the experiments. Technical support was provided by the mowing technicians ofPuyenbroeck, Ward Vercruysse (INBO), Wim De Belder (INBO), Patrick Geers (INBO) and MaartenPevenage. We are grateful to INBO and ILVO for analyses of plant material. We thank the FlandersMaritime Institute (VLIZ) for the use of their infrastructure and Chris Van Waes (ILVO, PlantDepartment) for the information on the plant analysis procedure. We also want to thank CarlVangestel for statistical help and Carine Wils (INBO) for help with ArcGIS. The first author issupported by the Research Foundation – Flanders (Aspirant of the FWO-Vlaanderen).ReferencesARSENAULT, R. & N. OWEN-SMITH (2002). Facilitation versus competition in grazing herbivoreassemblages. Oikos 97: 313-318.AUSTRHEIM, G., A. MYSTERUD, K. HASSEL, M. EVJU & R.H. ØKLAND (2007). Interactions between sheep,rodents, graminoids, and bryophytes in an oceanic alpine ecosystem of low productivity.Ecoscience 14:178-187.BAKKER, E.S., H. OLFF & J.M. GLEICHMAN (<strong>2009</strong>). Contrasting effects of large herbivore grazing on smallerherbivores. Basic and Applied <strong>Ecology</strong> 10: 141-150.BAKKER, E.S., R.C. REIFFERS, H. OLFF & J.M. GLEICHMAN (2005). Experimental manipulation of predationrisk and food quality: effect on grazing behaviour in a central-place foraging herbivore.Vegetation height and rabbit foraging activity 89
Oecologia 146: 157-167.BOS, D. (2002). Synthesis: Habitat use by Brent Geese in the Wadden Sea under different scenarios oflivestock-grazing management. In BOS, D., Grazing in coastal grasslands, Brent Geese andfacilitation by herbivory, <strong>PhD</strong> dissertation, Rijksuniversiteit Groningen, Groningen, theNetherlands: 189-205.BOS, D., J.P. BAKKER, Y. DE VRIES & S. VAN LIESHOUT (2002a). Long-term vegetation changes inexperimentally grazed and ungrazed back barrier marshes in the Wadden Sea. In BOS, D.,Grazing in coastal grasslands, Brent Geese and facilitation by herbivory, <strong>PhD</strong> dissertation,Rijksuniversiteit Groningen, Groningen, the Netherlands:111-130.BOS, D., J. VAN DE KOPPEL, & F.J. WEISSING (2002b). Brent Geese aggregate to cope with increased levelsof primary production. In BOS, D., Grazing in coastal grasslands, Brent Geese and facilitation byherbivory, <strong>PhD</strong> dissertation, Rijksuniversiteit Groningen, Groningen, the Netherlands: 85-106.BOS, D., M. LOONEN, M. STOCK, F. HOFEDITZ, S. VAN DER GRAAF & J.P. BAKKER (2002c). Utilisation ofWadden Sea salt marshes by geese in relation to livestock grazing. In BOS, D., Grazing incoastal grasslands, Brent Geese and facilitation by herbivory, <strong>PhD</strong> dissertation, RijksuniversiteitGroningen, Groningen, the Netherlands:131-153.CARDINALE, B.J., M.A. PALMER & S.L. COLLINS (2002). Species diversity enhances ecosystem functioningthrough interspecific facilitation. Nature 415: 426-429.DE BLAS, C., J. WISEMAN, M.J. FRAGA & M.J. VILLAMIDE (1992). Prediction of the digestible energy anddigestibility of gross energy of feeds for rabbits. 2. Mixed diets. Animal Feed Science andTechnology 39: 39-59.DEKKER, J.J.A. & F. VAN LANGEVELDE (2007). Plant productivity and free-ranging herbivores impact spatialforaging patterns and population dynamics of refuge-living herbivores. In: DEKKER, J.J.A.,Rabbits, refuges and resources. How foraging of herbivores is affected by living in burrows. <strong>PhD</strong>dissertation, Wageningen <strong>Universiteit</strong>, Wageningen, the Netherlands: 65-84.DEKKER, J.J.A., M.L.W.J. BROEKHUIJSE, W.F. DE BOER, F. VAN LANGEVELDE, S.E. VAN WIEREN & H.H.T. PRINS(2007). Grazing gradients around refuges of small herbivores are caused by spatial variation invigilance. In: DEKKER, J.J.A., Rabbits, refuges and resources. How foraging of herbivores isaffected by living in burrows. <strong>PhD</strong> dissertation, Wageningen <strong>Universiteit</strong>, Wageningen, theNetherlands: 19-31.DEMMENT, M.W. & P.J. VAN SOEST (1985). A nutritional explanation for body-size patterns of ruminantand nonruminant herbivores. The American Naturalist 125: 641-672.DREES, M. (1989). Konijnen als grazers. Duin 12: 156-158.DREES, M. (1998). Langoor. Over konijnen en vegetatie in de duinen. Duin 21: 4-6.DURANT, D., H. FRITZ, S. BLAIS & P. DUNCAN (2003). The functional response in three species ofherbivorous Anatidae: effects of sward height, body mass and bill size. Journal of Animal<strong>Ecology</strong> 72: 220-231.FARNSWORTH, K.D., S. FOCARDI & J.A. BEECHAM (2002). Grassland-herbivore interactions: how do grazerscoexist? The American Naturalist 159: 24-39.90 Chapter 3
FRYXELL, J.M. (1991). Forage quality and aggregation by large herbivores. The American Naturalist138:478-498.GIVENS, D.I., DE BOEVER, J.L. & DEAVILLE, E.R. (1997). The principles, practices and some futureapplications of near infrared spectroscopy for predicting the nutritive value of foods for animalsand humans. Nutrition research reviews 10: 83-114 .GOERING, H.K. & P.J. VAN SOEST (1970). Forage Fibre Analysis (Apparatus, Reagents, Procedures, andSome Applications). Agricultural Handbook No. 379, Agricultural Research Service, United StatesDepartment of Agriculture.GORDON, I.J. (1988). Facilitation of red deer grazing by cattle and its impact on red deer performance.Journal of Applied <strong>Ecology</strong> 25: 1-10.GRAYSON, F.W.L. & M. HASSALL (1985). Effects of rabbit grazing on population variables of Chortippusbrunneus (Orthoptera). Oikos 44: 27-34.GROSS, J.E., L.A. SHIPLEY, N.T. HOBBS, D.E. SPALINGER & B.A. WUNDER (1993). Functional response ofherbivores in food-concentrated patches: tests of a mechanistic model. <strong>Ecology</strong> 74: 778-791.HOLLING, C.S. (1959). Some characteristics of simple types of predation and parasitism. CanadianEntomologist 91: 385-398.HUISMAN, J. & H. OLFF (1998). Competition and facilitation in multispecies plant-herbivore systems ofproductive environments. <strong>Ecology</strong> Letters 1: 25-29.HUNTZINGER, M., R. KARBAN & J.H. CUSHMAN (2008). Negative effects of vertebrate herbivores oninvertebrates in a coastal dune community. <strong>Ecology</strong> 89: 1972-1980.IASON, G.R., T. MANSO, D.A. SIM & F.G. HARTLEY (2002). The functional response does not predict thelocal distribution of European Rabbits (Oryctolagus cuniculus) on grass swards: experimentalevidence. Functional <strong>Ecology</strong> 16: 394-402.KEESING, F. (1998). Impacts of ungulates on the demography and diversity of small mammals incentral Kenya. Oecologia 116: 381-389.KOTLER, B.P. & L. BLAUSTEIN (1995). Titrating food and safety in a heterogeneous environment: whenare the risky and safe patches of equal value? Oikos 74: 251-258.KRUEGER, K. (1986). Feeding relationships among bison, pronghorn, and prairie dogs: an experimentalanalysis. <strong>Ecology</strong> 67: 760-770.KUIJPER, D.P.J. (2004). Small herbivores losing control. Plant-herbivore interactions along a naturalproductivity gradient. <strong>PhD</strong> dissertation, Rijksuniversiteit Groningen, Groningen, the Netherlands.KUIJPER, D.P.J., P. BEEK & J.P. BAKKER (2004). Short-term and long-term interactions between cattle andEuropean Brown hares in a salt-marsh system. In: KUIJPER, D.P.J, Small herbivores losingcontrol. Plant-herbivore interactions along a natural productivity gradient. <strong>PhD</strong> dissertation,Rijksuniversiteit Groningen, Groningen, the Netherlands: 85-99.KUIJPER, D.P.J., P. BEEK, S.E. VAN WIEREN & J.P. BAKKER (2008). Time-scale effects in the interactionbetween a large and a small herbivore. Basic and Applied <strong>Ecology</strong> 9: 126-134.LOCKLEY, R.M. (1962). Production of faecal pellets in the wild rabbit. Nature 194: 988-989.LOCKLEY, R.M. (1976). The private life of the rabbit. Het Spectrum, Utrecht.Vegetation height and rabbit foraging activity 91
LUNDBERG, P. (1988). Functional response of a small mammalian herbivore: the disc equation revisited.Journal of Animal <strong>Ecology</strong> 57: 999-1006.LUNDBERG, P. & M. ASTRÖM (1990). Functional response of optimally foraging herbivores. Journal ofTheoretical Biology 144: 367-377.MAFF (1986). Feed Composition - UK Tables of Feed Composition and Nutritive Value of Ruminants.Chalcombe Publications, Marlow, Bucks, UK.MCNAUGHTON, S.J. (1976). Serengeti migratory wildebeest: facilitation of energy flow by grazing.Science 191: 92-94.MCNAUGHTON, S.J. (1984) Grazing lawns: animals in herds, plant form and co-evolution. The AmericanNaturalist 124: 863-886.MYSTERUD, A. & G. AUSTRHEIM (2008). The effect of domestic sheep on forage plants of wild reindeer; alandscape scale experiment. European Journal of Wildlife Research 54: 461-468.OKSANEN, L., S.D. FRETWELL, J. ARRUDA & P. NIEMELÄ (1981). Exploitation ecosystems in gradients ofprimary productivity. The American Naturalist 118: 240-261.OLFF, H. & S.F. BOERSMA (1998). Langoor. Lange termijn veranderingen in de konijnenstand vanNederlandse duingebieden. Oorzaken en gevolgen voor de vegetatie. LandbouwuniversiteitWageningen, Leerstoelgroep Natuurbeheer en Plantenoecologie, Wageningen, the Netherlands.OLFF, H., M.E. RITCHIE & H.H.T. PRINS (2002). Global environmental controls of diversity in largeherbivores. Nature 415: 901-904.OOSTERVELD, P. (1983). Eight years of monitoring of rabbits and vegetation development onabandoned arable fields grazed by ponies. Acta Zoologica Fennica 174: 71-74.PRINS, H.H.T. & H. OLFF (1998). Species-richness of African grazer assemblages: towards a functionalexplanation. In: NEWBERY, D.M., H.H.T. PRINS & N. BROWN (eds), Dynamics of TropicalCommunities, 37th Symposium of The British Ecological Society, Blackwell Science, UK: 449-490.RAMBO, J.L. & S.H. FAETH (1999). Effect of vertebrate grazing on plant and insect community structure.Conservation Biology 13: 1047-1054.RUEDA, M., S. REBOLLO, L. GÁLVEZ-BRAVO & A. ESCUDERO (2008). Habitat use by large and smallherbivores in a fluctuating Mediterranean ecosystem: implications of seasonal changes. Journalof Arid Environments 72: 1698-1708.SINCLAIR, A.R.E. & M. NORTON-GRIFFITHS, M. (1982). Does competition or facilitation regulate migrantungulate populations in the Serengeti? A test of hypotheses. Oecologia 53: 364-369.SOMERS, N., B. D’HAESE, L. LENS, B. BOSSUYT & M. HOFFMANN (2008). Food quality affects diet preferenceof small herbivores: experimental evidence. Belgian Journal of Zoology 138: 170-176.STAHL, J., A.J. VAN DER GRAAF, R.H. DRENT & J.P. BAKKER (2006). Subtle interplay of competition andfacilitation among small herbivores in coastal grasslands. Functional <strong>Ecology</strong> 20: 908-915.STEEN, H., A. MYSTERUD & G. AUSTRHEIM (2005). Sheep grazing and rodent populations: evidence ofnegative interactions from a landscape scale experiment. Oecologia 143: 357-364.STEWART, K.E.J., N.A.D. BOURN & J.A. THOMAS (2001). An evaluation of three quick methods commonly92 Chapter 3
used to assess sward height in ecology. Journal of Applied <strong>Ecology</strong> 38: 1148-1154.TAYLOR, R.H. & R.M. WILLIAMS (1956). The use of pellet counts for estimating the density of populationsof the wild rabbit (Oryctolagus cuniculus L.). New Zealand Journal of Science and Technology,Section B 38: 236-256.VAN DE KOPPEL, J., J. HUISMAN, R. VAN DER WAL & H. OLFF (1996). Patterns of herbivory along aproductivity gradient: an empirical and theoretical investigation. <strong>Ecology</strong> 77: 736-745.VAN DER GRAAF, A.J., D. BOS, M.J.J.E. LOONEN, M. ENGELMOER & R.H. DRENT (2002). Short and long-termfacilitation of goose grazing by livestock. In BOS, D., Grazing in coastal grasslands, Brent Geeseand facilitation by herbivory, <strong>PhD</strong> dissertation, Rijksuniversiteit Groningen, Groningen, theNetherlands:63-83.VAN DER WAL, R., P. KUNST & R. DRENT (1998). Interactions between hare and brent goose in a saltmarsh system: evidence for food competition? Oecologia 117: 227-234.VAN LANGEVELDE, F., M. DRESCHER, I.M.A. HEITKÖNIG & H.H.T. PRINS (2008). Instantaneous intake rate ofherbivores as function of forage quality and mass: effects on facilitative and competitiveinteractions. Ecological Modelling 213: 273-284.VAN SOEST, P.J., J.B. ROBERTSON & B.A. LEWIS (1991). Methods for Dietary Fibre, Neutral Detergent Fibre,and Nonstarch Polysaccharides in Relation to Animal Nutrition. Journal of Dairy Science, 74:3583-3597.WALLAGE-DREES, J.M. (1988). Rabbits in coastal sand dunes; weighed and counted. <strong>PhD</strong> dissertationUniversity of Leiden, Leiden, the Netherlands.WILLIAMS, O.B., T.C.E. WELLS & D.A. WELLS (1974). Grazing management of Woodwalton fen: seasonalchanges in the diet of cattle and rabbits. Journal of Applied <strong>Ecology</strong> 11: 499-516.Vegetation height and rabbit foraging activity 93
AppendicesVegetation heightResults Mixed ModelGrassland Description of treatment StripAverage ± standarderrorSimilar vegetation1height Even = similar 8.19 ± 0.46Odd = similar 8.52 ± 1.10'Even' treatment Even = short 6.69 ± 0.29Odd = long 44.00 ± 3.96'Odd' treatment Odd = short 9.23 ± 0.45Even = long 15.40 ± 1.902Similar vegetationheight Even = similar 4.73 ± 0.43Odd = similar 4.92 ± 0.36'Even' treatment Even = short 10.83 ± 0.42Odd = long 19.15 ± 2.05'Odd' treatment Odd = short 8.92 ± 0.27Even = long 14.96 ± 0.93Den F-Num DF DF value ProbSimilar vegetationheight Even or odd strip 1 6 0.17 0.699Grassland 1 6 25.95 0.002Interaction (omitted) 1 6 0.01 0.912Covariance parameter estimatesPosition burrows 0.01Residual 0.02F-Num DF Den DF value Prob'Even' treatment Short or long strip 1 6 272.94
estimate = 2.38; odd strips x grassland 3: estimate = 2.94. As the interaction was significant, weconclude that the effect of the mowing was different for the two grasslands, but the least squaresestimates show that nevertheless, the vegetation was highest for the odd (not mown) strips. Theresults are presented per grassland, per treatment and subdivided by even and odd strips (which alsorepresents the short and long vegetation height in the two last treatment periods). Num DF =numerator degrees of freedom. Den DF = denominator degrees of freedom. DF = degrees offreedom. F-value = test statistic obtained by the mixed model. Prob = the significance level obtainedby the test.Average ± standard error Kruskal-Wallis-testVegetation heightChisquareProb(cm)L+R+S R+S DFSpring 2000 7.89 ± 3.60 4.74 ± 0.16 1 2.55 0.110Summer 2000 17.82 ± 2.02 29.58 ± 2.18 1 16.41
Average ± standard error Paired t-test or GLMIJZERMONDINGt-value or F-L+R+S R+S DF value ProbRabbits per year 2000 40 ± 8 62 ± 11 5 -5.15 0.0042001 67 ± 10 80 ± 16 4 -1.53 0.2002002 26 ± 6 47 ± 9 11 -6.11
Vegetation height and rabbit foraging activity 97
98Feeding trial, 2005 (Photographs by N. <strong>Somers</strong>)
CHAPTER 4Food quality affects diet preference ofrabbits: experimental evidence<strong>Nele</strong> <strong>Somers</strong>, Binke D’Haese, Beatrijs Bossuyt, Luc Lens & Maurice HoffmannBelgian Journal of Zoology, 2008, 138 (2): 179-17699
AbstractWhen foraging, small mammalian herbivores do not show a preference for the forage withthe highest biomass, which can be explained by several hypotheses (e.g. antipredatorconsiderations, more difficult handling of tall swards and/or the higher nutritional quality ofshorter grasses). We tested the ability of rabbits to discriminate between plants of differentnutritional value and whether they prefer the most nutritious. A feeding trial in which rabbits(Oryctolagus cuniculus L.) were offered two different types of grasses (fertilised andunfertilised) was executed under experimental conditions. The rabbits preferred the grasseswith the highest protein percentage, when controlling for sward height/plant biomass. Thisobservation is equivalent to results obtained in geese and provides experimental evidenceabout the capability of rabbits to select for plants with the highest nutritional quality.100 Chapter 4
IntroductionPredicting the impact of herbivores on their environment requires insight into thecriteria by which grazers select food patches. The mechanism of functional response(reviewed in CRAWLEY, 1983) predicts herbivores to prefer patches with the highest biomassand plant size (LUNDBERG, 1988; GROSS et al., 1993), in order to obtain as much forage aspossible in a given time period. However, some studies evidenced that medium-sizedherbivores, such as rabbits (Oryctolagus cuniculus L.) and geese, prefer rather swards ofintermediate height (OLFF et al., 1997; WILMSHURST et al., 2000; HASSALL et al., 2001; IASONet al., 2002; BAKKER et al., 2005). Several explanations for this phenomenon have beenmentioned. IASON et al. (2002) and VAN DE KOPPEL et al. (1996) suggested that rabbits andhares, Lepus europaeus (PALLAS), prefer vegetation with medium standing crop swardsbecause predators are most likely to occur in the cover offering higher vegetation. Moreover,a tall sward is more difficult to handle for medium-sized animals. A dislike for tall swards bybrent geese, Branta bernicla bernicla (L.), and barnacle geese, Branta leucopsis (BECHSTEIN),was explained by the larger costs of handling, more difficult locomotion, and decreasedpredator detection in the taller vegetation (VAN DER GRAAF et al., 2002).However, preference for shorter swards may also be related to their higher foodquality: grazing creates fastly growing and nutritionally-rich vegetation (so called ‘grazinglawns’, MCNAUGHTON, 1984), due to plant compensatory mechanisms operating afterdefoliation (MATTSON, 1980; MCNAUGHTON, 1983). Large herbivores need a larger plantbiomass, but can tolerate low plant quality, while smaller herbivores can persist on smallquantities of food on the condition that the plants are of high nutritional quality (OLFF et al.,2002). Medium-sized hindgut fermenters (e.g. the rabbit) depend on highly digestible foragebecause they have high metabolic requirements and their digestive system is very small(DEMMENT & VAN SOEST, 1985). The creation of grazing lawns by large herbivores may henceresult in ‘feeding facilitation’ (ARSENAULT & OWEN-SMITH, 2002) benefiting smaller grazers.Hunger may strengthen this preference for nutritionally-rich forage (CRAWLEY, 1983).The wild rabbit is considered to have a preference for shorter swards. For example,MORENO & VILLAFUERTE (1995) noticed that rabbit grazing pressure was higher in fresh, regrowingvegetation (after burning). Being a central-place forager (SCHOENER, 1979), foragingof this herbivore is concentrated in the neighbourhood of the burrow (DEKKER, 2007), lessthan 20 m from cover (MORENO & VILLAFUERTE, 1995). With increasing distance from theburrow, grazing pressure of rabbits gradually decreases, causing a gradient pattern.Consequently, vegetation height increases and nitrogen concentration of forage decreases,Diet preference of rabbits 101
due to repeated grazing of the rabbits, stimulating fresh regrowth (BAKKER et al., 2005).BAKKER et al. (2005) conclude that the grazing pattern has to be explained by food quality.Univocal discrimination of factors determining feeding preferences is only possible instrictly controlled choice experiments (so-called ‘cafeteria-trials’; CRAWLEY, 1983).Experimentally enhancing food quality in field experiments by fertilisation increases bothbiomass (BALL et al., 2000) and plant height. Moreover, feeding preferences are very difficultto measure in the field (CRAWLEY, 1983). For these reasons, we conducted a laboratoryexperiment to test the ability of rabbits to discriminate between grasses of low and highnutritional quality, while controlling for sward height or vegetation biomass. We predictedthat rabbits would prefer grasses of the highest forage quality either when offered grassswards of comparable height or cut grasses of the same biomass.Materials and methodsStudy speciesTwelve domestic rabbits (six males and six females, all between 1 and 3 years old) ofthe breed ‘Steenkonijn’ were used. The Steenkonijn is the oldest Belgian rabbit breed, and ismost closely related to the wild rabbit (WERNER, 1980). Therefore, the behaviour of theseanimals is supposed to be comparable to the behaviour of their wild ancestor. The rabbitswere housed in wire mesh pens (65 cm x 110 cm, height: 60 cm) such that each individualcould see a single other individual. This allowed social contact between the animals (DUNCANet al., 2006). A vaccination against myxomatosis and viral haemorrhagic syndrome wasadministered. All the individuals received water ad libitum, and were fed with a mixture ofcommercial rabbit pellets and grains (Bonito 96, Aveve, Belgium). From the first day of thefeeding trials, the pellet feeding was discontinued, so that the rabbits depended for theirfeeding on the experimental plants, supplemented with straw that was provided in the pens.We used Festuca rubra as forage in all trials. Festuca rubra plants were grown fromseeds (Herbiseed, Twyford, England), sown on a mixture of 50% dune sand and 50%potting soil, in seed trays of 40 cm by 45 cm during July – October 2004. Immediately aftersowing, halve of the seed trays (selected at random) received 30 g of organic fertiliser (8%nitrogen, 6% phosphorus, 7% potassium, 3% magnesium and 38% organic matter), furtherreferred to as ‘fertilised plants’ (F+). All trays received an inorganic fertiliser twice (once onemonth after sowing and once in March 2005). The ‘fertilised plants’ received 7.5 g of102 Chapter 4
inorganic fertiliser (20% nitrogen, 5% phosphorus and 8% potassium) at a time; the‘unfertilised plants’ (F-) received 2.5 g at a time.The trays were put inside the greenhouse immediately after sowing, and werewatered every two days. From December 2004 until March 2005, the trays were put outsidefor better aeration. Fungicide (sulphur) was added twice to cope with a mildew infection, andan infection of aphids was treated by using a mix of piperonylbutoxide and pyrethrine.Experimental designThe feeding trial took place in an experimental pen (Figure 1) of 104 cm depth, 91cm width and 73 cm height, connected to a smaller pen (36 cm by 26 cm by 30 cm) fromwhich the rabbit was not able to see the surroundings. Two grass swards (trimmed justbefore the start of the trial to an height of 13 cm (further called short swards (‘S’)) or of 33cm (tall swards (‘T’))) or two dishes with clipped grass (100 g per dish) were put in thelarger pen, on the opposite side of the entrance from the small pen. A partition of 40 cmhigh (in the middle between the two swards or dishes) divided the large pen into two halves.Figure 1: Design of the experimental pen.Diet preference of rabbits 103
In the sward trial (22-29 April 2005), there were four groups of three rabbits and twotreatments (two combinations of swards): F+T versus F-T and F+S versus F-S. Each twogroups of rabbits received the treatments in a different order. This total design wasreplicated once, but with a reverse of the left-hand and the right-hand sward. During theclipping trial (2-5 May 2005), the rabbits received dishes with clipped fertilised grass on oneside of the pen, and unfertilised grass on the other side (F+ versus F-). In the replicate ofthe clipping trial, the position of F+ and F- was reversed. Since the design was randomizedand fully balanced, possible effects of the order of treatments were minimized.Before the start of the feeding trial, four learning days were organised: the rabbitswere placed in the pen to habituate to the pen, the grass and the observer. Research carriedout with ruminants shows that food preferences develop because of the experience ofpostingestive effects (satiety or malaise) and their interaction with the senses of mainly tasteand smell (PROVENZA, 1995). Herbivores learn about grass quality through foragingconsequences, which they link with preingestive cues necessary to recognize the value of theforage (GINANE et al., 2005). Although this was only evidenced for ruminants, it is reasonableto assume that ruminants and non-ruminants do not differ in the non-cognitive aspects ofhow feedback is processed (PROVENZA, 1995). Non-ruminants have indeed been found to beable to discriminate between foods, even when the differences are relatively small (POST,1993). This means that the rabbits were only able to select the most nutritious food if theyhad the opportunity to experience the differences in postingestive effects between F+ and F-grasses. This condition was fulfilled through the learning days preceding the experiment.At the start of each experimental session, the individual was weighed (to estimate itsbody condition) and placed in the small pen. When the entrance to the experimental penwas opened and the rabbit approached the feeding trays, we started an observation sessionof 20 minutes, from a central point which did not interfere with the experiment. A detaileddescription of the foraging behaviour of the rabbit was noted.Forage quality analysisAfter each session, plant material that had not been consumed was removed fromthe pen and dried at 60°C (WTB Binder with controller RD 2 EED/FED (Binder, Tuttlingen,Germany)), until no more mass loss was detected, after which the dried plants were grinded.The percentage of crude protein (CP) and of cell wall constituents (cellulose, hemicelluloseand lignin, which were derived from NDF (neutral detergent fibre), ADF (acid detergentfibre) and ADL (acid detergent lignin)) were obtained by Near Infrared Spectroscopy (NIRS –104 Chapter 4
for more information see GIVENS et al. (1997)). A FOSS Feed and Forage Analyzer was used,combined with Winisi software (FOSS, Brussels, Belgium). The calibration for the NIRS wascarried out by performing wet analyses for approximately 10% of the samples, following themethod of Kjeldahl for CP and following the protocols of GOERING & VAN SOEST (1970) andVAN SOEST et al. (1991) for cell wall constituents.The amount of digestible protein (DP) was calculated by multiplying CP with themean digestibility coefficient of CP in grasses (value of 0.70; MAFF, 1986). DE (DigestibleEnergy) was calculated based on ADF, by multiplying GE (Gross Energy, value based onMAFF (1986)) by GE D (coefficient of digestibility of Gross Energy, in which GE D is defined asfollows: GE D = 0.867 – 0.0012 ADF (g/kg DM) (DE BLAS et al., 1992).Statistical analysisThe feeding preference of rabbits for different types of grasses was tested by MixedLinear Models, with INDIVIDUAL as random effect and “relative foraging time” as dependentvariable. This last variable was calculated by timing individual feeding bouts per sward ordish, starting from the moment when the experimental individual had tasted from either bothswards or both dishes until the end of the session, divided by the total time left until the endof the session. As vegetation height or biomass were controlled for, differences in handlingtime were not expected, so that the relative foraging time can be considered a goodmeasure for intake rate. Furthermore, the level of satiety after eating (PROVENZA, 1995;GINANE et al., 2005) will have been higher for the more nutritious grasses. Since mammalslearn to link the taste of the forage to the satiety level, directed foraging behaviour can onlystart from the moment they have tasted both grasses. Therefore, the relative foraging time,as defined above, is the most appropriate measure describing their preference.Four independent categorical variables were included in the model: FERTILISATION(0/1), POSITION OF THE SWARD OR DISH (left or right), DAY and SEX. We started with a full modelincluding all two-factor and higher-order interactions and applied a backward stepwiseselection procedure.The effect of FERTILISATION on forage quality was analysed by a General Linear Model.We tested the effect of fertilisation as a categorical variable separately on the percentages ofCP, cellulose, hemicellulose, lignin, DP and DE. Mixed regression analysis modelling repeatedmeasurements at individual level was used to examine shifts in weight during the feedingtrials.Diet preference of rabbits 105
Carolina).All statistical analyses were performed using SAS 9.1 (SAS Institute Inc., Cary, NorthResultsTable 1 summarizes the effect of fertilisation, day, sex and the position of the swardor dish (and all possible interaction terms) on the relative foraging time. Fertilised swardsand dishes were preferred over unfertilised ones, as can be seen in Figure 2: the mean ofthe relative foraging time was lower for F-plants (sward trial: mean = 20.02% ± 3.31 SE, N= 48; clipping trial: mean = 18.25 ± 4.74%, N = 24) than for F+plants (sward trial: mean =31.26 ± 3.31%, N = 48; clipping trial: mean = 37.13 ± 4.74%, N = 24).Figure 2: Mean and standard error of the relative foraging time of rabbits, when offered the choicebetween fertilised and unfertilised grasses, controlling for sward height (sward trial) or plant biomass(clipping trial). The relative foraging time was calculated by timing individual feeding bouts per swardor dish, starting from the moment when the experimental individual had tasted from either bothswards or both dishes until the end of the session, divided by the total time left until the end of thesession.106 Chapter 4
Sward Fixed effects num d.f. den d.f. F Ptrial Fertilisation (F) 1 94 5.74 0.02Day (D) 7 87 1.21 0.3Position grass (P) 1 86 0.84 0.36Sex (S) 1 85 0.35 0.56F*P 1 84 0.85 0.36P*D 7 77 1.05 0.4D*S 7 70 0.9 0.51F*S 1 69 0.3 0.59P*S 1 68 0.02 0.89F*D 3 65 0.19 0.9F*P*D 3 62 1.72 0.17F*D*S 7 55 1.08 0.39P*D*S 3 52 0.29 0.83F*P*S 1 51 0.03 0.87F*P*D*S 3 48 0.23 0.87Random effect estimate residualIndividual 0 525.03Clipping Fixed effects num d.f. den d.f. F Ptrial Fertilisation (F) 1 46 7.86 0.01Sex (S) 1 45 3.45 0.07Day (D) 1 44 0.08 0.78Position grass (P) 1 43 0 0.97F*S 1 42 2.97 0.09D*S 1 41 0.3 0.59P*D 1 40 0.26 0.61P*S 1 39 0.22 0.64F*D 1 38 0.2 0.66F*P 1 37 0.04 0.85F*D*S 1 36 0.98 0.33F*P*D 1 35 0.21 0.65P*D*S 1 34 0.1 0.76F*P*S 1 33 0.04 0.85F*P*D*S 1 32 0.13 0.72Random effect estimate residualIndividual 0 633.67Table 1: Results of the Mixed Linear Model testing for the effect of the four main factors (fertilisation,position, day and sex) and interactions on the relative foraging time, during a backward stepwiseselection. The relative foraging time was calculated by timing individual feeding bouts per sward ordish, starting from the moment when the experimental individual had tasted from either both swardsor both dishes until the end of the session, divided by the total time left until the end of the session.The p-values are these from the last step before the respective variable was removed. Num d.f. =numerator degrees of freedom, den d.f. = denominator degrees of freedom.There were some significant differences between fertilised and unfertilised plants(Table 2). CP and cellulose percentages were significantly higher in the F+plants, as well inDiet preference of rabbits 107
the sward trial as in the clipping trial. In the clipping trial, also the hemicellulose percentagewas higher in the F+plants, while the lignin percentage was lower in these plants. The valueof digestible protein percentage was significantly higher in the F+plants, compared to the F-plants. This applied to the sward trial as well as to the clipping trial. Also, the DE percentagediffered significantly between F+ and F-plants, with a higher DE percentage in F-plants, inthe sward trial, but not in the clipping trial.The effect of day on the relative foraging time was not significant, although therabbits lost weight during the trials. These losses were statistically significant in both trials(sward trial: F 1,11 = 519.51, estimate for time effect = -22.74, P < 0.001; clipping trial: F 1, 11.3= 7.11, estimate for time effect = -18.50, P = 0.02).meanF-plants ± SEmeanF+plants± SEnum d.f. den d.f. F PSward trialCP (%) 1 94 60.95 < 0.001 10.77 ± 0.28 13.91 ± 0.28Cellulose (%) 1 94 19.99 < 0.001 21.86 ± 0.25 23.43 ± 0.25Hemicellulose (%) 1 94 0.21 0.65 22.62 ± 0.25 22.79 ± 0.25Lignin (%) 1 94 0.36 0.55 3.17 ± 0.07 3.23 ± 0.07DP (%) 1 94 60.95 < 0.001 7.54 ± 0.20 9.73 ± 0.20DE (MJ / kg DM) 1 94 24.46 < 0.001 10.54 ± 0.05 10.17 ± 0.05Clipping trialCP (%) 1 46 57.65 < 0.001 10.17 ± 0.30 13.44 ± 0.30Cellulose (%) 1 46 10.32 < 0.001 21.55 ± 0.22 22.56 ± 0.22Hemicellulose (%) 1 46 17.22 < 0.001 21.54 ± 0.19 22.65 ± 0.19Lignin (%) 1 46 19.5 < 0.001 2.77 ± 0.07 2.32 ± 0.07DP (%) 1 46 57.65 < 0.001 7.12 ± 0.21 9.41 ± 0.21DE (MJ / kg DM) 1 46 2.69 0.11 10.70 ± 0.05 10.57 ± 0.05Table 2: Results of the General Linear Model testing for the effect of fertilisation on forage qualitymeasures of standing crop (sward trial) and clipped grass material (clipping trial). F-plants =unfertilised plants, F+plants = fertilised plants. CP = % Crude Protein , DP = % Digestible Protein, DE= Digestible Energy (MJ per kg dry matter). Num d.f. = numerator degrees of freedom, den d.f. =denominator degrees of freedom.DiscussionThe results of the experiment showed that only fertilisation had a significant influenceon the preference of the animals: the relative foraging time was longer for the fertilisedforage, both in the sward and in the clipping trial. The forage quality analysis revealed ahigher percentage of both crude and digestible protein in F+plants, compared to F-plants.108 Chapter 4
This was to be expected, since nitrogen is a principal component of the used fertilisers andits concentration is strongly related to protein concentration. We also observed a higherpercentage of cellulose and hemicellulose, although the latter only in the F+plants from theclipping trial, in which lignin decreased. As forage quality is believed to be enhanced by theprotein level (LANGVATN & HANLEY, 1993) and to be diminished by the fibre concentration(OLFF et al., 1997), the question raises whether fertilisation effectively resulted in a higherfood quality. Moreover, in the sward trial, the F+plants even had a lower digestible energycontent. However, it is reasonable to assume that the increase of digestible protein is themost important factor determining forage quality. Since some amino acids cannot besynthesized by the animal’s body itself, animals need amino acids, immediately availablefrom the forage to maintain body conditions constant (FRAGA, 1998). The close agreementbetween the sum of individual amino acids levels in the body of the rabbit and the CPconcentration (FRAGA, 1998), indicates that CP concentration provides a good estimate offorage quality. We can hence conclude that the rabbits selected the forage with the highestnutritional quality.This preference for high quality forage has been suggested for rabbits (KUIJPER et al.,2004; RÖDEL, 2005) and also for other relatively small mammal herbivores, e.g. smallruminants (WILMSHURST et al., 2000) and mountain hares (Lepus timidus L.) (LINDLÖF et al.,1974). However, studies eliminating the correlation between forage quality and swardheight/biomass are scarce. Therefore, it is difficult to know whether the animals are reallyable to select for the higher nitrogen concentration, or whether this selection is justcoincidental related to the selection of swards with medium standing crop. Some studiesconcerning geese (HASSALL et al., 2001; BOS et al., 2002; HASSALL & LANE, 2005) showed thecapability of these birds to discriminate between high and low quality forage, by eliminatingthe relationship between forage quality and sward height. BAKKER et al. (2005) executed afield experiment which eliminated the relationship between distance from the rabbit burrowand forage quality, and showed that forage of a higher quality is preferred, even whenfarther from the burrow (and thus with a higher sward height). However, the highest (andfarthest) swards in this trial were on average approximately as high as the short swards inour study. Therefore, it is possible that sward height in their trial did not show enoughvariation to really affect the rabbit behaviour. However, their results are confirmed by theresults of the present study, controlling for plant height and biomass, which clearly indicatethat plant quality, particularly nitrogen and related protein concentration, is a crucial factorfor selecting foraging patches in rabbits.Diet preference of rabbits 109
The other factors included in the model (position of the sward or dish,experimental day and sex) did not significantly influence the food preference of the rabbits.The day of feeding was of no importance, although CRAWLEY (1983) mentions that a hungryanimal will be more selective. Since the animals lost weight during the experiments, it couldbe expected that the animals would become more selective towards the end of theexperiment, but this was not confirmed. Similar results were obtained by DUNCAN et al.(2006) who found no evidence that nutritional plane had an overall effect on the proportionof several plant species eaten during preference tests carried out with herbivores. Theauthors relate this to the more extreme forage deficits in the wild. Similarly, the scarcity offood during winter time in the temperate regions will cause stronger feelings of hunger thanthe rabbits in our experiment experienced.Although we evidenced that food quality is important for determining preferences, wewere not able to exclude the importance of antipredation considerations and other swardheight related issues in diet selection (see also Chapter 3): other factors, besides nutrientconcentration, may also have played a role during the decision process of the rabbits. Otherresearch indeed showed that rabbits also choose the swards with the lowest biomass, whenthere are no nutritional differences between the swards of different heights (IASON et al.,2002). However, the field experiment of BAKKER et al. (2005) demonstrates that the presenceof predators causes a shift in the moment of feeding, but does not affect patch preferences.The presented results clearly showed that nutritional content plays an important role in theobserved preference of medium-sized herbivores for swards of intermediate size, but furtherresearch is needed to unravel the relative importance of other potentially contributingfactors.AcknowledgementsWe thank VLIZ and AWZ-WWK for the use of their infrastructure. We are grateful to INBO and ILVOfor grinding and analyses of plant material. Invaluable technical support was provided by FrankBroucke (VLIZ), Ward Vercruysse (INBO), Wim De Belder (INBO) and Maarten Pevenage. LucMaertens (ILVO) provided interesting information and literature on rabbit feeding trials and feedquality for rabbits. We also thank Chris Van Waes (ILVO) for the information on the plant analysisprocedure. The first author is granted by the Research Foundation – Flanders (Aspirant of the FWO-Vlaanderen).110 Chapter 4
ReferencesARSENAULT, R. & N. OWEN-SMITH (2002). Facilitation versus competition in grazing herbivoreassemblages. Oikos 97: 313-318.BAKKER, E.S., R.C. REIFFERS, H. OLFF & J.M. GLEICHMAN (2005). Experimental manipulation of predationrisk and food quality: effect on grazing behaviour in a central-place foraging herbivore.Oecologia 146: 157-167.BALL, J.P., K. DANELL & P. SUNESSON (2000). Response of a herbivore community to increased foodquality and quantity: an experiment with nitrogen fertilizer in a boreal forest. Journal of Applied<strong>Ecology</strong> 37: 247-255.BOS, D., R. DRENT, M. RUBINIGG & J. STAHL (2002). The relative importance of food biomass and qualityfor patch and habitat choice in Brent Geese. In BOS, D., Grazing in coastal grasslands, BrentGeese and facilitation by herbivory, <strong>PhD</strong> dissertation, Rijksuniversiteit Groningen, Groningen, theNetherlands: 23-41.CRAWLEY, M.J. (1983). Herbivory. The dynamics of animal-plant-interactions. Blackwell ScientificPublications, Oxford, Great Britain.DE BLAS, C., J. WISEMAN, M.J. FRAGA & M.J. VILLAMIDE (1992). Prediction of the digestible energy anddigestibility of gross energy of feeds for rabbits. 2. Mixed diets. Animal Feed Science andTechnology 39: 39-59.DEKKER, J.J.A. (2007). Rabbits, refuges and resources. How foraging of herbivores is affected by livingin burrows. <strong>PhD</strong> dissertation, Wageningen <strong>Universiteit</strong>, Wageningen, the Netherlands.DEMMENT, M.W. & P.J. VAN SOEST (1985). A nutritional explanation for body-size patterns of ruminantand nonruminant herbivores. The American Naturalist 125: 641-672.DUNCAN, A.J., C. GINANE, D.A. ELSTON, A. KUNAVER & I.J. GORDON (2006). How do herbivores trade-off thepositive and negative consequences of diet selection decisions? Animal Behaviour 71: 93-99.FRAGA, M.J. (1998). Protein requirements. In DE BLAS, C. & J. WISEMAN J (eds), The nutrition of therabbit, CABI Publishing, Wallingford, UK: 133-143.GINANE, C., A.J. DUNCAN, S.A. YOUNG, D.A. ELSTON & I.J. GORDON (2005). Herbivore diet selection inresponse to simulated variation in nutrient rewards and plant secondary compounds. AnimalBehaviour 69: 541-550.GIVENS, D.I., J.L. DE BOEVER & E.R. DEAVILLE (1997). The principles, practices and some futureapplications of near infrared spectroscopy for predicting the nutritive value of foods for animalsand humans. Nutrition Research Reviews 10: 83-114.GOERING, H.K. & P.J. VAN SOEST (1970). Forage Fibre Analysis (Apparatus, Reagents, Procedures, andSome Applications). Agricultural Handbook No. 379, Agricultural Research Service, United StatesDepartment of Agriculture.GROSS, J.E., L.A. SHIPLEY, N.T. HOBBS, D.E. SPALINGER & B.A. WUNDER (1993). Functional response ofherbivores in food-concentrated patches: tests of a mechanistic model. <strong>Ecology</strong> 74: 778-791.HASSALL, M. & S.J. LANE (2005). Partial feeding preferences and the profitability of winter-feeding sitesDiet preference of rabbits 111
for brent geese. Basic and Applied <strong>Ecology</strong> 6: 559-570.HASSALL, M., R. RIDDINGTON & A. HELDEN (2001). Foraging behaviour of brent geese, Branta b. bernicla,on grasslands: effects of sward length and nitrogen content. Oecologia 127: 97-104.IASON, G.R., T. MANSO, D.A. SIM & F.G. HARTLEY (2002). The functional response does not predict thelocal distribution of European Rabbits (Oryctolagus cuniculus) on grass swards: experimentalevidence. Functional <strong>Ecology</strong> 16: 394-402.KUIJPER, D.P.J., S.E. VAN WIEREN & J.P. BAKKER (2004). Digestive strategies in two sympatricallyoccurring lagomorphs. Journal of Zoology 264: 171-178.LANGVATN, R. & T.A. HANLEY (1993). Feeding-patch choice by red deer in relation to foraging efficiency.An experiment. Oecologia 95: 164-170.LINDLÖF, B., E. LINDSTRÖM & Ǻ. PEHRSON (1974). Nutrient content in relation to food preferred bymountain hare. Journal of Wildlife Management 38: 875-879.LUNDBERG, P. (1988). Functional response of a small mammalian herbivore: the disc equation revisited.Journal of Animal <strong>Ecology</strong> 57: 999-1006.MAFF (1986). Feed Composition - UK Tables of Feed Composition and Nutritive Value of Ruminants.Chalcombe Publications, Marlow, Bucks, UK.MATTSON, W.J. (1980). Herbivory in relation to plant nitrogen content. Annual Review of <strong>Ecology</strong> andSystematics 11: 119-161.MCNAUGHTON, S.J. (1983). Compensatory plant growth as a response to herbivory. Oikos 40: 329-336.MCNAUGHTON, S.J. (1984). Grazing lawns: animals in herds, plant form and co-evolution. The AmericanNaturalist 124:863-886.MORENO, S. & R. VILLAFUERTE (1995). Traditional management of scrubland for the conservation ofrabbits Oryctolagus cuniculus and their predators in Doñana National Park, Spain. BiologicalConservation 73: 81-85.OLFF, H., J. DE LEEUW, J.P. BAKKER, R.J. PLATERINK, H.J. VAN WIJNEN & W. DE MUNCK (1997). Vegetationsuccession and herbivory in a salt marsh: changes induced by sea level rise and silt depositionalong an elevational gradient. Journal of <strong>Ecology</strong> 85: 799-814.OLFF, H., M.E. RITCHIE & H.H.T. PRINS (2002). Global environmental controls of diversity in largeherbivores. Nature 415: 901-904.POST, D.M. (1993). Detection of differences in nutrient concentrations by eastern woodrats (Neotomafloridana). Journal of Mammalogy 74: 493-497.PROVENZA, F.D. (1995). Postingestive feedback as an elementary determinant of food preference andintake in ruminants. Journal of Range Management 48: 2-17.RÖDEL, H.G. (2005). Winter feeding behaviour of European rabbits in a temperate zone habitat.Mammalian Biology/Zeitschrift Für Säugetierkunde 70: 300-306.SCHOENER, T.W. (1979). Generality of the size-distance relation in models of optimal foraging. TheAmerican Naturalist 114: 902-914.VAN DE KOPPEL, J., J. HUISMAN, R. VAN DER WAL & H. OLFF (1996). Patterns of herbivory along aproductivity gradient: an empirical and theoretical investigation. <strong>Ecology</strong> 77: 736-745.112 Chapter 4
VAN DER GRAAF, A.J., D. BOS, M.J.J.E. LOONEN, M. ENGELMOER & R.H. DRENT (2002). Short and long-termfacilitation of goose grazing by livestock. In BOS, D., Grazing in coastal grasslands, Brent Geeseand facilitation by herbivory, <strong>PhD</strong> dissertation, Rijksuniversiteit Groningen, Groningen, theNetherlands: 63-83.VAN SOEST, P.J., J.B. ROBERTSON & B.A. LEWIS (1991). Methods for Dietary Fibre, Neutral Detergent Fibre,and Nonstarch Polysaccharides in Relation to Animal Nutrition. Journal of Dairy Science 74: 3583-3597.WERNER, B.J. (1980). Verzorgingsgids Konijnen. Grote-, midden-, kleine- en dwergrassen. Zuidgroep B.V.Uitgevers, Best.WILMSHURST, J.F., J.M. FRYXELL & C.M. BERGMAN (2000). The allometry of patch selection in ruminants.Proceedings of the Royal Society of London, Series B 267: 345-349.Diet preference of rabbits 113
Growing plants, 2003(Photograph by N. <strong>Somers</strong>)Feeding trial, 2003(Photograph by N. <strong>Somers</strong>)Epidermal fragment ofFestuca rubra(Photograph by K. De Maeyer)114
CHAPTER 5The determination of the diet of rabbits(Oryctolagus cuniculus L.)using microhistological faecal analysis:an experimental evaluation<strong>Nele</strong> <strong>Somers</strong>, Beatrijs Bossuyt, Luc Lens & Maurice Hoffmann115
AbstractMicrohistological faecal analysis to assess the diet of herbivores is a widely used method: thediet of the herbivore is qualified and quantified by identifying plant epidermal fragmentswhich can be found in the pellets of this animal. The method has several advantages, butsome limitations have been mentioned in the past. A clear consensus on the accuracy of thistechnique is lacking. So we performed a feeding trial with rabbits (Oryctolagus cuniculus L.)to compare the known diet with the results obtained by faecal analysis. The main goal of thestudy was to find out whether the diet composition can be reliably derived from faecalanalysis (despite problems of differential digestion). Therefore, we also determined thenumber of identified fragments which is necessary to obtain a good result and investigatedwhether the best quantification of the diet is originating from fragment counts or fromfragment area measurements. It is concluded that only the composition of grass diets can beestimated from pellet analyses, due to a higher digestion intensity of forbs. We recommendthe identification of 150 epidermal fragments and quantification by area measurements.Further research is needed to develop new, more reliable methods to determine the dietcomposition of wild grazers more accurately.116 Chapter 5
IntroductionMicrohistological faecal analysis has been widely used for determining the dietcomposition of wild herbivores (e.g. WILLIAMS et al., 1974; PUTMAN, 1984; DE JONG et al.,1995; TREYDTE et al., 2006; YOSHIHARA et al., 2008), including lagomorphs (e.g. BHADRESA,1977; HOMOLKA, 1982; HOMOLKA, 1987; HOMOLKA, 1988; DUFFY et al., 1996; PUIG et al.,2007). The method is based on the fact that epidermal plant material is preserved wellduring digestion, so that epidermal plant fragments are preserved in the stomach and thefaeces. The characteristics of these fragments are different for different plant species, and sothey are useful to microscopically identify the plant species that have been eaten by theanimal.Determining diet composition by analysing faeces has several advantages over othermethods (HOLECHEK et al., 1982). Utilization studies (estimation of the level of utilization ofplants by direct observation of living plant material) suffer from many confounding factors(e.g. trampling, weathering) and accuracy is lacking. Direct observation of the animals’grazing behaviour is not accurate for wild animals that are difficult to approach. Fistulasampling is also not possible for free-living wild herbivores. Stomach analyses needsacrificing the animals. Hence, as all these methods have practical and/or accuracylimitations, when wanting to investigate the diet of a wild rabbit (Oryctolagus cuniculus L.)population during the course of a year (see Chapter 6), microhistological faecal analysis isthe most plausible option. A continuous collection of pellets can be taken from the samerabbit population without seriously disturbing them (DUSI 1949). Moreover, not onlyqualitative data are derived from these analyses, but most researchers also try to quantifythe proportion of each plant species in the herbivore diet, mostly by counting the fragments(e.g. DUFFY et al., 1996), sometimes by measuring the area of the fragments (e.g. BHADRESA,1977).However, there are a lot of studies testing the validity of the results of faecal analysis(e.g. STEWART, 1967; SPARKS & MALECHEK, 1968; FREE et al., 1970; HAVSTAD & DONART, 1978;VAVRA et al., 1978; PULLIAM & NELSON, 1979; SMITH & SHANDRUK, 1979; VAVRA & HOLECHEK,1980; HOLECHEK & VAVRA, 1981; LESLIE et al., 1983; MCINNIS et al., 1983; SAMUEL & HOWARD,1983; WALLAGE-DREES, 1988; ALIPAYO et al., 1992; MAIA et al., 2003) and several aspects offaecal analysis have been questioned by them.When evaluating faecal analysis, the problem of the disappearing forbs(SAMUEL & HOWARD, 1983) is very often encountered. It seems that forbs are oftenunderestimated in faecal analysis, while grasses are overestimated (e.g. VAVRA et al., 1978;Evaluation of faecal analysis 117
SMITH & SHANDRUK, 1979; LESLIE et al., 1983; MCINNIS et al., 1983; WALLAGE-DREES, 1988).Possible causes are enumerated by SAMUEL & HOWARD (1983): maybe the epidermis of forbsis not being separated readily from lower layer cells; forb fragments might not survive thegrinding which is involved in sample preparation or slide preparation; the proportion of forbsmight also be altering during the digestion process. This last option (differential digestionbetween grasses and forbs) is mostly accepted as causing the disappearance of forbs, andeven called an obvious shortcoming of the method (VAVRA et al., 1978), but see also SANDERSet al. (1980), HOMOLKA (1986) and ALIPAYO et al. (1992). According to PULLIAM & NELSON(1979), there is also a significant higher digestibility in annual grasses than in most perennialgrasses. Thus, a major questing regarding faecal analysis is whether it should rather be usedas a qualitative than as a quantitative technique (HOLECHEK & VALDEZ, 1985).A second problem associated with faecal analysis is the lack of a consensus abouthow many fragments have to be identified before reaching a stable and accurate estimate ofthe diet. In his pioneering research, DUSI (1949) took a small portion of a pellet, examinedthe whole slide and identified all fragments encountered. Later authors used numerousmethods: making five slides per sample and looking at 20 locations per slide where eachspecies was identified (SPARKS & MALECHEK, 1968; FREE et al., 1970), 500 fragments persample (ALIPAYO et al., 1992), making 3 slides and using 60 fragments in total (VAVRA &HOLECHEK, 1980), identifying all fragments in 40 microscopic fields per slide (VAVRA et al.,1978), 100 fragments (10 slides) per pellet using four pellet groups (MAIA et al., 2003),analysing 200 fragments per sample (WALLAGE-DREES, 1988).Third, there is some doubt whether just counting the fragments and calculating theirfrequency is a good method. VAVRA & HOLECHEK (1980) state that it becomes obvious thatthere is a large variation in structural breakdown of plant species during digestion. Duringdigestion, different plant species break up into fragments that significantly differ in size(PUTMAN, 1984), so that counts would not be a valid means of estimating the proportions ofepidermis ingested (STEWART, 1967). Estimating the proportion of plant species in the diet bymeasuring the area of the plant fragments could be a solution, but is used by only fewauthors (e.g. DE JONG et al., 1995).Taking into account these uncertainties about the method of microhistological faecalanalysis, we decided to carry out a feeding trial to evaluate and optimize the technique,before using it in our studies of the diet of wild rabbits (see Chapter 6).This was necessaryas we did not encounter any research in which several plant species (as well forbs asgrasses; as well annuals as perennials) were fed in a known amount, followed by faecalanalysis in which several aspects of the analysis were tested simultaneously: proportions of118 Chapter 5
the plants eaten were compared to the proportion of plants in the faeces; area andfrequency measures were compared and it was tested how many fragments have to beidentified before achieving a reliable result. An additional reason for doing this trial is thepossibility that effects on digested material may also differ among animal species (SMITH &SHANDRUK 1979), so animal species specific research might be needed.During the feeding trial, six rabbits were fed three known diets. Pellets were collectedand analyzed by using microhistological analysis (including measuring the area of thefragments). The goal of the research was answering the question whether faecal analysiscan be used as a reliable quantitative method to determine the diet of the rabbit: is there agood accordance between the diets fed and the diet estimated resulting from the faecalanalysis (taking into account forbs and grasses)? We tested how many fragments have to beidentified and taken into account before reaching a good result and whether measuring thearea of the fragments offers better results than simply counting the fragments.Materials and methodsStudy speciesDuring the feeding trial, six domestic rabbits (three males and three females, all oneyear old) of the breed ‘Steenkonijn’ were used. The Steenkonijn is the oldest Belgian rabbitbreed, and is closely related to the wild rabbit (WERNER, 1980). (Wild rabbits in captivityproved to behave very anxious and stressed. Therefore, we decided to use domestic rabbitsduring the feeding trial.) The rabbits were housed in wire mesh pens (65cm x 110cm,height: 60cm), of which the floor was covered with sand (no straw, in order to prevent therabbit to eat plant material that was not involved in the experiment). The animals received avaccination against myxomatosis and RHD and a basic diet - a mixture of commercial rabbitpellets (Bonito 96, Aveve, Belgium) was provided. Water was always available ad libitum.Five plant species were grown in greenhouse conditions in order to feed them to therabbits during the course of a feeding trial: Arrhenatherum elatius (perennial grass), Festucarubra (perennial grass), Poa annua (annual grass, although sometimes biennial), Galiumverum (perennial forb) and Stellaria media (annual forb). All plants were grown from seeds(provided by Ecoflora, Halle, Belgium and Herbiseed, Twyford, England), sown on a mixtureof 50% calcareous dune sand and 50% potting soil, in seed trays of 40cm by 45cm in May –June 2003.Evaluation of faecal analysis 119
Feeding trial and collection of the pelletsIn order to compare the known diet of the rabbits with the composition of theirfaeces, we conducted a feeding trial in which a known quantity of several plant species wasfed to the animals. The rabbit pellets were collected and prepared for faecal analysis.Before the start of the experiment, the different plant species were fed to the rabbitsto allow them to get used to the plants. The feeding trial started on the 27 th of September2003 and ended on the 16 th of October 2003.Plant material was administered to the rabbits in one of three combinations: “grassvs. forb”, “perennial vs. annual” and “perennial grasses vs. annual grasses” (see Table 1).The six rabbits were subdivided into three groups (each consisting of one male and onefemale). These rabbit groups received the three plant combinations each in a different orderduring three feeding periods, each consisting of five feeding days (a latin square design,NETER et al. (1996)). On the third feeding day of each period, all rabbit pellets were removedfrom the pen. On the fourth and fifth feeding day, as well as on the day after the fifthfeeding day, all rabbit pellets in the individual pens were collected and frozen. Since themean retention time of the rabbit varies between 9 and 30 hours, with an average of 19hours (see review of CARABAÑO & PIQUER (1998), we waited until the fourth feeding daybefore collecting the first pellets for investigation. This gave us the certainty that no otherplant species, fed before the start of the feeding period, would be present in the faeces.After the last pellet collection and on the day thereafter, a mixture of 20g of all plant specieswas fed to the animals. After these two habituation days, a new feeding period was started.This structure was continued until the end of the third feeding period and the last pelletcollection after the third feeding period. So in the end, nine pellet samples had been takenfrom each of the six rabbits, from which three samples originated from the same plantcombination. This finally resulted in 54 samples. The mean number of pellets per rabbit andper day was 305 ± 12.As mentioned before, also the animal species involved may influence the result offaecal analysis. Leporids (the wild rabbit included) are known to reingest soft faeces(caecotrophy). The soft faeces are ingested after excretion directly from the anus (HIRAKAWA,2001), so we only collected hard faeces. The two types of pellets are formed by a separationmechanism in the proximal colon, so the difference between the soft and hard faeces is notdue to the food having passed once or twice (HIRAKAWA, 2001), as is sometimesmisinterpreted. The soft faeces mainly contain greater proportions of protein, minerals andvitamins, while the hard faeces are enriched in fibrous components (CARABAÑO & PIQUER,120 Chapter 5
1998; HIRAKAWA, 2001). Therefore, we can suppose that the fibrous, indigestible epidermalplant fragments on which the method of faecal analysis is based are especially present in thehard faeces, and so we expect that caecotrophy is not likely to influence the results of faecalanalysis.Plant combinationsGrass vs. forb Perennial vs. annualPerennial grasses vs.annual grassesAmount of plants 25g Festuca rubra 20g Arrhenatherum elatius 30g Arrhenatherum elatiusfed 20g Galium verum 30g Poa annua 30g Festuca rubra35g Stellaria media 30g Stellaria media 30g Poa annuaAmount of plants 23g Festuca rubra 19g Arrhenatherum elatius 29g Arrhenatherum elatiuseaten effectively 12g Galium verum 29g Poa annua 29g Festuca rubra34g Stellaria media 30g Stellaria media 29g Poa annuaTable 1: Overview of the identity and amount of the plant species in the three plant combinations fedto and effectively eaten by six experimental rabbits.The plant material was not always eaten completely by the rabbits. We collectedresidual plant material before feeding fresh plants to the animals, and measured the dryweight of the uneaten plants. To correct for the desiccation of the plant material, 10g ofeach plant species was placed each day in the neighbourhood of the pens, and weighed onthe next day. By subtracting the spoiled plant weight (corrected for desiccation) from the fedplant weight, we calculated the real amount of plant material per plant species eaten byeach rabbit. Per plant combination, these values were averaged over all the rabbits. Fromnow on, we consider these values (see Table 1) as the plant amount eaten by the rabbits.Preparation of the faecesFrom the frozen pellets, 30 pellets per sample were selected at random to beprepared for microscopical analysis. The preparation method was based on the methodfollowed by DE JONG et al. (1995). The selected pellets were put in an autoclave (Certo ClavMulticontrol) with some distilled water, and sterilized for five minutes at a temperature of125°C. After cooling down, the water was poured off, using a plankton screen (openings of100μm), and thereafter the pellet sample was crushed. We weighed 5g of that sample andput it in a blender (Waring Blender 1l, 120-240 volt) for being mixed during one minute inorder to create a homogeneous pellet sample (PULLIAM & NELSON, 1979; MAIA et al., 2003).The water was poured off using the plankton screen again and the sample was put in a smallpot, filled with ethanol 70% and closed by a lid. The samples were conserved this way.Evaluation of faecal analysis 121
Microscopical analysis of the faecesFor microscopical analysis, a drop of the sample was put on a microscopic slide andcovered by a cover slip. Per sample, 30 slides were made. Each slide was examined using amicroscope (Olympus BX41) at magnification 10x10. Ten epidermal plant fragments whereidentified per slide, in at least two transects. (Particles smaller than 10μm x 10μm werediscarded.) In total, 300 plant fragments were identified per pellet sample. Identification ofthe fragments was done by comparing the fragments with reference photographs ofepidermal fragments of the plant species administered. The reference collection was createdby K. DE MAEYER. Plant material was collected in the field; epidermal fragments were takenfrom the plants, cleared by household bleach and put on microscopic slides. Photographs ofthe fragments were taken, and the characteristics of the fragments were noted. Asdistinguishing between the fragments of Galium verum and Stellaria media was not alwayspossible, they were both noted as “dicot”; the same problem was encountered with Festucarubra and Arrhenatherum elatius, therefore both noted as “perennial grass”, at least in thetrials where these species were fed simultaneously.The area of each plant fragment was measured and noted by using a grid of100 small squares, each square representing an area of 100μm x 100μm at the magnificationused.Statistical analysisDue to technical problems, five of the 54 samples dried out completely. The analysesof these samples were left out of all statistical analyses. From these five samples, twooriginated from the grass-forb combination, two from the grass combination and one fromthe perennial-annual combination. So in total, 49 samples were taken into account for thestatistical analysis. To avoid nested data, we randomised the data by using Excel: the orderin which the fragments were encountered was not respected anymore and doubles werepossible.For each plant combination, we formulated a plant species ratio (calculated eitherwith the amount of plant species effectively eaten or with the area or frequency of theepidermal fragments of the plant species in the faeces). For the plant combination “grass vs.forb”, we calculated the ratio of Festuca rubra (a grass) over the sum of the two dicotspecies Galium verum and Stellaria media. For the plant combination “perennial vs. annual”,we calculated the ratio of Arrhenatherum elatius (perennial) over the sum of the two annual122 Chapter 5
species Poa annua and Stellaria media. For the plant combination “perennial grasses vs.annual grasses”, we calculated the ratio of the sum of Festuca rubra and Arrhenatherumelatius over the amount of Poa annua.Chi-square analyses were performed for testing the differences (or resemblances)between the plant amounts eaten and plant quantity obtained by the faecal analysis (afterexamining 25, 50, …, 300 fragments). Using mixed linear models, we tested (separately foreach plant combination) whether the area of epidermal fragments is statistically differentbetween PLANT SPECIES. This information should be very useful in the discussion whetherusing frequency or area of fragments. The random factor used in the model was the SESSIONNUMBER, which is a combination of the day of pellet collection and the rabbit from which thepellets were collected. For the combination “perennial grasses vs. annual grasses”, wecalculated the difference between the ratio eaten and the ratio obtained by measuringfragment area on one hand, and the difference between the ratio eaten and the ratioobtained by counting fragments. This was done for 100, 150, 200, 250 and 300 fragments. AWilcoxon Signed Rank Test was performed on these calculated values to test whethermeasuring area or counting fragments gives a different view of the true diet. The statisticaltests were performed using SAS 9.1 (SAS Institute Inc., Cary, North Carolina).ResultsWhen comparing the three plant combinations, “perennial grasses vs. annualgrasses” was the plant combination showing the most stable evolution (Figure 1). The twoother combinations were not very stable when considering less than 100 fragments,indicating that results can still change a lot when examining extra fragments. However, whenexamining more than 150 fragments, the results were better, although never as stable as forthe plant combination “perennial grasses vs. annual grasses”.The proportion of the different plant species in the plant mixes eaten by the rabbitsdiffered significantly from the proportion of these plants in the pellets, at least for thecombinations “grass vs. forb” and “perennial vs. annual” (Table 2). For the plant combination“perennial grasses vs. annual grasses”, no significant differences were found, indicating thatthe amount of grass species eaten by a rabbit was well reflected by the proportion of thesespecies in the rabbit pellets, whether observed as number of fragments or as fragment area.Evaluation of faecal analysis 123
Figure 1: The evolution of the ratio of the plant species after examining 25, 50, …, 300 epidermalfragments. For the plant combination “grass vs. forb”, we calculated the ratio of Festuca rubra (agrass) over the sum of the two dicot species Galium verum and Stellaria media. For the plantcombination “perennial vs. annual”, we calculated the ratio of Arrhenatherum elatius (perennial) overthe sum of the two annual species Poa annua and Stellaria media. For the plant combination“perennial grasses vs. annual grasses”, we calculated the ratio of the sum of Festuca rubra andArrhenatherum elatius over the amount of Poa annua. Standard errors are shown.There were significant differences between the areas of epidermal fragments amongdifferent plant species, for the three plant combinations. In the combination “grass vs. forb”(F 1, 4783 = 13.79, p = 0.0002), dicots had the smallest area (lsmean = 4.46 ± 0.24)compared to Festuca rubra (lsmean = 5.27 ± 0.15). In the combination “perennial vs.annual” (F 2, 5081 = 58.91, p < 0.0001), Arrhenatherum elatius had the largest area (lsmean =5.84 ± 0.13), compared to the two annuals Poa annua (lsmean = 4.48 ± 0.09) and Stellariamedia (lsmean = 4.30 ± 0.15). In the combination “perennial grasses vs. annual grasses”(F 1, 4783 = 69.37, p < 0.0001), the annual Poa annua had the smallest area (lsmean = 4.40 ±0.17) compared to the perennial grasses (lsmean = 5.43 ± 0.16).After stabilisation of the calculated ratio (from 100-150 fragments onwards, seeabove), the ratio calculated by the area of the fragments was always larger than the onecalculated by the frequency of the species (Figure 1). The differences between the arearesults and the frequency results were smallest for the combination “perennial grasses vs.124 Chapter 5
annual grasses”. The ratio of the epidermal fragments in the plant combination “perennialgrasses vs. annual grasses” was closer to the true amount of eaten plant species by therabbits when considering the area of the fragments instead of the frequency of thefragments (Figure 2). The difference between the two methods was shown by the WilcoxonSigned Rank Test, in which p-values were always significant (p < 0.01). This observationwas true in any of the number of analyzed fragments, i.e. 100, 150, 200, 250 as well as 300fragments. A similar comparison was not made for the two other plant combinations, sincethe relationship between the amount of plants eaten did not match the amount of plantspecies in the pellets (see above), nor in the case of considering the area of the fragments,neither when considering their frequency.Evaluation of faecal analysis 125
Grass vs. forb Area of the fragments Frequency of fragmentsNumber of examined fragments DF Chi-square Prob DF Chi-square Prob25 1 67.73
Figure 2: The ratio of the sum of Festuca rubra and Arrhenatherum elatius over the amount of Poaannua (in the plant combination “perennial grasses vs. annual grasses”) is shown. This ratio iscompared for the plant amounts effectively eaten by six rabbits and the ratios calculated from thearea and the frequency of epidermal fragments in the pellets of these rabbits. The comparison ismade after examining 100, 150, 200, 250 and 300 epidermal fragments. Standard errors are shown.DiscussionThe results of our feeding trial show that the known diet of the rabbits was onlyreflected qualitatively and quantitatively in the epidermis fragments in the pellets whenconcerning diets that consist only of grasses. Identifying 150 epidermal fragments should berecommended, and the use of area measurements has to be preferred over simply countingthe fragments.When evaluating the comparison between the ratio of plant species eaten and theratio obtained by faecal analysis, we can conclude that the results of the faecal analysis areunreliable when concerning diets including forbs (the grass-forb-diet and the perennialannual-diet):comparing the amount eaten and analysed in the faecal pellets results in veryEvaluation of faecal analysis 127
significant differences for these two diets. The third diet, comprising only grass species,seems to be reflected reliably in the faeces. Thus, we should conclude that thedisproportional disappearance of forbs as compared to grass species (VAVRA et al., 1978;SMITH & SHANDRUK, 1979; LESLIE et al., 1983; MCINNIS et al., 1983; SAMUEL & HOWARD, 1983;WALLAGE-DREES, 1988), is severely distorting the proportions of the plant species found in thefaecal pellets. Differential digestion makes the microhistological results unreliable as far asforb consumption is concerned. As faecal material taken from the intestines of someruminants contains more species than faeces taken from the ground, SMITH & SHANDRUK(1979) suppose that also weather conditions could alter the composition of the faeces, andmoreover, the degree of over- and underestimation could be significantly affected by theseason (LESLIE et al., 1983). As the pellets analysed in our study were taken freshly fromcaptive rabbits (not exposed to fluctuating weather conditions), we should assume thatpellets collected in the field will expose even more distorted results than presented in Table2. Some authors tried to establish correction factors (DEARDEN et al., 1975; LESLIE et al.,1983; BARTOLOMÉ et al., 1985), but these correction factors should not only be calculated foreach plant species, but also for specific study areas and seasons (LESLIE et al., 1983), andprobably even for each herbivore species and the age of the animals concerned (STEWART,1967). This would be a very time-consuming process, and for some rare herbivore species,this would probably be impossible. As SMITH & SHANDRUK (1979) conclude, a close agreementbetween the diet and the faeces can only be reached when the herbivore has mainly eatengrasses; the identification of forbs in faeces on rangelands dominated by forbs poses animportant problem (FREE et al., 1970).From each pellet sample, 300 fragments have been identified. This quantity proved tobe far more numerous than really needed to obtain a stable result. When less than 100fragments are identified, the ratio of plant species observed in the faecal pellets is not yetstabilized, especially when considering the data from the grass-forb-diet and the perennialannual-diet.From the measurement of 100 fragments onwards, results become more stable,especially when looking at the grasses-diet. We may conclude that we should identify atleast 100 fragments for obtaining a more or less stable result. However, when including asafety margin, we recommend identifying 150 plant fragments in the analysis.Comparing the area of the fragments of different plant species confirms the results ofVAVRA & HOLECHEK (1980) and PUTMAN (1984): forbs and annual grasses break down infragments that are significantly smaller than the fragments of perennial grasses. Our resultsindicate that the plant ratio is usually higher for the area measurements. As mentionedabove, this plant ratio obtained by faecal analysis is only reliable for the grasses diet, but128 Chapter 5
also in this diet, we can see a clear distinction between the frequency and areameasurements. The tests indicated that frequency as well as area measurements give agood estimate of the real diet, but that the area measurement gives an even more reliableestimate. As a consequence, we support the view of STEWART (1967) that areameasurements are an improvement when comparing to fragment counts. STEWART (1967)also tested a third quantification method, the point quadrate method, but concluded that itwould be a too time-consuming process to enable sufficient analyses to reduce the very highstandard error he obtained by this method.We can conclude that the most important limitation of microhistological faecalanalysis is the problem of differential digestion of forbs. As it is hardly possible to overcomethis shortcoming of the method, there is a need for better methods. MARTINS et al. (2002)and FERREIRA et al. (2007) describe a method for estimating diet composition by using n-alkanes. Particular patterns of concentrations of n-alkanes in cuticular wax are specific toindividual plant species or species groups and can be compared to n-alkane concentrations infaeces (by gas chromatography). However, this method is limited to the number of n-alkanemarkers available (probably limited to 9) and, as a consequence, this method is only usefulwhen dealing with simple diets. For the study of complex diets, pooling plant species intogroups is necessary. Therefore, further research to increase the number of markers isneeded. CAUT et al. (2008) investigated the possibility to compare stable isotope ratios ofnitrogen and carbon in resources and consumer tissues. Using hairs of the consumer couldbe used as a non-lethal method to assess the diet. However, this method is still underdevelopment.AcknowledgementsWe thank VLIZ and AWZ-WWK for the use of their infrastructure and the logistic support.Invaluable technical support was provided by Frank Broucke (VLIZ). We are grateful to Katrien DeMaeyer for sharing her knowledge about faecal analysis and creating the epidermal fragmentreference collection. Luc Maertens (ILVO) provided interesting information and literature on rabbitfeeding trials. The first author is supported by the Research Foundation – Flanders (Aspirant of theFWO-Vlaanderen).ReferencesALIPAYO, D., R. VALDEZ, J.L. HOLECHEK & M. CARDENAS (1992). Evaluation of microhistological analysis fordetermining ruminant diet botanical composition. Journal of Range Management 45: 148-152.Evaluation of faecal analysis 129
BARTOLOME, J., J. FRANCH, M. GUTMAN & N.G. SELIGMAN (1995). Physical factors that influence fecalanalysis estimates of herbivore diets. Journal of Range Management 48: 267-270.BHADRESA, R. (1977). Food preferences of rabbits Oryctolagus cuniculus L. at Holkam sand dunes,Norfolk. Journal of Applied <strong>Ecology</strong> 14: 287-291.CARABAŃO, R. & J. PIQUER (1998). The digestive system of the rabbit. In: DE BLAS, C. & J. WISEMAN(eds.), The nutrition of the rabbit. CABI Publishing, Wallingford: 1-16.CAUT, S., E. ANGULO & F. COURCHAMP (2008). Discrimination factors (Δ 15 N and Δ 13 C) in an omnivorousconsumer: effect of diet isotopic ratio. Functional <strong>Ecology</strong> 22: 255-263.DE JONG, C.B., R.M.A. GILL, S.E. VAN WIEREN & F.W.E. BURLTON (1995). Diet selection by roe deerCapreolus capreolus in Kielder Forest in relation to plant cover. Forest <strong>Ecology</strong> and Management79: 91-97.DEARDEN, B.L., R.E. PEGAU & R.M. HANSEN (1975). Precision of microhistological estimates of ruminantfood habits. Journal of Wildlife Management 39: 402-407.DUFFY, S.G., J.S. FAIRLY & G. O' DONNELL (1996). Food of rabbits Oryctolagus cuniculus on uplandgrasslands in Connemara. Biology and Environment 96(B): 69-75.DUSI, J.L. (1949). Methods for the determination of food habits by plant microtechniques and histologyand their application to cottontail rabbit food habits. Journal of Wildlife Management 13: 295-298.FERREIRA, L.M.M., M. OLIVÁN, R. CELAYA, U. GARCIA, M.A.M. RODRIGUES & K. OSORO (2007). The use of n-alkanes to estimate diet composition of ruminants grazing on species diverse plant communities- Effect of feeding selectivity on diet composition estimates. Livestock Science 111: 114-123.FREE, J.C., R.M. HANSEN & P.L. SIMS (1970). Estimating dryweights of foodplants in feces of herbivores.Journal of Range Management 23: 300-302.HAVSTAD, K.M. & G.B. DONART (1978). The microhistological technique: testing two central assumptionsin south-central New Mexico. Journal of Range Management 31: 469-470.HIRAKAWA, H. (2001). Coprophagy in leporids and other mammalian herbivores. Mammal Review 31:61-80.HOLECHEK, J.L. & M. VAVRA (1981). The effect of slide and frequency observation numbers on theprecision of microhistological analysis. Journal of Range Management 34: 337-338.HOLECHEK, J.L., M. VAVRA & R.D. PIEPER (1982). Botanical composition determination of range herbivorediets: a review. Journal of Range Management 35: 309-315.HOLECHEK, J.L. & R. VALDEZ (1985). Evaluation of in vitro digestion for improving botanical estimates ofmule deer fecal samples. Journal of Mammology 66: 574-577.HOMOLKA, M. (1987). A comparison of the trophic niches of Lepus europaeus and Oryctolaguscuniculus. Folia zoologica 36: 307-317.HOMOLKA, M. (1986). Comparison of two methods applied to study the food of Lepus europaeus. FoliaZoologica 35: 199-206.HOMOLKA, M. (1988). Diet of the wild rabbit (Oryctolagus cuniculus) in an agrocoenosis. Folia zoologica37: 121-128.130 Chapter 5
HOMOLKA, M. (1982). The food of Lepus europaeus in a meadow and woodland complex. FoliaZoologica 31: 243-253.LESLIE, D.M., M. VAVRA, E.E. STARKEY & R. SLATER (1983). Correcting for differential digestibility inmicrohistological analyses involving common coastal forages of the Pacific Northwest. Journal ofRange Management 36: 730-732.MAIA, M.J., F. REGO & F.S. MACHADO (2003). Determining optimal sampling schemes to study red deerdiets by fecal analysis. Silva Lusitana 11: 91-99.MARTINS, H., D.A. ELSTON, R.W. MAYES & J.A. MILNE (2002). Assessment of the use of n-alkanes asmarkers to describe the complex diets of herbivores. Journal of Agricultural Science 138: 425-434.MCINNIS, M.L., M. VAVRA & W.C. KRUEGER (1983). A comparison of four methods used to determine thediets of large herbivores. Journal of Range Management 36: 302-306.NETER, J., M.H. KUTNER, C.J. NACHTSHEIM & W. WASSERMAN (1996). Applied linear statistical models.Fourth Edition. USA: WCB/McGraw-Hill.PUIG, S., F. VIDELA, M.I. CONA & S.A. MONGE (2007). Diet of the brown hare (Lepus europaeus ) andfood availability in northern Patagonia (Mendoza, Argentina). Mammalian Biology 72: 240-250.PULLIAM, D.E. & NELSON, J.R. (1979). Determination of digestibility coefficients for quantification of fecalanalysis with elk. In: BOYCE, M.S. & L.D. HAYDEN-WING (eds.), North American elk: ecology,behaviour and management. University of Wyoming, Laramie: 240-246.PUTMAN, R.J. (1984). Facts from faeces. Mammal Review 14: 79-97.SAMUEL, M.J. & G.S. HOWARD (1983). Disappearing forbs in microhistological analysis of diets. Journal ofRange Management 36: 132-133.SANDERS, K.D., DAHL, B.E., SCOTT, G. (1980). Bite-count vs Fecal Analysis for Range Animal Diets.Journal of Range Management 33: 146-149.SMITH, A.D. & L.J. SHANDRUK (1979). Comparison of fecal, rumen and utilization methods forascertaining pronghorn diets. Journal of Range Management 32: 275-279.SPARKS, D.R. & J.C. MALECHEK (1968). Estimating percentage dry weight in diets using a microscopictechnique. Journal of Range Management 21: 264-265.STEWART, D.R.M. (1967). Analysis of plant epidermis in faeces: a technique for studying the foodpreferences of grazing herbivores. Journal of Applied <strong>Ecology</strong> 4: 83-111.TREYDTE, A.C., S.M. BERNASCONI, M. KREUZER & P.J. EDWARDS (2006). Diet of the common warthog(Phacochoerus africanus) on former cattle grounds in a Tanzanian savanna. Journal ofMammalogy 87: 889-898.VAVRA, M. & J.L. HOLECHEK (1980). Factors influencing microhistological analysis of herbivore diets.Journal of Range Management 33: 371-374.VAVRA, M., R.W. RICE & R.M. HANSEN (1978). A comparison of esophageal fistula and fecal material todetermine steer diets. Journal of Range Management 31: 11-13.WALLAGE-DREES, J.M. (1988). Rabbits in coastal sand dunes; weighed and counted. <strong>PhD</strong> dissertationUniversity of Leiden, Leiden, the Netherlands.Evaluation of faecal analysis 131
WERNER BJ (1980). Verzorgingsgids Konijnen. Grote-, midden-, kleine- en dwergrassen. Zuidgroep B.V.Uitgevers, Best.WILLIAMS, O.B., T.C.E. WELLS & D.A. WELLS (1974). Grazing management of Woodwalton fen: seasonalchanges in the diet of cattle and rabbits. Journal of Applied <strong>Ecology</strong> 11: 499-516.YOSHIHARA, Y., T.Y. ITO, B. LHAGVASUREN & S. TAKATSUKI (2008). A comparison of food resources used byMongolian gazelles and sympatric livestock in three areas in Mongolia. Journal of AridEnvironments 72: 48-55.132 Chapter 5
Evaluation of faecal analysis 133
134Dune Fossile de Ghyvelde, 2005 (Photographs by N. <strong>Somers</strong>)
CHAPTER 6The diet of the wild rabbit(Oryctolagus cuniculus L.):selection of plant species inan acid dune grassland<strong>Nele</strong> <strong>Somers</strong>, Beatrijs Bossuyt, Luc Lens & Maurice Hoffmann135
AbstractRabbits (Oryctolagus cuniculus L.) are expected to forage on high quality food. Experimentalresearch showed that they select for high quality forage within the same plant species.However, the spatial scale on which diet preferences are studied could influence the results,so it is not clear whether the same diet selection mechanisms are operating at the plantspecies level: little is known about plant species selection in the field, the seasonal pattern ofthis selection, and the mechanisms of this possible selection. Therefore, we studied the dietcomposition of wild rabbits in an acid dune grassland, and compared it to the availability offood throughout the different seasons of the year. Rabbits proved to select indeed their fooditems: they do not just eat according to forage availability, and seasonality does influencethe results. Plant quality did not prove to be the main trigger to select for certain species infield conditions. Although it has been proven that rabbits are able to select for the betterquality of forage at the monospecific plant patch level, this study indicates that other triggersare at least equally important in determining the diet selection at the plant species level.136 Chapter 6
IntroductionPatterns and processes of diet selection of mammalian grazing herbivores have beenextensively studied in ecological studies (e.g. BELOVSKY, 1984; WILMSHURST et al., 2000). Thetwin goals of their diet selection are maximizing nutrient intake and minimizing toxin intake(DUNCAN & GORDON, 1999). PROVENZA (1995) proposes that these goals can be obtained by apostingestive feed-back system, by which herbivores relate the satiety or malaise aftereating particular food items with the taste and smell of these items. Although PROVENZA(1995) states that ruminants and non-ruminants do not differ in the non-cognitive aspects ofhow feedback is processed, research about diet selection of medium-sized non-ruminantherbivores, such as the rabbit (Oryctolagus cuniculus L.), is very limited. Based on thesmaller volume of the digestive tract of medium-sized hindgut-fermenters, such as therabbit, and the need for quickly digestible food to fulfil their high metabolic needs (DEMMENT& VAN SOEST, 1985), smaller herbivores can be expected to need plants of higher quality thanlarger herbivores (OLFF et al., 2002).The outcome of food selection studies strongly depend on the scale of the study: anatural hierarchy of selection processes can be identified (JOHNSON, 1980). For example, atfirst order, there is the geographical range in which the animal occurs; second orderselection determines the home range of a group of rabbits; third order selection is aboutwhich habitat components of the home range are being used for foraging and then there isfourth order selection of particular food items within one habitat patch (JOHNSON, 1980). Theprediction about food selection based on food quality by medium-sized herbivores, such asrabbits, was already shown by experimental research (BAKKER et al., 2005; SOMERS et al.,2008), proving the important role of protein concentration for rabbits when selecting foodpatches, which can be considered as third order selection. However, little is known aboutselection of food plants by rabbits (fourth order). Many researchers described the dietcomposition of the wild rabbit (WILLIAMS et al., 1974; BHADRESA, 1977; CHAPUIS, 1979;HOMOLKA, 1987; DUFFY et al., 1996; WOLFE et al., 1996) and other lagomorphs (HOMOLKA,1982; PUIG et al., 2007; PAUPERIO & ALVES, 2008; SECCOMBE-HETT & TURKINGTON, 2008), butonly a few also tried to determine diet preferences (e.g. BHADRESA, 1977; CHAPUIS, 1979). Toour knowledge, studies combining data about diet preferences with plant quality data (totest the role of plant quality when selecting food plants) are not available. Also other factors(such as toxicity of the plants) could influence diet preferences as well. Since none of theplant species considered in this comparative study of a selection of abundantly present plantspecies are known as species rich in toxic secondary compounds, we could entirely focus onDiet selection in the field 137
plant quality. Due to the seasonal aspect of plant characteristics, among which forage qualitytraits, diet selection could be influenced by seasonality (CHAPUIS & FORGEARD, 1982).Therefore, diet selection has to be studied in all seasons, in order to take into account thesepossible seasonal differences.In this study we try to answer the following questions: do rabbits select for specificplant species or do they just eat according to the plant availability? If they do select, is plantquality one of the criteria they use? To answer these questions we selected an acid coastaldune grassland situation as a model in a coastal dune area richly populated by rabbits. Dietavailability and diet composition were studied and compared during all four seasons. Wehypothesized that rabbits have preferences at the plant species level, and that thesepreferences would vary among different seasons. We additionally hypothesized that foragequality would be an important determinant of forage selection by rabbits.Materials and methodsStudy area and research plotsThe research was carried out in the French Nature Reserve ‘Dune Fossile deGhyvelde’ (Ghyvelde, France, 51°2’48” N, 2°33’02” E; managed by Conservatoire du Littoral).At this site, wild rabbits comprise the dominant natural grazers, while large herbivores areused for grazing management (Haflinger horse, Equus caballus L.; LAMOOT & HOFFMANN,2004). More information about this dune area can be found in Chapter 1.Four similar grassland study plots (replicates) of 30 m x 30 m have been selected inthe study area. In each study plot, 4 transects of 30 m were established, 10 m apart fromeach other (see Figure 1). Five permanent quadrates (pqs) of 0.75 m x 0.75 m weredistributed evenly along each transect, so that there were 20 pqs in each of the four studyplots, which resulted in a total of 80 pqs.Diet availabilityFor every season, diet availability was estimated in all four study plots: 30 th ofNovember 2005 – 21st of December 2005 (further called ‘Autumn 2005), 6 th of February2006 – 3 rd of March 2006 (‘Winter 2005-2006), 2 nd of May 2006 – 29 th of May 2006 (‘Spring2006’) and 31 st of July 2006 – 10 th of August 2006 (‘Summer 2006’). Although small, the sizeof the study plot represents a rabbit home range size similar to the one described by DEKKER138 Chapter 6
et al. (2006), so we consider plant availability in the study plots as a good estimate of whatwas available for the rabbits living in or near the study plots (within their home range). Sincethe distance between the individual plots always largely exceeded 100 m, and since normalhome ranges of rabbit groups measured in Europe are mostly smaller than 1 ha (DEKKER etal., 2006), we can assume that all four plots were foraged by different rabbit groups.Figure 1: Schematic presentation of one study plot. In each plot, there are four transects of 30 m; thedistance between two transects is 10 m. Along each transect, five pqs of 75 cm by 75 cm are markedoff, distributed evenly over the transect.In each pq, all plant species (except for mosses and lichens) were identified(following VAN DER MEIJDEN (1996) and LAMBINON et al. (1998)) and their estimated cover wasnoted using the Londo scale (LONDO, 1975). Estimating plant cover is a method regularlyused for estimating diet availability (e.g. DE JONG et al., 1995). This method is lessdestructive than clipping the plant species for determining their biomass (BHADRESA, 1977)and was therefore more usable for our study, comparing diet availability in different seasonsat the same place. PAYNE (1974) confirms that using cover values alone as an index ofherbage production differences is a very useful and less time-consuming method.Using Pcord4, a TWINSPAN-table of the relevés of spring 2006 was made, in order todistinguish between different vegetation types. On the 7 th of August 2006, all study plotswere visited, and a vegetation type was assigned to every point in a grid with distance 1 mbetween the points of the grid.Diet selection in the field 139
Combining the data of the vegetation relevés and the spatial distribution of thevegetation types, we calculated the average presence (expressed as percentage of cover) ofindividual plant species per plot and per season. This measure was interpreted as theavailability of these species as a food item.Diet compositionIn each season, synchronously with the vegetation relevés, we collected 30 freshrabbit pellets within (or maximal 5 m away from) each research plot. Fresh pellets can bedistinguished from pellets which are several days old by their smooth, glossy, mucouscoating (DUSI, 1949). Pellets were collected from as many different latrines as possible andfrozen after collection.The pellets were prepared for microhistological analysis based on DE JONG et al.(1995). The selected pellets were put in an autoclave (Certo Clav Multicontrol) with somedistilled water, and sterilized for five minutes at a temperature of 125°C. After cooling down,the water was poured off, using a plankton screen (openings of 100μm), and thereafter thepellet sample was crushed. We weighed 5g of that sample and put it in a blender (WaringBlender 1l, 120-240 volt) for being mixed during one minute. The water was poured offusing the plankton screen again and the sample was put in a small pot, filled with ethanol70% and closed by a lid. The samples were conserved this way.For microscopical analysis, a drop of the sample was put on a microscopic slide andcovered by a cover slip. Per sample, 30 slides were made. Each slide was examined using amicroscope (Olympus BX41) at magnification 10 x 10. Ten epidermal plant fragments whereidentified per slide, in at least two transects. (Particles smaller than 10μm x 10μm werediscarded.) Only monocotyledonous species were identified and noted (see Chapter 5). Intotal, 150 plant fragments were identified per pellet sample (see Chapter 5). Identification ofthe fragments was done by comparing the fragments with reference photographs (DEMAEYER, unpublished) of epidermal fragments of the plant species growing in the study area,near or in five exclosures (see Chapter 2). Plant material was collected in the field; epidermalfragments were taken from the plants, cleared by household bleach and put on microscopicslides. Photographs of the fragments were taken, and the characteristics of the fragmentswere noted.The area of each plant fragment was measured and noted by using a grid of 100small squares, each square representing an area of 100 μm x 100 μm at the magnificationused (see Chapter 5).140 Chapter 6
Food qualityTo assess the food quality of the food plants, 63 food samples were taken fromGhyvelde in the summer of 2007. The following grass species have been sampled: Agrostiscapillaris (6 samples), Aira praecox (1 sample), Anthoxanthum odoratum (22 samples),Carex arenaria (13 samples), Festuca rubra (9 samples) and Luzula campestris (12 samples).The average sample dry weight was 13 g. Plant species were collected by clippingaboveground vegetation and were separately dried at 60°C (WTB Binder with controller RD 2EED/FED; Binder, Tuttlingen, Germany) until no further mass loss was detected, after whichthe dried plants were grinded separately. The percentage of crude protein (CP) and of cellwall constituents (cellulose, hemicellulose and lignin, which were derived from NDF (neutraldetergent fibre), ADF (acid detergent fibre) and ADL (acid detergent lignin)) were obtainedby Near Infrared Spectroscopy (NIRS – for more information see GIVENS et al. (1997)). AFOSS Feed and Forage Analyzer was used, combined with Winisi software (FOSS, Brussels,Belgium). The calibration for the NIRS was carried out by performing wet analyses forapproximately 10% of the samples, following the method of Kjeldahl for CP and GOERING &VAN SOEST (1970) and VAN SOEST et al. (1991) for cell wall constituents. Seasonal changes inplant quality were studied using data of plant specimens sampled near Dune Fossile deGhyvelde, approximately 5 km from the study area (EBRAHIMI, 2007) following a proceduresimilar to the one described above. Forage quality for rabbits was approximated by theamount of digestible protein (DP) and digestible energy (DE). Amounts of digestible proteinwere estimated by multiplying CP with the mean digestibility coefficient of CP for grasses(value of 0.70; MAFF, 1986). Digestible Energy was estimated by multiplying Gross Energy(based on MAFF, 1986) with a coefficient of digestibility, quantified as 0.867 – 0.0012 ADF(g/kg DM) (DE BLAS et al., 1992).Statistical analysisAfter discarding plant species covering less than 3% in each plot in every season, thefollowing six species were used in statistical analysis: Agrostis capillaris, Aira praecox,Anthoxanthum odoratum, Carex arenaria, Festuca rubra and Luzula campestris. There wereno species occurring rarely in the vegetation, but abundantly in the pellets. Paired t-testswere used to analyse differences between the availability of a plant species in each 0.09 haplot and in pellets collected within this plot. Whether the different plant species had adifferent food quality (DP and DE) and whether DP and DE were dependent on the seasonDiet selection in the field 141
was tested by general linear models, followed by Tukey Post-hoc-tests. The statistical testswere performed using SAS 9.1 (SAS Institute Inc., Cary, North Carolina).ResultsWhen comparing plant availability with plant consumption, Anthoxanthum wasselected during autumn and winter, while Agrostis was preferred during spring, summer andwinter (Table 1 and Figure 2). Luzula campestris, in contrast, was avoided during spring,autumn and winter. Diet selection by rabbits during summer 2006 deviated from thatinferred in all other seasons, with selective preference of Festuca rubra and selectiveavoidance of Carex arenaria.142 Chapter 6
Figure 2: The relationship between the cover in the vegetation and the presence in the diet of sixgraminoid species, presented separately for four seasons. Error bars present the standard errors. Theline y=x is drawn to determine preference for individual plant species. Plants that are above this lineare positively selected by the rabbits; species under this line can be considered as avoided. (Methodadapted from KUIJPER et al., 2008)Diet selection in the field 143
SEASONSUMMER 2006 SPRING 2006 WINTER 2005-2006 AUTUMN 2005PLANTSPECIESAverage ± standard errorCover in vegetation(%)Proportion of diet(%) DFPaired t-testt-valueAgrostis capillaris 0.76 ± 0.20 4.18 ± 1.71 3 -1.89 0.156Aira praecox 0.04 ± 0.04 0.00 ± 0.00 3 1.00 0.391Anthoxanthum odoratum 12.28 ± 6.95 31.94 ± 6.57 3 -3.87 0.031Carex arenaria 36.77 ± 7.76 31.11 ± 10.61 3 0.34 0.757Festuca rubra 7.48 ± 1.75 15.88 ± 5.78 3 -2.03 0.135Luzula campestris 41.04 ± 9.64 1.61 ± 1.15 3 4.10 0.026Agrostis capillaris 1.76 ± 0.55 12.06 ± 1.44 3 -5.37 0.013Aira praecox 0.00 ± 0.00 0.00 ± 0.00 3 n.a. n.a.Anthoxanthum odoratum 11.76 ± 4.88 31.27 ± 4.82 3 -5.49 0.012Carex arenaria 33.97 ± 6.92 23.95 ± 5.32 3 0.94 0.416Festuca rubra 4.01 ± 2.29 5.66 ± 1.62 3 -2.06 0.131Luzula campestris 46.17 ± 10.11 12.78 ± 5.10 3 4.61 0.019Agrostis capillaris 5.00 ± 2.00 20.11 ± 3.89 3 -6.84 0.006 *Aira praecox 3.44 ± 0.53 1.18 ± 1.09 3 1.65 0.197Anthoxanthum odoratum 25.16 ± 7.25 26.64 ± 2.97 3 -0.22 0.842Carex arenaria 22.30 ± 4.64 18.49 ± 3.51 3 0.59 0.599Festuca rubra 3.04 ± 2.00 11.51 ± 3.86 3 -1.96 0.145Luzula campestris 35.88 ± 7.89 4.06 ± 1.85 3 4.67 0.019Agrostis capillaris 5.05 ± 1.20 19.14 ± 0.98 3 16.69 0.001 *Aira praecox 4.03 ± 0.65 5.94 ± 3.98 3 -0.42 0.701Anthoxanthum odoratum 12.80 ± 6.20 13.19 ± 1.95 3 -0.08 0.938Carex arenaria 67.29 ± 6.21 12.58 ± 3.69 3 6.35 0.008 *Festuca rubra 1.67 ± 1.24 11.52 ± 1.95 3 -8.56 0.003 *Luzula campestris 5.48 ± 1.74 10.35 ± 2.11 3 -5.09 0.015 *ProbTable 1: Averages and standard errors of the presence (percentage) of the grass species in vegetationcover and in rabbit pellets. The results of the paired t-tests are also presented. DF = degrees offreedom. T-value = test statistic obtained by the test. Prob = the significance level obtained by thetest. n.a. = not applicable. * indicates that Prob is still significant after sequential Bonferronicorrection.DP of the six plant species was slightly significantly different (Table 2), but the TukeyPost Hoc did not reveal significant differences between the species. Also, the season provedto have an important influence, with a significantly higher DP in springtime (see also Figure3). DE was not significantly different between plant species and seasons.144 Chapter 6
Effect on DP (GLM) DF F-value ProbSeason 3 31.95 0.0004Plant species 5 4.64 0.044Lsmean Season LsmeanAutumn 2005 6.98Winter 2005-2006 6.90Spring 2006 11.66Summer 2006 6.86Tukey Post-hoc-tests SeasonProbAutumn vs. Winter 0.999Autumn vs. Spring 0.001Autumn vs. Summer 0.996Winter vs. Spring 0.001Winter vs. Summer 1.000Spring vs. Summer 0.001Lsmean Plant species LsmeanAgrostis capillaris (1) 6.92Aira praecox (2) 9.24Anthoxanthum odoratum (3) 6.41Carex arenaria (4) 8.15Festuca rubra (5) 8.77Luzula campestris (6) 9.11Tukey Post-hoc-tests Plant species Prob(1) (2) (3) (4) (5) (6)(1) - 0.229 0.990 0.292 0.077 0.271(2) 0.229 - 0.194 0.811 0.992 1.000(3) 0.990 0.194 - 0.459 0.219 0.225(4) 0.292 0.811 0.459 - 0.821 0.875(5) 0.077 0.992 0.219 0.821 - 0.998(6) 0.271 1.000 0.225 0.875 0.998 -Effect on DE (GLM) DF F-value ProbSeason 3 4.48 0.056Plant species 5 2.93 0.112Table 2: Results of the general linear model applied to DP and DE of the grass species. DF = degreesof freedom. F-value = test statistic obtained by the model. Prob = the significance level obtained bythe test. Least square means (Lsmean) and Tukey Post-Hoc-test-results for the significant variablesare also shown.Diet selection in the field 145
1,601,401,20DPAgrostis capillarisCarex arenariaFestuca rubraLuzula campestrisAira praecoxAnthoxanthum odoratum1,00DP (%)0,800,600,400,200,00Autumn Winter Spring SummerSeasonDE (MJ / kg dry matter)1,601,401,201,000,800,600,40DEAgrostis capillarisCarex arenariaFestuca rubraLuzula campestrisAira praecoxAnthoxanthum odoratum0,200,00Autumn Winter Spring SummerSeasonFigure 3: Average DP and DE for some grass species, for each season separately. Standard errors areshown. There were no measurements for Luzula campestris, Aira praecox and Anthoxanthumodoratum in autumn, winter and spring.146 Chapter 6
DiscussionRabbits do not just eat what is available in their environment. Apart from preferencefor specific foraging patches (third order selection, see above - BAKKER et al., 2005; SOMERSet al., 2008), plant-specific traits also appear to affect diet selection (this study). The extentof preference or avoidance of individual plant species thereby differed among seasons, withthe weakest effects recorded during autumn and winter.As the animals do not just eat what they find, there should be a selectionmechanism. Our hypothesis holds plant quality responsible for this selection and avoidance.The data on plant quality that were collected do not confirm this hypothesis though: thedifferent plant species did not really prove to have a significantly different plant quality.However, plant traits other than nutritional quality may trigger selection or avoidance aswell. For instance, the hairy habitus of Luzula campestris may deter rabbits. We do howevernot expect that this would indeed be the case, because Luzula campestris proved to be apreferred species in one season. Might rabbit diet preferences then be influenced by factorsthat do not come from the plant species? This does not seem to be the case: factors asantipredator considerations (KOTLER & BLAUSTEIN, 1995; IASON et al., 2002), the distancebetween the food plants and the central-place (HAARBERG & ROSELL, 2006), the social rank ofthe animal (LOCKLEY, 1976; KRÜGER & FLAUGER, 2008) do seem to be especially importantwhen testing diet preferences at the patch level (when deciding in which patch going toforage) and not on the species level. However, this consideration would not be true whendifferent plant species are growing in different patches. This did not seem to be the case inour study area either, but studying spatial patterns of species in relation to feedingpreferences of rabbits would be interesting. We recommend that the spatial distribution ofplants should be explicitly incorporated in future studies on this topic. The distance betweenplant species could then also be included in analyses: when the previous plant you haveeaten was very bad, the nearby plant will taste much better (negative contrasts, BERGVALL etal., 2007). We should however mention that the social status should not have influenced ourresults, since pellets were sufficiently widely sampled to allow assuming that pellets ofdifferent rabbits were collected.Whatever might be the reason for plant species preferences, we should realise thatdifferent study scales do influence the outcome of a study, as mentioned before. Studiesrevealing the preference of rabbits for high quality food came from patch-based studies (e.g.BAKKER et al., 2005; SOMERS et al., 2008) or group-based studies (MARTINS et al., 2002)These last authors show a preference for high quality food items at group level: the groupDiet selection in the field 147
“grasses and forbs” was preferred above other food items, because of its high quality. Theremay even be finer levels on which food selection takes place: rabbits are able to select forplant parts, because of their small statue (DREES, 1992).In conclusion, this study shows that the rabbits in our acid dune grassland system areselective grazers: they do not just eat what is available, but they do select for specific plantspecies, depending on the season. Plant quality did not prove to be the reason for the dietselection, contrary to our hypothesis. We recommend that patchiness of plant species shouldbe incorporated in future studies concerning this topic. Moreover, it should be realized thatthe scale on which a study is carried out could strongly influence the results.AcknowledgementsWe thank Conservatoire du Littoral for allowing access to the study area. Technical supportwas provided by Ward Vercruysse (INBO), Tanja Milotic (INBO) en Sam Provoost (INBO). We thankVLIZ and AWZ-WWK for the use of their infrastructure. We are grateful to Katrien De Maeyer forsharing her knowledge about faecal analysis and creating the epidermal fragment reference collection.Ataollah Ebrahimi (U<strong>Gent</strong>) gave us access to his plant quality data. Luc Maertens (ILVO) providedinteresting information and literature on food quality for rabbits. The first author is supported by theResearch Foundation – Flanders (Aspirant of the FWO-Vlaanderen).ReferencesBAKKER, E.S., R.C. REIFFERS, H. OLFF & J.M. GLEICHMAN (2005). Experimental manipulation of predationrisk and food quality: effect on grazing behaviour in a central-place foraging herbivore.Oecologia 146: 157-167.BELOVSKY, G.E. (1984). Herbivore optimal foraging: a comparative test of three models. The AmericanNaturalist 124: 97-115.BERGVALL, U.A., P. RAUTIO, T. LUOTOLA & O. LEIMAR (2007). A test of simultaneous and successivenegative contrast in fallow deer foraging behaviour. Animal Behaviour 74: 395-402.BHADRESA, R. (1977). Food preferences of rabbits Oryctolagus cuniculus L. at Holkam sand dunes,Norfolk. Journal of Applied <strong>Ecology</strong> 14: 287-291.CHAPUIS, J.L. (1979). Evolution saisannière du régime alimentaire d'Oryctolagus cuniculus (L.) dansdifférents types d'habitats en France. In: MYERS, K. & C.D. MACINNES (eds), Proceedings of theworld lagomorph conference, University of Guelph, ON, Canada: 743-760.CHAPUIS, J.L. & F. FORGEARD (1982). Liaisons entre les choix alimentaires du lapin du garenne,Oryctolagus cuniculus (L.), et la phénologie de la végétation sur les pelouses et des landesincendiées. Acta Oecologica 3: 495-510.DE BLAS, C., J. WISEMAN, M.J. FRAGA & M.J. VILLAMIDE (1992). Prediction of the digestible energy and148 Chapter 6
digestibility of gross energy of feeds for rabbits. 2. Mixed diets. Animal Feed Science andTechnology 39: 39-59.DE JONG, C.B., R.M.A. GILL, S.E. VAN WIEREN & F.W.E. BURLTON (1995). Diet selection by roe deerCapreolus capreolus in Kielder Forest in relation to plant cover. Forest <strong>Ecology</strong> and Management79: 91-97.DEKKER, J.J.A., M. GROENEVELD & S.E. VAN WIEREN (2006). No effects of dominance rank or sex on spatialbehaviour of rabbits. Lutra 49: 59-66.DEMMENT, M.W. & P.J. VAN SOEST (1985). A nutritional explanation for body-size patterns of ruminantand nonruminant herbivores. The American Naturalist 125: 641-672.DREES, M. (1992). Het Konijn en zijn relaties. Duin 15: 11-13.DUFFY, S.G., J.S. FAIRLY & G. O' DONNELL (1996). Food of rabbits Oryctolagus cuniculus on uplandgrasslands in Connemara. Biology and Environment 96 B: 69-75.DUNCAN, A.J. & I.J. GORDON (1999). Habitat selection according to the ability of animals to eat, digestand detoxify foods. Proceedings of the Nutrition Society 58: 799-805.DUSI, J.L. (1949). Methods for the determination of food habits by plant microtechniques and histologyand their application to cottontail rabbit food habits. Journal of Wildlife Management 13: 295-298.EBRAHIMI, A. (2007). Towards an integrated framework of determining grazing capacity in lowproductive,spatially heterogeneous landscapes. <strong>PhD</strong> dissertation, <strong>Ghent</strong> University, <strong>Gent</strong>,Belgium.GIVENS, D.I., DE BOEVER, J.L. & DEAVILLE, E.R. (1997). The principles, practices and some futureapplications of near infrared spectroscopy for predicting the nutritive value of foods for animalsand humans. Nutrition research reviews 10: 83-114.GOERING, H.K. & P.J. VAN SOEST (1970). Forage Fibre Analysis (Apparatus, Reagents, Procedures, andSome Applications). Agricultural Handbook No. 379, Agricultural Research Service, United StatesDepartment of Agriculture.HAARBERG, O. & F. ROSELL (2006). Selective foraging on woody plant species by the Eurasian beaver(Castor fiber) in Telemark, Norway. Journal of Zoology 270: 201-208.HOMOLKA, M. (1982). The food of Lepus europaeus in a meadow and woodland complex. FoliaZoologica 31: 243-253.HOMOLKA, M. (1987). A comparison of the trophic niches of Lepus europaeus and Oryctolaguscuniculus. Folia zoologica 36: 307-317.IASON, G.R., T. MANSO, D.A. SIM & F.G. HARTLEY (2002). The functional response does not predict thelocal distribution of European Rabbits (Oryctolagus cuniculus) on grass swards: experimentalevidence. Functional <strong>Ecology</strong> 16: 394-402.JOHNSON, D.H. (1980). The comparison of usage and availability measurements for evaluating resourcepreference. <strong>Ecology</strong> 61: 65-71.KOTLER, B.P. & L. BLAUSTEIN (1995). Titrating food and safety in a heterogeneous environment: whenare the risky and safe patches of equal value? Oikos 74: 251-258.Diet selection in the field 149
KRÜGER, K. & B. FLAUGER (2008). Social feeding decisions in horses (Equus caballus). BehaviouralProcesses 78: 76-83.KUIJPER, D.P.J., P. BEEK, S.E. VAN WIEREN & J.P. BAKKER (2008). Time-scale effects in the interactionbetween a large and a small herbivore. Basic and Applied <strong>Ecology</strong> 9: 126-134.LAMBINON, J., J.-E. DE LANGHE, L. DELVOSALLE & J. DUVIGNEAUD (1998). Flora van België, hetGroothertogdom Luxemburg, Noord-Frankrijk en de aangrenzende gebieden (Pteridofyten enSpermatofyten). Nationale Plantentuin van België, Meise.LAMOOT, I. & M. HOFFMANN (2004). Do season and habitat influence the behaviour of Haflinger mares ina coastal dune area? Belgian Journal of Zoology 134: 97-103.LOCKLEY, R.M. (1976). The private life of the rabbit. Het Spectrum, Utrecht.LONDO, G. (1975). De decimale schaal voor vegetatiekundige opnamen van permanente kwadraten.Gorteria 7: 101-106.MAFF (1986). Feed Composition - UK Tables of Feed Composition and Nutritive Value of Ruminants.Chalcombe Publications, Marlow, Bucks, UK.MARTINS, H., J.A. MILNE & F. REGO (2002). Seasonal and spatial variation in the diet of the wild rabbit(Oryctolagus cuniculus L.) in Portugal. Journal of Zoology, London 258: 395-404.OLFF, H., M.E. RITCHIE & H.H.T. PRINS (2002). Global environmental controls of diversity in largeherbivores. Nature 415: 901-904.PAUPÉRIO, J. & P.C. ALVES (2008). Diet of the Iberian hare (Lepus granatensis) in a mountainecosystem. European Journal of Wildlife Research 54: 571-579.PAYNE, G.F (1974). Cover-weight relationships. Journal of Range Management 27: 403-404.PROVENZA, F.D. (1995). Postingestive feedback as an elementary determinant of food preference andintake in ruminants. Journal of Range Management 48: 2-17.PUIG, S., F. VIDELA, M.I. CONA & S.A. MONGE (2007). Diet of the brown hare (Lepus europaeus) and foodavailability in northern Patagonia (Mendoza, Argentina). Mammalian Biology 72: 240-250.SECCOMBE-HETT, P. & R. TURKINGTON (2008). Summer diet selection of snowshoe hares: a test ofnutritional hypotheses. Oikos 117: 1874-1884.SINCLAIR, A.R.E. & NORTON-GRIFFITHS, M. (1982). Does competition or facilitation regulate migrantungulate populations in the Serengeti? A test of hypotheses. Oecologia 53: 364-369.SOMERS, N., B. D’HAESE, L. LENS, B. BOSSUYT & M. HOFFMANN (2008). Food quality affects diet preferenceof small herbivores: experimental evidence. Belgian Journal of Zoology 138: 170-176.VAN DER MEIJDEN, R. (1996). Heukels' Flora van Nederland. Wolters-Noordhoff, Groningen.VAN SOEST P.J., J.B. ROBERTSON & B.A. LEWIS (1991). Methods for Dietary Fibre, Neutral Detergent Fibre,and Nonstarch Polysaccharides in Relation to Animal Nutrition. Journal of Dairy Science 74: 3583-3597.WILLIAMS, O.B., T.C.E. WELLS & D.A. WELLS (1974). Grazing management of Woodwalton fen: seasonalchanges in the diet of cattle and rabbits. Journal of Applied <strong>Ecology</strong> 11: 499-516.WILMSHURST, J.F., J.M. FRYXELL & C.M. BERGMAN (2000). The allometry of patch selection in ruminants.Proceedings of the Royal Society of London, Series B 267: 345-349.150 Chapter 6
WOLFE, A., WHELAN, J. & HAYDEN, T.J. (1996). Dietary overlap between the Irish mountain hare Lepustimidus hibernicus and the rabbit Oryctolagus cuniculus on coastal grassland. Biology andEnvironment 96 B: 89-95.Diet selection in the field 151
152Wild rabbit, Puyenbroeck, 2006 (Photographs by M. Pevenage)
CHAPTER 7General discussion153
The main hypothesis of the research is that introduced large herbivores facilitaterabbits (medium-sized herbivores) by modification of the vegetation. This modificationinvolves creating short swards, creating denser (more productive) swards, creating swardsthat have a high food quality for rabbits and influencing vegetation composition. We expectthat these modifications are not completely independent from each other: shorter swards areexpected to have a higher food quality and to be more productive. We started from fieldobservations under complex conditions to discover patterns and ended up with semicontrolledfield- and controlled experimental research to reveal some causal mechanisms. Bycombining these results, we will now discuss the partial hypotheses which were presented inChapter 1 and finally, we will discuss the implications of our research results for the mainhypothesis.Hypothesis 1: Large herbivores modify vegetation structure by grazing, therebycreating short and dense swards.This research shows that large grazers modify vegetation structure, thereby creatingshort swards, but these were not denser than the high, ungrazed swards.The combination of large grazers introduced in the study areas Dune Fossile deGhyvelde and IJzermonding with rabbits keeps the vegetation structure in a more openstate: vegetation height is lower and litter cover is significantly lower than in vegetationwhere the large grazers and rabbits were excluded (Chapter 2). Although we cannot ascribethese effects to the large grazers alone, the fact that grazing treatments with exclusion ofonly large grazers were intermediate between vegetation that was ungrazed and vegetationthat was also grazed by large herbivores, suggests that the influence of large grazers waslarger than the influence of the rabbits. We conclude that large grazers are at least able tocreate the typical low-canopy structure of grazing lawns.The grazing did not result in denser swards though. In August-September 2005(summer season), the aboveground vegetation of a random selection of pqs in theexclosures of Ghyvelde and IJzermonding was totally clipped and weighed (after drying)(Chapter 3). In Ghyvelde and IJzermonding, biomass concentration (i.e. the biomass pervertical layer of the vegetation; Table 1) was not significantly differing between the grazingtreatments. A higher biomass concentration (dry weight divided by vegetation height -MCNAUGHTON, 1984) was predicted to be a second aspect of grazing lawns (VAN DER GRAAF etal., 2005): ungrazed plants grow taller, more robust and occupy a larger, but less denselypacked space than plants in more heavily grazed grasslands (MCNAUGHTON, 1984). We154 Chapter 7
cannot confirm this part of the hypothesis and thereby affirm the conclusions of BELSKY(1986), who doubts the existence of overcompensation in grazed plants. However, weshould realize that overcompensation of plant tissue might be possible only at low levels ofherbivory (MCNAUGHTON, 1983) and that our study areas have a relatively low productivity.More productive areas might yield other results. Also, belowground biomass was not takeninto account when testing for overcompensation (BELSKY, 1986), but it is reasonable toassume that belowground biomass is less useful for predicting sward use by rabbits. Resultsare also slightly contradictory to the findings of TAHMASEBI KOHYANI et al. (subm.), who foundthat grazing-tolerant grass species (Agrostis stolonifera, Poa pratensis) grew a larger numberof tillers in grazed dune grassland than the same species in non-grazed dune grassland. Onthe other hand, they also found that two other - grazing intolerant - grass species (Holcuslanatus, Festuca arundinacea) showed a tiller number decrease phenomenon under grazing.All four species showed biomass decrease under grazing, which corroborates our findings inthe exclosure experiment.Hypothesis 2: Rabbits preferentially forage in short swardsThis hypothesis was experimentally affirmed by this thesis (Chapter 3), proving thatrabbits that could choose between unmown and shortly-mown vegetation strips (study area:Puyenbroeck) significantly preferred shortly-mown vegetation. We therefore conclude thatrabbits do not forage following the classical Type II response (HOLLING, 1959), opposite toexpectations of OKSANEN et al. (1981), LUNDBERG (1988), LUNDBERG & ÅSTRÖM (1990) andGROSS et al. (1993). A unimodal, dome-shaped Type IV functional response (BOS et al., 2002;DURANT et al., 2003; DEKKER & VAN LANGEVELDE, 2007; VAN LANGEVELDE et al., 2008) is morelikely the case for the rabbit.However, the exclosure data from a less productive study area (Dune Fossile deGhyvelde, Chapter 3), in which rabbit activity in vegetation grazed by horses and vegetationnot grazed by horses was compared, did not yield similar results. Rabbits did not showforaging preferences for the treatment with presence of large herbivores, but neither for thetreatment without horses. Nevertheless, vegetation height was significantly differentbetween these treatments. It should be mentioned though that the “low” vegetation inPuyenbroeck was lower than the mean vegetation height in “low” swards in Ghyvelde, whichwere almost as high as the “long” swards in Puyenbroeck. So, in Ghyvelde, we have toconclude that vegetation height did not influence foraging behaviour of the rabbits, or thatGeneral discussion 155
GHYVELDE L+R+S R+S S num den F P P Post Hoc TestNon-woody plants only Average ± S.E. Average ± S.E. Average ± S.E. d.f. d.f. L+R+S vs R+S R+S vs S L+R+S vs. SCP (%) 10.40 ± 0.50 9.98 ± 0.40 8.31 ± 0.35 2 22 5.18 0.014 0.755 0.047 0.013Cellulose (%) 23.24 ± 2.28 27.67 ± 0.93 29.87 ± 1.20 2 22 3.93 0.035 0.129 0.647 0.038Hemicellulose (%) 22.14 ± 0.83 23.71 ± 1.08 27.62 ± 0.62 2 22 7.30 0.004 0.442 0.030 0.003Lignin (%) 8.66 ± 0.47 7.67 ± 0.26 7.27 ± 0.26 2 22 3.70 0.041 0.123 0.737 0.049DP (%) 7.28 ± 0.35 6.99 ± 0.28 5.82 ± 0.24 2 22 5.18 0.014 0.755 0.047 0.013DE (MJ / kg DM) 9.01 ± 0.44 8.24 ± 0.23 7.84 ± 0.23 2 22 2.93 0.074 0.216 0.704 0.077Dry weight (g) 71.17 ± 6.55 85.31 ± 17.13 144.99 ± 12.22 2 22 6.81 0.005 0.717 0.020 0.005Biomass concentration (g/cm) 5.73 ± 1.14 3.56 ± 1.09 5.36 ± 0.41 2 22 1.34 0.281 0.289 0.498 0.972IJZERMONDING L+R+S R+S S num den F P P Post Hoc TestR+S vsS L+R+S vs. SNon-woody plants only Average ± S.E. Average ± S.E. Average ± S.E. d.f. d.f. L+R+S vs R+SCP (%) 8.83 ± 0.14 9.16 ± 0.45 9.26 ± 0.17 2 29 0.72 0.497 0.665 0.966 0.504Cellulose (%) 26.46 ± 1.02 27.42 ± 1.52 28.47 ± 0.99 2 29 0.73 0.489 0.834 0.817 0.456Hemicellulose (%) 23.93 ± 0.54 24.36 ± 1.18 25.03 ± 0.78 2 29 0.44 0.651 0.931 0.849 0.625Lignin (%) 7.56 ± 0.19 7.69 ± 0.28 8.86 ± 0.49 2 29 4.66 0.018 0.959 0.053 0.022DP (%) 6.18 ± 0.10 6.41 ± 0.32 6.48 ± 0.12 2 29 0.72 0.497 0.665 0.966 0.504DE (MJ / kg DM) 8.53 ± 0.24 8.29 ± 0.32 7.79 ± 0.18 2 29 2.20 0.129 0.778 0.387 0.113Dry weight (g) 79.69 ± 6.74 107.50 ± 18.15 155.70 ± 13.40 2 29 8.91 0.001 0.289 0.042 0.001Biomass concentration (g/cm) 1.89 ± 0.19 1.92 ± 0.31 1.92 ± 0.30 2 30 0.01 0.995 0.997 1.000 0.995Table 1: Results of the plant analyses of Dune Fossile de Ghyvelde and IJzermonding. In August-September 2005 (summer season), the abovegroundvegetation of a random selection of pqs in the exclosures of Ghyvelde and IJzermonding was totally clipped, weighed (after drying) and food quality of thesesamples was analysed. Biomass is expressed in average total dry weight (g) in 75 x 75 cm plots; biomass concentration is an indication of the verticaldistribution (expressed in cm) of biomass in the vegetation. Averages and standard errors are presented per treatment (L+R+S = accessible to all herbivores;R+S: accessible to rabbits and smaller herbivores, but not to large grazers; S: accessible to small herbivores but not to rabbits and larger herbivores). Theresults of the statistical tests (general linear models testing the effect of TREATMENT, followed by Tukey Post Hoc Tests) are presented. CP = % Crude Protein.DP = % Digestible Protein. DE = Digestible Energy (MJ per kg dry matter). num d.f. = numerator degrees of freedom. den d.f. = denominator degrees offreedom. F = F-value, test statistic obtained by the GLM. P = the significance level obtained by the test.156 Chapter 7
vegetation was simply not short enough for obtaining facilitation, or that it interferes withother, unknown limiting factors.Hypothesis 3: The short swards created by large grazers are of a highernutritional quality (for rabbits) than ungrazed swards (grazing lawns)Our results only partially indicate that large grazers create high quality swards. DPand DE were used as measures for food quality. DP was influenced in Ghyvelde: a lower DPconcentration was observed when as well rabbits as large herbivores were excluded. Therewas however no influence when excluding only large herbivores (Table 1). DE was neverpositively influenced by grazing of large herbivores (Table 1) or by mowing (Chapter 3).Therefore, we cannot entirely confirm this hypothesis, which was predicted by results of e.g.COPPOCK et al. (1983) and RUESS (1984).However, it is important to note that protein concentration in Ghyvelde is higher invegetation grazed by all grazers or by rabbits, while fibre concentration is usually higher inexclosures without large grazers and rabbits. Also, we cannot exclude that other resultsmight have been obtained when focusing on individual plant species, plant parts (FOX et al.,1998) or belowground biomass (BELSKY, 1986). We should realize that many environmentalfactors may influence and obscure the effect of grazing on plant productivity and quality,e.g. soil nutrient availability, shading, grazer density, grazer species, grazing regime,intensity and frequency of defoliation (MILCHUNAS et al., 1995). More research, focussing ondifferent levels (swards, plant species, plant part) in different (high and low productive)habitats is needed to gain more insight into this hypothesis.Hypothesis 4: When foraging, food quality is an important factor determining thediet choices of the rabbit.We can partially affirm this hypothesis: third order food selection (selection betweenplant patches - JOHNSON, 1980) by rabbits was experimentally proven to be significantlyinfluenced by food quality (Chapter 4). The small statue of the rabbit forced it to feed onhigh quality forage (DEMMENT & VAN SOEST, 1985; WILMSHURST et al., 2000; OLFF et al., 2002).In our trial, we were really able to show a causal relationship between food quality and dietselection, because we controlled for sward height or vegetation biomass, thereby avoidingthe problem of interactions between food quality and food availability (e.g. BALL et al.,General discussion 157
2000). We were not able to test the effect of food availability itself, so a trade-off betweenfood quality and food availability might still be possible.The hypothesis is not confirmed though, when considering fourth order food selection(selection of particular food items within one habitat patch - JOHNSON, 1980). Rabbits doselect between different plant species and they do not just eat according to forageavailability, but this selectivity could not be related to plant quality (Chapter 6). Inconclusion, whether rabbits are selective for high quality forage depends on the spatial scaleof the study. Other factors might be involved too, e.g. general quality of the phytomass(nutrient poor versus nutrient rich environments), and the accompanying grazer species.Hypothesis 5: Rabbits prefer the short swards created by large herbivoresbecause of the higher nutritional value of these swardsThis hypothesis cannot be affirmed by our results. In Puyenbroeck, wild rabbitspreferred short swards for grazing, although no significant forage quality differencesbetween short and high swards have been observed (Chapter 3). Therefore, we canconclude that vegetation height really was the factor that encouraged the rabbits to graze inthe mown strips. When short-grazed vegetation is of higher quality than ungrazedvegetation, this might be an additional trigger for the rabbits to prefer these short swards.But the results of Puyenbroeck suggest that there should be additional other reasons thatcause the preference of the rabbit for short swards.An alternative explanation could be that the large grazers make more grassaccessible to the rabbits, by reducing grass height and removing stems (VAN DE KOPPEL et al.,1996; ARSENAULT & OWEN-SMITH, 2002). For example, grass stems could be considered asforaging deterrents (DRESCHER et al., 2006). This alternative explanation has not deservedmuch attention by researchers studying wild rabbits. We suggest that this path should atleast be explored. Other authors address the preference of rabbits for short swards topredation-related issues (IASON et al., 2002; BAKKER et al., <strong>2009</strong>): less time is needed forvigilance in short swards (so that more time can be spent to foraging). We mighthypothesize that central place foragers as rabbits need low vegetation for facilitating theirflee towards the safe burrow, when predators are observed (BAKKER et al., <strong>2009</strong>). However,this hypothesis has not really been tested (BAKKER et al., <strong>2009</strong>) and the experiments ofBAKKER et al. (2005) and DEKKER et al. (2007) show that rabbits, although sensitive toperceived predation risk, do not alter the average spatial distribution of their grazingpressure as a consequence of an increased perceived predation risk. Rather, the rabbits158 Chapter 7
shifted the time of foraging or did increase total foraging time (spending more time onvigilance).In conclusion, we found that rabbits are able to discriminate between forage ofdifferent food quality, that they do select for the most nutritious forage when this is the onlydifferentiating factor and also that they possibly prefer a lower vegetation height forforaging. However, the reason why rabbits prefer short swards is not necessarily related tothe expected high quality of these swards: selection for short swards may also occur whenno differences in food quality are observed.Hypothesis 6: Also rabbits might be able to create short and high qualitativeswards, thereby facilitating themselvesRabbits do have an important influence on vegetation, but nevertheless, they are notable to maintain a favourable vegetation structure themselves in IJzermonding and Ghyvelde(Chapter 2). When herbivores are able to maintain favourable grazing swards on their own,without the help of large herbivores, self facilitation (ARSENAULT & OWEN-SMITH, 2002) wouldbe occurring rather than interspecific feeding facilitation. The results of this thesis howevershow that rabbits at the present density were not able to facilitate themselves sufficientlyand therefore, we suppose that self facilitation will only play a secondary role in thesecoastal dune ecosystems.Hypothesis 7: Large herbivores can modify vegetation composition. This has aninfluence on rabbits as they prefer certain plants species above others whenforaging.An alternative form of feeding facilitation (long term facilitation - KUIJPER et al., 2008)might be present in our study areas: in the long term, large herbivores may not only altervegetation structure (and eventually forage quality) but also alter plant species compositionof the vegetation, which has been encountered in several of the Flemish dune reserveswhere grazing was introduced in the nineties (PROVOOST, 2005). This could lead to a longterm form of feeding facilitation: medium-sized grazers would be facilitated by large grazersbecause other plant species emerge, which was shown in a herbivore assemblage of cattleand hares (KUIJPER et al., 2008). Possibly, this type of feeding facilitation could also occur inassemblages of rabbits and large herbivores. Our study showed that the rabbits in the aciddune grassland system are selective grazers: they do not just eat what is available, but theyGeneral discussion 159
do select for specific plant species, depending on the season (Chapter 6). Also, our resultsshow that large herbivores influence plant species composition of dune grasslands (Chapter2). This was shown more explicitly in IJzermonding than in Ghyvelde, but we should realizethat this project lasted for only six years, while the long term facilitation in the study ofKUIJPER et al. (2008) was observed in a 30-year period (see also PROVOOST (2005) forWesthoek and Houtsaeger Dunes). At least, in the coastal dune grasslands of our study,there is a potential for such long term feeding facilitation.The main hypothesis: Feeding facilitation by creation and preference of short,dense, high quality vegetation?The main hypothesis of this thesis supposes that interspecific feeding facilitationwould occur when grazing by large herbivore species reduces vegetation height andstimulates grass re-growth, thereby enhancing the nutritional quality of forage for anotherspecies (ARSENAULT & OWEN-SMITH, 2002; VAN LANGEVELDE et al., 2008), while rabbits wouldpreferably forage in these created grazing lawns. The results of our research show that partsof this hypothesis can be affirmed (creation of short swards by large grazers, preference ofrabbits for short swards, preference of rabbits for high quality forage and swards), whileother parts (creation of dense high quality swards, preference for short swards because ofquality considerations) could not be concluded. Also long term feeding facilitation by alteringvegetation composition (KUIJPER et al., 2008) could not be affirmed completely, althoughthere is a potential that this type of facilitation could occur in the future. So, althoughmentioned anecdotically by e.g. WILLIAMS et al. (1974), WALLAGE-DREES (1982), OOSTERVELD(1983), DREES (1989) and DREES (1998), feeding facilitation between rabbits and largegrazers is probably not present in the herbivore assemblage present in our study areas orcould at least not be detected and our global main hypothesis about this type of feedingfacilitation is not confirmed.We could explain this by supposing that this type of feeding facilitation does notexist. However, feeding facilitation could be necessary for rabbit populations as they are notable to facilitate themselves and some mechanisms causing facilitation could effectively bedetected, indicating that there are at least strong indications that the mechanism of feedingfacilitation does exist in this grazer assemblage. We should therefore consider the optionthat the existence of feeding facilitation is possible, but that it could not be present in ourstudy system, perhaps due to masking effects of interfering environmental factors, different160 Chapter 7
grazer densities (large herbivores as well as rabbits), relatively low productivity of the dunegrasslands under consideration, etc.There are several reasons why feeding facilitation might not be detected. As feedingfacilitation in herbivore assemblages is an indirect interaction, causal relationships are hardto prove and we could say that feeding facilitation is a hidden interaction. Also, we should beaware of the contrast between experimental results and field observations. In this study, thepreference of rabbits for high quality swards and for short swards has been shown undersimple, semi-controlled or entirely controlled experimental conditions (Chapter 3, 4), whilefield conditions (Chapter 3, second part) did not yield similar results. Also from this point ofview, feeding facilitation could be considered as a hidden interaction. Also, the conditions forfeeding facilitation might not be fulfilled in our study system. Under complex field conditions,many factors may be mixed up with the mechanisms of feeding facilitation, so that theinteraction might not be possible.First, the grazing behaviour of rabbits may be a trade-off of food qualityconsiderations (Chapter 3), food availability, anti-predator considerations (IASON et al., 2002;BAKKER et al., <strong>2009</strong>), social factors (LOCKLEY, 1976), food accessibility (VAN DE KOPPEL et al.,1996) and distance from the burrow (DEKKER, 2007). Although rabbits might be selective forshort swards, this could be masked on the moment that, for example, a high predation riskis perceived by the animals. Researchers should be aware that many factors influencing dietselection of rabbits could be operating at the same time under field conditions, which makesit impossible to understand causal mechanisms. Several types of facilitation (Chapter 1)could be operating at the same time, which makes it harder to detect them when notexcluding confounding factors experimentally.Second, the balance of facilitation and competition may depend on plant productivity(KUIJPER et al., 2004; CHENG & RITCHIE, 2006; DEKKER & VAN LANGEVELDE, 2007). We showedalready differences in the foraging behaviour of rabbits in Ghyvelde and Puyenbroeck, twoareas which are different in plant productivity (Chapter 3). Also, the impact of herbivores onvegetation parameters was different for Ghyvelde and IJzermonding (Chapter 2), suggestingthat also the creation of grazing lawns (MCNAUGHTON, 1984) might be different between bothareas differing in both abiotic conditions and herbivore species, density and grazing regime.We could not detect the creation of grazing lawns in our study areas but this does not meanthat the mechanism of grazing lawns does not exist: it might be occurring in other types ofstudy areas. Therefore, confronting experimental data with field observations isindispensable: it may reveal confounding factors and finally allow researchers to model thefeeding facilitation mechanisms along a gradient of productivity.General discussion 161
Third, as well the density of large herbivores as the density of rabbits might influencewhether feeding facilitation occurs or not. The hypothesis that facilitation is stronger at lowerrabbit densities (BAKKER et al., <strong>2009</strong>) could be confirmed by comparing the data of Ghyveldewith those of BAKKER (2003). Facilitation is occurring in the study area of the latter, with alower rabbit density than Ghyvelde, where facilitation is not occurring (Chapter 3). However,this hypothesis is contrasting to the finding that there is facilitation in Puyenbroeck , an areawith a much higher rabbit density.Fourth, it is possible that facilitation is a seasonal phenomenon: there might be atemporal trade-off of facilitation and competition between grazers, which could explain whypopulation effects of facilitation are hardly ever observed (ARSENAULT & OWEN-SMITH, 2002;DEKKER, 2007). The seasonal pattern of the rabbit diet selection (Chapter 6) is supporting thepossibility of seasonal facilitation, although not yet present.In conclusion, feeding facilitation is often a masked or even hidden interaction inherbivore assemblages, because of its indirect nature and because of the many confoundingfactors that are arising under field conditions and that might prevent facilitation. Therefore,experimental research under simplified conditions is indispensable to unravel causalmechanisms and the conditions in which facilitation can occur, while additional field researchis still needed to link experimental data to field reality.General conclusionBy combining experimental research with field data, we were able to discover somecausal relationships (food quality as well as vegetation height influence foraging decisions ofrabbits), meanwhile proving that more factors than these are involved in facilitative grazinginteractions, so that the main hypothesis could not be unambiguously affirmed. From thecombination of all our results, further questions are originating:i) Is plant accessibility playing a role in rabbit diet selection?ii) What is the role of predators in rabbit diet selection?iii) Are short, dense, high quality swards ever realised in coastal dune areas?iv) What is the role of habitat productivity?v) What is the role of seasonality?162 Chapter 7
Experimental research on these topics is needed to gain further insight in these mechanisms,while combining the results with field data will still be indispensable for understanding therelationships and trade-offs between the different mechanisms.Suggestions for further researchThe field results from this study are originating from two coastal dune areas with arelatively low productivity. As productivity might influence the outcome of interactions inherbivores assemblages (CHENG & RITCHIE, 2006; DEKKER & VAN LANGEVELDE, 2007), similarresearch in other, more productive study areas would be very informative. Topics that shouldbe investigated in these areas are the formation and nature of grazing lawns under differentbiotic and abiotic conditions, the ability of rabbits to facilitate themselves, the role of theoften strongly fluctuating rabbit population sizes in time, the selection of foraging patches byrabbits and the seasonal aspect of these topics. When this kind of research could beexecuted in a standardized way along a gradient of productivity, predictive models about theeffect of productivity on grazer interactions might become possible.Further experimental research is necessary to understand causal relationships thatare operating in the herbivore assemblage of the wild rabbit and large grazers. Especially,more attention should be given to the ability of rabbits to cope with a less or more complexvegetation structure, and their reaction to different degrees of perceived vegetation risk.These topics should be tested separately and under circumstances where there is novariation in food quality and sward height. Afterwards, incorporation of distance from thecentral place (burrow) in these kinds of experiments would add extra value.Finally, combining these field data collected along a productivity gradient withexperimental data unravelling causal relationships could lead to a coherent model aboutfeeding facilitation and other types of facilitation in this grazer assemblage. Knowledge aboutthe true nature of the interactions between rabbits and large herbivores could then be aninteresting starting point for a global theory about feeding facilitation in herbivoreassemblages in temperate grassland areas.ReferencesARSENAULT, R. & N. OWEN-SMITH (2002). Facilitation versus competition in grazing herbivoreassemblages. Oikos 97: 313-318.BAKKER, E.S. (2003). Herbivores as mediators of their environment. The impact of large and smallGeneral discussion 163
species on vegetation dynamics. <strong>PhD</strong> dissertation, Wageningen <strong>Universiteit</strong>, Wageningen, theNetherlands.BAKKER, E.S., H. OLFF & J.M. GLEICHMAN (<strong>2009</strong>). Contrasting effects of large herbivore grazing on smallerherbivores. Basic and Applied <strong>Ecology</strong> 10: 141-150.BAKKER, E.S., R.C. REIFFERS, H. OLFF & J.M. GLEICHMAN (2005). Experimental manipulation of predationrisk and food quality: effect on grazing behaviour in a central-place foraging herbivore.Oecologia 146: 157-167.BALL, J.P., K. DANELL & P. SUNESSON (2000). Response of a herbivore community to increased foodquality and quantity: an experiment with nitrogen fertilizer in a boreal forest. Journal of Applied<strong>Ecology</strong> 37: 247-255.BELSKY, A.J. (1986). Does herbivory benefit plants? A review of the evidence. The American Naturalist127: 870-892.BOS, D., J. VAN DE KOPPEL, & F.J. WEISSING (2002). Brent Geese aggregate to cope with increased levelsof primary production. In BOS, D., Grazing in coastal grasslands, Brent Geese and facilitation byherbivory, <strong>PhD</strong> dissertation, Rijksuniversiteit Groningen, Groningen, the Netherlands: 85-106.CHENG, E. & M.E. RITCHIE (2006). Impacts of simulated livestock grazing on Utah prairie dogs (Cynomysparvidens) in a low productivity ecosystem. Oecologia 147: 546-555.COPPOCK, D.L., J.K. DETLING, J.E. ELLIS & M.I. DYER (1983). Plant-herbivore interactions in a North-American mixed-grass prairie. I. Effects of black-tailed prairie dogs on intraseasonalaboveground plant biomass and nutrient dynamics and plant species diversity. Oecologia 56: 1-9.DEKKER, J.J.A. & F. VAN LANGEVELDE (2007). Plant productivity and free-ranging herbivores impact spatialforaging patterns and population dynamics of refuge-living herbivores. In: DEKKER, J.J.A.,Rabbits, refuges and resources. How foraging of herbivores is affected by living in burrows. <strong>PhD</strong>dissertation, Wageningen <strong>Universiteit</strong>, Wageningen, the Netherlands: 65-84.DEKKER, J.J.A. (2007). Rabbits, refuges and resources. How foraging of herbivores is affected by livingin burrows. <strong>PhD</strong> dissertation, Wageningen <strong>Universiteit</strong>, Wageningen, the Netherlands.DEKKER, J.J.A., M.L.W.J. BROEKHUIJSE, W.F. DE BOER, F. VAN LANGEVELDE, S.E. VAN WIEREN & H.H.T. PRINS(2007). Grazing gradients around refuges of small herbivores are caused by spatial variation invigilance. In: DEKKER, J.J.A., Rabbits, refuges and resources. How foraging of herbivores isaffected by living in burrows. <strong>PhD</strong> dissertation, Wageningen <strong>Universiteit</strong>, Wageningen, theNetherlands: 19-31.DEMMENT, M.W. & P.J. VAN SOEST (1985). A nutritional explanation for body-size patterns of ruminantand nonruminant herbivores. The American Naturalist 125: 641-672.DREES, M. (1989). Konijnen als grazers. Duin 12: 156-158.DREES, M. (1998). Langoor. Over konijnen en vegetatie in de duinen. Duin 21: 4-6.DRESCHER, M., I.M.A. HEITKÖNIG, J.G. RAATS & H.H.T. PRINS (2006). The role of grass stems as structuralforaging deterrents and their effects on the foraging behaviour of cattle. Applied Animal164 Chapter 7
Behaviour Science 101: 10-26.DURANT, D., H. FRITZ, S. BLAIS & P. DUNCAN (2003). The functional response in three species ofherbivorous Anatidae: effects of sward height, body mass and bill size. Journal of Animal<strong>Ecology</strong> 72: 220-231.FOX, A.D., J.N. KRISTIANSEN, D.A. STROUD & H. BOYD (1998). The effect of simulated spring goosegrazing on the growth rate and protein content of Phleum pratense leaves. Oecologia 116: 154-159.GROSS, J.E., L.A. SHIPLEY, N.T. HOBBS, D.E. SPALINGER & B.A. WUNDER (1993). Functional response ofherbivores in food-concentrated patches: tests of a mechanistic model. <strong>Ecology</strong> 74: 778-791.HOLLING, C.S. (1959). Some characteristics of simple types of predation and parasitism. CanadianEntomologist 91: 385-398.IASON, G.R., T. MANSO, D.A. SIM & F.G. HARTLEY (2002). The functional response does not predict thelocal distribution of European Rabbits (Oryctolagus cuniculus) on grass swards: experimentalevidence. Functional <strong>Ecology</strong> 16: 394-402.JOHNSON, D.H. (1980). The comparison of usage and availability measurements for evaluating resourcepreference. <strong>Ecology</strong> 61: 65-71.KUIJPER, D.P.J., D.J. NIJHOFF & J.P. BAKKER (2004). Herbivory and competition slow down invasion of atall grass along a productivity gradient. Oecologia 141: 452-459.KUIJPER, D.P.J., P. BEEK, S.E. VAN WIEREN & J.P. BAKKER (2008). Time-scale effects in the interactionbetween a large and a small herbivore. Basic and Applied <strong>Ecology</strong> 9: 126-134.LOCKLEY, R.M. (1976). The private life of the rabbit. Het Spectrum, Utrecht.LUNDBERG, P. & M. ASTRÖM (1990). Functional response of optimally foraging herbivores. Journal ofTheoretical Biology 144: 367-377.LUNDBERG, P. (1988). Functional response of a small mammalian herbivore: the disc equation revisited.Journal of Animal <strong>Ecology</strong> 57: 999-1006.MCNAUGHTON, S.J. (1983). Compensatory plant growth as a response to herbivory. Oikos 40: 329-336.MCNAUGHTON, S.J. (1984). Grazing lawns: animals in herds, plant form and co-evolution. The AmericanNaturalist 124: 863-886.MILCHUNAS, D.G., A.S. VARNAMKHASTI, W.K. LAUENROTH & H. GOETZ (1995). Forage quality in relation tolong-term grazing history, current-year defoliation, and water resource. Oecologia 101: 366-374.OKSANEN, L., S.D. FRETWELL, J. ARRUDA & P. NIEMELÄ (1981). Exploitation ecosystems in gradients ofprimary productivity. The American Naturalist 118: 240-261.OLFF, H., M.E. RITCHIE & H.H.T. PRINS (2002). Global environmental controls of diversity in largeherbivores. Nature 415: 901-904.OOSTERVELD, P. (1983). Eight years of monitoring of rabbits and vegetation development onabandoned arable fields grazed by ponies. Acta Zoologica Fennica 174: 71-74.PROVOOST, S. (2005). Flora en vegetatieveranderingen in permanente kwadraten in De Westhoek enGeneral discussion 165
Houtsaegerduinen. In HOFFMANN, M., D. BONTE, E. COSYNS, P. CRIEL, J.-P. MAELFAIT, S. PROVOOST,N. SOMERS & T. STRUYVE, Evaluatie Begrazing Kustduinen, 1997-2004. Onderzoek en evaluatievan de biologische gevolgen van acht jaar begrazing in de Vlaamse Westkustreservaten, <strong>Ghent</strong>,<strong>Ghent</strong> University and Brussels, Institute of Nature Conservation, under the authority of AMINAL,Dept. Nature: 157-212.RUESS, R.W. (1984). Nutrient movement and grazing: experimental effects of clipping and nitrogensource on nutrient uptake in Kyllinga nervosa. Oikos 43: 183-188.TAHMASEBI KOHYANI, P., B. BOSSUYT, D. BONTE & M. HOFFMANN (submitted). Plant performance plasticity asa mechanism of grazing tolerance.VAN DE KOPPEL, J., J. HUISMAN, R. VAN DER WAL & H. OLFF (1996). Patterns of herbivory along aproductivity gradient: an empirical and theoretical investigation. <strong>Ecology</strong> 77: 736-745.VAN DER GRAAF, A.J., J. STAHL & J.P. BAKKER (2005). Compensatory plant growth of Festuca rubra aftergrazing: can migratory herbivores increase their own harvest during staging? Functional <strong>Ecology</strong>19: 961-969.VAN LANGEVELDE, F., M. DRESCHER, I.M.A. HEITKÖNIG & H.H.T. PRINS (2008). Instantaneous intake rate ofherbivores as function of forage quality and mass: effects on facilitative and competitiveinteractions. Ecological Modelling 213: 273-284.WALLAGE-DREES, M.B. (1982) Konijnen als duinbeheerders. Duin 5: 7-11.WILLIAMS, O.B., T.C.E. WELLS & D.A. WELLS (1974). Grazing management of Woodwalton fen: seasonalchanges in the diet of cattle and rabbits. Journal of Applied <strong>Ecology</strong> 11: 499-516.WILMSHURST, J.F., FRYXELL, J.M. & BERGMAN, C.M. (2000). The allometry of patch selection in ruminants.Proceedings of the Royal Society of London, Series B 267: 345-349.166 Chapter 7
General discussion 167
168
SummaryThis thesis focuses on the positive interaction ‘feeding facilitation’ which is predictedto occur in assemblages of large and small(er) herbivore species. The main hypothesis of theresearch is that introduced large herbivores facilitate rabbits (medium-sized herbivores) bymodification of the vegetation. This modification involves creating short swards, creatingdenser (more productive) swards, creating swards that have a high food quality for rabbitsand influencing vegetation composition. We expect that these modifications are notcompletely independent from each other: shorter swards are expected to have a higher foodquality and to be more productive. Although several hypotheses about the causes andmechanisms of feeding facilitation can be mentioned, it is generally supposed that the highquality of swards previously grazed by large herbivores (‘grazing lawns’) attract mediumsizedherbivores. These medium-sized herbivores would prefer the grazing lawns because oftheir need for high quality forage. This main hypothesis was tested during this research, withas model system: the wild rabbit (Oryctolagus cuniculus L.) and large grazers introduced incoastal dune grasslands. By conducting field observation, semi-controlled field experimentsup to entirely controlled feeding experiments, we tried to test several aspects of the mainhypothesis.In Chapter 2, we focus on modification of vegetation structure and composition bygrazing and digging effects of rabbits, when in combination with large herbivores. Anexclosure experiment was carried out to measure the effect of rabbits and the combinationof large herbivores and rabbits on vegetation structure and composition in two differentcoastal dune areas. In all cases, the combination of rabbits and large grazers as well asrabbits without large grazers were able to reduce vegetation height and litter cover.Additionally, rabbits created bare soil patches, giving extra structural diversity. Throughthese structural impacts, grazer activity maintained plant species diversity in only one of thestudy areas. The effect of rabbits on vegetation was smaller than the combined effect ofrabbits and large grazers.In Chapter 3, we tested whether the wild rabbit is foraging according to a unimodalfunctional response curve, which means that they would prefer a short to intermediatevegetation height for foraging rather than a high vegetation where food availability is higher.By performing two different studies in two study areas, we tested whether rabbits indeedprefer to graze in shorter vegetation, by comparing rabbit activity in short (grazed or mown)and ungrazed vegetation. Mown vegetation in the most productive grassland site proved toSummary 169
e preferred by the animals, as indicated by an experimental set-up. There were noindications that this was due to a difference in forage quality. In a more complex, naturalsituation, rabbits were not facilitated by large grazers: they did not prefer to graze in theshorter vegetation. We suggest that experimental studies might reveal phenomena that aremasked under more complex field conditions, for instance due to variation in productivity ofthe grassland or the occurrence of self-facilitation.In Chapter 4, it was tested whether rabbits are able to discriminate between plants ofdifferent nutritional value and whether they prefer the most nutritious. A feeding trial inwhich rabbits were offered two different types of grasses (fertilised and unfertilised) wasexecuted under experimental conditions. The rabbits preferred the grasses with the highestprotein percentage, when conditions were controlled for sward height/plant biomass. Thisobservation is equivalent to results obtained in geese and provides experimental evidenceabout the capability of rabbits to select for plants with the highest nutritional quality.Chapter 5 is a methodological study on microhistological faecal analysis.Microhistological faecal analysis is a widely used method in which the diet of the herbivore isqualified and quantified by identifying plant epidermal fragments which can be found in thepellets of this animal. A clear consensus on the accuracy of this technique is lacking. So weperformed a feeding trial with rabbits to compare the known diet with the results obtainedby faecal analysis. The main goal of the study was to find out whether the diet compositioncan be reliably derived from faecal analysis (despite problems of differential digestion). It isconcluded that only the composition of grass diets can be estimated from pellet analyses,due to a higher digestion intensity of forbs. We recommend the identification of 150epidermal fragments and quantification by area measurements.In Chapter 6, we studied diet selection of rabbits at the plant species level: little isknown about plant species selection in the field, the seasonal pattern of this selection, andthe mechanisms of this possible selection. Therefore, we studied the diet composition of wildrabbits in an acid dune grassland, and compared it to the availability of food throughout thedifferent seasons of the year. Rabbits proved to select indeed their food items: they do notjust eat according to forage availability, and seasonality does influence the results. Plantquality did not prove to be the main trigger to select for certain species in field conditions.Although it has been proven that rabbits are able to select for the better quality of forage atthe monospecific plant patch level, this study indicates that other triggers are at least equallyimportant in determining the diet selection at the plant species level.Finally, Chapter 7 synthesizes the results of the previous chapters. The results arecommented within the framework of feeding facilitation. Vegetation structure was shown to170 Summary
e influenced by large herbivores: grazing results in short swards. These swards were notdenser (which would be expected if overcompensation would occur). It was experimentallyproven that wild rabbits prefer those short swards, although field observations showed thatthis is not the case in all study areas. The short swards created by large grazers did not havea higher nutritional quality than ungrazed swards. Rabbits are sensitive to food quality andprefer patches with high quality forage. Nevertheless, this was not related to sward height:the preference of rabbits for short swards is not necessarily related to forage quality issues.Also, we showed that rabbits in our study areas are not able to facilitate themselves. Longterm feeding facilitation (by altering plant species composition of the vegetation) was notpresent yet, but could be possible in the long term. From all these results, we conclude thatthe main hypothesis could not be affirmed, although some causal mechanisms of feedingfacilitation have been affirmed. We suggest that feeding facilitation is not necessarily absent,but is hard to detect or is not present under particular conditions. Experimental research isneeded for further unravelling causal mechanisms about feeding facilitation and alternativeapproaches, while field observations remain necessary to gain insight into other variables(e.g. habitat productivity, predators, food accessibility, seasonality) that may shift thebalance between the occurrence and absence of feeding facilitation.Summary 171
172
SamenvattingHet centrale thema van dit proefschrift is ‘voedselfacilitatie’, een positieve interactiedie kan optreden in gemeenschappen van grote en kleinere herbivoren. Onzehoofdhypothese stelt dat grote grazers de vegetatie wijzigen op een zodanige manier datmiddelgrote herbivoren erdoor aangetrokken worden. Mogelijke wijzigingen aan de vegetatiezijn: het korter maken van de vegetatiehoogte, het kwalitatief (op vlak van nutriënten) betermaken van de vegetatie, de densiteit van de vegetatie verhogen en de soortensamenstellingvan de vegetatie beïnvloeden. We verwachten dat de verschillende wijzigingen aan devegetatie niet onafhankelijk zijn van elkaar: kortere graszoden zouden een hogerevoedingswaarde en een hogere productiviteit hebben. De middelgrote herbivoren zouden dekorte graszoden verkiezen omdat ze een grote behoefte hebben aan hoogkwalitatief voedsel.De hoofdhypothese werd getest tijdens ons onderzoek in een modelsysteem van konijnen(Oryctolagus cuniculus L.) en grote grazers die geïntroduceerd werden in enkelekustduingraslanden. We combineerden veldobservaties, halfgecontroleerdeveldexperimenten en volledig gecontroleerd experimenteel onderzoek om de verschillendeaspecten van onze hoofdhypothese te testen.In Hoofdstuk 2 onderzochten we de effecten van konijnen en de combinatie vankonijnen en grote grazers op vegetatiestructuur en vegetatiesamenstelling in twee sterkverschillende duingraslanden. Zowel konijnen alleen als de combinatie van konijnen en grotegrazers reduceerden de hoogte van de vegetatie en verhoogden strooiselbedekking.Bovendien zorgden de konijnen door hun graafactiviteit voor naakte bodem. Dit gaf extrastructurele diversiteit. Ten gevolge van hun structurele effecten waren de herbivoren indirectin staat om de plantendiversiteit te behouden, hoewel dit slechts in één van de tweegebieden het geval was. Het gecombineerde effect van grote grazers en konijnen bleekgroter te zijn dan het effect van konijnen alleen.In Hoofdstuk 3 gingen we na of het graasgedrag van konijnen beantwoordt aan eenunimodale functionele responscurve. Dit betekent dat konijnen een korte tot middelmatigevegetatiehoogte zouden verkiezen bij het foerageren, in plaats van een hoge vegetatiewaarin de totale voedselbeschikbaarheid hoger is. We voerden twee onderzoeken uit waarinhet gebruik van korte (begraasde of gemaaide) vegetatie door konijnen werd vergelekenmet het gebruik van onbegraasde vegetatie. De experimentele opzet in het meestproductieve studiegebied wees op een voorkeur voor gemaaide vegetatie. Er waren geenredenen om aan te nemen dat voedselkwaliteit hierbij een rol speelde. In een meerSamenvatting 173
complexe veldsituatie bleken konijnen niet bij voorkeur te grazen in een door groteherbivoren begraasde vegetatie. Fenomenen die duidelijk zijn onder experimenteleomstandigheden worden mogelijks verdoezeld in meer complexe veldsituaties, waarinbijvoorbeeld ook productiviteit of zelffacilitatie de situatie kunnen beïnvloeden.In Hoofdstuk 4 hebben we getest of konijnen onderscheid maken tussen planten vanverschillende kwaliteit en of ze bij het foerageren de meest voedzame planten verkiezen. Ditwerd getest in een zuiver experimentele opzet waarbij konijnen bemeste en onbemestegrassen (eenzelfde soort) aangeboden kregen. De konijnen hadden een voorkeur voor demeest voedzame planten, met het hoogste eiwitgehalte, in omstandigheden waarbijzodehoogte of voedselbiomassa geen rol konden spelen.Hoofdstuk 5 is een methodologische studie over het gebruik van fecesanalyse voorhet bepalen van de dieetsamenstelling van wilde herbivoren. Epidermisfragmenten,afkomstig van geconsumeerde planten, die aangetroffen worden in feces wordengeïdentificeerd en gekwantificeerd. Er bestaan een aantal onzekerheden over de juistheidvan deze methode. Daarom voerden we een voederexperiment uit, waarbij het gevoederde(en dus gekende) dieet van een aantal konijnen vergeleken werd met de resultaten van deanalyse van hun keutels. We zochten uit of er een goede overeenkomst was. Dit bleek enkelhet geval te zijn voor een dieet dat enkel uit grassen bestaat (ten gevolge van het feit datgrassen minder goed verteren dan kruiden). Het is aan te raden om een 150-tal fragmentente bekijken per keutelstaal en kwantificatie door oppervlakteschattingen vanepidermisfragmenten geeft een beter resultaat dan tellingen van fragmenten.In Hoofdstuk 6 werd voedselkeuze door wilde konijnen bekeken op het niveau vanplantensoorten. De kennis over hun preferenties voor plantensoorten in veldsituaties isimmers beperkt, evenals de kennis over seizoenale patronen van en redenen voor dezeselectie. In een zuur duingrasland vergeleken we de dieetsamenstelling van het konijn metde voedselbeschikbaarheid in dit gebied gedurende de vier seizoenen van het jaar. Konijnenbleken inderdaad selectief te zijn in hun voedselkeuze: ze eten niet zomaar wat beschikbaaris. Seizoenaliteit heeft een invloed op de resultaten, maar plantenkwaliteit bleek niet relevantin dit opzicht. Uit dit onderzoek blijkt dat selectie van voedselplanten niet volgens dezelfdecriteria gebeurt als voedselkeuze op andere niveaus.Het laatste hoofdstuk, Hoofdstuk 7, synthetiseert de resultaten van de voorgaandehoofdstukken en kadert ze binnen de theorie over voedselfacilitatie. We toonden datvegetatiestructuur beïnvloed wordt door grote grazers (verminderen van vegetatiehoogte).Er trad echter geen overcompensatie via extra groei op in deze zodes. Konijnen bleken eenvoorkeur te hebben voor dergelijke korte graszoden in experimentele omstandigheden, maar174 Samenvatting
veldobservaties bevestigden dit beeld niet. De voedselkwaliteit van begraasde vegetatiebleek in veldomstandigheden niet beter te zijn dan die van onbegraasde vegetatie. Konijnenbleken wel gevoelig te zijn voor zoden met een hogere voedselkwaliteit, maar desondanksbleek deze eigenschap niet de reden te zijn waarom korte vegetatie verkozen wordt. Ookbleek dat de invloed van konijnen op vegetatie te beperkt is om zichzelf te faciliteren.Tenslotte was facilitatie op lange termijn (bij veranderende soortensamenstelling van devegetatie) niet aanwezig, maar er is wel een mogelijkheid dat dit op langere termijn wel zaloptreden. Wanneer we al deze resultaten gezamenlijk overschouwen, blijkt dat we onzehoofdhypothese niet konden bevestigen. Wél konden we een aantal onderliggendeoorzakelijke mechanismen van voedselfacilitatie bevestigen. Het is dus niet noodzakelijk zodat voedselfacilitatie niet bestaat: misschien is het gewoon moeilijk te detecteren of is hetniet aanwezig in de omstandigheden waaronder wij gewerkt hebben. Verder experimenteelonderzoek kan nog meer informatie opleveren over de mechanismen van voedselfacilitiatieen alternatieve verklaringen voor facilitatie. Daarnaast blijven veldstudies echter noodzakelijkom inzicht te krijgen in andere variabelen (bijvoorbeeld productiviteit van het habitat,predatoren, voedseltoegankelijkheid, seizoenaliteit) die uiteindelijk zullen bepalen ofvoedselfacilitatie al of niet aanwezig is of kan zijn in bepaalde grazergemeenschappen.Samenvatting 175
I SBN 9 7 8 - 9 0 - 8 7 5 6 - 0 1 0 - 29 7 8 9 0 8 7 5 6 0 1 0 2