Clock - Uranium Supply Crunch and Critical ... - Andrew Johns
Clock - Uranium Supply Crunch and Critical ... - Andrew Johns Clock - Uranium Supply Crunch and Critical ... - Andrew Johns
Canada Research | Page 60 of 87UraniumUranium One Inc. July 26, 2012UUU-TSX | UUU-JSEDavid Sadowski | 604.659.8255 | david.sadowski@raymondjames.caMining | UraniumLow Cost Production Growth... with Some Uncertainty in AfricaEventWe are resuming research coverage of Uranium One Inc. with a $3.60 targetand an Outperform rating.RecommendationWe recommend Uranium One on its low-cost production growth, best-in-classspot price exposure, and attractive valuation. Uranium One’s balance sheet issolid, but could weaken if the remaining 86% of Mantra is purchased in June 2013.AnalysisFast Growing and Low Costs. Uranium One produced 10.7 Mlbs in 2011A atUS$14/lb cash costs, up from just 3.6 Mlbs in 2009A. We see this growthcontinuing on the back of the company’s Kazakh-dominated ISL portfolio. Weproject 15.1 Mlbs output in 2015E, while average costs remain near industrylows at US$20/lb.Highest Exposure to Spot. Uranium One has the highest spot price exposureamongst our producers given 90% – 95% of contracts reference market-relatedpricing. Since January 2008, the company’s share price has traded at a 78%correlation with spot prices (above Cameco and Paladin at 56% and 44%,respectively). Our NAVPS jumps ~C$1/share for every 10% increase in uraniumprices above our price deck.Mkuju River – Worth it? A critical question for Uranium One is whether toproceed with acquiring the remaining 86.1% of Mantra Resources (and its MkujuRiver in Tanzania) from ARMZ. We view the acquisition as costly, with a ~US$0.9bln price tag and US$650 mln in capex (RJL estimates), as well as beinggeopolitically and operationally uncertain. If we assume Uranium One passes onthe deal, our modeled NAVPS would be 21% higher at C$4.14. Recall, thecompany has until June 2013 to exercise its call option to buy the remainder, andARMZ has a put option to sell the remainder on the deadline. In either case,minority shareholder approval is required to complete the deal. A DefinitiveFeasibility Study (DFS) is expected in 3Q12E.Balance Sheet, Funding Needs. Exit 1Q12A cash was US$512 mln and debt wasUS$850 mln. To fund the completion of the Mantra deal and initial Mkujudevelopment, we model a notional US$410 mln debt issue in 2Q13E(potentially as ruble bonds). This issue would bring total debt to US$1.1 bln.ValuationOur $3.60 target is based on a 50/50 weighting of (i) a 1.0x P/NAV applied toour C$3.43 NAVPS (8%) and (ii) a 10x P/CF applied to our C$0.35 2013E CFPS.Please see our Valuation & Recommendation section for further details.EPS 1Q 2Q 3Q 4Q Full Revenue NAVPSMar Jun Sep Dec Year (mln)2011A US$0.02 US$0.03 US$0.05 US$0.02 US$0.11 US$530Old 2012E 0.02A NA NA NA NA NA NANew 2012E 0.02A 0.01 0.05 0.06 0.13 589 3.43Old 2013E NA NA NA NA NA NA NANew 2013E 0.03 0.04 0.04 0.06 0.17 791 NASource: Raymond James Ltd., Thomson OneCompany ReportRating & TargetOutperform 2Target Price (6-12 mos): Old: UR New: C$3.60Current Price ( Jul-18-12 )C$2.46Total Return to Target 46%52-Week RangeC$3.82 - C$1.85Market DataMarket Capitalization (mln)C$2,355Current Net Debt (mln)US$338Enterprise Value (mln)C$2,702Shares Outstanding (mln, basic) 957.210 Day Avg Daily Volume (000s) 906Dividend/Yieldnm/nmKey Financial Metrics2011A 2012E 2013EP/E22.1x 19.0x 14.5xP/NAV0.7x NACFPSOld US$0.18 NA NANew US$0.18 US$0.32 US$0.35Working Capital (mln)Old US$714.9 NA NANew US$714.9 US$665.8 US$358.8Capex (mln)Old US$(151.9) NA NANew US$(151.9) US$(206.7) US$(154.7)Long Term Debt (mln)Old US$758.3 NA NANew US$758.3 US$850.4 US$1,260.4Production (Mlbs)Old 10.7 NA NANew 10.7 11.6 12.9Cash Costs (US$/lb)Old US$14.5 NA NANew US$14.5 US$16.9 US$19.5Company DescriptionUranium One is one of the largest uranium producersin the world, with plans for aggressive growth at itsmines in Kazakhstan, the United States and Australia.Raymond James Ltd. | 2200 – 925 West Georgia Street | Vancouver BC Canada V6C 3L2
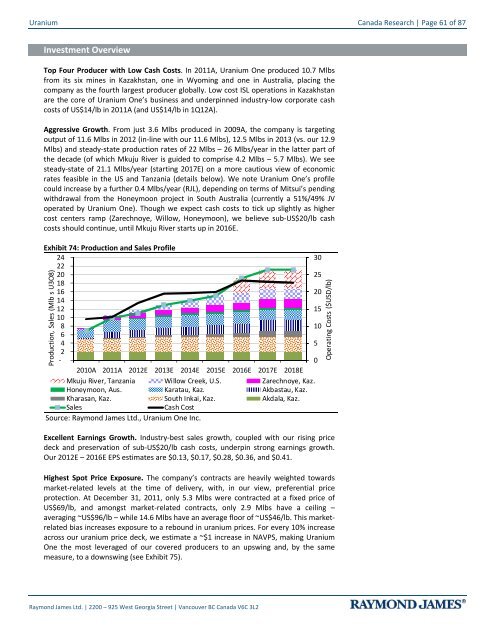
Uranium Canada Research | Page 61 of 87Investment OverviewTop Four Producer with Low Cash Costs. In 2011A, Uranium One produced 10.7 Mlbsfrom its six mines in Kazakhstan, one in Wyoming and one in Australia, placing thecompany as the fourth largest producer globally. Low cost ISL operations in Kazakhstanare the core of Uranium One’s business and underpinned industry-low corporate cashcosts of US$14/lb in 2011A (and US$14/lb in 1Q12A).Aggressive Growth. From just 3.6 Mlbs produced in 2009A, the company is targetingoutput of 11.6 Mlbs in 2012 (in-line with our 11.6 Mlbs), 12.5 Mlbs in 2013 (vs. our 12.9Mlbs) and steady-state production rates of 22 Mlbs – 26 Mlbs/year in the latter part ofthe decade (of which Mkuju River is guided to comprise 4.2 Mlbs – 5.7 Mlbs). We seesteady-state of 21.1 Mlbs/year (starting 2017E) on a more cautious view of economicrates feasible in the US and Tanzania (details below). We note Uranium One’s profilecould increase by a further 0.4 Mlbs/year (RJL), depending on terms of Mitsui’s pendingwithdrawal from the Honeymoon project in South Australia (currently a 51%/49% JVoperated by Uranium One). Though we expect cash costs to tick up slightly as highercost centers ramp (Zarechnoye, Willow, Honeymoon), we believe sub-US$20/lb cashcosts should continue, until Mkuju River starts up in 2016E.Exhibit 74: Production and Sales Profile2430222025181620141215108106452-02010A 2011A 2012E 2013E 2014E 2015E 2016E 2017E 2018EMkuju River, Tanzania Willow Creek, U.S. Zarechnoye, Kaz.Honeymoon, Aus. Karatau, Kaz. Akbastau, Kaz.Kharasan, Kaz. South Inkai, Kaz. Akdala, Kaz.SalesCash CostSource: Raymond James Ltd., Uranium One Inc.Production, Sales (Mlb s U3O8)Excellent Earnings Growth. Industry-best sales growth, coupled with our rising pricedeck and preservation of sub-US$20/lb cash costs, underpin strong earnings growth.Our 2012E – 2016E EPS estimates are $0.13, $0.17, $0.28, $0.36, and $0.41.Highest Spot Price Exposure. The company’s contracts are heavily weighted towardsmarket-related levels at the time of delivery, with, in our view, preferential priceprotection. At December 31, 2011, only 5.3 Mlbs were contracted at a fixed price ofUS$69/lb, and amongst market-related contracts, only 2.9 Mlbs have a ceiling –averaging ~US$96/lb – while 14.6 Mlbs have an average floor of ~US$46/lb. This marketrelatedbias increases exposure to a rebound in uranium prices. For every 10% increaseacross our uranium price deck, we estimate a ~$1 increase in NAVPS, making UraniumOne the most leveraged of our covered producers to an upswing and, by the samemeasure, to a downswing (see Exhibit 75).Operating Costs ($USD/lb)Raymond James Ltd. | 2200 – 925 West Georgia Street | Vancouver BC Canada V6C 3L2
- Page 9 and 10: Uranium Canada Research | Page 9 of
- Page 11 and 12: Uranium Canada Research | Page 11 o
- Page 13 and 14: Uranium Canada Research | Page 13 o
- Page 15 and 16: Uranium Canada Research | Page 15 o
- Page 17 and 18: Uranium Canada Research | Page 17 o
- Page 19 and 20: Uranium Canada Research | Page 19 o
- Page 21 and 22: Uranium Canada Research | Page 21 o
- Page 24 and 25: Canada Research | Page 24 of 87Uran
- Page 26: Canada Research | Page 26 of 87Uran
- Page 30 and 31: Canada Research | Page 30 of 87Uran
- Page 32 and 33: Canada Research | Page 32 of 87Uran
- Page 34 and 35: Canada Research | Page 34 of 87Uran
- Page 36 and 37: Canada Research | Page 36 of 87Uran
- Page 38 and 39: Canada Research | Page 38 of 87Uran
- Page 40 and 41: Canada Research | Page 40 of 87Uran
- Page 42 and 43: Canada Research | Page 42 of 87Uran
- Page 44 and 45: Canada Research | Page 44 of 87Uran
- Page 46 and 47: Canada Research | Page 46 of 87Uran
- Page 48 and 49: Canada Research | Page 48 of 87Uran
- Page 50 and 51: Canada Research | Page 50 of 87Uran
- Page 52 and 53: Canada Research | Page 52 of 87Uran
- Page 54 and 55: Canada Research | Page 54 of 87Uran
- Page 56 and 57: Canada Research | Page 56 of 87Uran
- Page 58 and 59: Canada Research | Page 58 of 87Uran
- Page 62 and 63: Canada Research | Page 62 of 87Uran
- Page 64 and 65: Canada Research | Page 64 of 87Uran
- Page 66 and 67: Canada Research | Page 66 of 87Uran
- Page 68 and 69: Canada Research | Page 68 of 87Uran
- Page 70 and 71: Canada Research | Page 70 of 87Uran
- Page 72 and 73: Canada Research | Page 72 of 87Uran
- Page 74 and 75: Canada Research | Page 74 of 87Uran
- Page 76 and 77: Canada Research | Page 76 of 87Uran
- Page 78 and 79: Canada Research | Page 78 of 87Uran
- Page 80 and 81: Canada Research | Page 80 of 87Uran
- Page 82 and 83: Canada Research | Page 82 of 87Uran
- Page 84 and 85: Canada Research | Page 84 of 87Uran
- Page 86 and 87: Canada Research | Page 86 of 87Uran
<strong>Uranium</strong> Canada Research | Page 61 of 87Investment OverviewTop Four Producer with Low Cash Costs. In 2011A, <strong>Uranium</strong> One produced 10.7 Mlbsfrom its six mines in Kazakhstan, one in Wyoming <strong>and</strong> one in Australia, placing thecompany as the fourth largest producer globally. Low cost ISL operations in Kazakhstanare the core of <strong>Uranium</strong> One’s business <strong>and</strong> underpinned industry-low corporate cashcosts of US$14/lb in 2011A (<strong>and</strong> US$14/lb in 1Q12A).Aggressive Growth. From just 3.6 Mlbs produced in 2009A, the company is targetingoutput of 11.6 Mlbs in 2012 (in-line with our 11.6 Mlbs), 12.5 Mlbs in 2013 (vs. our 12.9Mlbs) <strong>and</strong> steady-state production rates of 22 Mlbs – 26 Mlbs/year in the latter part ofthe decade (of which Mkuju River is guided to comprise 4.2 Mlbs – 5.7 Mlbs). We seesteady-state of 21.1 Mlbs/year (starting 2017E) on a more cautious view of economicrates feasible in the US <strong>and</strong> Tanzania (details below). We note <strong>Uranium</strong> One’s profilecould increase by a further 0.4 Mlbs/year (RJL), depending on terms of Mitsui’s pendingwithdrawal from the Honeymoon project in South Australia (currently a 51%/49% JVoperated by <strong>Uranium</strong> One). Though we expect cash costs to tick up slightly as highercost centers ramp (Zarechnoye, Willow, Honeymoon), we believe sub-US$20/lb cashcosts should continue, until Mkuju River starts up in 2016E.Exhibit 74: Production <strong>and</strong> Sales Profile2430222025181620141215108106452-02010A 2011A 2012E 2013E 2014E 2015E 2016E 2017E 2018EMkuju River, Tanzania Willow Creek, U.S. Zarechnoye, Kaz.Honeymoon, Aus. Karatau, Kaz. Akbastau, Kaz.Kharasan, Kaz. South Inkai, Kaz. Akdala, Kaz.SalesCash CostSource: Raymond James Ltd., <strong>Uranium</strong> One Inc.Production, Sales (Mlb s U3O8)Excellent Earnings Growth. Industry-best sales growth, coupled with our rising pricedeck <strong>and</strong> preservation of sub-US$20/lb cash costs, underpin strong earnings growth.Our 2012E – 2016E EPS estimates are $0.13, $0.17, $0.28, $0.36, <strong>and</strong> $0.41.Highest Spot Price Exposure. The company’s contracts are heavily weighted towardsmarket-related levels at the time of delivery, with, in our view, preferential priceprotection. At December 31, 2011, only 5.3 Mlbs were contracted at a fixed price ofUS$69/lb, <strong>and</strong> amongst market-related contracts, only 2.9 Mlbs have a ceiling –averaging ~US$96/lb – while 14.6 Mlbs have an average floor of ~US$46/lb. This marketrelatedbias increases exposure to a rebound in uranium prices. For every 10% increaseacross our uranium price deck, we estimate a ~$1 increase in NAVPS, making <strong>Uranium</strong>One the most leveraged of our covered producers to an upswing <strong>and</strong>, by the samemeasure, to a downswing (see Exhibit 75).Operating Costs ($USD/lb)Raymond James Ltd. | 2200 – 925 West Georgia Street | Vancouver BC Canada V6C 3L2


