

Clock - Uranium Supply Crunch and Critical ... - Andrew Johns
Clock - Uranium Supply Crunch and Critical ... - Andrew Johns
Clock - Uranium Supply Crunch and Critical ... - Andrew Johns
- No tags were found...

Create successful ePaper yourself
Turn your PDF publications into a flip-book with our unique Google optimized e-Paper software.
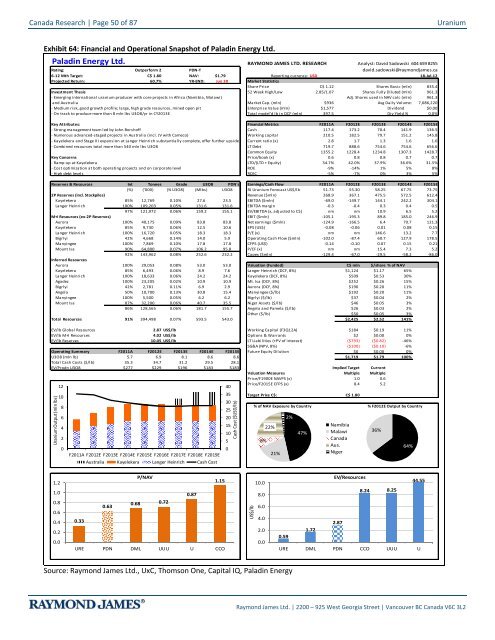
Canada Research | Page 50 of 87<strong>Uranium</strong>Exhibit 64: Financial <strong>and</strong> Operational Snapshot of Paladin Energy Ltd.Paladin Energy Ltd.RAYMOND JAMES LTD. RESEARCH Analyst: David Sadowski 604 659 8255Rating: Outperform 2 PDN-T david.sadowski@raymondjames.ca6-12 Mth Target: C$ 1.80 NAV: $1.79 Reporting currency: USD 18-Jul-12Projected Return: 60.7% YR-END: Jun 30 Market StatisticsShare Price C$ 1.12 Shares Basic (mln) 835.4Investment Thesis 52 Week High/Low 2.85/1.07 Shares Fully Diluted (mln) 961.3- Emerging international uranium producer with core projects in Africa (Namibia, Malawi) Adj. Shares used in NAV calc (mln) 961.3<strong>and</strong> Australia Market Cap. (mln) $936 Avg Daily Volume: 7,086,220- Medium risk, good growth profile; large, high grade resources, mined open pit Enterprise Value (mln) $1,577 Dividend $0.00- On track to produce more than 8 mln lbs U3O8/yr in CY2013E Total model'd lb in DCF (mln) 397.5 Div Yield % 0.0%Key Attributes: Financial Metrics F2011A F2012E F2013E F2014E F2015E- Strong management team led by John Borshoff Cash 117.4 173.2 70.4 141.9 136.5- Numerous advanced-staged projects in Australia (incl. JV with Cameco) Working capital 210.5 182.5 79.7 151.2 145.8- Kayelekera <strong>and</strong> Stage III expansion at Langer Heinrich substantially complete, offer further upside Current ratio (x) 2.8 1.7 1.3 1.6 1.6- Combined resources total more than 540 mln lbs U3O8 LT Debt 719.7 888.6 754.6 754.6 656.6Common Equity 1355.2 1228.4 1234.8 1307.3 1428.7Key Concerns Price/book (x) 0.6 0.8 0.8 0.7 0.7- Ramp-up at Kayelekera LTD/(LTD + Equity) 34.7% 42.0% 37.9% 36.6% 31.5%- Cost optimization at both operating projects <strong>and</strong> on corporate level ROE -9% -14% 1% 5% 8%- High debt levels ROIC -5% -7% 0% 3% 5%Reserves & Resources Int Tonnes Grade U3O8 PDN's Earnings/Cash Flow F2011A F2012E F2013E F2014E F2015E(%) ('000) (% U3O8) (Mlbs) U3O8 RJ <strong>Uranium</strong> Forecast US$/lb 51.73 55.30 58.25 67.75 73.752P Reserves (incl. Stockpiles) Revenue ($mln) 268.9 367.1 475.5 572.5 612.4Kayelekera 85% 12,769 0.10% 27.6 23.5 EBITDA ($mln) -69.0 -149.7 144.1 242.2 304.1Langer Heinrich 100% 109,203 0.05% 131.6 131.6 EBITDA margin -0.3 -0.4 0.3 0.4 0.597% 121,972 0.06% 159.2 155.1 EV/EBITDA (x, adjusted to C$) nm nm 10.9 6.5 5.2M+I Resources (ex-2P Reserves) EBIT ($mln) -105.1 -195.3 89.8 185.0 246.9Aurora 100% 40,175 0.09% 83.8 83.8 Net earnings ($mln) -124.9 -166.5 6.4 70.7 121.3Kayelekera 85% 9,730 0.06% 12.5 10.6 EPS (US$) -0.08 -0.06 0.01 0.08 0.15Langer Heinrich 100% 16,720 0.05% 18.3 18.3 P/E (x) nm nm 146.6 13.2 7.7Bigrlyi 42% 4,668 0.14% 14.0 5.9 Operating Cash Flow ($mln) -102.0 -87.4 60.7 127.9 178.5Manyingee 100% 7,869 0.10% 17.8 17.8 CFPS (US$) -0.14 -0.10 0.07 0.15 0.21Mount Isa 90% 64,800 0.07% 106.2 95.8 P/CF (x) nm nm 15.4 7.3 5.292% 143,962 0.08% 252.6 232.2 Capex ($mln) -129.4 -67.0 -29.5 -58.2 -86.0Inferred ResourcesAurora 100% 29,053 0.08% 53.0 53.0 Valuation (Funded) C$ mln $/share % of NAVKayelekera 85% 6,493 0.06% 8.9 7.6 Langer Heinrich (DCF, 8%) $1,124 $1.17 65%Langer Heinrich 100% 18,633 0.06% 24.2 24.2 Kayelekera (DCF, 8%) $509 $0.53 30%Agadez 100% 23,205 0.02% 10.9 10.9 Mt. Isa (DCF, 8%) $252 $0.26 15%Bigrlyi 42% 2,781 0.11% 6.9 2.9 Aurora (DCF, 8%) $190 $0.20 11%Angela 50% 10,700 0.13% 30.8 15.4 Manyingee ($/lb) $192 $0.20 11%Manyingee 100% 5,500 0.05% 6.2 6.2 Bigrlyi ($/lb) $37 $0.04 2%Mount Isa 87% 32,200 0.06% 40.7 35.5 Niger Assets ($/lb) $46 $0.05 3%86% 128,565 0.06% 181.7 155.7 Angela <strong>and</strong> Pamela ($/lb) $26 $0.03 2%Other ($/lb) $50 $0.05 3%Total Resources 91% 394,498 0.07% 593.5 543.0 $2,425 $2.52 141%EV/lb Global Resources 2.87 US$/lb Working Capital (F3Q12A) $184 $0.19 11%EV/lb M+I Resources 4.02 US$/lb Options & Warrants $2 $0.00 0%EV/lb Reserves 10.05 US$/lb LT Liabilities (+PV of interest) ($793) ($0.82) -46%SG&A (NPV, 8%) ($100) ($0.10) -6%Operating Summary F2011A F2012E F2013E F2014E F2015E Future Equity Dilution $0 $0.00 0%U3O8 (mln lb) 5.7 6.9 8.1 8.6 8.6 $1,719 $1.79 100%Total Cash Costs ($/lb) 35.3 34.7 31.2 29.5 28.1EV/Prodn U3O8 $277 $229 $196 $183 $183 Implied Target CurrentValuation Measures Multiple MultiplePrice/F1900E NAVPS (x) 1.0 0.61240Price/F2015E CFPS (x) 8.4 5.21035 Target Price C$: C$ 1.8030825% of NAV Exposure by Country % F2012E Output by Country6202%41522%Namibia1047% Malawi 36%258%CanadaAus.00F2011A F2012E F2013E F2014E F2015E F2016E F2017E F2018E F2019E21%Niger64%<strong>Uranium</strong> Output (mln lbs)Australia Kayelekera Langer Heinrich Cash CostCash Cost ($USD/lb)1.21.00.80.60.40.20.0P/NAV1.150.870.630.68 0.720.33URE PDN DML UUU U CCOUS$/lb10.08.06.04.02.00.0EV/Resources44.558.24 8.252.871.720.59URE DML PDN CCO UUU USource: Raymond James Ltd., UxC, Thomson One, Capital IQ, Paladin EnergyRaymond James Ltd. | 2200 – 925 West Georgia Street | Vancouver BC Canada V6C 3L2


