Canada Research | Page 34 of 87<strong>Uranium</strong>Exhibit 51: Financial <strong>and</strong> Operational Snapshot of Cameco Corp.Cameco CorporationRAYMOND JAMES LTD. RESEARCH Analyst: David Sadowski 604 659 8255Rating: Outperform 2 CCO-T david.sadowski@raymondjames.ca6-12 Mth Target C$ 28.00 NAV $19.50Projected Return: 25.3% YR-END: Dec 31 Reporting currency: CDN18-Jul-12Market StatisticsInvestment Thesis Share Price C$ 22.34 Shares Basic (mln) 395.3- Vertically integrated / diverse revenue streams (production, conversion, power generation) 52 Week High 27.05 Shares Fully Diluted (mln) 397.0- Exceptional exploration potential in the Athabasca Basin of Northern Saskatchewan 52 Week Low 17.25 Adj. Shares used in NAV calc (mln) 397.0- Strong North American asset base with low sovereign risk Market Cap. (mln) 8,830 Avg Daily Volume: 826,290Enterprise Value (mln) 9,044 Annualized Dividend $0.40Key Attributes: Total model'd lb. in DCF (mln) 1007.5 Div Yield % 1.79%- One of World's largest uranium producers- Controlling interest in the mammoth Cigar Lake <strong>and</strong> McArthur River uranium assets Financial Metrics 2011A 2012E 2013E 2014E 2015E- Owns the Port Hope UF6 Conversion facility - 1 of 4 in the western world Cash ($ mln) 1203.4 961.0 1160.9 1510.1 1759.5- 31.6% share in North America's largest power plant, Bruce Power, Ontario Working capital ($ mln) 1877.3 1445.8 1645.7 1994.9 2244.3Current ratio (x) 3.7 3.4 3.8 4.3 4.8Key Concerns LT Debt ($ mln) 932.3 907.9 857.9 807.9 757.9- Cost control <strong>and</strong> operational risk at Cigar Lake <strong>and</strong> McArthur Common Equity (mln) 4919.6 5249.0 5775.6 6283.2 6765.9- Ramp-up risk at Cigar Lake <strong>and</strong> McArthur Price/book (x) 1.13 1.10 1.04 0.99 0.94- Muted medium-term earning growth LTD/(LTD + Equity) 15.9% 14.7% 12.9% 11.4% 10.1%ROE 10% 9% 12% 11% 9%ROIC 6% 6% 8% 7% 7%Reserve & Resource Interest Tonnes Grade U3O8 CCO'sProven & Probable Reserves (%) ('000) (% U3O8) (Mlbs) (Mlbs) Earnings/Cash Flow 2011A 2012E 2013E 2014E 2015EMcArthur River 70% 870 16.89% 324.0 226.2 RJ <strong>Uranium</strong> Forecast US$/lb 57.09 53.50 63.00 72.50 75.00Cigar Lake 50% 537 18.30% 216.7 108.4 Revenue ($mln) 2384.4 2371.8 2653.1 2824.0 2909.9Crow Butte 100% 1,283 0.13% 3.7 3.7 EBITDA ($mln) 679.9 665.4 841.5 847.4 864.8Gas Hills - Peach 100% 999 0.11% 2.4 2.4 EBITDA margin 29% 28% 32% 30% 30%Inkai 60% 67,465 0.07% 99.5 59.7 EV/EBITDA (x) 13.3 13.6 10.7 10.7 10.5North Butte/Brown Ranch 100% 1,839 0.09% 3.7 3.7 EBIT ($mln) 405.0 452.9 632.3 608.3 582.8Rabbit Lake 100% 1,491 0.73% 24.0 24.0 Adj. Net earnings ($mln) 505.9 491.4 684.7 665.7 640.8Smith Ranch-Highl<strong>and</strong> 100% 3,388 0.09% 6.6 6.6 Adj. EPS ($/sh) 1.28 1.24 1.73 1.69 1.62Key Lake 83% 62 0.73% 1.0 0.8 P/E (x) 17.4 18.0 12.9 13.3 13.877,934 0.40% 681.6 435.4 Operating Cash Flow ($mln) 731.7 929.9 893.9 904.8 922.8Measured & Indicated Resource ('000) (% U3O8) (Mlbs) (Mlbs) CFPS ($/sh) 1.94 1.67 2.26 2.29 2.34McArthur River 70% 188 17.63% 73.1 51.0 P/CF (x) 11.5 13.4 9.9 9.8 9.6Cigar Lake 50% 44 2.25% 2.2 1.1 Capex ($mln) -647.2 -635.3 -485.9 -347.5 -465.3Crow Butte 100% 2,592 0.21% 11.9 11.9Dawn Lake 57% 347 1.69% 12.9 7.4 Valuation C$ mln $/share % of Total AssetsGas Hills - Peach 100% 9,786 0.10% 22.2 22.2 <strong>Uranium</strong> Purchase Program 501 1.26 6%Smith Ranch-Highl<strong>and</strong> 100% 16,936 0.06% 23.7 23.7 McArthur River (DCF 8%) - 70% 2,364 5.96 31%Inkai 60% 28,613 0.08% 48.0 28.8 Cigar Lake (DCF 8%) - 50% 1,072 2.70 14%Millennium 42% 508 4.55% 50.9 21.4 JV Inkai (DCF 8%) - 60% 772 1.94 10%North Butte/Brown Ranch 100% 7,249 0.08% 12.3 12.3 Rabbit Lake (DCF 8%) - 100% 248 0.62 3%Phoenix 30% 90 17.96% 35.6 10.7 Smith Ranch (DCF 8%) - 100% 284 0.71 3.7%Rabbit Lake 100% 362 0.54% 4.3 4.3 Crow Butte (DCF 8%) - 100% 98 0.25 1.3%Ruby Ranch 100% 2,215 0.08% 4.1 4.1 Development Projects 611 1.54 7.9%Ruth 100% 1,081 0.09% 2.1 2.1 Exploration & Invstm Assets 602 1.52 7.8%Shirley Basin 100% 1,727 0.12% 4.4 4.4 Fuel Services 183 0.46 2%76,239 0.23% 380.8 254.3 Bruce Power LP (DCF 8%) -31.6% 639 1.61 8%7,375 18.58 95%Inferred Resources 61% 268,116 0.09% 523.8 317.8 Working Capital 1,843 4.64 23.8%Additional Capital 29 0.07 0.4%Global Resources 64% 422,288 0.17% 1,586.2 1,007.5 LT Liabilities (922) (2.32) -11.9%SG&A (584) (1.47) -7.5%Note: Resources do not include Reserves Equity Dilution 0 0.00 0.0%Source: Cameco Corp., Raymond James Ltd. Dec.31, 2011 NAV 7,741 19.50 100.0%Implied Target CurrentOperating Summary 2011A 2012E 2013E 2014E 2015E Valuation Measures Multiple MultipleU3O8 (mln lb) 22.4 21.8 22.6 24.1 28.1 Price/2012E NAVPS (x) 1.4 1.1Cash Costs per lb Sold ($/lb) 25.0 28.8 30.1 35.6 37.4 Price/2013E CFPS (x) 12.4 9.9EV/Prodn U3O8 $404 $415 $400 $376 $322 Target Price C$: C$ 28.00<strong>Uranium</strong> Production (Mlbs)353025201510502011A 2012E 2013E 2014E 2015E 2016E 2017ECrow Butte Smith Ranch-Highl<strong>and</strong> JV InkaiRabbit Lake Cigar Lake McArthur RiverCash Costs4035302520151050Cash Costs (C$/lb)NAV Exposure by Country, 2012 2012E Revenue Per Business Segment12%CAN KAZ US AUS6% 5%77%12%<strong>Uranium</strong> Fuel Electricity19%69%1.2P/NAV1.1510.0EV/Resources44.551.00.80.60.40.20.00.870.630.68 0.720.33URE PDN DML UUU U CCOUS$/lb8.06.04.02.00.08.24 8.252.871.720.59URE DML PDN CCO UUU USource: Raymond James Ltd., UxC, Thomson One, Capital IQ, Cameco Corp.Raymond James Ltd. | 2200 – 925 West Georgia Street | Vancouver BC Canada V6C 3L2
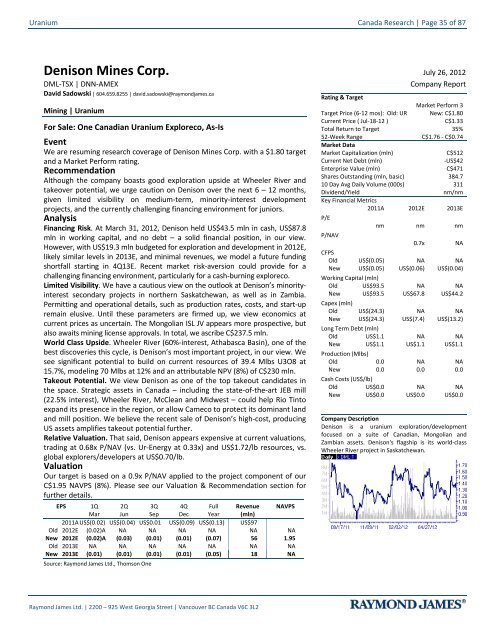
<strong>Uranium</strong> Canada Research | Page 35 of 87Denison Mines Corp. July 26, 2012DML-TSX | DNN-AMEXDavid Sadowski | 604.659.8255 | david.sadowski@raymondjames.caMining | <strong>Uranium</strong>For Sale: One Canadian <strong>Uranium</strong> Exploreco, As-IsEventWe are resuming research coverage of Denison Mines Corp. with a $1.80 target<strong>and</strong> a Market Perform rating.RecommendationAlthough the company boasts good exploration upside at Wheeler River <strong>and</strong>takeover potential, we urge caution on Denison over the next 6 – 12 months,given limited visibility on medium-term, minority-interest developmentprojects, <strong>and</strong> the currently challenging financing environment for juniors.AnalysisFinancing Risk. At March 31, 2012, Denison held US$43.5 mln in cash, US$87.8mln in working capital, <strong>and</strong> no debt – a solid financial position, in our view.However, with US$19.3 mln budgeted for exploration <strong>and</strong> development in 2012E,likely similar levels in 2013E, <strong>and</strong> minimal revenues, we model a future fundingshortfall starting in 4Q13E. Recent market risk-aversion could provide for achallenging financing environment, particularly for a cash-burning exploreco.Limited Visibility. We have a cautious view on the outlook at Denison’s minorityinterestsecondary projects in northern Saskatchewan, as well as in Zambia.Permitting <strong>and</strong> operational details, such as production rates, costs, <strong>and</strong> start-upremain elusive. Until these parameters are firmed up, we view economics atcurrent prices as uncertain. The Mongolian ISL JV appears more prospective, butalso awaits mining license approvals. In total, we ascribe C$237.5 mln.World Class Upside. Wheeler River (60%-interest, Athabasca Basin), one of thebest discoveries this cycle, is Denison’s most important project, in our view. Wesee significant potential to build on current resources of 39.4 Mlbs U3O8 at15.7%, modeling 70 Mlbs at 12% <strong>and</strong> an attributable NPV (8%) of C$230 mln.Takeout Potential. We view Denison as one of the top takeout c<strong>and</strong>idates inthe space. Strategic assets in Canada – including the state-of-the-art JEB mill(22.5% interest), Wheeler River, McClean <strong>and</strong> Midwest – could help Rio Tintoexp<strong>and</strong> its presence in the region, or allow Cameco to protect its dominant l<strong>and</strong><strong>and</strong> mill position. We believe the recent sale of Denison’s high-cost, producingUS assets amplifies takeout potential further.Relative Valuation. That said, Denison appears expensive at current valuations,trading at 0.68x P/NAV (vs. Ur-Energy at 0.33x) <strong>and</strong> US$1.72/lb resources, vs.global explorers/developers at US$0.70/lb.ValuationOur target is based on a 0.9x P/NAV applied to the project component of ourC$1.95 NAVPS (8%). Please see our Valuation & Recommendation section forfurther details.EPS 1Q 2Q 3Q 4Q Full Revenue NAVPSMar Jun Sep Dec Year (mln)2011A US$(0.02) US$(0.04) US$0.01 US$(0.09) US$(0.13) US$97Old 2012E (0.02)A NA NA NA NA NA NANew 2012E (0.02)A (0.03) (0.01) (0.01) (0.07) 56 1.95Old 2013E NA NA NA NA NA NA NANew 2013E (0.01) (0.01) (0.01) (0.01) (0.05) 18 NASource: Raymond James Ltd., Thomson OneCompany ReportRating & TargetMarket Perform 3Target Price (6-12 mos): Old: UR New: C$1.80Current Price ( Jul-18-12 )C$1.33Total Return to Target 35%52-Week RangeC$1.76 - C$0.74Market DataMarket Capitalization (mln) C$512Current Net Debt (mln)-US$42Enterprise Value (mln) C$471Shares Outst<strong>and</strong>ing (mln, basic) 384.710 Day Avg Daily Volume (000s) 311Dividend/Yieldnm/nmKey Financial Metrics2011A 2012E 2013EP/Enm nm nmP/NAV0.7x NACFPSOld US$(0.05) NA NANew US$(0.05) US$(0.06) US$(0.04)Working Capital (mln)Old US$93.5 NA NANew US$93.5 US$67.8 US$44.2Capex (mln)Old US$(24.3) NA NANew US$(24.3) US$(7.4) US$(13.2)Long Term Debt (mln)Old US$1.1 NA NANew US$1.1 US$1.1 US$1.1Production (Mlbs)Old 0.0 NA NANew 0.0 0.0 0.0Cash Costs (US$/lb)Old US$0.0 NA NANew US$0.0 US$0.0 US$0.0Company DescriptionDenison is a uranium exploration/developmentfocused on a suite of Canadian, Mongolian <strong>and</strong>Zambian assets. Denison's flagship is its world-classWheeler River project in Saskatchewan.Raymond James Ltd. | 2200 – 925 West Georgia Street | Vancouver BC Canada V6C 3L2