

Clock - Uranium Supply Crunch and Critical ... - Andrew Johns
Clock - Uranium Supply Crunch and Critical ... - Andrew Johns
Clock - Uranium Supply Crunch and Critical ... - Andrew Johns
- No tags were found...

You also want an ePaper? Increase the reach of your titles
YUMPU automatically turns print PDFs into web optimized ePapers that Google loves.
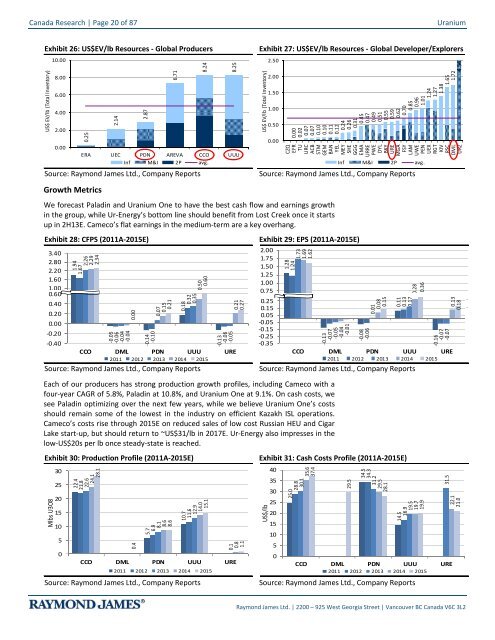
Canada Research | Page 20 of 87<strong>Uranium</strong>Exhibit 26: US$EV/lb Resources - Global ProducersUS$ EV/lb (Total Inventory)10.008.006.004.002.000.000.252.142.876.718.248.25ERA UEC PDN AREVA CCO UUUInf M&I 2P avg.Source: Raymond James Ltd., Company ReportsGrowth MetricsWe forecast Paladin <strong>and</strong> <strong>Uranium</strong> One to have the best cash flow <strong>and</strong> earnings growthin the group, while Ur-Energy’s bottom line should benefit from Lost Creek once it startsup in 2H13E. Cameco’s flat earnings in the medium-term are a key overhang.Exhibit 27: US$EV/lb Resources - Global Developer/ExplorersUS$ EV/lb (Total Inventory)2.502.001.501.000.500.000.000.020.070.070.100.100.110.120.240.260.310.450.470.490.510.550.590.620.700.850.961.011.241.271.381.651.72CZQEFRTUURCACBSTMGEMBANYELMEYSHEGGGEMAURREPWEDYLBKYUREMGAFSYLAMUWEPENUEXRGTKIVRSCDMLURZInf M&I 2P avg.Source: Raymond James Ltd., Company ReportsExhibit 28: CFPS (2011A-2015E) Exhibit 29: EPS (2011A-2015E)3.402.802.201.601.000.400.600.400.200.00-0.201.941.672.262.292.34CFPS('11-'15)-0.05-0.06-0.04-0.040.00-0.14-0.100.070.150.210.180.320.350.500.60-0.13-0.06-0.05-0.40CCO DML PDN UUU URE2011 2012 2013 2014 2015Source: Raymond James Ltd., Company Reports0.210.272.001.751.501.251.000.750.50 0.250.25 0.150.05-0.05-0.15-0.25-0.351.281.241.731.691.62EPS('11-'15)-0.13-0.07-0.05-0.04-0.01Each of our producers has strong production growth profiles, including Cameco with afour-year CAGR of 5.8%, Paladin at 10.8%, <strong>and</strong> <strong>Uranium</strong> One at 9.1%. On cash costs, wesee Paladin optimizing over the next few years, while we believe <strong>Uranium</strong> One’s costsshould remain some of the lowest in the industry on efficient Kazakh ISL operations.Cameco’s costs rise through 2015E on reduced sales of low cost Russian HEU <strong>and</strong> CigarLake start-up, but should return to ~US$31/lb in 2017E. Ur-Energy also impresses in thelow-US$20s per lb once steady-state is reached.Exhibit 30: Production Profile (2011A-2015E)Mlbs U3O830252015105022.421.822.624.128.1Production('11-'15)0.45.76.98.18.68.610.711.612.914.015.10.10.81.1CCO DML PDN UUU URE2011 2012 2013 2014 2015Source: Raymond James Ltd., Company Reports-0.08-0.060.010.080.150.110.130.170.280.36-0.16-0.07-0.07CCO DML PDN UUU URE2011 2012 2013 2014 2015Source: Raymond James Ltd., Company ReportsExhibit 31: Cash Costs Profile (2011A-2015E)US$/lb403530252015105025.028.830.135.637.4Cash costs('11-'15)to add29.534.534.331.229.528.114.516.919.519.719.931.5CCO DML PDN UUU URE2011 2012 2013 2014 2015Source: Raymond James Ltd., Company Reports4.540.130.1822.121.0Raymond James Ltd. | 2200 – 925 West Georgia Street | Vancouver BC Canada V6C 3L2


