Clock - Uranium Supply Crunch and Critical ... - Andrew Johns
Clock - Uranium Supply Crunch and Critical ... - Andrew Johns Clock - Uranium Supply Crunch and Critical ... - Andrew Johns
Canada Research | Page 12 of 87UraniumMine SupplyTaking a Conservative Approach on Primary Supply. Exhibit 9 lays out our global minesupply through 2030E. Key assumptions include continued growth of Kazakh productionbeyond 2012E (to 67 Mlbs in 2017E), successful Cigar Lake start-up in 4Q13E, and greenlights for the premier low-grade African projects (e.g., Imouraren, Mkuju River, Husab).In 2020E and beyond, the Olympic Dam expansion, Wheeler River, and Kiggavik-Sissonseach push forward.Exhibit 9: RJL Global Mine Supply by Major Production Center (Mlbs/year)3002752502252001751501251007550250CAGR2004-2011: 4.27%2012-2016: 8.26%2017-2021: 6.41%200420052006200720082009201020112012201320142015201620172018201920202021202220232024202520262027202820292030Other Countries Kazakhstan Other NIS Russia Other AfricaNamibia Niger U.S.A. Other Canada Cigar LakeMcArthur River Other Australia Ranger Olympic DamSource: Raymond James Ltd., UxC, WNA, NIW, Company ReportsOur model reflects a conservativeview on mine supply and includesseveral major high cost mines andexpansionsOver the past 7 years, Kazakhstan has emerged as a dominant producer, while outputfrom Canada and Australia has waned. We expect Kazakhstan to continue to be asignificant growth region, but its share of the global supply mix to drop as African minesramp-up and Canada and Australia rebound.Exhibit 10: Global Supply by Country in 2004A, 2011A and 2016E (Mlbs)Kazakhstan,8.6, 8.4%Uzbekistan,5.3, 5.2%Ukraine, 2.1,2.0%Russia, 8.4,8.1%Namibia,7.9, 7.6%China, 1.8,1.8%Niger, 8.5,8.3%S. Africa, 2.0,1.9%Other, 2.9,China, 2.2, Other, 2.6,Other, 2.0,China, 2.3,2.8% 1.6% 1.9% Australia,1.0% Australia,1.1%Australia,15.7, 11.4%20.5, 10.1%23.3, 22.6%U.S., 2.1,2.1%Canada,30.2, 29.2%Kazakhstan,50.6, 36.6%Uzbekistan,6.3, 4.5%Ukraine, 2.3,1.7%Russia, 8.0,5.7%Canada,23.8, 17.2%U.S., 4.0,2.9%S. Africa, 1.5,1.1%Niger, 10.8,7.8%Namibia,Malawi, 2.2, 8.5, 6.1%1.6%Kazakhstan,63.9, 31.4%Uzbekistan,6.3, 3.1%Ukraine, 4.8,2.4%Russia, 11.4,5.6%Tanzania,342.2%2004A 2011A 2016ESource: Raymond James Ltd., UxC, WNA, NIW, Company ReportsKazakhstan should remain thedominant supplier, but emergingAfrican and rebounding Australianand Canadian mines shouldcapture market shareMalawi,332.4%Canada,36.9, 18.1%U.S., 11.4,5.6%S. Africa, 2.0,1.0%Niger, 18.1,8.9%Namibia,17.1, 8.4%More Conservative than Other Groups. Our supply forecast is well above (i.e., moreconservative vis-à-vis prices) the reference scenarios from WNA (published September2011) and UxC (1Q12) through 2030, above WNA’s high scenario in the 2012 – 2027period (before dipping below as mines deplete) and below UxC’s high forecast until2022, two years after UxC peak production in 2020.Our mine supply curve is generallyhigher (i.e., more conservative visà-visprices) than those of UxC andWNARaymond James Ltd. | 2200 – 925 West Georgia Street | Vancouver BC Canada V6C 3L2
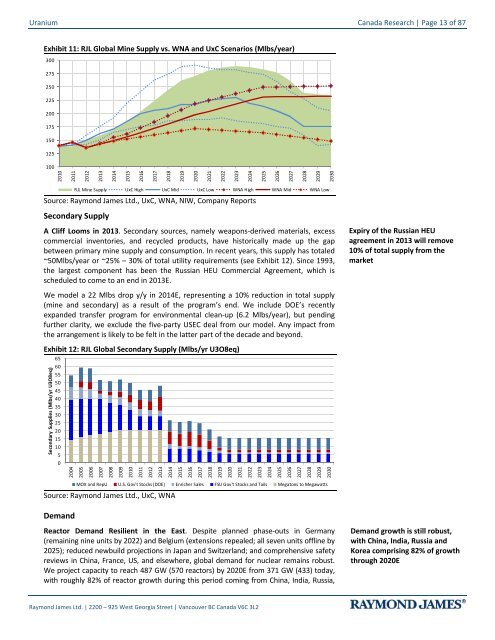
Uranium Canada Research | Page 13 of 87Exhibit 11: RJL Global Mine Supply vs. WNA and UxC Scenarios (Mlbs/year)300275250225200175150125100201020112012201320142015201620172018201920202021202220232024202520262027202820292030RJL Mine Supply UxC High UxC Mid UxC Low WNA High WNA Mid WNA LowSource: Raymond James Ltd., UxC, WNA, NIW, Company ReportsSecondary SupplyA Cliff Looms in 2013. Secondary sources, namely weapons-derived materials, excesscommercial inventories, and recycled products, have historically made up the gapbetween primary mine supply and consumption. In recent years, this supply has totaled~50Mlbs/year or ~25% – 30% of total utility requirements (see Exhibit 12). Since 1993,the largest component has been the Russian HEU Commercial Agreement, which isscheduled to come to an end in 2013E.Expiry of the Russian HEUagreement in 2013 will remove10% of total supply from themarketWe model a 22 Mlbs drop y/y in 2014E, representing a 10% reduction in total supply(mine and secondary) as a result of the program’s end. We include DOE’s recentlyexpanded transfer program for environmental clean-up (6.2 Mlbs/year), but pendingfurther clarity, we exclude the five-party USEC deal from our model. Any impact fromthe arrangement is likely to be felt in the latter part of the decade and beyond.Exhibit 12: RJL Global Secondary Supply (Mlbs/yr U3O8eq)65Secondary Supplies (Mlbs/yr U3O8eq)605550454035302520151050200420052006200720082009201020112012201320142015201620172018201920202021202220232024202520262027202820292030MOX and RepU U.S. Gov't Stocks (DOE) Enricher Sales FSU Gov't Stocks and Tails Megatons to MegawattsSource: Raymond James Ltd., UxC, WNADemandReactor Demand Resilient in the East. Despite planned phase-outs in Germany(remaining nine units by 2022) and Belgium (extensions repealed; all seven units offline by2025); reduced newbuild projections in Japan and Switzerland; and comprehensive safetyreviews in China, France, US, and elsewhere, global demand for nuclear remains robust.We project capacity to reach 487 GW (570 reactors) by 2020E from 371 GW (433) today,with roughly 82% of reactor growth during this period coming from China, India, Russia,Demand growth is still robust,with China, India, Russia andKorea comprising 82% of growththrough 2020ERaymond James Ltd. | 2200 – 925 West Georgia Street | Vancouver BC Canada V6C 3L2
- Page 1 and 2: Mining & Natural ResourcesDavid Sad
- Page 3 and 4: Uranium Canada Research | Page 3 of
- Page 5 and 6: Uranium Canada Research | Page 5 of
- Page 7 and 8: Uranium Canada Research | Page 7 of
- Page 9 and 10: Uranium Canada Research | Page 9 of
- Page 11: Uranium Canada Research | Page 11 o
- Page 15 and 16: Uranium Canada Research | Page 15 o
- Page 17 and 18: Uranium Canada Research | Page 17 o
- Page 19 and 20: Uranium Canada Research | Page 19 o
- Page 21 and 22: Uranium Canada Research | Page 21 o
- Page 24 and 25: Canada Research | Page 24 of 87Uran
- Page 26: Canada Research | Page 26 of 87Uran
- Page 30 and 31: Canada Research | Page 30 of 87Uran
- Page 32 and 33: Canada Research | Page 32 of 87Uran
- Page 34 and 35: Canada Research | Page 34 of 87Uran
- Page 36 and 37: Canada Research | Page 36 of 87Uran
- Page 38 and 39: Canada Research | Page 38 of 87Uran
- Page 40 and 41: Canada Research | Page 40 of 87Uran
- Page 42 and 43: Canada Research | Page 42 of 87Uran
- Page 44 and 45: Canada Research | Page 44 of 87Uran
- Page 46 and 47: Canada Research | Page 46 of 87Uran
- Page 48 and 49: Canada Research | Page 48 of 87Uran
- Page 50 and 51: Canada Research | Page 50 of 87Uran
- Page 52 and 53: Canada Research | Page 52 of 87Uran
- Page 54 and 55: Canada Research | Page 54 of 87Uran
- Page 56 and 57: Canada Research | Page 56 of 87Uran
- Page 58 and 59: Canada Research | Page 58 of 87Uran
- Page 60 and 61: Canada Research | Page 60 of 87Uran
<strong>Uranium</strong> Canada Research | Page 13 of 87Exhibit 11: RJL Global Mine <strong>Supply</strong> vs. WNA <strong>and</strong> UxC Scenarios (Mlbs/year)300275250225200175150125100201020112012201320142015201620172018201920202021202220232024202520262027202820292030RJL Mine <strong>Supply</strong> UxC High UxC Mid UxC Low WNA High WNA Mid WNA LowSource: Raymond James Ltd., UxC, WNA, NIW, Company ReportsSecondary <strong>Supply</strong>A Cliff Looms in 2013. Secondary sources, namely weapons-derived materials, excesscommercial inventories, <strong>and</strong> recycled products, have historically made up the gapbetween primary mine supply <strong>and</strong> consumption. In recent years, this supply has totaled~50Mlbs/year or ~25% – 30% of total utility requirements (see Exhibit 12). Since 1993,the largest component has been the Russian HEU Commercial Agreement, which isscheduled to come to an end in 2013E.Expiry of the Russian HEUagreement in 2013 will remove10% of total supply from themarketWe model a 22 Mlbs drop y/y in 2014E, representing a 10% reduction in total supply(mine <strong>and</strong> secondary) as a result of the program’s end. We include DOE’s recentlyexp<strong>and</strong>ed transfer program for environmental clean-up (6.2 Mlbs/year), but pendingfurther clarity, we exclude the five-party USEC deal from our model. Any impact fromthe arrangement is likely to be felt in the latter part of the decade <strong>and</strong> beyond.Exhibit 12: RJL Global Secondary <strong>Supply</strong> (Mlbs/yr U3O8eq)65Secondary Supplies (Mlbs/yr U3O8eq)605550454035302520151050200420052006200720082009201020112012201320142015201620172018201920202021202220232024202520262027202820292030MOX <strong>and</strong> RepU U.S. Gov't Stocks (DOE) Enricher Sales FSU Gov't Stocks <strong>and</strong> Tails Megatons to MegawattsSource: Raymond James Ltd., UxC, WNADem<strong>and</strong>Reactor Dem<strong>and</strong> Resilient in the East. Despite planned phase-outs in Germany(remaining nine units by 2022) <strong>and</strong> Belgium (extensions repealed; all seven units offline by2025); reduced newbuild projections in Japan <strong>and</strong> Switzerl<strong>and</strong>; <strong>and</strong> comprehensive safetyreviews in China, France, US, <strong>and</strong> elsewhere, global dem<strong>and</strong> for nuclear remains robust.We project capacity to reach 487 GW (570 reactors) by 2020E from 371 GW (433) today,with roughly 82% of reactor growth during this period coming from China, India, Russia,Dem<strong>and</strong> growth is still robust,with China, India, Russia <strong>and</strong>Korea comprising 82% of growththrough 2020ERaymond James Ltd. | 2200 – 925 West Georgia Street | Vancouver BC Canada V6C 3L2


