Theoretical HDO emission from low-mass protostellar envelopes
Theoretical HDO emission from low-mass protostellar envelopes
Theoretical HDO emission from low-mass protostellar envelopes
- No tags were found...

You also want an ePaper? Increase the reach of your titles
YUMPU automatically turns print PDFs into web optimized ePapers that Google loves.
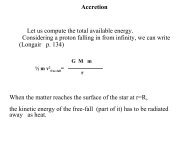
B. Parise et al.: Models of <strong>HDO</strong> <strong>emission</strong> 173of the envelope. Details of these calculations can be found inCHT96. The cooling depends on the abundance of the atomicoxygen, CO and H 2 O, namely the main gas coolants across theenvelope. Hence their abundances are hidden parameters of themodel. The resulting gas temperature tracks the dust temperaturevery closely across the envelope, except where the icymantles evaporate. Because of the injection of large quantitiesof water in the gas phase and the consequent enhancement ofthe gas cooling, the gas and dust (thermally) decouple in a relativelysmall region after the icy mantles evaporation (see alsofor example Maret et al. 2002).Ceccarelli et al. (2000a) and Maret et al. (2002) demonstratedthat the gas temperature differs by no more than 10%<strong>from</strong> the dust temperature, and this occurs in a relatively smallregion just next to where the ices sublimate. There is some uncertaintyabout the water and oxygen abundances in protostars,as derivations of the H 2 O abundance has been obtained in twosources only, IRAS 16293 and NGC 1333–IRAS4 (Ceccarelliet al. 2000a; Maret et al. 2002). However, these uncertainties donot much affect the gas temperature derivation, as in the outerenvelope the gas is cooled mostly by CO 1 , and in the inner envelopeit is cooled by the sublimated water. At the same time, inthe inner region the heating of the gas is dominated by the collisionalde-excitation of the water molecules, photopumped bythe photons emitted by the innermost warm dust (CHT96), sothat the coupling between the dust and gas is always ensured.As a result, the <strong>HDO</strong> computed line intensity is insensitive tothese uncertainties.The original CHT96 model is time-dependent, but the authorsdemonstrated that the physical structure and water chemistrycan be computed at each time independently of the previoushistory, once the luminosity and the <strong>mass</strong> of the protostarare known. The reason for this is that in the outer cold envelopethe abundance of the water is practically constant with time,whereas in the inner warm envelope the water abundance is setby the ice evaporation, except in the very inner regions wherethe temperature exceeds 250 K. Since the sizes of the evaporationregion are set by the temperature and the density profile,for practical applications to real sources one needs to inputthem only. The velocity field is also needed to compute the lineintensity, and this can be derived as well <strong>from</strong> observations.For the standard case described in Sect. 4, we consideredthe case of IRAS 16293, whose velocity, density and temperatureprofiles have been derived by several authors <strong>from</strong> actualobservations. The computations shown in Figs. 2–7 adopted theprofile derived in Ceccarelli et al. (2000a). We also studied thecase of a <strong>low</strong> luminosity source, and we used the velocity, densityand temperature profiles derived for the source L1448 mmby Maret et al. (2004).We approximate the <strong>HDO</strong> abundance profile with a stepfunction. In the outer envelope the <strong>HDO</strong> abundance, x cold ,is relatively <strong>low</strong> and similar to that observed in molecularclouds. In the innermost regions of the envelope, wherethe dust reaches the evaporation temperature T evap , the <strong>HDO</strong>1 The CO lines are optically thick and, therefore, the cooling functiondoes not depend on the CO abundance unless it decreases by afactor of 100 with respect to the standard value.Fig. 1. First energy levels for the <strong>HDO</strong> molecule.abundance, x warm , jumps to larger values. These last three parameters– x cold , x warm and T evap – are the three free parametersof the present modeling, and they will be varied to study theirinfluence on the <strong>HDO</strong> line <strong>emission</strong>.Low-<strong>mass</strong> protostars exhibit energetic molecular outf<strong>low</strong>s,where the gas can be very hot (up to 2000 K, as testified by theH 2 rovibrational <strong>emission</strong> observed in several outf<strong>low</strong>s). Thisgas could in principle contribute to the <strong>HDO</strong> line <strong>emission</strong>, sothat it is important to evaluate whether the outf<strong>low</strong> <strong>emission</strong> canbe comparable to or even larger than the <strong>HDO</strong> <strong>emission</strong> <strong>from</strong>the envelope. From a theoretical point of view, since moleculardeuteration decreases exponentially with increasing gastemperature, the <strong>HDO</strong> abundance is expected to be very <strong>low</strong>in the warm gas of molecular outf<strong>low</strong>s (see also Bergin et al.1999). To support these theoretical expectations, observationsof outf<strong>low</strong>s on several <strong>low</strong>-<strong>mass</strong> protostars have revealed no<strong>HDO</strong> <strong>emission</strong>, at a level at least 10 times fainter than towardsthe protostar (IRAS 16293, Parise et al. 2005; NGC 1333–IRAS2 and IRAS4A, Caux et al. in prep.). We therefore decidedto consider in the present study only the envelope contributionto the <strong>HDO</strong> <strong>emission</strong>.All the line fluxes are computed for a source at a distanceof 160 pc. The model computes the level population of the first34 levels of the <strong>HDO</strong>. The molecular data are <strong>from</strong> the JPL catalogue(http://spec.jpl.nasa.gov/home.html), and thecollisional coefficients are <strong>from</strong> Green (1989), for He-<strong>HDO</strong>collisions between 50 and 500 K, scaled for collision with H 2 .Note that all abundances are reported here with respect to H 2 .3. The <strong>HDO</strong> rotational line spectrum3.1. The energy levels<strong>HDO</strong> is a planar assymetric top molecule. Its dipole liesalong its a and b axies, with dipole moments µ a = 0.657 andµ b = 1.732 Debye (Clough et al. 1973). The al<strong>low</strong>ed transitionsare thus a-type and b-type transitions:∆K a = 0and∆K c = ±1or∆K a = ±1 and∆K c = ±1.