Photovoltaics - EERE - U.S. Department of Energy
Photovoltaics - EERE - U.S. Department of Energy
Photovoltaics - EERE - U.S. Department of Energy
- No tags were found...

You also want an ePaper? Increase the reach of your titles
YUMPU automatically turns print PDFs into web optimized ePapers that Google loves.
FederalTechnologyAlert<strong>Photovoltaics</strong>A proven technology for providing electricity in remote and difficult-toaccesslocations.AbstractThe Executive Office has put a highpriority on ensuring U.S. buildings areenergy efficient and environmentally sustainable.The action plan includes improvingFederal procurement <strong>of</strong> energy-efficienttechnology, such as photovoltaics. Thiscommitment spearheads the President’sMillion Solar Ro<strong>of</strong>s Initiative, which aims atinstalling 1 million solar energy systems onresidential, commercial, and public sectorbuildings by 2010. The Federal sector’s portion<strong>of</strong> that goal is 20,000 facilities. FEMPplays a leading role in meeting this commitmentby encouraging and facilitating the use<strong>of</strong> photovoltaics.<strong>Photovoltaics</strong> (PV) or solar electricity isa well-proven and reliable technology usedincreasingly by Federal facilities to providepower in remote or difficult-to-access locations.PV systems are used throughout theUnited States, but they are cost effectivemost <strong>of</strong>ten in areas with abundant sunlight,as the size and cost <strong>of</strong> the PV array for anyapplication are directly related to the availability<strong>of</strong> the solar resource. The only majordrawback <strong>of</strong> PV systems is the high initialcost for capital equipment. However, whenthe life-cycle costs (LCCs) <strong>of</strong> PV systemsare compared to alternatives such as enginegenerators or long utility line extensions,PV is <strong>of</strong>ten the most economical option.This Federal Technology Alert discusseson- and <strong>of</strong>f-grid PV applications and providesFederal facility managers with thedetailed information they require to evaluatepotential PV applications. Descriptions <strong>of</strong>PV system components and technologicalmethods are included, along with installationand maintenance requirements and suggestionsfor where to apply the technologyand what to avoid. Also provided are PVequipment selection guidelines, procurementinformation, and a method for calculatingLCCs.Three case studies are presented to providedetailed examples <strong>of</strong> various PV applicationsand ways to estimate cost savingsand LCCs.A portable PV/propane hybrid system provides electricity for the California StateUniversity Desert Research Center in Southern California.Southern California Edison/PIX040411
ContentsAbstract . . . . . . . . . . . . . . . . . . . . . . . . . . . . . . . . . . . . . . . . . . . . . . . . . . . . . . . . . . . . . . . . . . .1About the Technology . . . . . . . . . . . . . . . . . . . . . . . . . . . . . . . . . . . . . . . . . . . . . . . . . . . . . . . .3Application Domain . . . . . . . . . . . . . . . . . . . . . . . . . . . . . . . . . . . . . . . . . . . . . . . . . . . . . .3How PV Systems Work . . . . . . . . . . . . . . . . . . . . . . . . . . . . . . . . . . . . . . . . . . . . . . . . . . .4PV System Components . . . . . . . . . . . . . . . . . . . . . . . . . . . . . . . . . . . . . . . . . . . . . . . . . . .5Benefits . . . . . . . . . . . . . . . . . . . . . . . . . . . . . . . . . . . . . . . . . . . . . . . . . . . . . . . . . . . . . . .8Variations . . . . . . . . . . . . . . . . . . . . . . . . . . . . . . . . . . . . . . . . . . . . . . . . . . . . . . . . . . . . . .8Installation . . . . . . . . . . . . . . . . . . . . . . . . . . . . . . . . . . . . . . . . . . . . . . . . . . . . . . . . . . . . .8Federal Sector Potential . . . . . . . . . . . . . . . . . . . . . . . . . . . . . . . . . . . . . . . . . . . . . . . . . . . . . . .9Technology Screening Process . . . . . . . . . . . . . . . . . . . . . . . . . . . . . . . . . . . . . . . . . . . . . .9Laboratory Perspective . . . . . . . . . . . . . . . . . . . . . . . . . . . . . . . . . . . . . . . . . . . . . . . . . . . .9Application . . . . . . . . . . . . . . . . . . . . . . . . . . . . . . . . . . . . . . . . . . . . . . . . . . . . . . . . . . . . . . . .9Application Screening . . . . . . . . . . . . . . . . . . . . . . . . . . . . . . . . . . . . . . . . . . . . . . . . . . . .9Load Reduction . . . . . . . . . . . . . . . . . . . . . . . . . . . . . . . . . . . . . . . . . . . . . . . . . . . . . . . . .11Economic Analysis . . . . . . . . . . . . . . . . . . . . . . . . . . . . . . . . . . . . . . . . . . . . . . . . . . . . . .11Where to Apply . . . . . . . . . . . . . . . . . . . . . . . . . . . . . . . . . . . . . . . . . . . . . . . . . . . . . . . . .11What to Avoid . . . . . . . . . . . . . . . . . . . . . . . . . . . . . . . . . . . . . . . . . . . . . . . . . . . . . . . . . .11Maintenance Impact . . . . . . . . . . . . . . . . . . . . . . . . . . . . . . . . . . . . . . . . . . . . . . . . . . . . .11Equipment Warranties . . . . . . . . . . . . . . . . . . . . . . . . . . . . . . . . . . . . . . . . . . . . . . . . . . . .13Codes and Standards . . . . . . . . . . . . . . . . . . . . . . . . . . . . . . . . . . . . . . . . . . . . . . . . . . . . .13Costs . . . . . . . . . . . . . . . . . . . . . . . . . . . . . . . . . . . . . . . . . . . . . . . . . . . . . . . . . . . . . . . .13Procurement . . . . . . . . . . . . . . . . . . . . . . . . . . . . . . . . . . . . . . . . . . . . . . . . . . . . . . . . . . .13Utility Incentives and Support . . . . . . . . . . . . . . . . . . . . . . . . . . . . . . . . . . . . . . . . . . . . . .14Building-Integrated Photovoltaic Systems . . . . . . . . . . . . . . . . . . . . . . . . . . . . . . . . . . . . .14Technology Performance . . . . . . . . . . . . . . . . . . . . . . . . . . . . . . . . . . . . . . . . . . . . . . . . . . . . .15Field Experience . . . . . . . . . . . . . . . . . . . . . . . . . . . . . . . . . . . . . . . . . . . . . . . . . . . . . . . .15Maintenance . . . . . . . . . . . . . . . . . . . . . . . . . . . . . . . . . . . . . . . . . . . . . . . . . . . . . . . . . . .15Barriers . . . . . . . . . . . . . . . . . . . . . . . . . . . . . . . . . . . . . . . . . . . . . . . . . . . . . . . . . . . . . . .15Case Study . . . . . . . . . . . . . . . . . . . . . . . . . . . . . . . . . . . . . . . . . . . . . . . . . . . . . . . . . . . . . . . .15Facility Description . . . . . . . . . . . . . . . . . . . . . . . . . . . . . . . . . . . . . . . . . . . . . . . . . . . . .15Conventional Technology Description . . . . . . . . . . . . . . . . . . . . . . . . . . . . . . . . . . . . . . .16New Technology (PV) Description . . . . . . . . . . . . . . . . . . . . . . . . . . . . . . . . . . . . . . . . . .16Savings Potential . . . . . . . . . . . . . . . . . . . . . . . . . . . . . . . . . . . . . . . . . . . . . . . . . . . . . . .16Life-Cycle Cost . . . . . . . . . . . . . . . . . . . . . . . . . . . . . . . . . . . . . . . . . . . . . . . . . . . . . . . .16Implementation and Post-Implementation Experience . . . . . . . . . . . . . . . . . . . . . . . . . . . .17Case Study . . . . . . . . . . . . . . . . . . . . . . . . . . . . . . . . . . . . . . . . . . . . . . . . . . . . . . . . . . . . . . . .17Facility Description . . . . . . . . . . . . . . . . . . . . . . . . . . . . . . . . . . . . . . . . . . . . . . . . . . . . .17Conventional Technology Description . . . . . . . . . . . . . . . . . . . . . . . . . . . . . . . . . . . . . . . .17New Technology (PV) Description . . . . . . . . . . . . . . . . . . . . . . . . . . . . . . . . . . . . . . . . . .17Savings Potential . . . . . . . . . . . . . . . . . . . . . . . . . . . . . . . . . . . . . . . . . . . . . . . . . . . . . . .17Life-Cycle Cost . . . . . . . . . . . . . . . . . . . . . . . . . . . . . . . . . . . . . . . . . . . . . . . . . . . . . . . .17Implementation and Post-Implementation Experience . . . . . . . . . . . . . . . . . . . . . . . . . . . .18Case Study . . . . . . . . . . . . . . . . . . . . . . . . . . . . . . . . . . . . . . . . . . . . . . . . . . . . . . . . . . . . . . . .18Facility Description . . . . . . . . . . . . . . . . . . . . . . . . . . . . . . . . . . . . . . . . . . . . . . . . . . . . .18Conventional Technology Description . . . . . . . . . . . . . . . . . . . . . . . . . . . . . . . . . . . . . . .18New Technology Description . . . . . . . . . . . . . . . . . . . . . . . . . . . . . . . . . . . . . . . . . . . . . .18Savings Potential . . . . . . . . . . . . . . . . . . . . . . . . . . . . . . . . . . . . . . . . . . . . . . . . . . . . . . .18Life-Cycle Cost . . . . . . . . . . . . . . . . . . . . . . . . . . . . . . . . . . . . . . . . . . . . . . . . . . . . . . . .18Implementation and Post-Implementation Experience . . . . . . . . . . . . . . . . . . . . . . . . . . . .18Technology in Perspective . . . . . . . . . . . . . . . . . . . . . . . . . . . . . . . . . . . . . . . . . . . . . . . . . . . .18The Technology’s Development . . . . . . . . . . . . . . . . . . . . . . . . . . . . . . . . . . . . . . . . . . . .18Technology Outlook . . . . . . . . . . . . . . . . . . . . . . . . . . . . . . . . . . . . . . . . . . . . . . . . . . . . .18Manufacturers . . . . . . . . . . . . . . . . . . . . . . . . . . . . . . . . . . . . . . . . . . . . . . . . . . . . . . . . . . . . .20Federal Program Contacts . . . . . . . . . . . . . . . . . . . . . . . . . . . . . . . . . . . . . . . . . . . . . . . . . . . . .23Who Is Using the Technology . . . . . . . . . . . . . . . . . . . . . . . . . . . . . . . . . . . . . . . . . . . . . . . . . .23For More Information . . . . . . . . . . . . . . . . . . . . . . . . . . . . . . . . . . . . . . . . . . . . . . . . . . . . . . .23Organizations . . . . . . . . . . . . . . . . . . . . . . . . . . . . . . . . . . . . . . . . . . . . . . . . . . . . . . . . . .23Literature: Design, Installation, and O&M . . . . . . . . . . . . . . . . . . . . . . . . . . . . . . . . . . . .24Literature: Other . . . . . . . . . . . . . . . . . . . . . . . . . . . . . . . . . . . . . . . . . . . . . . . . . . . . . . . .24Appendixes . . . . . . . . . . . . . . . . . . . . . . . . . . . . . . . . . . . . . . . . . . . . . . . . . . . . . . . . . . . . . . . .252
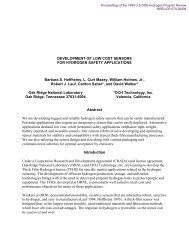
About theTechnology<strong>Photovoltaics</strong> (PV) is a descriptive namefor a technology in which radiant lightenergy (photo) is converted to electricity(voltaic) by semiconductor devices. It isused worldwide to provide electricity, especiallyin remote or difficult-to-access locations.Unlike solar thermal technologies thatprovide heat, PV converts sunlight to directcurrent (DC) electricity.The PV modules that perform this conversionhave no moving parts, emit noexhausts, are completely silent, and requireonly sunlight as fuel. They are also verydurable and reliable, and last at least20–30 years. PV modules power virtuallyall satellites and have been important to thespace program since 1958, when the firstPV system went into orbit with theVanguard I satellite.PV systems can generate electricity anywherethe sun shines (even in space), buttheir cost usually limits their applications toremote or difficult-to-access locations whereline-tied utility power is either unavailableor too expensive to install. Some line-tiedPV systems are currently being used forhigh-value applications such as utility distributionline support demonstration projectsand peak load shaving for buildings (seeTechnology Outlook section for details) butthey are, for the most part, not cost effectiveat this time.As new, less expensive PV technologiesare commercialized and electricity costsincrease, line-tied PV systems will becomemore economically feasible. In fact, plansare under way to construct a PV and solarthermal power plant in Nevada that will sellpower for less than $0.10 per kilowatt-hour(kWh) by the year 1999; however, the PVsystems that are cost effective today serve<strong>of</strong>f-grid applications.These applications include livestockwater pumping; outdoor area and sign lighting(see Figure 1); <strong>of</strong>f-grid power forhomes, cabins, and trailers; telecommunications;remote monitoring stations; cathodicprotection; traffic warning signals; air trafficsafety beacons; and many more. ThisFederal Technology Alert discusses onand<strong>of</strong>f-grid PV applications that are costeffective for Federal facilities.Figure 1. PV lighting system at Roosevelt Lake in Phoenix, Arizona.Application DomainPV has been used increasingly in theFederal government since it was first usedin the space program. As the cost <strong>of</strong> PVmodules dropped from more than $100 perwatt (W) in the mid-1970s to less than $6/Wtoday, more and more government agencieshave found cost-effective applications forthis versatile technology. PV systems arepresently in use in almost every sector <strong>of</strong>the Federal government, but the agenciesthat use PV the most typically contend withremote regions <strong>of</strong> the country and vast tracts<strong>of</strong> land. They include the National ParkService (NPS), the Bureau <strong>of</strong> LandManagement (BLM), the Forest Service, theCoast Guard, and all branches <strong>of</strong> the<strong>Department</strong> <strong>of</strong> Defense (DOD).The total number <strong>of</strong> PV systems used inthe Federal sector is not known, but SandiaNational Laboratories (Sandia) has recentlyconducted studies <strong>of</strong> PV systems used inthree <strong>of</strong> these agencies. The results <strong>of</strong> thesestudies were published in a series <strong>of</strong> documentstitled Renew the Parks, Renew thePublic Lands, and Renew the Forests.Renew the Parks reveals that more than600 PV systems are used in the nationalparks. Most are used for resource monitoring(31%) and communications (27%). Aspart <strong>of</strong> the study, parks were requested toidentify future PV projects. The resultstotaled 643 future projects in 125 parks.According to Renew the Public Lands,approximately 690 PV systems are used bythe BLM. Most (61%) are used for remoteautomated weather stations. Another 123future PV projects were identified. In Renewthe Forests, the numbers given for the ForestService are 500 PV systems and 200 identifiedfuture projects. Most <strong>of</strong> the current systems(62%) are used for communications.Figure 2 shows the distribution <strong>of</strong> PV applicationsfor these agencies.PV applications included in the "Other"category on Figure 2 include lake aerating,water disinfecting, ventilation systems, batterychargers, security systems, interpretivedisplays, traffic counters, automatic gates,navigation aids, and wastewater management.Sandia published a paper in 1996 titled"<strong>Photovoltaics</strong> in the <strong>Department</strong> <strong>of</strong>Defense" that documents the history <strong>of</strong> PVuse in DOD. According to this paper, theU.S. military had installed approximately2,000 small remote systems with about2 megawatts (MW) <strong>of</strong> PV power by 1992.After 1992, DOD shifted its emphasis todeveloping and implementing larger-scaleSandia National Laboratories/PIX020633
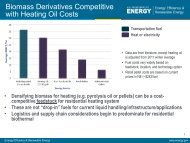
PV applications. Since then, another 124systems with 2.1 MW <strong>of</strong> PV power havebeen installed. There are about 50,000 morepotential PV applications in the U.S. militarywith about 50 MW <strong>of</strong> PV.Most <strong>of</strong> these systems are used in remotelocations, but many applications are costeffective in urban environments. They typicallyinvolve small loads that do not justifyconstructing a utility line extension or are indifficult-to-access locations where line constructionwould be very costly. Such locationsinclude street and highway medianstrips, areas with no utility easements,municipalities with restrictive buildingregulations, and areas across from streets,intersections, and railways. Examples <strong>of</strong>cost-effective urban applications include:• Emergency telephones for roadways,bike paths, parks, and parking lots• Lighting for signs, billboards, andflagpoles• Traffic counters• Traffic hazard warning flashers• School crossing flashers• Security lighting for parks, playgrounds,parking lots, paths, outdoor stairways,and equipment yards• Irrigation controls for ball fields, medianstrips, and landscaping.PV systems are also very popular forportable and temporary applications becausethey can be designed for easy transportation.These include road construction sign boardsand warning flashers, portable power packs,and livestock water-pumping systems thatare moved from pasture to pasture to followstock rotations. PV is also widely used insmall portable appliances such as watchesand calculators.These expanding markets have causedthe U.S. PV industry to grow rapidly tokeep pace with the increasing demand in theUnited States and abroad. In 1996, U.S. PVmodule shipments grew by 26% to 41 MW(45% <strong>of</strong> the world market share). Virtuallyevery U.S. module manufacturer either justcompleted or is now in the midst <strong>of</strong> a majorexpansion in module production capacity.The 1997 Solar <strong>Energy</strong> IndustriesAssociation membership directory lists n<strong>of</strong>ewer than 22 manufacturers <strong>of</strong> PV modulesand 29 suppliers <strong>of</strong> complete PV systems(see Manufacturers section for listings).PV systems are easily procured by Federalagencies via General Services Administration(GSA) schedules that cover most majormakes <strong>of</strong> PV systemcomponents and completesystems. In addition,PV systems can beobtained from many electricutility companiesthat <strong>of</strong>fer PV service programsto satisfy theircustomers' remote-powerneeds.How PV SystemsWorkUnlike energy-savingtechnologies such assolar water heating,compact fluorescentlightbulbs, and energyefficientappliances, PVsystems reduce costs and mitigate environmentalpollution not by saving energy butby serving new and current electric loadsmore cost effectively. This is possible whenthe traditional method <strong>of</strong> providing electricity,a utility line extension, becomes tooexpensive to install, maintain, or repair.To gain a perspective on when PV systemsare cost effective for new loads, comparethe length <strong>of</strong> a line extension to costs<strong>of</strong> PV systems in Figure 3.As this figure shows, whether a PV systemis more cost effective than a line extensiondepends on the length <strong>of</strong> the line andthe cost per mile <strong>of</strong> line construction.Cost <strong>of</strong> PV system ($)90,00080,00070,00060,00050,00040,00030,00020,00010,000Weatherstations24%Remotemonitoring17%Figure 3. Cost <strong>of</strong> PV versus line extensions.Water pumping7%Remote facilities6%Restroom power5%Other 5%Lighting 3%Electricfences1%Communications32%Figure 2. Distribution <strong>of</strong> current PV applications in NPS,Forest Service, and BLM.Line extension costs lessConstruction costs <strong>of</strong> $30,000/mile are typicalfor buried underground line. Investorownedutilities charge about $15,000/milefor overhead line, and rural electric cooperativesand other public utilities sometimesconstruct overhead lines for as little as$10,000/mile.Table 1 provides some average costs fortypical PV systems. Any application with aPV system cost that falls below the applicableline on the chart has a good potential foreconomic feasibility.The cost-per-mile lines do not appear tostart at zero dollars because an additionalcost for a transformer is assumed whenever$30,000/mile$15,000/milePV costs less$10,000/mile00.0 0.5 1.0 1.5 2.0 2.5 3.0Miles <strong>of</strong> lineM75-B171301M75-B1713024
the line is longer than 200 feet. The averagevalue <strong>of</strong> $2,000 was used for this cost.PV System ComponentsPV systems have individual componentsthat are assembled to serve the needs <strong>of</strong> aspecific load or loads. With certain applicationssuch as outdoor area lighting andwater pumping, PV systems may alsoinclude the loads (the light or pump)because they are specifically designed tooperate with PV systems.Depending on the nature <strong>of</strong> the load,each PV system may include:Table 1. Typical PV system costsPackaged PV power supply that providesannual average <strong>of</strong> 1/2 kWh AC/day – $ 5,000Packaged PV power supply that providesannual average <strong>of</strong> 3 kWh AC/day – $19,000Packaged PV power supply that providesannual average <strong>of</strong> 8 kWh AC/day – $38,000PV pumping system that provides1,000 GPD @ 50 feet <strong>of</strong> vertical lift in summer – $ 2,000PV pumping system that provides3,000 GPD @ 200 feet <strong>of</strong> vertical lift in summer – $12,000Parking lot light that operates all night(36-W compact fluorescent) – $ 3,500(All systems sized for Boulder, Colorado)• PV arrays, which convert light energy toDC electricity• Batteries, which store electricity for usewhen the sun is not shining• Battery charge controllers, which protectthe battery by preventing overcharge andover-discharge• Inverters, which convert DC to alternatingcurrent (AC)• Converters, which convert PV systemvoltage to a higher or lower voltage• Solar trackers, which optimize the solargain <strong>of</strong> the PV array by tracking the sunPV CellsPV cells are the basic building blocks <strong>of</strong> PVmodules. They are made <strong>of</strong> semiconductingmaterials, typically silicon, doped with specialadditives. Approximately1/2 volt is generated by each silicon PV cell.The amount <strong>of</strong> current produced is directlyproportional to the cell's size,conversion efficiency, and the intensity<strong>of</strong> light. As shown in the figure below, groups<strong>of</strong> 36 series-connected PV cells are packagedtogether into standard modules that provide anominal 12 volts (or 18 volts @ peak power).PV modules were originally configured in thismanner to charge 12-volt batteries. Desiredpower, voltage, and current can be obtainedby connecting individual PV modules inseries and parallel combinations in much thesame way as batteries. When modules arefixed together in asingle mount they are called a paneland when two or more panels are usedtogether, they are called an array. (Single panelsare also called arrays.)CellModuleThe Photovoltaic EffectSunlight is composed <strong>of</strong> photons—discrete units <strong>of</strong> light energy. When photons strike a PV cell,some are absorbed by the semiconductor material and the energy is transferred to electrons. Withtheir new-found energy, the electrons can escape from their associated atoms and flow as currentin an electrical circuit.PV arrays require no care other than occasional cleaning <strong>of</strong> the surfaces if they become soiled orare used in dusty locations. However, they must be kept clear <strong>of</strong> snow, weeds, and other sources<strong>of</strong> shading to operate properly. (PV cells are connected in series, so shading even one cell in amodule will appreciably decrease the output <strong>of</strong> the entire module.)PanelArrayLightenergyM75-B171303n-Typesemiconductorp-TypesemiconductorPhotovoltaic deviceElectricalenergy5
Figure 4. Schematic <strong>of</strong> a typical stand-alone PV system.• Engine generators (for hybrid systems),which provide backup power and powerfor charging batteries.Figure 4 shows how these componentsare interconnected in a stand-alone PV system.The function <strong>of</strong> each component isdescribed below.PV Array — The primary component <strong>of</strong>a PV system, it converts sunlight to electricalenergy; all other components simplystore, condition, or control energy use.Most PV arrays for stand-alone PV systems(not tied to the utility grid) consist <strong>of</strong>crystalline silicon PV modules that range insize from 50 to 80 peak watts. (Peak wattsare the rated output <strong>of</strong> PV modules at standardoperating conditions <strong>of</strong> 25°C and insolation<strong>of</strong> 1,000 W/m 2 .) PV modules are themost reliable components in any PV system.They have been engineered to withstandextreme temperatures, severe winds, andimpacts from 1-in. hail balls at terminalvelocity (55 mph). PV modules have a lifeexpectancy <strong>of</strong> 20–30 years and manufacturerswarranty them against power degradationfor 10–20 years. The array is usuallythe most expensive component <strong>of</strong> a PV system;it accounts for approximately one-thirdthe cost <strong>of</strong> a stand-alone system.Batteries — Because most applicationsrequire electricity when the sun is not shining,battery storage <strong>of</strong> electricity is usually6necessary. The batteries used in PV systemsare similar to automobile batteries, but arespecially constructed to withstand manydeep discharge cycles. (Current is providedfor extended periods.) Automobile batteriesare designed for shallow discharge cycles(to provide large currents for short periods),and are not suitable for PV systems.The two most common types <strong>of</strong> batteriesused in PV systems are flooded lead acidbatteries that require periodic maintenance(addition <strong>of</strong> distilled water and equalization),and valve-regulated lead acid batteries,which are "maintenance-free." Toreduce the maintenance frequency requiredby flooded batteries, catalytic recombinercaps can be used. These caps recombine thehydrogen and oxygen gases emitted by thebattery cell into water that is returned to thebattery.The batteries are usually the second mostexpensive components in stand-alone PVsystems and have the shortest lifetimes (typically3–7 years). Therefore, battery replacementcosts (as well as other componentreplacement costs) must be carefullyaccounted for when PV systems are comparedto other power alternatives.PV-powered water pumping is one <strong>of</strong> thefew applications that does not require batterystorage. Instead, water is pumped andstored in large tanks for use at night andduring periods <strong>of</strong> little or no sunshine.Charge Controllers — Just as an automobileuses a voltage regulator to controlthe charging voltage to the battery, a similartype <strong>of</strong> controller is used in PV systems toavoid overcharging the batteries. PV chargecontrollers limit the current from the PVarray to the batteries once the batteries reacha full state <strong>of</strong> charge (at a preset voltage).Most charge controllers also include a featurethat disconnects the electrical load fromthe batteries when they reach a low-voltageset point. This feature is also usuallyincluded with inverters.Inverters — PV arrays and batteries aretypically configured to provide 12, 24, or 48volts <strong>of</strong> DC power. However, many applicationsrequire 120 or 240 volts <strong>of</strong> AC power.DC is converted to AC with a separate componentcalled an inverter. Inverters enablethe operation <strong>of</strong> commonly used equipmentsuch as household appliances, power tools,computers, <strong>of</strong>fice equipment, and motors.The nature <strong>of</strong> an AC load determines thetype <strong>of</strong> inverter waveform needed. AC loadssuch as timers, clocks, laser printers, fluorescentlights, and some meters <strong>of</strong>ten havedifficulty operating on anything less thantrue sine-wave power. The power qualityspecifications <strong>of</strong> sensitive equipment mustbe well matched to inverter capabilities intype <strong>of</strong> waveform and in minimum and
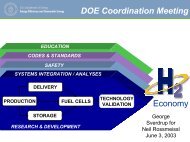
PV-Powered Water PumpingOne major application that differs significantly from most others is water pumping. Whether theyare for livestock or wildlife watering, potable water supplies or small-scale irrigation, PV systemsdedicated to water pumping seldom include batteries or battery charge controllers becausewater storage is generally more economical than electricity storage. Instead, water is stored intanks, cisterns, or reservoirs large enough to handle the daily water requirement for 3 to 5 days <strong>of</strong>poor weather (depending on the location). Eliminating batteries reduces maintenance, systemcomplexity, and the need to purchase replacement batteries and charge controllers. The componentsin a PV pumping system include a PV array, a pump, and a special pump controller thatmatches thePV output voltage and current to the needs <strong>of</strong> the pump (especially during low sunlight conditions).PV-powered water pumping on a Colorado ranch.maximum acceptable voltage and frequency.Fortunately, most electrical equipment is nottoo demanding about power quality and willoperate with almost any inverter.In addition to providing AC power forloads, some inverters can also take AC inputfrom an auxiliary power source such as anengine generator and convert it to DC currentto charge the batteries. This capabilityis usually available with the larger, fullfeaturedinverters.Converters — Occasionally the voltageoutput <strong>of</strong> a PV array, battery, or inverter willnot match the voltage requirement <strong>of</strong> theload. When this occurs, converters are usedto step the DC voltage up or down to meetthe needs <strong>of</strong> the load.Trackers — Trackers optimize theenergy production <strong>of</strong> PV modules by facingthem toward the sun as it travels across thesky. This increases the effective length <strong>of</strong>the solar day by about 40% during thesummer and decreases the number <strong>of</strong> PVmodules necessary to collect the sameamount <strong>of</strong> energy. However, trackers withtheir moving parts add to the complexity <strong>of</strong>a PV system and can be expensive. As a rule,trackers do not gain enough energy duringthe winter (especially in northern climates)to pay for their added expense. How-ever, ifa load's energy requirements are highest insummer, a PV array mounted on a solartracker may be the least expensive option.Engine Generators — When an enginegenerator is paired with a PV array asenergy sources for a power supply, theresulting system is called a hybrid PV generatorsystem or simply hybrid system. Ahybrid system <strong>of</strong>ten provides a power solutionwith a lower initial cost, lower cost <strong>of</strong>energy, more flexibility, and more reliabilitythan a PV system or generator alone. A generatorcan provide backup energy when thesun doesn't shine or for times when moreenergy or power is required. Because thePV array and battery need not provide allthe energy, they can be sized smaller to saveK.C. Electric/PIX03396on initial costs. Hybrid systems can bedesigned to provide any mix <strong>of</strong> energy fromthe PV system and generator, but the mostcommon practice is to size the PV array toprovide 60%–90% <strong>of</strong> the required annualenergy; the generator can make up the difference.Minimizing generator run time cutsdown on required fuel and maintenance.(Generators are notorious for their highmaintenance requirements.)Most inverters available today includecircuitry that allows the power from thegenerator to be transferred to the load withpart <strong>of</strong> it used to charge the batteries. Manyinverters also have automatic generator startcapabilities. This feature automatically turnson the generator to charge the batterieswhen they reach a low state <strong>of</strong> charge (lowvoltage).Prepackaged versus Custom-DesignedSystemsWhen PV systems were less availablethan they are today, most installed systemswere custom designed and specified foreach application. The PV array was typicallymounted on the ro<strong>of</strong> if there was aconvenient structure on site, and the batteriesand other components were housedindoors or in a custom-built enclosure. Thisapproach ensures that the PV system exactlysuits the needs <strong>of</strong> the application, but thetime and effort required for each customdesign adds to the cost <strong>of</strong> the system.Installation is also more complicated whenthe system needs to be assembled and wiredon site and integrated into a structure.This approach is still important for verylarge applications, applications with nontypicalloads, or systems that need to beintegrated into structures for aesthetics, butprepackaged systems are available today tomeet the needs <strong>of</strong> most applications. Thesesystems are typically preassembled andpre-wired with all components (except thearray) housed in a weatherpro<strong>of</strong> enclosure.The array is usually mounted either on theenclosure or on a pole or rack adjacent to it.See Figure 5 for an example <strong>of</strong> a packagedPV system. Packaged systems for specificapplications such as outdoor lighting orwater pumping also include the load (lampand luminaire or water pump).Because system manufacturers haveexperience integrating, assembling, andwiring their standard packaged systems,they are more likely to have any "bugs"worked out. And because the packagedsystems are sold as a complete product,7
Figure 5. An example <strong>of</strong> a packaged PV-powered system by SunWize <strong>Energy</strong>.the manufacturers are usually willing towarranty the function <strong>of</strong> the entire systeminstead <strong>of</strong> passing through componentwarranties.Benefits• Increased siting flexibility — Load sitingis not limited by the availability <strong>of</strong>grid power, utility easements, or difficult-to-accesslocations.• Decreased installation lead time —When a utility line does not have to beconstructed, there is no need to obtainutility easements, and building permitsare seldom required for small PV systems.There is less disruption <strong>of</strong> the land,so environmental impact studies are simplified(if required at all). In addition,packaged PV systems are readily available;shipping lead times range from nextday to 6–8 weeks, depending on the supplierand the type and size <strong>of</strong> system.• Installations cause fewer disruptions —No heavy construction equipment (utilityline trucks, trenchers, pole setters) isrequired for installation, so there is lessimpact on the land. Also, traffic is notdisrupted by stringing power lines acrossroads or pathways and there is much lessconstruction noise.• Improved aesthetics — PV systemseliminate the need for overhead powerlines that interfere with scenic views orclutter facility grounds.• Increased reliability — When the availableelectric service is prone to disruptions,PV systems can be designed to bemore reliable for critical applicationssuch as emergency warning sirens andsecurity lighting.• Portability — PV systems can bedesigned to relocate easily and can beused for temporary applications andemergency power.• Progressive "green" image —Environmental degradation is becominga growing concern. Electric utilities havefound that customers are willing to paymore for renewable energy, which PVsystems visibly use.VariationsThree types <strong>of</strong> PV cells are manufacturedand assembled into commercially availablemodules: single-crystal silicon, polycrystallinesilicon, and amorphous cells(includes silicon and cadmium telluride).Modules made with the single-crystal andpolycrystalline silicon cells are most commonlyused in stand-alone PV systems.Amorphous modules can be used, but theyPV Services Network/PIX04576are used mostly for consumer products suchas calculators, watches, flashlights, walklights, and battery chargers. In the UnitedStates, 91% <strong>of</strong> the PV modules manufacturedare crystalline; the rest are amorphoussilicon, cadmium telluride, ribbon silicon,and concentrator modules.Concentrator modules are simply highefficiencyPV cells housed under concentratinglenses that focus a large area <strong>of</strong>sunlight onto a small area <strong>of</strong> cell. This technologymay reduce the cost <strong>of</strong> electricity bysubstituting lower-cost lens and housingmaterials for the more expensive PV cells.However, concentrator modules requireaccurate tracking mechanisms to keep thesun focused on the small PV cell area andare not commonly used for stand-alone PVapplications.InstallationThe installation <strong>of</strong> PV systems can varygreatly depending on the application, thesize <strong>of</strong> system, and whether the systemarrives packaged and preassembled or asseparate components that need to be integratedinto a structure on site. Because thepackaged systems are almost completelyassembled and pre-wired, usually all that isrequired is to set the component enclosureon a pole, simple foundation, or levelground, mount the PV array to the enclosure,and wire it to the rest <strong>of</strong> the system.This can take as little as 2–4 hours for smallsystems (such as outdoor security lighting,livestock water pumping, communications,and traffic warning flashers). Installing largesite-integrated systems (such as generatorhybrid systems to power NPS visitor facilities)can take several weeks and have specialrequirements for foundations andstructures to house the equipment.Regardless <strong>of</strong> type or size, each systemhas very specific requirements for array siting.The array must be installed in a locationthat is free <strong>of</strong> shadows during peaksunlight hours. As a rule for a fixed PVarray (without a tracker), those hours arefrom 9:00 a.m. to 3:00 p.m. (solar time).The sun may shine before and after thesehours, but it is either too low in the sky toprovide much energy (during the winter) ortoo far north to shine directly on the array(during the summer).8
Federal-SectorPotentialPV technology has been assessed by theNew Technology Demonstration Program ashaving significant potential for cost savingsin the Federal sector.Technology Screening ProcessNew technologies were identifiedthrough advertisements in the CommerceBusiness Daily and trade journals and directcorrespondence. Responses were obtainedfrom manufacturers, utilities, trade associations,research institutes, Federal agencies,and other interested parties. Based on theseresponses, the technologies were evaluatedin terms <strong>of</strong> potential Federal-sector energysavings and procurement, installation,and maintenance costs. They were alsocategorized as either just coming to market("unproven" technologies) or as technologiesfor which there are already field data("proven" technologies).The energy savings and market potentials<strong>of</strong> each candidate technology were evaluatedby Pacific Northwest National Laboratorywith a modified version <strong>of</strong> the Facility<strong>Energy</strong> Decision Screening s<strong>of</strong>tware tool,developed for the U.S. <strong>Department</strong> <strong>of</strong><strong>Energy</strong>'s (DOE) Office <strong>of</strong> Federal <strong>Energy</strong>Management Program (FEMP), the U.S.Army Construction Engineering ResearchLaboratories, and the Naval FacilitiesEngineering Service Center.Laboratory PerspectivePV is a valid and proven technology thatthe U.S. government is committed to supportvia assistance to PV users and manufacturers.Sandia's PV Design AssistanceCenter (PVDAC) in Albuquerque, NewMexico, is a national resource for informationabout PV systems. Established in 1984as part <strong>of</strong> DOE's National PhotovoltaicProgram, the center is involved in allaspects <strong>of</strong> PV system design, procurement,installation, and evaluation. Its engineersprovide information about the costeffectivenessand reliability <strong>of</strong> PV systemsgained from evaluating system componentsand operating systems. With cooperationfrom the PV industry, the center promotesthe acceptance <strong>of</strong> a mature (if somewhatunfamiliar) technology.The National Renewable <strong>Energy</strong>Laboratory (NREL), which has recentlybeen designated as the site for the NationalCenter for <strong>Photovoltaics</strong>, is the counterpartto the PVDAC for PV assistance andresearch on the cell and module levels.NREL's scientists and engineers help lowerPV costs and improve performance and reliabilityby developing prototype PV cells;improving cell efficiency (the amount <strong>of</strong>sunlight the device converts to electricity);testing solar cell and module performance,and helping industry develop better, lessexpensive manufacturing technologies. Whileworking with PV manufacturers, NREL hashelped participating companies reduce manufacturingcosts by almost 50%. The goal <strong>of</strong>NREL's PV assistance is to help commercializethe technology by improving moduleefficiencies and bringing PV costs down.ApplicationThis section addresses the technicalaspects <strong>of</strong> applying PV, which includescreening potential applications for costeffectivenessand the locations where PVmay best be applied. Also covered are PV'sadvantages and limitations, equipment andinstallation costs, procurement, maintenanceimpacts, relevant codes and standards, andutility PV service programs.Application ScreeningPV systems can be designed to powerany electrical load regardless <strong>of</strong> size or locationas long as sunlight is available. The primaryreason more PV systems are not usedis cost. The economic feasibility <strong>of</strong> using aPV system to power a specific load is determinedby three primary factors:• The size and nature <strong>of</strong> the load• The availability <strong>of</strong> the solar resource• The cost <strong>of</strong> power alternatives.Size and Nature <strong>of</strong> LoadThe size and nature <strong>of</strong> an electric loadmust be well understood to properly select apackaged PV system or to design and specifya custom system. Whether the systemselection/design function is being performedby Federal facility personnel, PV designcontractors, or PV system suppliers, theload's power and energy requirements, andits daily and yearly schedule <strong>of</strong> operation,must be properly assessed.The magnitude <strong>of</strong> the load (power andenergy) is <strong>of</strong>ten difficult to pin down,especially for larger applications that arecomposed <strong>of</strong> multiple loads with variableoperation schedules (such as residences andranger stations). For any application, boththe maximum power needed at any onetime (W) and the maximum daily energyrequirement (kWh) must be known. Themaximum power requirement determinesthe size <strong>of</strong> inverter needed for AC applicationsand the system wire sizes.The daily energy requirement and theavailability <strong>of</strong> the solar resource during eachseason <strong>of</strong> use determine the size <strong>of</strong> therequired PV array. The daily energy requirementis simply the load's instantaneouspower requirement in watts multiplied bythe number <strong>of</strong> hours it operates each day.(load W x hours = load watt-hours [Wh]).The daily energy requirement, the requiredavailability <strong>of</strong> the load, and the nature <strong>of</strong>local weather patterns (typical number <strong>of</strong>days without sunshine) determine the size<strong>of</strong> the battery bank.If a load is operated 24 hours per day,365 days per year (as with water flowmeters),the energy and power requirementsare constant and easy to calculate. However,few loads are that simple. At the otherextreme, large applications such as NPS visitorfacilities usually require pr<strong>of</strong>essionalenergy audits to properly assess the load.The purposes <strong>of</strong> the audit are to accuratelyassess the current energy and power requirements,and identify means <strong>of</strong> reducingelectrical energy use.For loads between these two extremes,worksheets can be used to estimate theload's daily energy consumption. For moreinformation on load calculation and a samplecalculation, see the box on page 12.Availability <strong>of</strong> Solar ResourceAnother factor that influences the size<strong>of</strong> the array (and the cost <strong>of</strong> the system) isavailability <strong>of</strong> the solar resource. Althoughcost-effective PV systems are beinginstalled everywhere in the United States,they are economically feasible most <strong>of</strong>tenwhere there is an abundance <strong>of</strong> sunshine.PV modules convert sunlight to electricity,so fewer PV modules are required whenmore light energy is available.For example, a small PV systemdesigned to operate two 36-W lamps for8 hours each evening would require two60-W PV modules in Tucson, Arizona,but would require four 60-W modules inMadison, Wisconsin. That's because thelowest average daily solar insolation inTucson is 5.6 kilowatt-hours per squaremeter (kWh/m 2) versus 2.8 kWh/m 2 in9
Madison (in December on a surface at latitude+15º tilt). At approximately $6/W forPV modules, the lighting system in Madisonwould cost at least $720 more.Figure 6 is a map <strong>of</strong> the United Statesthat shows the average daily solar radiationincident on a surface that faces south andis tilted up from the horizontal at an angleequal to the latitude. As shown on the map,the Southwest receives much more insolation(solar radiation incident on an areaover time) than the East or Northwest. TheSouthwest also has a low utility grid density,which makes it an ideal location for<strong>of</strong>f-grid PV applications.The solar resource also varies by time <strong>of</strong>year, so PV systems for year-round applicationsmust be sized to provide enoughenergy during the time <strong>of</strong> lowest insolation(typically December in the continentalUnited States). If an application is usedonly during the warmer months (such asfor campground host trailers and livestockwatering pumps), a smaller PV system isrequired. As shown in Figures 7 and 8, theinsolation in any location in the UnitedStates can be 50%–100% greater in Junethan in December.For a more accurate assessment <strong>of</strong> theinsolation available in 239 locations in theUnited States, consult the Solar RadiationData Manual for Flat-Plate and ConcentratingCollectors, published by NREL. Asample page from the manual is shown inAppendix A.Cost <strong>of</strong> Power AlternativesThe third factor that determines the economicfeasibility <strong>of</strong> PV power is the cost<strong>of</strong> the power alternatives. In most cases, thefirst choice for power is a utility line connection.When utility power is not an optionbecause <strong>of</strong> high line-construction costs, PVsystems and other sources <strong>of</strong> power such asengine generators become more economicalin comparison. Factors that contribute tohigh line-construction costs include:• Long distance to the nearest utilitydistribution line• Unavailable utility easements• Roadways or parking lots that blockaccess or complicate construction• Steep or rugged terrain• Requirements for buried lines• Requirements for environmental impactstudies• Requirements for archeological studies.Figure 6. Map <strong>of</strong> average daily global solar radiation on a south-facing flat surface atlatitude tilt.Figure 7. Map <strong>of</strong> average daily global solar radiation in June on a south-facing flatsurface at latitude tilt.Figure 8. Map <strong>of</strong> average daily global solar radiation in December on a south-facingflat surface at latitude tilt.10
The actual cost for a line extension to aparticular load can be obtained from thelocal utility company. Many utilities also<strong>of</strong>fer PV service as an alternative to uneconomicalline extensions and may be able toprovide cost estimates for PV systems.Engine generators are popular when lineextensions are not feasible. Although generatorshave a relatively low initial cost comparedto PV systems, they have a number <strong>of</strong>disadvantages:• They require frequent and regular maintenance(oil changes, tune-ups, andrebuilds).• Fuel must be transported and storedon-site.• They produce air emissions.• They are noisy.When these disadvantages and maintenanceand fuel costs are taken into account,engine generators are not the bargains theymay initially seem.Load Reduction<strong>Energy</strong>-saving measures and switchingheating loads to propane or other fuels are<strong>of</strong>ten used in conjunction with PV systemsto reduce the size <strong>of</strong> electric loads sosmaller and less expensive PV systems arerequired. One easy energy efficiency measureis to change incandescent lightbulbs tocompact fluorescents, which use approximatelyone-fourth the energy to produce thesame amount <strong>of</strong> light and last 10 times aslong.Another important measure is to eliminate"ghost loads" (small loads that are notobvious users <strong>of</strong> electricity). Because theyare on 24 hours per day, ghost loads canconsume quite a bit <strong>of</strong> energy. Examples <strong>of</strong>ghost loads include remotely controlledappliances, equipment with small plug-intransformers, and equipment with lightemittingdiode clocks and displays. Otherefficiency measures include using energyefficienttools and appliances (pumps,motors, and refrigerators) and simply turning<strong>of</strong>f appliances when they aren't beingused. Another way to save electricity is toswitch large heating loads such as waterheaters, furnaces, and stoves to other fuelsources. These fuels (propane or oil) canprovide heat at a much lower cost than a PVsystem and may be used to fuel a backupengine generator.In some cases, special DC lights, equipment,and appliances are used to improvesystem efficiency and reduce the size andcomplexity <strong>of</strong> systems by eliminating theneed for inverters.Economic AnalysisOnce you have assessed the size <strong>of</strong> anapplication's electric load, you can obtaincost estimates for PV power systems fromPV suppliers. These suppliers have solarinsolation data available for most locationsin the United States and can size and cost aPV system for specific load and local insolationlevels. Most PV system suppliers canalso size and provide estimates for PV/generatorhybrid systems if they appear to begood options.Engine generator suppliers can providecost estimates for generators to handle yourload and provide guidelines for estimatingfuel consumption and maintenance costs.After you have determined the costs forall power alternatives, you should performan LCC analysis that compares the options.LCC analysis calculates the present value <strong>of</strong>the initial investment, operations and maintenance(O&M) costs, replacement costs,and energy/fuel costs, minus salvage value<strong>of</strong> replaced parts. For more information onLCC see Appendix C. An LCC manual(National Institute <strong>of</strong> Standards and Technology[NIST] handbook 135), an annualset <strong>of</strong> prescribed energy prices and discountrates (NISTIR 85-3273), and building lifecyclecost (BLCC) s<strong>of</strong>tware (NIST 4481)are all available by calling the FEMP HelpLine at 800.DOE.EREC. (Some agenciesallow simpler life-cycle calculations, butthe BLCC is required if FEMP funding isinvolved.)Although standard LCC analysis doesnot include a way to take credit for environmentalexternalities such as benefits <strong>of</strong>reducing fossil fuel consumption, these maybe important considerations if the economicefficiency calculation is close. NPS hasdeveloped guidelines for calculating andincluding avoided air emissions that resultfrom reduced electrical power production inits internal economic evaluation <strong>of</strong> largeenergy projects. Some agencies have chosento relax the economic evaluation criteriasomewhat for showcase buildings in newfacilities or demonstration projects at currentfacilities. Projects must be basicallycost effective, however, or they do not makegood demonstrations.Where to ApplyThere are cost-effective PV applicationseverywhere. One key to finding them is toalways consider the PV alternative beforeconstructing a line extension or installingan engine generator. This is possible only ifthose in charge <strong>of</strong> providing electric utilitiesare educated on PV's capabilities and limitations.The following situations indicatepossible cost-effective PV applications:• When small loads are located in remoteor difficult-to-access sites• Where long power lines to small loadsneed to be rebuilt• Where only high voltage transmissionlines are available (large step-downtransformers are very expensive)• Where utility line construction is verycostly due to terrain, lack <strong>of</strong> easements,stringent building codes, or environmentallysensitive locations• Where engine generators are currentlybeing used• Where stringent air quality, fuel transportation,or noise regulations preventthe use <strong>of</strong> engine generators• In difficult-to-access locations wheredelivery <strong>of</strong> fuel for generators is aproblem• Where old livestock-watering windmillsneed to be replaced• Where water has to be hauled for livestockor wildlife• Where an application needs to beportable or temporary.What to AvoidThe following are situations where PV isless likely to be cost effective:• Locations without good access to sunlight(in forests, canyons, and ravines; onnorth slopes <strong>of</strong> steep hills and mountains;on the north sides <strong>of</strong> large buildings)• Applications with large heating loads thatcannot be easily switched to other fuels• Applications with large air-conditioningor refrigeration loads• Applications in northern states with loadsthat peak during the winter.Maintenance ImpactPV systems by themselves (withoutengine generators) require very little maintenance.Typically only a visual inspection <strong>of</strong>the system and simple battery maintenanceare required if flooded batteries are used.11
Calculating the Daily LoadThe first step in selecting or designing a PV system is to determine theload's daily energy requirement. That involves thefollowing steps:• Identify all the electrical devices that will rely on the PV system forpower.• Determine each device's power usage (in watts).• Estimate the average hours each device is used each day.• Multiply each device's wattage by the daily hours <strong>of</strong> use to obtain itsdaily energy requirement (watt-hours).• Sum the watt-hours for all devices to get the total daily energyrequirement.An example <strong>of</strong> this calculation for a small home is shown below.If the energy requirement varies from season to season, itmust be calculated for each season to determine the largest requirementrelative to the available insolation (solar radiation incident on an areaover time). Residences tend to use more energy during the winter whenthe days are shorter, because lights and other appliances such as televisionsare on longer.The wattage <strong>of</strong> an electrical device is usually stamped or printedon a nameplate on the rear or bottom <strong>of</strong> the appliance. If the appliancelists VA (volts x amps) instead, that number approximates the wattage. Ifonly amps are listed, multiply the amps by the voltage to find theapproximate wattage (e.g., 3 amps x 120 volts = 360 watts). Nameplateratings are generally maximum design limits <strong>of</strong> the device, which couldbe two to four times the actual power consumed. Whenever possible,measure (or havea technician measure) the actual power consumption <strong>of</strong> every electricaldevice to be used.For a blank load calculation worksheet see Appendix B.ExampleAppliance Watts Daily Hours <strong>of</strong> Use Daily Watt-HoursFluorescent light (shop light with [2] 40-W tubes) 80 x 3 = 240Compact fluorescent lights (2) 18 W each 36 x 6 = 216Compact fluorescent light 11 x 6 = 66Incandescent light 60 x 2 = 120Microwave oven 1,200 x 0.25 = 300Refrigerator (19 cf super efficient) 64 x 12 = 768Water pump (1/2 hp centrifugal) 1,280 x 0.5 = 640Vacuum cleaner (3/4 h/wk) 800 x 0.1 = 80Washing machine (2 loads/wk) 920 x 0.2 = 184C<strong>of</strong>fee maker (4 cup) 625 x 0.167 = 104Computer (486 with color monitor) 160 x 2 = 320Printer (inkjet) — Printing 30 x 0.25 = 7Printer (inkjet) — IDEL (ghost load) 16 x 1.75 = 28Television (19” color with remote) — TV on 58 x 4 = 232Television (19” color with remote) — TV <strong>of</strong>f (ghost load) 6 x 20 = 120VCR 25 x 2 = 50Total Daily <strong>Energy</strong> Requirement — 2,844 WhWhether a PV system adds to the maintenanceburden <strong>of</strong> a facility or applicationdepends on the power supply.From the user's perspective, utility lineextensions require no maintenance. (Theutility's perspective is another matter.)Compared to utility power, PV systems takea little more effort. How much effortdepends on the specifications <strong>of</strong> the system,but most small PV systems typically take nomore than 2 to 4 hours each year. If the PVsystem uses maintenance-free batteries, themaintenance is usually limited to visuallyinspecting and testing the system output.However, compared to engine generators,PV systems represent a great saving inmaintenance time and effort. The maintenancefactor is quite <strong>of</strong>ten the reason for PVsystems being chosen instead <strong>of</strong>, or in conjunctionwith, generators.When PV systems are paired with generatorsin hybrid systems, the generator maintenancerequirements are greatly reducedbecause the intervals for generator oilchanges, tune-ups, and rebuilds are directlyrelated to the hours <strong>of</strong> generator run-time.Instead <strong>of</strong> running 24 hours per day, whenpaired with a PV system, a generatorusually operates for only a few hours perday or week, depending on the systemdesign.In addition to cutting generator maintenancerequirements, PV systems improvetheir operating efficiencies. Generators inhybrid systems are usually turned on onlywhen batteries need supplemental charging(a large load), so the generators are almostfully loaded whenever they are turned on.This optimizes the generator's fuel efficiencyand reduces emissions relative to theenergy produced.12
Following is a partial list <strong>of</strong> maintenanceactivities that may be performed on PVsystems.• Inspect the PV array surface for excessivedirt or debris. (A thin layer <strong>of</strong> dustis not a concern.) If the surface needscleaning, a gentle rinse with plain wateror mild detergent is recommended.• Inspect the array for damaged modulesor shading by trees, weeds, and otherobstructions.• Measure the array output current andvoltage to verify proper operation.• Seasonally adjust the PV array tilt angleto optimize energy output (cost effectivefor larger systems only).• Inspect the battery for corroded terminals.Clean the terminals if required.• Add distilled water to flooded batteriesif the electrolyte level is low.• Measure the battery voltage to verifystate <strong>of</strong> charge.• Inspect trackers to verify proper tracking<strong>of</strong> the sun.• Inspect the entire system for loose ordamaged wiring.PV systems with maintenance-free batteriesshould be inspected approximatelyonce each year. However, to cut down onmaintenance costs for small noncriticalapplications (such as pathway lighting),some agencies simply allow the PV systemsto run until they fail and then replace allworn-out components. Others schedulemaintenance visits only when the batteriesor short-lived loads such as lamps areexpected to need replacement.PV systems with flooded batteries shouldbe inspected every 3 to 6 months to ensurethe electrolyte levels are maintained. However,batteries with catalytic recombinercaps or extra-large electrolyte reservoirsmay operate for as long as a year betweenmaintenance visits.Equipment WarrantiesPV modules currently carry 10- to 20-year manufacturer warranties against degradation<strong>of</strong> power output. The other electroniccomponents (inverters and charge controllers)typically carry 5-year warranties.Batteries, because <strong>of</strong> their variable uses(or abuses), typically only have 1-yearwarranties.For complete packaged systems, the systemmanufacturers will <strong>of</strong>ten warranty theoperation <strong>of</strong> the entire system for as long as2 years and have some optional extendedwarranties available.Codes and StandardsPV systems can and should be designedand installed to provide years <strong>of</strong> safe, reliableservice. Systems not installed safelycould result in fire, personal injury, andeven death. The National Electrical Code(NEC) was developed to ensure safe electricalsystems and addresses PV systems in aspecial section (section 690). This sectionspecifies the required wire sizes, fuses, disconnects,and other considerations thatmake a safe system possible. PV systemsshould be installed by qualified licensedelectricians who are familiar with NECrequirements.CostsThe cost <strong>of</strong> PV modules has steadilydeclined since the mid-1970s (when theycost more than $100/W) to less than $6/Wtoday. Efforts are currently under way byU.S. laboratories and PV manufacturers t<strong>of</strong>urther reduce PV module costs by makingmanufacturing processes more efficient andby introducing new, less expensive PVtechnologies.Lower-priced modules will help lowerPV system costs, but the impact on standalonePV systems will not be great becausePV modules account for only about onethird<strong>of</strong> the initial cost <strong>of</strong> these systems.(Batteries typically account for another thirdand the inverter and balance <strong>of</strong> systems thefinal third.) During the lifetime <strong>of</strong> a standalonePV system (about 20 years) the batteriesaccount for the greater part <strong>of</strong> systemcosts because they need to be replaced twoto three times.According to the current GSA schedulesfor PV equipment, crystalline PV modulesin the 50- to 120-W size range are availablefor $4.80 to $5.70/W, depending on themake and size <strong>of</strong> the PV modules. The costfor sealed maintenance-free batteries inthe 100- to 500-ampere-hour (Ah) size (at12 volts [V]) ranges from $1.50 to $5.25/Ah<strong>of</strong> capacity, depending on the make, type <strong>of</strong>technology, and size. Flooded-battery pricesare generally lower and average $1.50/Ahfor the 500- to 1,500-Ah size (at 12 V).Inverter prices range from $0.40 to $0.75/W<strong>of</strong> capacity, depending on the size, type <strong>of</strong>waveform, and available features.The GSA schedules also include complete,integrated, packaged PV powersystems that can be used for various applications.Prices average about $14/W formid-sized DC systems (100- to 600-W PVarrays) and $18/W for larger AC systems(900- to 1,800-W PV arrays).Some utilities have recently made largepurchases <strong>of</strong> grid-tied systems for as lowas $6/W installed, but these systems do notinclude batteries or charge controllers andthese prices are available for large-quantitypurchases only.Most PV system components are availablefrom suppliers within 1 to 2 weeksunless certain items are out <strong>of</strong> stock.Complete systems take longer for delivery(typically 4–8 weeks) because the supplierhas to assemble and test the systems.ProcurementFederal facilities have several options forprocuring PV systems. They include GSAschedules, electric utility companies, andthe Photovoltaic Services Network (PSN),energy savings performance contracting(ESPC), and traditional procurementthrough Requests for Quotes.The amount <strong>of</strong> PV equipment availablethrough GSA schedules has increased considerablyin the latest edition, which coversDecember 1, 1996, to November 30, 2001.In the schedule for PV equipment (class6117), eight suppliers now provide componentsthat range from PV modules to trackersto complete systems. The prices on theschedules are guaranteed to be the lowestfor the specific makes and models <strong>of</strong> theequipment <strong>of</strong>fered. Table 2 identifies theGSA PV equipment suppliers and the equipmentthey <strong>of</strong>fer. (Call each supplier toobtain a GSA PV products catalog.) If theequipment and systems on the schedulemeet your requirements, this is the moststraightforward means <strong>of</strong> procuring a PVsystem.If funding for capital equipment is notreadily available, the electric utility orESPC option may be more appealing.Electric utilities have begun to <strong>of</strong>fer servicessuch as equipment leases, financing, andsales <strong>of</strong> PV equipment. For a description <strong>of</strong>these services, see the next section, UtilityIncentives and Support.ESPC may soon become available toFederal facilities for PV projects. WithESPC, facilities pay the up-front costs fordetermining the economic feasibility <strong>of</strong> aPV project. If feasible, a private energy servicescontractor designs and installs the PV13
American SuncoBlue Hill, ME; 207.374.5700Applied Power CorporationLacey, WA; 360.438.2110Atlantic Solar Products, Inc.Baltimore, MD; 410.686.2500BP Solar, Inc.Fairfield, CA; 707.428.7800Photocomm, Inc.Scottsdale, AZ; 800.223.9580Siemens Solar IndustriesCamarillo, CA; 805.388.6389Solar Electric SpecialtiesSanta Barbara, CA; 805.963.9667Sunwize <strong>Energy</strong> Systems, Inc.Stelle, IL; 815.256.2222system; the costs <strong>of</strong> equipment and installationlabor are paid by the contractor orfinanced by a third party. The contractor isresponsible for all system O&M, staff training,and saving verification. Once the systemis installed, the contractor is paid apercentage <strong>of</strong> the facility's O&M savings fora specified contract period. After the periodis over, the facility retains all savings andequipment.The advantages <strong>of</strong> ESPC are: limited initialinvestment, no capital investment, noO&M responsibilities, and no technical orfinancial risk for the success <strong>of</strong> the project.However, monitoring and paperwork makeit unattractive for smaller projects that canbe funded in other ways.FEMP is now developing a Super ESPCprogram for Federal facilities. ContactFEMP for details.Utility Incentives and SupportElectric utility companies have begun torecognize that constructing or maintainingline extensions to every small load does notmake economic sense for them or for theircustomers. The customer may be willing topay the initial high cost for line construction,but small loads <strong>of</strong>ten do not generateenough revenue in electricity sales to coverthe utility's cost for line maintenance. In thecase <strong>of</strong> rural utilities that serve remoteloads, the lines that were built during the eraTable 2. GSA suppliers and equipmentCompleteSystemsPV ModulesComponentsBatteriesChargeControllersInvertersTrackers<strong>of</strong> rural electrification are now aging andneed to be repaired or replaced. Many linesthat once served ranches and farmsteadsnow serve only a stock watering pump orother small loads. Also, many publiclyowned utilities, such as rural electric cooperatives,still have generous line extensionpolicies that do not charge the customer thefull cost for new line construction.When small loads do not generateenough revenue to cover the cost <strong>of</strong> lineconstruction or maintenance, the entire customerbase pays the difference. Utilitieswant to serve their customers as equitablyand cost effectively as possible, so some<strong>of</strong>fer PV-based electric services when linetiedpower doesn't make sense. Also, in thisera <strong>of</strong> utility deregulation and increasedcompetition, PV is viewed as a service thatpromotes customer loyalty.PV customer service programs vary fromutility to utility, but two basic options areusually <strong>of</strong>fered: (1) PV system leases; and(2) direct sales. With the lease option, thecustomer is usually billed a monthly chargethat covers the cost <strong>of</strong> PV equipment, regularmaintenance visits, and replacementcomponents. This option <strong>of</strong>fers the customeran easy way to become familiar with PVtechnology without making a large up-frontinvestment.For the same reason, leases may workfor Federal agencies that have an immediateneed for PV systems but inadequate capitalto purchase them. Facilities that do not wantthe responsibility <strong>of</strong> PV system maintenancemay also decide to exercise this option.The second option, sales, is <strong>of</strong>ten <strong>of</strong>feredbecause there may be no PV system suppliersin the area or because customers preferto obtain PV systems from their own utility.If either option is <strong>of</strong> interest to you, callyour local utility and ask whether it <strong>of</strong>fers aPV program. If it does not, other utilities inthe region may be able to help you becausePV represents "service without a wire," andutility PV programs are not necessarily limitedto their traditional service territories.The goal <strong>of</strong> two utility organizations,PSN and the Utility PhotoVoltaics Group(UPVG) is to promote and support the use<strong>of</strong> PV by utilities. These organizations haveutility members throughout the UnitedStates who are interested in implementingPV services and projects, and they may beable to help you locate a regional utility that<strong>of</strong>fers PV. Also, PSN may be able to providePV system financing and sales directly onbehalf <strong>of</strong> its member utilities if a local utilitycannot. For the phone numbers and contactpersons <strong>of</strong> these two organizations, seethe Organizations subsection on page 23.Separate from cost-effective, <strong>of</strong>f-gridapplications, some utilities <strong>of</strong>fer PV systemsbecause their customers want renewableenergy and are willing to pay for it.Therefore, some utilities <strong>of</strong>fer grid-tied PVsystems for a cost beyond what customerswould usually pay for electricity. These systemsuse "green" power very visibly andmake good demonstrations projects forschools, parks, libraries, and other publicfacilities.Building-Integrated PhotovoltaicSystemsBuilding-integrated photovoltaic (BIPV)systems incorporate solar electric arraysdirectly into a building envelope. BIPVenables a building to generate its ownenergy, and its arrays can be designed as acurtain wall and to generate electricity, sothey are considered multifunctional buildingcomponents.For BIPV to be economically feasible,the following issues must be considered:• For residential systems, BIPV systemsmust be able to sell back to the utility ator near the customer cost <strong>of</strong> power,rather than at the utility avoided cost.14
• Variations in commercial rate structuresmust be defined.• Some high-value niche markets, such asstrained areas <strong>of</strong> the utility grid andselected sloped glazing and skylight systems,can be cost effective in the nearterm.• The PV industry, DOE, and the publicutility companies should work togetherto evaluate BIPV benefits.TechnologyPerformanceSandia has conducted studies <strong>of</strong> PVsystem use in three Federal agencies—NPS,the BLM, and the Forest Service. Theirobjectives were to:• Identify and characterize PV systems byapplication• Assess acceptance and satisfaction withthe systems• Identify barriers to PV system use• Identify potential applications.The results <strong>of</strong> these studies are reportedin Renew the Parks, Renew the PublicLands, and Renew the Forests. Some resultsare summarized below.Field ExperienceAs part <strong>of</strong> the studies, facilities with PVsystems were asked to identify the ages <strong>of</strong>the systems, and to evaluate each systemcomponent and the system as a whole.Table 3 shows the approximate ages <strong>of</strong> thePV systems at the time the studies wereconducted.In the NPS study, responses indicatedthat 97% <strong>of</strong> the systems met their use objectives.Problems associated with the remaining3% included:• Operating errors (turning <strong>of</strong>f the systemsduring the winter)• Poor design (insufficient charging capacityor battery storage)• Component failure• PV panel theft or vandalism.Component problems reported by theparks include battery problems (19 systems),PV panel problems (10 systems), andcontroller problems (8 systems).There was no correlation between theages <strong>of</strong> the troubled systems and the problemsthey were experiencing. Most problemswere evenly distributed between theTable 3. Ages <strong>of</strong> PV systems identified by three Federal agenciesAgency Less than 2–5 years 5–10 years Older than2 years 10 yearsNPS 23% 28% 34% 15%Forest Service 19% 49% 14% 19%BLM 42% 26% 17% 15%2- to 4-year and 5- to 9-year categories.Only three systems less than 2 years old hadany problems.In the Forest Service study, overall satisfactionwith the systems was higher than98%. Of the 2% unsatisfactory systems, theproblems focused on panels and batteries;most resulted from theft and vandalism.Proper siting and security measures such asfencing and vandal-resistant hardware wereresponsible for the low theft and vandalismrate. Battery performance and accurate loadcalculations, which are critical for propersystem sizing, appear to be the main factorsin the few deficient systems identified.There were few reports <strong>of</strong> significantdamage to the Forest Service PV systems,but weather appears to be the greatestsource. Most damage can be prevented orminimized with properly designed arraysupports and inclination, component insulationand heating, and proper grounding.MaintenanceNPS facilities staff were asked abouttheir annual PV system O&M costs. Whendivided into three categories, their responseswere as follows:• 39%—less than expected or none• 60%—as expected• 1%—more than expected.The following responses were receivedfrom the BLM:• 12%—no O&M costs• 34%—less than expected• 50%—as expected• 4%—more than expected.As seen from these responses, PV systemmaintenance was much less <strong>of</strong> an issue thaninitially expected.BarriersThe other significant finding <strong>of</strong> the threestudies constituted the perceived barriers tothe expanded use <strong>of</strong> PV systems.The single largest perceived barrier forNPS and the Forest Service and secondlargest for the BLM is the initial cost <strong>of</strong> PVsystems. PV systems generally have higherinitial installation costs than alternativessuch as engine generators, but they aremuch less expensive to operate and maintain.LCC analysis <strong>of</strong>ten favors PV. Toovercome this barrier, partnerships and costsharingarrangements can be formed withother groups and agencies such as DOE,NREL, Sandia, the U.S. EnvironmentalProtection Agency (EPA), environmentalgroups, and the PV industry. DOE's FEMPwas established to fund viable renewableenergy and energy and water conservationprojects undertaken by Federal agencies.The largest barrier to PV use for theBLM and second largest for NPS and theForest Service is lack <strong>of</strong> familiarity with PVby designers and operating staff; related tothis is uncertainty with PV's performancerecord. Technical training for design andmaintenance staff can help them understandPV technology with its advantages andlimitations. Training can also help staffrecognize potentially cost-effective PVapplications and provide sources for obtainingequipment, services, and assistance.The PV Systems Assistance Center atSandia can provide PV training andidentify classes and workshops.Other perceived barriers include vandalism,visual-quality concerns, conflicts withhistorical resource context, adverse climate,procurement restrictions and problems, andinability to locate contractors.Case StudyFacility DescriptionPinnacles National Monument inCalifornia is a popular destination for rockclimbers who take advantage <strong>of</strong> the park'slarge rock formations. Peak park visitationoccurs during the summer, althoughPinnacles is staffed and open to visitors yearround. The climate is mostly hot and drywith a good solar resource.15
The park facilities are in an agriculturalregion with many vineyards, and are located5 to 6 miles from utility power. Because thepark's power lines must be underground andbecause power line easements through thesurrounding territory are difficult to obtain,utility power was ruled out as being prohibitivelyexpensive.The park's facilities include:• A visitor contact station• An 18-unit campground with restroomfacilities• A ranger station• An information kiosk• Two ranger residences• A maintenance building.An energy audit conducted by Sandiarevealed the main electrical loads to bewater and effluent pumps, three old refrigerators,evaporative coolers, an air conditioner,a water heater, a cook stove, andmany incandescent lights. The energy usewas approximately 90 kWh/day.Conventional TechnologyDescriptionThe park's electrical needs were servedby two 60-kW diesel generators. To providecontinuous power, a generator had to be run24 hours per day, 365 days per year. Eachgenerator was cycled every 2 weeks somaintenance could be performed on theother. Because the generators are large, theelectrical load could not be reduced significantlywithout affecting generator operation(frequency and voltage). Therefore, to keepthe generator stabilized, dummy loads(numerous incandescent lights) had to bekept on 24 hours per day.Diesel fuel was delivered to the parkabout once each week by truck over15 miles <strong>of</strong> narrow winding access road.The possibility <strong>of</strong> a fuel spill was a concernbecause <strong>of</strong> frequent deliveries and the dangerousnature <strong>of</strong> the road during poorweather.The generators also diminished visitorand staff enjoyment <strong>of</strong> the park. Their noisecould be heard throughout the park, evenfrom the tops <strong>of</strong> rock formations. Staffreceived frequent complaints about thenoise.The diesel fuel for the generators cost thepark approximately $12,000 per year andmaintenance another $4,000. Also, the generatorsneeded to be replaced every 5 yearsat a cost <strong>of</strong> $50,000.New Technology (PV)DescriptionThe case study described here is anexample <strong>of</strong> a large PV/engine generatorhybrid system funded by NPS. This system,installed at Pinnacles National Monumentnear Salinas, California, provides power fora cluster <strong>of</strong> park facilities on an isolatedmini-grid. Originally powered by two dieselgenerators, the park converted to a PVhybrid system with a propane generator tosave on fuel and maintenance costs and toeliminate the possibility <strong>of</strong> a diesel fuelspill.Savings PotentialThe first step before sizing a PV systemwas to implement energy efficiency measuresto decrease the load. The refrigeratorswere replaced by super-efficient Sunfrostrefrigerators that require about 80% lessenergy. The single air conditioner wasreplaced with an evaporative cooler, and theold evaporative coolers were replaced withnewer, more efficient models. The electricwater heater and cook stove were replacedwith propane models, and all incandescentlightbulbs were changed to compactfluorescents.Water-saving measures such as lowvolumetoilets and shower and faucet flowrestrictors were used to decrease the volume<strong>of</strong> water and effluent that needed to bepumped. After these measures were implemented,the electrical energy use wasreduced to about 40 kWh/day.Once the size <strong>of</strong> the reduced load wasdetermined, the system requirements wereturned over to a PV systems supplier whodesigned and specified the PV/generatorhybrid system. The system included:• A 9.6-kW PV array with 160 SolarexMSX 60 modules• A 4,200-Ah battery bank with 12 GNBResource Commander flooded lead acidbatteries• A Kohler 20-kW propane generator• Six 4-kW Trace 4048 inverters• An Ananda APT 5-44-48 power centerwith two charge controllers.A specification for a PV system similarto the Pinnacles system is included inAppendix D.The PV hybrid system, all energy efficiencymeasures, and installation cost$150,000. The annual cost for propane fuelis approximately $1,500 per year, and themaintenance costs are about $750 per year.The batteries need to be replaced aboutonce every 8 years at a cost <strong>of</strong> $22,000.Life-Cycle CostWhen the capital investment and O&Mcosts <strong>of</strong> the two alternatives are entered intoFigure 9. The PV array mounted on the ro<strong>of</strong> <strong>of</strong> the maintenance building at PinnaclesNational Monument.National Park Service/PIX0492416
the 1998 BLCC program, the results showthat the PV system has a net saving <strong>of</strong>$146,711 for the 20-year study period.The savings-to-investment ratio (SIR) is4.51 and the adjusted internal rate <strong>of</strong> return(AIRR) is 12.24%. Simple payback occursin year 5, and discounted payback in year 6.For a printout <strong>of</strong> comparative LCC with theBLCC s<strong>of</strong>tware, see Appendix E.Implementation and Post-Implementation ExperienceThe PV array was mounted on the ro<strong>of</strong><strong>of</strong> the park maintenance building where theold generators were housed (see Figure 9).The rest <strong>of</strong> the components, including thenew generator, were installed inside thebuilding. The PV array provides all theenergy needed for 5 months <strong>of</strong> the year(from May through September), so the generatoris not used during those months.During the coldest winter months, the PVarray provides approximately 30% <strong>of</strong> therequired energy; the generator makes up thedifference. During those months the generatoroperates 2 to 3 hours a day to charge thebatteries.After the PV system was installed, thepark staff commented on how many birdsthere were in the park. The birds had alwaysbeen there, but the staff hadn't noticed thembecause they couldn't be heard over thenoise <strong>of</strong> the old generators.Case StudyFacility DescriptionMeadows Group and Buffalo Creek areunstaffed Forest Service campgrounds nearthe Colorado Trail, a popular hiking destination.Facilities are limited to water, toilets,picnic tables, and fire pits at each campsite.The average daily water requirementsfor the two campgrounds are supplied bya single well located at Meadows Campground.The well is 80 feet deep; the staticwater level (when the well isn't beingpumped) is 50 feet below the ground surface.The water level drops another 10 to15 feet while the well is being pumped. Thewater is piped a short distance from the wellto a water meter housed in a small shed andthen piped uphill (about 75 feet <strong>of</strong> elevationgain) to a 1,000-gallon storage tank. Pipingfrom the tank gravity feeds faucets at thetwo campgrounds.The pumping head was calculated asfollows:Static water level50 ftWater drawdown15 ftDischarge head to tank75 ftTotal pumping head140 ftConventional TechnologyDescriptionThe water was originally pumped with asubmersible AC well pump powered by a4-kW gas-fueled generator. Forest Servicestaff from the nearby Buffalo Creek workstation visited the campground about onceevery 3 days to fuel and start the generator.Once started, the generator could be left torun until it ran out <strong>of</strong> gas, or it was switched<strong>of</strong>f automatically when the water tank filled.A full gas tank (5 gallons) could pumpabout 500 gallons <strong>of</strong> water. The 5-mile drivebetween the work station and the campgroundover a rough gravel road takes about30 minutes each way, and the generator isoperated for 30 minutes, for a total <strong>of</strong> 1 1 / 2hours <strong>of</strong> staff time per visit.Forest Service staff changed the generator'soil about every other week and performeda tune-up once each season. The oilchanges took 15 minutes and 2 quarts <strong>of</strong> oil.The tune-ups took approximately 2 hours.The generator was replaced once every 5years at a cost <strong>of</strong> about $1,500. The averagerate for staff time is about $50/hour.New Technology (PV)DescriptionThis is an example <strong>of</strong> a PV-poweredpumping system used to pump water for twocampgrounds in the Pike National Forestnear Denver, Colorado. The pumping systemprovides Meadows Group and BuffaloCreek Campgrounds with potable water duringthe summer camping season (mid-Mayto mid-September). The original generatorpoweredpumping system was replaced withthe PV pumping system to save on operatinglabor and maintenance.The engineering staff <strong>of</strong> the regionalForest Service <strong>of</strong>fice worked on the plansand requirements for replacing the pumpingsystems and specifying the new equipment.Before the PV pumping system wasselected, the well was checked to verify thestatic water level and water drawdown. Thedesign point for the pumping system wasdelivery <strong>of</strong> 500 gallons per day at a totalhead <strong>of</strong> 150 feet. A submersible centrifugalpump was specified to minimize pumpmaintenance, and trackers were specified totake advantage <strong>of</strong> the long summer days.The system was procured through the localutility, Intermountain REA. Intermountain'sPV system supplier, PSN, was able to helpsize, specify, and install the system.The PV pumping system includes:• A 616-W PV array with eight SolarexMSX 77 modules• A Grundfos centrifugal solar pump withbrushless AC motor• A SunSub pump controller• Two Zomeworks passive trackers.Savings PotentialThe system includes all array mountinghardware, wiring, and connectors; a groundingkit; and disconnect switch for $7,587.The cost <strong>of</strong> installation, which included apitless adapter for the well, new piping, anda new shed, was $4,250. No routine maintenanceother than visual inspection (whichtakes about 1 hour each year) is required,Life-Cycle CostGenerator O&M was very costly. Thestaff visited the system about once every3 days from mid-May to mid-September(40 visits) at 1.5 hours per visit about60 hours each year to operate the generator.Two more hours were required for oilchanges and 2 more for tune-ups. The totalannual O&M time was approximately64 hours. At $50/hour, O&M labor cost theForest Service about $3,200/year. Gas costanother $240 (5 gallons/visit x 40 visits x$1.20/gallon) and oil about $20 (2 quartsevery two weeks x $1.25/quart). The totalgenerator O&M cost was almost$3,500/year.In comparison, the PV pumping systemtakes virtually no time to operate or maintain.The pump operates during the daywhenever the water level in the tank activatesa float switch, and annual inspection<strong>of</strong> the system takes about 1 hour each yearat a cost <strong>of</strong> $50.When the above figures are entered intothe 1997 BLCC program, the results showa net savings <strong>of</strong> $44,000 for the 10-yearstudy period. The SIR is 7.2 and the AIRRis 14.57%. Simple payback occurs in year 3and discounted payback in year 4. For aprintout <strong>of</strong> comparative LCC with theBLCC s<strong>of</strong>tware, see Appendix F.17
Implementation and Post-Implementation ExperienceThe PV pumping system was installed inMay 1997 just before the campgroundsopened. The pump was installed in the wellby a local well service contractor and thearray was installed by an electrical contractorwith assistance from a PSN technicalrepresentative. The installation took 5 peopleapproximately 5 hours to complete. Itincluded installing a new pitless adapter onthe well (instead <strong>of</strong> the old pump house) andpiping to and from a new shed to house thewater meter and pump controller. After theinstallation, the PV array and the shed wereenclosed by a 6-foot chain-link fence to discouragevandalism and theft. At the time <strong>of</strong>this writing, the system had operated forabout 1 month with no problems.Case StudyFacility DescriptionThe Thoreau Center is an incubator fornonpr<strong>of</strong>it environmental groups. It is housedin an historic former Army hospital atPresidio National Park in San Francisco,California.Conventional TechnologyDescriptionThe developers renovated the buildingand included an atrium at the entryway. PVcells that produce electricity and form anelement in the shading and daylightingdesign are now laminated to the skylightglass. This project was funded through apartnership between FEMP; NREL; NPS;Equity Community Builders (San Francisco,California); Solarex, Inc. (Frederick,Maryland); Atlantis Solar (Grass Valley,California); Trace Engineering (Arlington,Washington); and Tanner, Leddy, Maytum,Stacy Architects (San Francisco, California).New Technology (PV)DescriptionThe PV glazing system consists <strong>of</strong> 24 PVmodules. The spacing <strong>of</strong> the cells within themodules allows approximately 17% <strong>of</strong> thesunlight into the entryway, which reducesthe need for electric light. The module panelsare laminates that are constructed with:• Six-mm Solarphire glass• Thirty-six polycrystalline silicon PV cells18• Ethylene vinyl acetate• A translucent Tedlar-coated polyesterbacksheet• Two sealed and potted junction boxeswith a double pole plug connector.The cells are laminated in a six-cell bysix-cell matrix, with a minimum spacing<strong>of</strong> 0.5 in. (1.25 cm) between cells. Thedimension <strong>of</strong> each module is 32 in. by 37 in.(81 cm by 94 cm). The gross area <strong>of</strong> theentire structure is 200 ft 2 (18.8 m 2 ).The power will be converted to highqualityAC electricity and will supplementpower supplied to the building by the utility.The system is rated at 1.25 kW, and eachmodule generates 8.5 V <strong>of</strong> DC at approximately5.0 amperes. The modules are connectedin a series to feed the sine-waveinverter, which is configured to 48 V andrated at 4,000-W capacity.Savings PotentialThe electrical energy delivery for theatrium is estimated at 2,237 kWh/year. At$0.09/kWh, this corresponds to an annualcost saving <strong>of</strong> $201.37/year.Life-Cycle CostThe present worth <strong>of</strong> the 25-year lifecycle saving is $3,363, using the NIST 3.4%discount rate.Implementation and Post-Implementation ExperienceImplementation issues included codeacceptance and regulatory barriers.Although testing indicates structural performancecomparable to other glazing products,for this first-<strong>of</strong>-a-kind demonstrationthe overhead PV glazing was mountedabove skylight glass accepted by Californiacodes. The design had to be reviewed andaccepted before the system could be connectedto the Pacific Gas & Electric(PG&E) grid.Technology inPerspectiveThe Technology's DevelopmentThe commercialization <strong>of</strong> PV power isfairly recent, but the PV effect was discoveredlong ago in 1839. A French physicistnamed Edmond Becquerel found that certainmaterials produced an electric current whenthey were exposed to light. Later, in the1870s, selenium PV cells were developedwith conversion efficiencies <strong>of</strong> 1%–2%.(Conversion efficiency is the percentage<strong>of</strong> light energy that a PV cell or moduleconverts to electrical energy.) These cellswere used by photographers to measurelight levels.The first crystalline silicon PV cells, theprecursors <strong>of</strong> those most commonly usedtoday, were developed in 1954 by scientistsat Bell Laboratories. These cells had conversionefficiencies <strong>of</strong> about 4% andreceived their first cost-effective applicationin the space program. A small array <strong>of</strong> PVcells was sent into space on the U.S.Vanguard satellite to power its radio. Thecells worked so well that PV technology hasbeen a part <strong>of</strong> the space program ever since.The space race <strong>of</strong> the 1950s and 1960sspurred improvements in PV cell designand efficiency, but the drive to make spacequalifiedPV cells lightweight and efficientled to high costs that were uneconomical forterrestrial applications. During the worldenergy crisis in the mid-1970s, PV was recognizedas a possible energy solution. ThePV industry attracted the interest <strong>of</strong> largeenergy companies and government agencies.With their investment capital, module developmentaccelerated tremendously and PVmodule costs began to decrease.Crystalline PV cells were the main focus<strong>of</strong> this effort, but other promising materialsand manufacturing processes were explored.PV modules that use materials such as cadmiumtelluride and amorphous silicon (thinfilmtechnologies) are now commerciallyavailable and promise to further decreasePV costs.Today PV modules are available withconversion efficiencies that range from 5%(thin films) to 15% (single-crystal silicon),and laboratories have achieved cell conversionefficiencies as high as 24%.Technology OutlookAs the cost <strong>of</strong> PV drops and the cost <strong>of</strong>conventional power generation increases,PV will become economical for more andmore applications, including customerownedgrid-tied systems and bulk utilitypower.A continuing expansion <strong>of</strong> PV use in theutility sector is described in an Institute <strong>of</strong>Electrical and Electronics Engineers (IEEE)conference paper by Joseph Iannucci andDaniel Shugar ("Structural Evolution <strong>of</strong>
Stand aloneGridsupportCustomersitedVillages&islandsFigure 10. The diffusion model for utility PV.Utility Systems and Its Implications forPhotovoltaic Applications," 1991 IEEE<strong>Photovoltaics</strong> Specialists Conference). Theypropose that a slow diffusion in the use <strong>of</strong>PV applications from the small scale to utilitybulk power will take PV from its currentstage to that <strong>of</strong> energy significance. Themulti-stage process is shown in Figure 10.The small stand-alone applicationsshown in the figure are cost effective today.They are typically remote applications thatpay for themselves within 6 months to2 years. These applications provide utilities(and other facilities) with familiarity andsuccessful experience with PV. They alsoprovide a small but stable and growingmarket for the PV industry.In the next stage, grid-support applicationsare novel utility PV applications thatcan support the utility distribution grid incases where the solar resource matches theneed for added energy, capacity, reliability,or voltage support. An example <strong>of</strong> this type<strong>of</strong> system is the Kerman substation PV systeminstalled by PG&E. This system wasinstalled as a demonstration to support a distributionfeeder with summertime overloadingproblems. When all the benefits <strong>of</strong> theproject, including environmental externalities,were considered, the project was nearlyeconomical.Village and island power systems arecurrently being installed throughout theworld. They usually involve small, isolateddistribution grids and a backup engine generator.They may or may not include batteries.The Pinnacles National Monument casePeakingpowerBulk powerstudy is an example <strong>of</strong> this type <strong>of</strong> system.These systems are cost effective today.Customer-sited ro<strong>of</strong>top PV systems areused where land would otherwise be a largepart <strong>of</strong> the system expense. They could beinstalled and financed by the local utility (orqualified contractor) and serve the dual purpose<strong>of</strong> producing power for the customerand utility system support. The ro<strong>of</strong>top systemsinstalled by the Sacramento MunicipalUtility District (SMUD) are examples <strong>of</strong>this type <strong>of</strong> system. SMUD's purchase <strong>of</strong>large quantities <strong>of</strong> PV is stimulating the PVindustry and bringing down costs, so customer-sitedPV systems may become costeffective in the near future.SMUD <strong>of</strong>fers its grid-connected utilitycustomers the option to participate in the PVPioneer Program, in which the utility-ownedPV system is installed on the customer'spremises. Many customers are willing topay a "green fee" (an additional 15% orabout $4–$6 on their monthly electricitybills) to help facilitate the early adoptionand commercialization <strong>of</strong> this technology.The customers provide SMUD with freero<strong>of</strong> space for its array, and the power is feddirectly into the grid. So far, SMUD hasinstalled more than 600 ro<strong>of</strong>top systems thattotal nearly 2 MW <strong>of</strong> PV. Despite its cost,demand for these systems continues toexceed supply.The natural progression <strong>of</strong> customersitedPV is to integrate the PV system whereit is used, into the structure <strong>of</strong> the building.The attractive incorporation <strong>of</strong> PV in architecturaldesign provides the opportunity forthe technology to become a multifunctionalbuilding element. BIPV products and systemscurrently available from manufacturerson a turnkey basis include building facades,Figure 11. PV integrated into a skylight system at the Thoreau Center forSustainability at Presidio National Park in San Francisco.M75-B17130519SAtlantis <strong>Energy</strong>, Inc./PIX04780
curtain walls, spandrel panels, glazing,awnings, ro<strong>of</strong> shingles, raised-seam metalro<strong>of</strong>ing, batten-seam metal ro<strong>of</strong>ing, ro<strong>of</strong>tiles, and pavers. An example <strong>of</strong> BIPV isshown in Figure 11.The peaking-power PV application isused to support utility demand (power)peaks when they are matched by the solarresource. PV costs must drop to nearly$0.10/kWh before they are cost effective forthis application. A project is now in theplanning stages to provide this type <strong>of</strong> PVpower. CSTRR, a nonpr<strong>of</strong>it corporation supportedby the Federal government and thePV industry, is involved in constructing theSolar Enterprise Zone (SEZ) in southernNevada. SEZ plans call for the installation<strong>of</strong> more than 1,000 MW <strong>of</strong> solar thermaland PV power by the year 2003. One SEZparticipant, Amoco/Enron, a PV manufacturer,has agreed to sell power from PVinstalled at SEZ at an unprecedented rate <strong>of</strong>less than $0.10/kWh. The first PV arrays arescheduled to be put on line by 1999.The eventual goal and final stage in thediffusion process is for PV power to be ableto economically fulfill utility bulk-powerapplications. Once completed, SEZ will alsoprovide power for this application.ManufacturersManufacturers <strong>of</strong> PV modules includingthose listed in the 1997 Solar <strong>Energy</strong>Industries Association membershipdirectory:ASE Americas, Inc.4 Suburban Park DriveBillerica, MA 01821Phone: (508) 667-5900Fax: (508) 663-2868AstroPower, Inc.Solar Park, 461 Wyoming RoadNewark, DE 19716-2000Phone: (302) 366-0400Fax: (302) 368-6474E-mail: sales@astropower.comAtlantis <strong>Energy</strong>, Inc.233 S. Auburn, Suite 110Colfax, CA 95713Phone: (804) 442-3509Fax: (804) 442-3755BP Solar, Inc.2300 N. Watney WayFairfield, CA 94533Phone: (707) 428-7800Fax: (707) 428-7878<strong>Energy</strong> Conversion Devices1675 W. Maple RoadTroy, MI 48084Phone: (810) 280-1900E-mail: michelle@ovonic.comENTECH, Inc.1077 Chisolm TrailKeller, TX 76248Phone: (817) 379-0100Fax: (817) 379-0300EPV — <strong>Energy</strong> <strong>Photovoltaics</strong>P.O. Box 7456Princeton, NJ 08543Phone: (609) 587-3000Fax: (609) 587-5355Evergreen Solar, Inc.211 Second AvenueWaltham, MA 02154Phone: (617) 890-7117Fax: (617) 890-7141E-mail: farberma@aol.comGlobal Solar <strong>Energy</strong>12401 W. 49th AvenueWheat Ridge, CO 80033Phone: (303) 420-1141Fax: (303) 420-1551Golden Genesis, Inc.4545 McIntyre StreetGolden, CO 80403Phone: (303) 271-7172Fax: (303) 271-7410Golden PhotonP.O. Box 4040Golden, CO 80402Phone: (303) 271-7150Golden Technologies4545 McIntyre StreetGolden, CO 80403Phone: (303) 271-7177Fax: (303) 271-7410ISET8635 Aviation BoulevardInglewood, CA 90301Phone: (310) 216-4427Fax: (310) 216-2908Kyocera America, Inc.8611 Balboa AvenueSan Diego, CA 92123Phone: (619) 576-6247Fax: (619) 569-9412E-mail: apanton@kii.attmail.com<strong>Photovoltaics</strong> International, LLC171 Commercial StreetSunnyvale, CA 94086Phone: (408) 746-3062Fax: (408) 746-3890Pilkington Solar International1615 L Street, NWWashington, DC 20036Phone: (202) 463-4698PowerLight Corporation2954 San Pablo AvenueBerkeley, CA 94710Phone: (510) 540-0550Siemens Solar Industries4650 Adohr LaneCamarillo, CA 93011Phone: (805) 388-6588Fax: (805) 388-6395E-mail: sunpower@solarpv.comSiemens Solar Industries — Florida6909 S.W. 18th Street, Suite. A-301-BBoca Raton, FL 33433Phone: (561) 416-7205Fax: (561) 362-5513Solar Cells, Inc.1702 N. Westwood AvenueToledo, OH 43607Phone: (419) 534-3377Fax: (419) 534-2794Solar International, Inc.12533 Chadron AvenueHawthorne, CA 90250Phone: (310) 970-0065Solar Kinetics, Inc.10635 King William DriveDallas, TX 75220Phone: (214) 556-2376Fax: (214) 869-4158Solarex Corporation630 Solarex CourtFrederick, MD 21703Phone: (301) 698-4213Fax: (301) 698-4201E-mail: info@solarex.com20
Solarex Corporation — Colorado4089 Valley Oak DriveLoveland, CO 80538Phone: (970) 593-9500Fax: (970) 593-9373Solarex Corporation — Pennsylvania826 Newton-Yardley RoadNewton, PA 18940Phone: (301) 698-4200Fax: (301) 698-4201Solarex Corporation — Arizona10752 N. 89th Place, Suite 210Scottsdale, AZ 85260Phone: (602) 451-8050Fax: (602) 451-8040Solec International, Inc.970 E. 236th StreetCarson, CA 90745Phone: (310) 834-5800Spire CorporationOne Patriots ParkBedford, MA 01730-2396Phone: (617) 275-6000Fax: (617) 275-7470E-mail: spire.corp@channel1.comSunWize <strong>Energy</strong> Systems, Inc.1151 Flatbush RoadKingston, NY 012401Phone: (914) 336-7700Fax: (914) 336-7172United Solar Systems Corporation5278 Eastgate MallSan Diego, CA 92121-2814Phone: (619) 625-2080Fax: (619) 625-2083Utility Power Group9410 De Soto Avenue, Unit GChatsworth, CA 91311Phone: (818) 700-1995Fax: (818) 700-2518Suppliers <strong>of</strong> complete PV systems includingthose listed in the 1997 Solar <strong>Energy</strong>Industries Association membershipdirectory:A.Y. McDonald Manufacturing Co.4800 Chavenelle RoadP.O. Box 508Dubuque, IA 52002Phone: (319) 583-7311Fax: (319) 588-0720ADDCO Manufacturing69 Empire DriveSt Paul, MN 55103Phone: (612) 224-8800Fax: (612) 224-1411Advanced <strong>Energy</strong> Systems, Inc.Riverview MillP.O. Box 262Wilton, NH 03086Phone: (603) 654-9322Fax: (603) 654-9324E-mail: info@advancedenergy.comAdvanced Thermal Systems, Inc.7600 E. Arapahoe Road, Suite 215Englewood, CO 80112Phone: (303) 721-8411Fax: (303) 721-6568Amonix, Inc.3425 Fujita StreetTorrance, CA 90505Phone: (310) 325-8091Fax: (310) 325-0771Arcadia, Inc.251 Township Line RoadDouglassville, PA 19518Phone: (610) 326-9633Fax: (610) 970-9383E-mail: arcadia@angelite.comAscension TechnologyP.O. Box 6314Lincoln Center, MA 01773Phone: (617) 890-8844ASE Americas, Inc.4 Suburban Park DriveBillerica, MA 01821Phone: (508) 667-5900Fax: (508) 663-2868AstroPower, Inc.Solar Park, 461 Wyoming RoadNewark, DE 19716-2000Phone: (302) 366-0400Fax: (302) 368-6474E-mail: sales@astropower.comAtlantic Solar Products, Inc.9351 J. Philadelphia RoadP.O. Box 70060Baltimore, MD 21237-4114Phone: (410) 686-2500Fax: (410) 686-6221Atlantis <strong>Energy</strong>, Inc.233 S. Auburn, Suite 110Colfax, CA 95713Phone: (804) 442-3509Fax: (804) 442-3755Besicorp Group, Inc.1151 Flatbush RoadKingston, NY 12401Phone: (914) 336-7700Fax: (914) 336-7172BP Solar, Inc.2300 N. Watney WayFairfield, CA 94533Phone: (707) 428-7800Fax: (707) 428-7878E-mail: sowterrv@bp.comDirect Global Power, Inc.1482 Erie Boulevard.P.O. Box 1058Schenectady, NY 12305Phone: (518) 395-5021Fax: (518) 395-2607Diversified Technologies35 Wiggins AvenueBedford, MA 01730-2345Phone: (617) 275-9444ElectriSol Ltd.1215 E. Harmont DrivePhoenix, AZ 85020Phone: (602) 997-6855Fax: (602) 943-5842Electron ConnectionP.O. Box 203Hornbrook. CA 96044Phone: (800) 945-7587E-mail: econet@snowcrest.netEPV — <strong>Energy</strong> <strong>Photovoltaics</strong>P.O. Box 7456Princeton, NJ 08543Phone: (609) 587-3000Fax: (609) 587-5355Evergreen Solar, Inc.211 Second AvenueWaltham, MA 02154Phone: (617) 890-7117Fax: (617) 890-7141E-mail: farberma@aol.comFIRST, Inc.66 Snydertown RoadHopewell, NJ 08525Phone: (609) 466-449521
Global Solar <strong>Energy</strong>12401 W. 49th AvenueWheat Ridge, CO 80033Phone: (303) 420-1141Fax: (303) 420-1551Golden Genesis, Inc.4545 McIntrye StreetGolden, CO 80403Phone: (303) 271-7172Fax: (303) 271-7410Hitney Solar Products2655 Hwy 89Chino Valley, AZ 86323Phone: (520) 636-1001Independent Power & Light462 Solar WayHyde Park, VT 05655Phone: (802) 888-7194E-mail: indeppower@aol.comWeb site: www.independent- power.comIntegrated Power Corporation7618 Hayward RoadFrederick, MD 21702Phone: (301) 663-8279Fax: (301) 631-5199Integrated Power Corporation7618 Haywood RoadFrederick, MD 21702Phone: (301) 663-8279Inter-Island Solar Supply345 N. Nimitz HighwayHonolulu, HI 96817Phone: (808) 523-0711Kyocera AmericaSolar Systems Division8611 Balboa AvenueSan Diego, CA 92123Phone: (800) 537-0294Midwest Conservation Systems Inc.P.O. Box 397Silver Lake, KS 66539Phone: (913) 582-5233Fax: (913) 232-3914E-mail: mcsinc@parod.comPhotocomm, Inc.7812 Acoma DriveScottsdale, AZ 85260Phone: (602) 948-8003Fax: (602) 483-6431Photocomm, Inc. — Colorado9850-A W. Girton DriveLakewood, CO 80227Phone: (303) 988-8208Fax: (303) 988-9581Photocomm, Inc. — San DiegoP.O. Box 9926San Diego, CA 92169Phone: (619) 490-3600Fax: (619) 490-3606Photocomm, Inc. — Texasc/o TX Solar <strong>Energy</strong> Center13130 Stafford RoadStafford, TX 77477Phone: (713) 933-1578Fax: (713) 933-1599<strong>Photovoltaics</strong> International, LLC171 Commercial StreetSunnyvale, CA 94086Phone: (408) 746-3062Fax: (408) 746-3890Photron, Inc.P.O. Box 578Willits, CA 95490Phone: (707) 459-3211Fax: (707) 459-2165Real Goods Trading Company555 Leslie StreetUkiah, CA 95482Phone: (800) 762-7325E-mail: realgoods@realgoods.comSiemens Solar Industries4650 Adohr LaneCamarillo, CA 93011Phone: (805) 388-6588Fax: (805) 388-6395E-mail: sunpower@solarpv.comSiemens Solar Industries — Florida6909 S.W. 18th Street, Suite A-301-BBoca Raton, FL 33433Phone: (561) 416-7205Fax: (561) 362-5513Solar Depot61 Paul DriveSan Rafael, CA 94903Phone: (415) 499-1333Web site: www.solardepot.comSolar Design Associates, Inc.P.O. Box 242Harvard, MA 01451Phone: (508) 456-6855E-mail: sda@solardesign.comSolar Electric Specialties Co.P.O. Box 537Willits, CA 95490Phone: (707) 459-9496E-mail: seswillits@aol.comWeb site: www.solarelectric.comSolar Kinetics, Inc.10635 King William DriveDallas, TX 75220Phone: (214) 556-2376Fax: (214) 869-4158Solar Works, Inc.64 Main StreetMontpelier, VT 05602Phone: (802) 223-7804E-mail: Iseddon@aol.comSolarex Corporation630 Solarex CourtFrederick, MD 21703Phone: (301) 698-4213Fax: (301) 698-4201Solarex Corporation — Arizona10752 N. 89th Place, Suite 210Scottsdale, AZ 85260Phone: (602) 451-8050Fax: (602) 451-8040Solarex Corporation — Colorado4089 Valley Oak DriveLoveland, CO 80538Phone: (970) 593-9500Fax: (970) 593-9373Solarex Corporation — Pennsylvania826 Newton-Yardley RoadNewton, PA 18940Phone: (301) 698-4200Fax: (301) 698-4201SunelcoP.O. Box 1499Hamilton, MT 59840Phone: (800) 338-6844E-mail: sunelco@montana.comWeb site: www.sunelco.comSunWize <strong>Energy</strong> Systems, Inc.#1 Sun StreetStelle, IL 60919Phone: (815) 256-2222Fax: (800) 232-7652Web site:www.sunwize.com22
Systems IntegratorsApplied Power Corporation1210 Homann Drive, SELacey, WA 98503Phone: (206) 438-2110Ascension Technology235 Bear Hill RoadWaltham, MA 02154Phone: (781) 890-8844Fax: (781) 890-2050E-mail: info@ascensiontech.comWeb site: www.ascensiontech.comDiversified Technologies35 Wiggins AvenueBedford, MA 01730-2345Phone: (781) 275-9444Web site: www.divtecs.comFIRST, Inc.66 Snydertown RoadHopewell, NJ 08525Phone: (609) 466-4495Web site: www.solarhome.orgSolar Design Associates, Inc.P.O. Box 242Harvard, MA 01451Phone: (508) 456-6855E-mail: sda@solardesign.comWeb site: www.solardesign.com/Çsda/Utility Power Group9410 De Soto Avenue, Unit GChatsworth, CA 91311Phone: (818) 700-1995Fax: (818) 700-2518WorldWater, Inc.117 Hopewell-Rocky Hill RoadHopewell, NJ 08525Phone: (609) 587-3000Fax: (609) 587-5355Federal ProgramContactsFederal <strong>Energy</strong> Management ProgramContact: Anne Sprunt Crawley1000 Independence Ave, SW, EE-90Washington, DC 20585Phone: (202) 586-1505Fax: (202) 586-3000National Renewable <strong>Energy</strong> Laboratory1617 Cole Blvd.Golden, CO 80401Contact: Andrew WalkerPhone: (303) 384-7531Fax: (303) 384-7411Web site: www.eren.doe.gov/fempNational Renewable <strong>Energy</strong> Laboratory1617 Cole Blvd.Golden, CO 80401Contact: John ThorntonPhone: (303) 384-6469Fax: (303) 384-6490Web site: www.nrel.govRenew the ForestsPV Systems Assistance CenterSandia National LaboratoriesP.O. Box 5800Albuquerque, NM 87185-0753Contact: Hal Post, MS0753Phone: (505) 844-2154Renew the ParksPV Systems Assistance CenterSandia National LaboratoriesP.O. Box 5800Albuquerque, NM 87185-0753Contact: Hal Post, MS0753Phone: (505) 844-2154Renew the Public LandsPV Systems Assistance CenterSandia National LaboratoriesP.O. Box 5800Albuquerque, NM 87185-0753Contact: Hal Post, MS0753Phone: (505) 844-2154Sandia National LaboratoriesPV Systems Assistance CenterP.O. Box 5800Albuquerque, NM 87185-0753Contact: Hal Post, MS0753Phone: (505) 844-2154Web site: www.sandia.gov/renewable_energy/photovoltaic/pv.htmlU.S. <strong>Department</strong> <strong>of</strong> <strong>Energy</strong><strong>Energy</strong> Efficiency and Renewable<strong>Energy</strong> Clearinghouse (EREC)P.O. Box 3048Merrifield, VA 22116Phone: (800) 363-3732Web site: erecbbs.nciinc.comWho Is Usingthe TechnologyBureau <strong>of</strong> Land ManagementContact: Trent DuncanPhone: (801) 539-4090Federal Aviation AdministrationContact: Alex GintnerPhone: (612) 463-5921National Park ServiceContact: Kent BullardPhone: (805) 658-5745E-mail: kent_bullard@nps.govUSDA Forest ServiceContact: Fred BloomPhone: (602) 225-5317Contact: Steve OravetzPhone: (406) 329-1037U.S. Air ForceContact: Larry StrotherPhone: (904) 283-6354U.S. ArmyContact: Roch DuceyPhone: (217) 398-5222U.S. NavyContact: Chuck CombsPhone: (760) 939-0048U.S. MarinesContact: Dick WalshPhone: (703) 696-0859For MoreInformationOrganizationsAmerican Solar <strong>Energy</strong> Society2400 Central Avenue, Suite G-1Boulder, CO 80301Phone: (303) 443-3130Fax: (303) 443-3212Web site: www.csn.net/solarNational Renewable <strong>Energy</strong> Laboratory1617 Cole BoulevardGolden, CO 80401-3393Save with Solar - Million Solar Ro<strong>of</strong>sInitiativeContact: Patrina TaylorPhone: (303) 384-745823
Photovoltaic Services Network165 S. Union Blvd., Suite 260Lakewood, CO 80228Contact: Kirk StokesPhone: (303) 980-1969Fax: (303) 980-1030Solar <strong>Energy</strong> Industries Association122 C Street, NW, Fourth FloorWashington, DC 20001-2109Phone: (202) 383-2600Fax: (202) 383-2670Web site: www.crest.org/renewables/seiaUtility PhotoVoltaics Group1800 M Street, NW, Suite 300Washington, DC 20036Phone: (202) 857-0898Fax: (202) 223-5537Web site: www.ttcorp.com/upvgLiterature: Design, Installationand O&MHolz, M., Maintenance and Operation <strong>of</strong>Stand-Alone Photovoltaic Systems, NavalFacilities Engineering Command, SouthernDivision; DOD Photovoltaic ReviewCommittee; Photovoltaic SystemsAssistance Center, December 1991.Risser, V., and H. Post, Editors. Stand-AlonePhotovoltaic Systems: A Handbook <strong>of</strong>Recommended Design Practices, SAND87-7023, Sandia National Laboratories,Albuquerque, New Mexico, March 1996.Duncan, T., Post, H., and Thomas, M.,Renew the Public Lands—PhotovoltaicTechnology in the Bureau <strong>of</strong> LandManagement, U.S. <strong>Department</strong> <strong>of</strong> Interior,Bureau <strong>of</strong> Land Management; PhotovoltaicSystems Assistance Center, 1996.Renew the Parks - Renewable <strong>Energy</strong> in theNational Park Service: PhotovoltaicSystems, U.S. <strong>Department</strong> <strong>of</strong> Interior,National Park Service, Denver ServiceCenter; Photovoltaic Systems AssistanceCenter, February 1995.Stokes, K. and Saito, P., Photovoltaic Poweras a Utility Service: Guidelines forLivestock Water Pumping, SAND93-7043,Sandia National Laboratories, Albuquerque,New Mexico, April 1993.Tapping Into the Sun, Today's Applications<strong>of</strong> Photovoltaic Technology, NationalRenewable <strong>Energy</strong> Laboratory, Golden,Colorado, July 1994.Thomas, M., Post, H., and Van Arsdall, A.,<strong>Photovoltaics</strong> Now—Photovoltaic Systemsfor Government Agencies, SAND88-3149,Sandia National Laboratories, Albuquerque,New Mexico, November 1995.Wiles, J., Photovoltaic Power Systems andthe National Electrical Code—SuggestedPractices, Photovoltaic Systems AssistanceCenter, 1996.Risser, V., Working Safely with PhotovoltaicSystems, Photovoltaic Systems AssistanceCenter, July 1991.Risser, V,. Hybrid Power Systems—Issuesand Answers, Photovoltaic SystemsAssistance Center, July 1992.Literature: OtherBloom, F., Post, H., and Thomas, M., Renewthe Forests—Photovoltaic Technology in theUSDA Forest Service, U.S. <strong>Department</strong> <strong>of</strong>Agriculture, Forest Service; PhotovoltaicSystems Assistance Center, July 1996.Cook, G., Billman, L., and Adcock, R.,Photovoltaic Fundamentals, Solar <strong>Energy</strong>Research Institute, Golden, Colorado,September 1991.Directory <strong>of</strong> the U.S. <strong>Photovoltaics</strong> Industry,Solar <strong>Energy</strong> Industries Association, March1996.24
AppendixesAppendix A: Page from Solar Radiation Data Manual for Flat Plate and Concentrating CollectorsAppendix B: Daily <strong>Energy</strong> Calculation WorksheetAppendix C: Federal Life-Cycle Costing Procedures and the BLCC S<strong>of</strong>twareAppendix D: Typical Example PV Design Assistance Centers Sample PV/Generator Hybrid SystemSpecificationsAppendix E: Pinnacles Case Study NIST BLCC Comparative Economic AnalysisAppendix F: Meadows Campground Case Study NIST BLCC Comparative Economic Analysis25
26Appendix A: Page from Solar Radiation Data Manual forFlat-Plate and Concentrating Collectors
Appendix B: Daily <strong>Energy</strong> Calculation WorksheetAppliancesWattsDaily Hours <strong>of</strong> UseDaily Watt-hoursTotal27
Appendix C: Federal Life-Cycle Costing Procedures and theBLCC S<strong>of</strong>twareFederal agencies are required to evaluate energy-related investments on the basis <strong>of</strong> minimum life-cycle costs (LCC) (10 CFR Part436). A life-cycle cost evaluation computes the total long-run costs <strong>of</strong> a number <strong>of</strong> potential actions, and selects the action that minimizesthe long-run costs. When considering retr<strong>of</strong>its, sticking with the existing equipment is one potential action, <strong>of</strong>ten called the baseline condition.The LCC <strong>of</strong> a potential investment is the present value <strong>of</strong> all <strong>of</strong> the costs associated with the investment over time.The first step in calculating the LCC is to identify the costs. Installed Cost includes cost <strong>of</strong> materials purchased and the labor requiredto install them (for example, the price <strong>of</strong> an energy-efficient lighting fixture, plus cost <strong>of</strong> labor to install it). <strong>Energy</strong> cost includes annualexpenditures on energy to operate equipment. (For example, a lighting fixture that draws 100 watts and operates 2,000 hours annuallyrequires 200,000 watt-hours [200 kWh] annually. At an electricity price <strong>of</strong> $0.10/kWh, this fixture has an annual energy cost <strong>of</strong> $20.)Non-fuel O&M includes annual expenditures on parts and activities required to operate equipment (for example, replacing burned-outlightbulbs). Replacement costs include expenditures to replace equipment upon failure (for example, replacing an oil furnace when it isno longer usable).Because LCC includes the cost <strong>of</strong> money, periodic and a-periodic O&M and equipment replacement costs, energy escalation rates, andsalvage value, it is usually expressed as a present value, which is evaluated bywherePV (x) denotes "present value <strong>of</strong> cost stream x",IC is the installed cost,EC is the annual energy cost,OM is the annual non-energy cost, andREP is the future replacement cost.LCC = PV (IC) + PV(EC) + PV (OM) + PV (REP)Net present value (NPV) is the difference between the LCCs <strong>of</strong> two investment alternatives, e.g., the LCC <strong>of</strong> an energy-saving orenergy-cost reducing alternative and the LCC <strong>of</strong> the baseline equipment. If the alternative's LCC is less then baseline's LCC, the alternativeis said to have NPV, i.e., it is cost effective. NPV is thus given byorNPV = PV(EC 0 ) - PV(EC 1 ) + PV(OM 0 ) - PV(OM 1 ) + PV(REP 0 ) - PV(REP 1 ) - PV (IC)NPV = PV(ECS) + PV (OMS) + PV(REPS) - PV (IC)wheresubscript 0 denotes the baseline condition,subscript 1 denotes the energy cost-saving measure,IC is the installation cost <strong>of</strong> the alternative (the IC <strong>of</strong> the baseline is assumed to be zero),ECS is the annual energy cost saving,OMS is the annual non-energy O&M saving, andREPS is the future replacement saving.Levelized energy cost (LEC) is the break-even energy price (blended) at which a conservation, efficiency, renewable, or fuel-switchingmeasure becomes cost effective (NPV > = 0). Thus, a project's LEC is given byPV(LEC*EUS) = PV(OMS) + PV(REPS) - PV(IC)where EUS is the annual energy use savings (energy units/yr). Savings-to-investment ratio (SIR) is the total (PV) saving <strong>of</strong> a measuredivided by its installation cost:SIR = (PV(ECS) + PV(OMS) + PV(REPS))/PV(IC)Some <strong>of</strong> the tedious effort <strong>of</strong> LCC calculations can be avoided by using the BLCC s<strong>of</strong>tware, developed by NIST. For copies <strong>of</strong> BLCC,call the FEMP Help Desk at (800) 363-3732.28
Appendix D: Typical Example PV Design Assistance CentersSample PV/Generator Hybrid System SpecificationsNOTE: This appendix is based on specifications that were developed by the Denver Service Center <strong>of</strong> the National Park Service in conjunctionwith the Photovoltaic Design Assistance Centers at Sandia National Laboratories. The system described here has been installed at ahousing facility in Hozomeen, North Cascades National Park. It must be adjusted and modified for site-specific conditions (hardware, climate,solar resource, etc.) if it is to be used in other locations.SECTION 16610Hal POST 505.844.2154PHOTOVOLTAIC SYSTEMPART 1: GENERAL1.1 DESCRIPTION: The work <strong>of</strong> this section consists <strong>of</strong> furnishing and installing a complete and operable hybrid photovoltaic (PV)system for the project site. The design intent is to have the PV array produce sufficient energy to operate all estimated electricalloads throughout the months <strong>of</strong> June through August without support from a standby generator. Two days <strong>of</strong> autonomy shall beminimum for this system during the above referenced months.1.2 SUBMITTALS: As specified in Section 01300.A. Submit catalog data on all materials with complete description <strong>of</strong> components; including modules, batteries, inverters,DC load center, transfer switches, panelboard, mounting hardware, fuses, cable, connectors, and all other relatedequipment.B. Submit connection wiring diagram for complete PV system.C. Submit resume, references, and other data indicating qualifications as outlined under Quality Assurance.D. Any components fabricated by contractor for which there is no catalog cut sheet or manufacturer’s data available, submitprototype or product for review and approval.1.3 QUALITY ASSURANCE:A. lnstallation and equipment shall comply with all applicable codes, including but not limited to, Articles 690, 480, and 250<strong>of</strong> the 1996 NEC. All products that are listed, tested, identified, or labeled by UL, FM, ETL, or other National TestingOrganization shall be used when available. Non-listed products are only permitted when there is no listing. Alsoreference 1601 0.B. The system shall be supplied and installed by one manufacturer (or certified representative) with an established reputation and at least 5 years experience in the manufacturing and installation <strong>of</strong> Hybrid Photovoltaic <strong>Energy</strong> Systems<strong>of</strong> 20 KVA nominal or larger, and who shall be able to provide three references <strong>of</strong> similar installations renderingsatisfactory service.1.4 OPERATION AND MAINTENANCE DATA: Provide two complete sets <strong>of</strong> the following data. Data shall be on 8 1/2-in. by 11-in.sheet or manufacturer’s standard catalog, suitable for side binding. Include full product documentation from manufacturer,installer, and/or supplier including, but not limited to, the following items. Also reference Section 01700 and part 3 <strong>of</strong> this section.A. DC POWER CENTER AND INVERTER, INCLUDING OPTIONAL EQUIPMENT FURNISHED:1. Owners manual with programming and installation instructions2. Emergency operating procedures3. Default program values and setpoints4. Listing <strong>of</strong> field programmed variables and setpoints5. Equipment wiring diagrams6. Product model number, with name, address, and telephone number <strong>of</strong> local representative7. Starting, operating, and shutdown procedures, including normal, seasonal, and emergency shutdown procedures8. Schedule <strong>of</strong> maintenance work, if any9. Replacement parts list, including internal fuses10. Warranty paperworkB. BATTERIES:1 . Owners manual with installation, testing and charging instructions. Instructions shall be very specific as to howthe batteries shall be maintained and operated to ensure long life.2. Emergency operating procedures, including method <strong>of</strong> handling leaking or damaged battery3. Recycling and salvage information4. Product model number, with name, address, and telephone number <strong>of</strong> local representative5. Starting operating, and shutdown procedures, including seasonal shutdown and storage6. Maintenance and testing schedule29
7. Warranty paperworkC. PHOTOVOLTAIC MODULES, PANELBOARDS, SWITCHES, CKT BREAKERS, AND BALANCE OF SYSTEMCOMPONENTS:1. Owners manual or manufacturer’s product data sheet, as applicable2. Equipment wiring diagrams3. Product model number, with name, address, and telephone number <strong>of</strong> local representative4. Starting, operating, and shutdown procedures, including normal, emergency, and seasonal shutdown procedures5. Schedule <strong>of</strong> maintenance work, if any6. Replacement parts list, including fuses, diodes, etc.7. Warranty paperwork8. Cleaning agents and methodsPART 2: PRODUCTS2.1 CONDUIT: Exposed conduit on duplex ro<strong>of</strong> shall be EMT, painted to match ro<strong>of</strong>. Reference 16050 for other conduit and racewayrequirements.2.2 CONDUCTORS: As specified in this section, section 16050, as shown on the drawings, and as recommended by the equipmentmanufacturer. DC Cables shall be super flexible locomotive/welding-type.2.3 PHOTOVOLTAIC MODULES:A. General: Modules shall be UL, FM , or ETL listed. High-power type, with typical peak power <strong>of</strong> not less than 64 Wunder standard test conditions (illumination <strong>of</strong> 1-sun at spectral distribution <strong>of</strong> AM 1.5, cell temperature <strong>of</strong> 25°C).Voltage at peak power shall not be less than 17.5 Vdc. Current at peak power shall not be less than 3.66 amps, short circuit current <strong>of</strong> 4.0 amps, open circuit voltage at 21.2 Vdc. Dimension shall not be greater than: length 44.0 in., width20.0 in., depth 2.0 in. Model #MSX-64 as manufactured by Solarex Corporation, Frederick, Maryland, or approvedequal.B. Units shall have 20-year limited warranty that guarantees:1. That no module will generate less than its specified minimum power when purchased.2. Continued power <strong>of</strong> at least 80% <strong>of</strong> guaranteed minimum power for 20 years.2.4 COMBINER/J-BOX: Hinged cover fiberglass NEMA 4X enclosure as manufactured by H<strong>of</strong>fman, Anoka MN or approved equal.Unit shall be sunlight resistant, and exhibit excellent chemical, temperature, and weather resistance properties. Contractor shalldetermine required size <strong>of</strong> box by calculating fill from 1996 NEC using actual quantity and size <strong>of</strong> conductors used. Minimumsize <strong>of</strong> 12 in. by 10 in. by 6 in. Model #A-121006CHSCFG with screw cover, or as required per fill calculations.2.5 POWER DISTRIBUTION BLOCKS: As required for changing conductors sizes, combining multiple conductors, etc. Rated forvoltage and current <strong>of</strong> system. As manufactured by ILSCO, Cincinnati, Ohio, or approved equal.2.6 BATTERIES:A. General: Absolyte-IIP, Module Type 3-100A21 as manufactured by GNB Industrial Battery Co., Lombard, IL 60148, orapproved equal. The batteries shall have the following features and characteristics:1. 6V nominal per battery, minimum 1000 amp*hour capacity to 10.5 V (1.75 V/cell) at 25°C at C/24 rate2. Ten-year warranty, expected life shall be 20 years at full float at 25°C3. Lead calcium negative plate, MFX alloy positive plate, sealed valve-regulated construction4. For safe transportation, battery shall be classified as nonhazardous material Battery shall be rated spill and leakpro<strong>of</strong> by ICAO, IATA, and DOT5. Battery shall be UL listed6. Battery shall be able to withstand freezing without damage to container or active materials7. Battery shall be fully recyclable, and not require watering. Manufacturer shall have certified recycling program.8. Battery shall have self discharge rate not greater than 1% at 25oC9. Battery shall have deep cycle capability <strong>of</strong> 1,200 cycles at 80% depth <strong>of</strong> discharge at 25°C10. Float voltage shall be 2.23-2.28 volts per Cell @ 25°C11. Maximum weight and dimensions are as follows: length 29 in., width 27 in., height 9 in., and weight525 lbs/6V batteryB. Accessories: Furnish manufacturers bottom I-beam supports and installation kit including nylon straps.C. Cables: Minimum #4/OAWG super flexible welding-type cable. Factory crimped and soldered ring terminals for batteryand inverter bolted connections. Cables shall have identification labels on each end for positive and negative terminalconnections. Solid copper bus/bars are also acceptable.30
D. Terminals: Exposed battery terminals and cable connects must be protected against potential short circuiting. Furnish andinstall manufacturers transparent flame-retardant module coverer assembly.2.7 DISCONNECTS/PANELBOARDS/ETC:A. GENERAL: Circuit breaker and switches shall be UL listed and DC rated for load controlled. Disconnects andovercurrent devices shall be mounted in approved boxes, enclosures, or panelboards. Requirements for internalconfiguration <strong>of</strong> these enclosures shall comply w/NEC Article 370,373, 384 and applicable UL standards. Metalenclosures and boxes shall be bonded to the grounding conductor.1. DC disconnects at duplex: Heavy-duty, 25O VDC, 60-amp, 2-pole fused disconnect with isolated neutral bus.NEMA 3R enclosure. Model #H222NRB as manufactured by Square-D or approved equal.2. Panelboards: “GEN” and “LP”: As indicated on panelboard schedule. Provide equipment ground bar kit.Copper bus required.3. Circuit Breaker Enclosures: Breaker type “QO”, size as shown on drawings. Isolated neutral bus required.Manufactured by Square-D or approved equal.4. Transfer Switches: Number <strong>of</strong> poles as shown, load make/break and continuous duty rated. 100Amp rating,NEMA 1 enclosure. Isolated neutral bus required. Class 3140 as manufactured by Square-D or approved equal.2.8 DC LOAD CENTER:A. GENERAL: Model APT5-444 as manufactured by Ananda Power Technologies, Inc., Nevada City, California, orapproved equal. DC power center shall have at a minimum the following features:1. Unit must be UL listed and compatible with 48 Vdc negative ground electrical system2. Unit shall comply with Article 690-5 <strong>of</strong> the 1996 NEC. Furnish ground fault detection and interruption device.3. Battery/inverter/main disconnect: UL listed for up to 125 Vdc @ 400 amps per pole, 3 poles total4. Main fuses: UL listed, Class T, current limiting, 20K AIC5. Circuit breakers: UL listed, DC rated, 5K AIC at 65 Vdc6. PV charge controller and load disconnect contacts: Mercury displacement type, UL listed, temperature range<strong>of</strong> -35o to 85oC7. Operating ambient temperature range <strong>of</strong> -35° to 54°C, nonoperating temperature range <strong>of</strong> - 45° to 8°C8. Fused main disconnect amps rated up to 400 amps input and 2/400 amp outputs, maximum input powerhandling ability <strong>of</strong> 1200 amps9. Maximum solar charge control ability <strong>of</strong> 360 amps10. Solar array disconnect with 35-amp breaker and red hipped indicator11. Battery cable terminal lugs up to 4-#250 MCM12. Inverter cable terminal lugs up to 2/dual #250 MCM13. Automatic array disconnect to eliminate nighttime losses14. Adjustable control and selection <strong>of</strong> equalize, automatic, or <strong>of</strong>f battery charge modes. Field adjustable chargetermination set voltage.15. LED indicators for battery charging status for each subarray ( four total)16. Smartlight Plus battery charge indicatorB. ADDITIONAL FEATURES:1. LCD digital display unit indicating current generated, current draw, and battery voltage. Furnish shunts asrequired. Model #VISTA3-SH or approved equal. Unit shall fit in door <strong>of</strong> APT5 cabinet.2. Battery temperature compensator3. Lightning arrestor, 48 Vdc nominal, Model #LA50k or approved equal4. Factory calibration <strong>of</strong> battery charge controller for specified Absolyte-IIP batteries5. Ground fault detection and interruption device6. Furnish all other equipment and appurtenances as specified and/or required for a complete and operable system2.9 DC FUSED PULLOUT: Model #-STP404 as manufactured by Ananda Power Technologies or approved equal. UL listed, rated at125 Vdc, up to 400 amps per pole. Furnish Class T fuses, size as shown or required. Furnish ground bus.2.10 INVERTERA. GENERAL: Model #5548 as manufactured by Trace Engineering, Arlington, Washington, or approved equal. DC powercenter shall have at a minimum the following features:1. ETL listed2. Nominal DC Input Voltage <strong>of</strong> 48 VDC, AC output voltage (RMS) <strong>of</strong> 120 VAC @ 60Hz31
3. Continuous power rating <strong>of</strong> 5,500 VA @ 20°C, continuous AC output rating <strong>of</strong> 46 amps @ 25°C, maximumAC output <strong>of</strong> 78 amps (RMS)4. Peak efficiency <strong>of</strong> 96%5. Automatic AC transfer relay rated at 60 amps6. Maximum charging rate <strong>of</strong> 75 amps7. DC input requirements: Search mode shall not exceed 1W. Max no load idle power shall not exceed 20Watts.At full-rated power DC input shall not exceed 137 amps. Short-circuited output shall not exceed 180 amps.Nominal DC input voltage range <strong>of</strong> 44 to 66 V.8. AC output vharacteristics: Sinewave output, 24 to 52 steps per cycle. Voltage Regulation Å2%, THD 3% to 5%maximum. Allowed power factor from -1 to +1. Frequency regulation shall not exceed Å0.04%. Load sensingrange between 16 and 240W.9. Non-0perating temperature range -40° to 60°C, operating temperature range -40° to 60°CB. PROGRAMMING: Unit shall be programmable, with separate user and setup menus. Unit shall have lighted back-litLCD display on the control panel. The LCD display shall also indicate inverter amps, input amps, load amps, batteryVDC, and inverter VAC. Control panel LEDs shall report the status <strong>of</strong> line-tie, ACl-in, bulk, error, inverting, AC2-in,float, and overcurrent conditions.C. ACCESSORIES: Furnish the following optional equipment as specified. Furnish all other components as required for acomplete and operable system.1. Furnish conduit box #SWCB for each inverter2. Furnish stacking interface cable #SWI for 120/240 three-wire power from two invertersD. OPERATING MODES: The inverter shall be capable <strong>of</strong> parallel operation with the AC generator. The inverter shallsynchronize its output waveform with that <strong>of</strong> the AC input source. The inverter shall function in the following modesfor this project:1. GENERATOR AUTO-START MODE: Unit shall be capable <strong>of</strong> automatically starting the generator whenbattery voltage-drops at or below 80% depth <strong>of</strong> discharge (as published by battery manufacturer). A “quitetime”feature shall also be built into the unit to restrict generator operation during programmed time periods.2. GENERATOR SUPPORT MODE: When charging batteries from a generator, the inverter shall be capable <strong>of</strong>monitoring the generator’s output voltage and current. If the voltage or current falls outside user adjustable limits, the inverter shall shed itself as a load and reverse power flow if necessary to assist the generator. Invertersshall also be capable <strong>of</strong> operating in series for 120/240 VAC power, with 12C VAC leg capable <strong>of</strong> charging thebatteries while the other unit is supporting the generator.3. BATTERY CHARGER MODE: Unit shall have three stage temperature compensated charging algorithm forcharging batteries. Unit shall have remote battery temperature probe. Unit shall operate in manual equalizemode with adjustable settings. Unit shall have automatic “back-<strong>of</strong>f” system to prevent overloading <strong>of</strong> generatoror nuisance tripping <strong>of</strong> input breakers.4. INVERTER MODE: Unit shall have low battery cutout voltage with adjustable time delay to prevent damagingbatteries. Unit shall have protection circuitry against overcurrent, short circuit, over temperature, low batteryvoltage, and high battery voltage conditions.PART 3: EXECUTION3.1 GENERAL: Install all equipment in accordance with manufacturer’s recommendations and as required by 1996 NEC or otherapplicable codes. A permanent label shall be posted near the main PV disconnect switch that contains the following information per NEC690-52:A. Operating current (system’s maximum power current)B. Open-circuit currentC. Operating voltage (system’s maximum power voltage)D. Open-circuit voltage3.2 GROUNDING: As indicated on the drawings and section 16450. Maintain a single point, negative ground throughout thePV system.3.3 MODULES:A. GENERAL: Individual modules shall be prewired into four-module panels and tested before being installed on ro<strong>of</strong>.Record open-circuit voltage and short-circuit current for each panel. Submit these test results to COR. Panels shall beinstalled to mounting brackets as shown on the drawings. Gravity shall hold the panels in place. Do not lighten attachment pins to mounting brackets unless directed by COR. lnstallation and attachment structure shall be able to withstandsnow loading typical for the area.32
B. WIRING: All wiring shall be neatly routed and secured with wire ties to underside <strong>of</strong> array. Wire routing shall be suchthat maximum protection from the elements is provided. Installation must be approved by COR.3.4 BATTERIES:A. Batteries shall be stacked horizontally on I-beam supports and attached to wall, as recommended by manufacturer forcompliance with UBC Seismic Zone IV installations. Cover terminals <strong>of</strong> batteries with manufacturers module coverassembly to prevent short circuit conditions. Installation shall comply with 1996-NEC, including Articles 480 and690-71,72,73.B. Install temperature measurement device between battery racks as recommended by manufacturer (temperaturecompensation from charge controller).3.5 INVERTERS:A. GENERAL: Each stacked inverter system and the single unit shall be programmed to charge the batteries when thegenerator is operating. Each inverter shall be custom programmed for charging the specified Absolyte-IIP batteries.Charging algorithm used shall be customized to match charging specifications as recommended by battery manufacturer.Other inverter features shall be custom programmed in the field as directed by COR.B. GENERATOR AUTO-START MODE: Unit shall be programmed to automatically start generator when battery voltagedrops at or below 80% depth <strong>of</strong> discharge, as published by battery manufacturer. A “quite-time” shall also be programmed into the unit to restrict generator operation during time periods as provided by the COR. The generator startsequence shall be programmed to match the specified generator for auto-start. Unit shall be programmed to shut downthe generator when the batteries are charged. Do not overcharge batteries. See above for battery charging requirements.C. GENERATOR SUPPORT MODE: When charging batteries from a generator, the generator’s output voltage and currentshall be monitored. If either voltage or current falls outside user adjustable limits, the inverter shall shed itself as a loadand reverse power flow if necessary to assist the generator. When operating two inverters in series for 120/240 VACpower, one 120 VAC leg shall be capable <strong>of</strong> charging the batteries while the other unit is supporting the generator.3.6 DC LOAD CENTER: Install according to manufacturer’s instructions for negative ground system. Unit shall be configured tocharge batteries from PV array. Unit shall disconnect array when batteries are fully charged. Unit shall disconnect array at night toprevent negative power flow from batteries. Fusing and cable sizes shall be as recommended by the manufacturer and as shown onthe drawings.3.7 TESTING: When installation is complete, inverter manufacturers representative (TRACE Engineering) shall test entire installationin the presence <strong>of</strong> contracting <strong>of</strong>ficer. Coordinate test a minimum <strong>of</strong> 1 week in advance with the contracting <strong>of</strong>ficer. Notify contracting <strong>of</strong>ficer immediately <strong>of</strong> any problems discovered during testing. Test shall include as a minimum:A. Complete inverter function test ensures that each individual and stacked inverter set performs all features as specified.B. Battery charging test: Verify that the DC power center properly charges batteries from array per battery manufacturer’srecommendations. Verify that the inverter(s) property charge batteries with AC input from the gen-set per batterymanufacturer’s recommendations.C. Verify that each inverter and stacked inverter set will automatically start the gen-set as specified.D. Verify that each inverter and stacked inverter set will automatically operate in parallel with the gen-set.E. Test each inverter under typical and maximum load conditions for each dwelling unit served.F. The total testing period shall not be less than 5 hours.G. Retest entire system and associated equipment if initial test requires corrective action.H. Record and provide a brief written summary <strong>of</strong> all programmed values and set points after completing final testing foreach inverter and the DC load center. Also provide written record <strong>of</strong> all current and voltage readings.3.8 DEMONSTRATION AND TRAINING: Also reference section 01670. Provide 4 hours <strong>of</strong> operating instructions for entire PVenergy system, including operation <strong>of</strong> gen-set, inverters, DC load center, transfer switches, batteries, panelboard, disconnects, andother features as requested by the park. Also discuss maintenance <strong>of</strong> batteries. Instruct park personnel in removing and installingpanels, including wiring and all connections. Provide park with written instructions and procedures for seasonal shutdown andstartup activities for all components <strong>of</strong> the hybrid PV power system. The park shall be permitted to videotape this training for<strong>of</strong>ficial NPS use.33
Appendix E: Pinnacles Case Study NIST BLCC ComparativeEconomic Analysis******************************************************************************* N I S T B L C C: COMPARATIVE ECONOMIC ANALYSIS (ver. 4.4-97 ) *******************************************************************************Project: Pinnacles Power SupplyBase Case: base case:Alternative: pvgenPrincipal Study Parameters—————————————-Analysis Type:Federal Analysis—<strong>Energy</strong> Conservation ProjectsStudy Period: 20 Years (June 1998 through May 2018)Discount Rate:4.1% Real (exclusive <strong>of</strong> general inflation)Basecase LCC File: PINGEN1.LCCAlternative LCC File: PVGEN.LCCComparison <strong>of</strong> Present-Value (P.V.) CostsBase Case: Alternative: Savingsbase case: pvgen from Alt.Initial Investment item(s): -———— -—-——— ————Capital Requirements as <strong>of</strong> Service Date $50,000 $150,000 -$100,000———- –———- –———-Subtotal $50,000 $150,000 -$100,000Future Cost Items:Annual and Nonannual Recurring Costs $54,977 $10,397 $44,579<strong>Energy</strong>-related Costs $166,198 $22,230 $143,968Capital Replacements $101,720 $43,556 $58,164–———- –———- –———-Subtotal $322,895 $76,184 $246,711–———- –———- –———-Total P.V. <strong>of</strong> Life-Cycle Cost $372,895 $226,184 $146,711Net Savings from Alternative ‘pvgen’ compared to Base Case ‘base case:’Net Savings = P.V. <strong>of</strong> Noninvestment Savings $188,547- Increased Total Investment $41,836–———-Net Savings: $146,711Note: the Savings-to-Investment Ratio (SIR) and Adjusted Internal Rate <strong>of</strong> Return (AIRR) computations include differential initial costs, capital replacementcosts, and residual value (if any) as investment costs, per NIST Handbook 135 (Federal and MILCON analyses only).SIR for Alternative ‘pvgen’ compared to Base Case ‘base case:’P.V. <strong>of</strong> Noninvestment SavingsSIR = —————————————– = 4.51Increased Total InvestmentAIRR for Alternative PV/Hybrid compared toBase Case ‘base case:’(Reinvestment Rate = 4.10%; Study Period = 20 years)AIRR = 12.24%Estimated Years to Payback: Simple Payback occurs in year 5; Simple Payback negated by cost <strong>of</strong> battery replacement in year 8; Simple Paybackoccurs in year 9; Discounted Payback occurs in year 6; Discounted Payback negated in year 8; Discounted Payback occurs in year 10.ENERGY SAVINGS SUMMARY<strong>Energy</strong> —— Average Annual Consumption ——– Life-CycleType Units Basecase Alternative Savings Savings————– ——— ———— —————- ———— —————Distil. Oil Gallon 12,000.0 0.0 12,000.0 240,000.0Other Gallon 0.0 1,265.0 -1,265.0 -25,300.034
Appendix F: Meadows Campground Case Study NIST BLCCComparative Economic Analysis******************************************************************************* N I S T B L C C: COMPARATIVE ECONOMIC ANALYSIS (ver. 4.4-97 ) *******************************************************************************Project: Meadows CampgroundBase Case: GeneratorAlternative: PV SystemPrincipal Study Parameters:—————————————-Analysis Type:Federal Analysis—<strong>Energy</strong> Conservation ProjectsStudy Period: 20 Years (May 1997 through April 2017)Discount Rate:3.8% Real (exclusive <strong>of</strong> general inflation)Base Case LCC File: MEADWGEN.LCCAlternative LCC File: MEADWPV.LCCComparison <strong>of</strong> Present-Value (P.V.) CostsBase Case: Alternative: SavingsDiesel Gen. PV/Hybrid from Alt.Initial Investment item(s): ————— ————— ————Capital Requirements as <strong>of</strong> Service Date $1,500 $11,837 -$10,337———- ———- ———-Subtotal $1,500 $11,837 -$10,337Future Cost Items:Annual and Nonannual Recurring Costs $49,331 $705 $48,626<strong>Energy</strong>-related Costs $3,216 $0 $3,216Capital Replacements $3,135 $0 $3,135———- ———- ———-Subtotal $55,682 $705 $54,978———- ———- ———-Total P.V. Life-Cycle Cost $57,182 $12,542 $44,641Net Savings from Alternative PV System compared to Base Case GeneratorNet Savings = P.V. <strong>of</strong> Noninvestment Savings $51,843- Increased Total Investment $7,202———-Net savings: $44,641Note: the Savings-to-Investment Ratio (SIR) and Adjusted Internal Rate <strong>of</strong> Return (AIRR) computations include differential initial costs, capital replacementcosts, and residual value (if any) as investment costs, per NIST Handbook 135 (Federal and MILCON analyses only).SIR for Alternative PV System compared to Base Case GeneratorP.V. <strong>of</strong> Noninvestment SavingsSIR = ————————————– = 7.20Increased Total InvestmentAIRR For Alternative PV System compared to Basecase Generator(Reinvestment Rate = 3.80%; Study Period = 20 years)AIRR = 14.57%Estimated Years to Payback: Simple Payback occurs in year 3; Discounted Payback occurs in year 4.ENERGY SAVINGS SUMMARY<strong>Energy</strong> —— Average Annual Consumption —— Life-CycleType Units Basecase Alternative Savings Savings————- ———– ———— ————— ———— ————–Distil. Oil Gallon 200.0 0.0 200.0 4,000.0Other kWh 0.0 0.0 0.0 0.035
36This page left blank intentionally
About the Federal Technology AlertsThe <strong>Energy</strong> Policy Act <strong>of</strong> 1992, andsubsequent Executive Orders, mandatethat energy consumption in the Federalsector be reduced by 30% from 1985levels by the year 2005. To achievethis goal, the U.S. <strong>Department</strong> <strong>of</strong><strong>Energy</strong>’s Federal <strong>Energy</strong> ManagementProgram (FEMP) is sponsoring aseries <strong>of</strong> programs to reduce energyconsumption at Federal installationsnationwide. One <strong>of</strong> these programs,the New Technology DemonstrationProgram (NTDP), is tasked to acceleratethe introduction <strong>of</strong> energy-efficientand renewable technologies into theFederal sector and to improve the rate<strong>of</strong> technology transfer.As part <strong>of</strong> this effort FEMP issponsoring a series <strong>of</strong> Federal TechnologyAlerts (FTAs) that providesummary information on candidateenergy-saving technologies developedand manufactured in the United States.The technologies featured in theTechnology Alerts have alreadyentered the market and have someexperience but are not in general usein the Federal sector. Based on theirpotential for energy, cost, and environmentalbenefits to the Federal sector,the technologies are considered to beleading candidates for immediateFederal application.The goal <strong>of</strong> the Technology Alertsis to improve the rate <strong>of</strong> technologytransfer <strong>of</strong> new energy-saving technologieswithin the Federal sector andto provide the right people in the fieldwith accurate, up-to-date informationon the new technologies so that theycan make educated judgments onwhether the technologies are suitablefor their Federal sites.Because the Technology Alerts arecost-effective and timely to produce(compared with awaiting the results<strong>of</strong> field demonstrations), they meetthe short-term need <strong>of</strong> disseminatinginformation to a target audience ina timeframe that allows the rapiddeployment <strong>of</strong> the technologies—andultimately the saving <strong>of</strong> energy in theFederal sector.The information in the TechnologyAlerts typically includes a description<strong>of</strong> the candidate technology; theresults <strong>of</strong> its screening tests; a description<strong>of</strong> its performance, applicationsand field experience to date; a list <strong>of</strong>potential suppliers; and importantcontact infor-mation. Attachedappendixes provide supplementalinformation and example worksheetson the technology.FEMP sponsors publication <strong>of</strong> theFederal Technology Alerts to facilitateinformation-sharing between manufacturersand government staff. Whilethe technology featured promises significantFederal-sector savings, theTechnology Alerts do not constituteFEMP’s endorsement <strong>of</strong> a particularproduct, as FEMP has not independentlyverified performance data providedby manufacturers. Nor dothe Federal Technology Alerts attemptto chart market activity vis-a-vis thetechnology featured. Readers shouldnote the publication date on the backcover, and consider the Alert as anaccurate picture <strong>of</strong> the technology andits performance at the time <strong>of</strong> publication.Product innovations and theentrance <strong>of</strong> new manufacturers orsuppliers should be anticipated sincethe date <strong>of</strong> publication. FEMPencourages interested Federal energyand facility managers to contact themanufacturers and other Federal sitesdirectly, and to use the worksheets inthe Technology Alerts to aid in theirpurchasing decisions.Federal <strong>Energy</strong> Management ProgramThe Federal Government is the largest energy consumer in the nation. Annually, in its 500,000 buildings and 8,000 locations worldwide,it uses nearly two quadrillion Btu (quads) <strong>of</strong> energy, costing over $11 billion. This represents 2.5% <strong>of</strong> all primary energy consumption inthe United States. The Federal <strong>Energy</strong> Management Program was established in 1974 to provide direction, guidance, and assistance toFederal agencies in planning and implementing energy management programs that will improve the energy efficiency and fuel flexibility<strong>of</strong> the Federal infrastructure.Over the years several Federal laws and Executive Orders have shaped FEMP's mission. These include the <strong>Energy</strong> Policy and ConservationAct <strong>of</strong> 1975; the National <strong>Energy</strong> Conservation and Policy Act <strong>of</strong> 1978; the Federal <strong>Energy</strong> Management Improvement Act <strong>of</strong> 1988;and, most recently, Executive Order 12759 in 1991, the National <strong>Energy</strong> Policy Act <strong>of</strong> 1992 (EPACT), and Executive Order 12902 in1994.FEMP is currently involved in a wide range <strong>of</strong> energy-assessment activities, including conducting New Technology Demonstrations, tohasten the penetration <strong>of</strong> energy-efficient technologies into the Federal marketplace.This report was sponsored by the United States Government. Neither the United States nor any agency or contractor there<strong>of</strong>, nor any <strong>of</strong>their employees, makes any warranty, express or implied, or assumes any legal liability or responsibility for the accuracy, completeness,or usefulness <strong>of</strong> any information, apparatus, product, or process disclosed, or represents that its use would not infringe privately ownedrights. Reference herein to any specific commercial product, process, or service by trade name, mark, manufacturer, or otherwise, doesnot necessarily constitute or imply its endorsement, recommendation, or favoring by the United States Government or any agency orcontractor there<strong>of</strong>. The views and opinions <strong>of</strong> authors expressed herein do not necessarily state or reflect those <strong>of</strong> the United StatesGovernment or any agency or contractor there<strong>of</strong>.
For More InformationFEMP Help Desk:(800) 363-3732International callers please use (703) 287-8391Web site: http://www.eren.doe.gov/femp/General ContactsBob McLarenNTDP Program ManagerFederal <strong>Energy</strong> Management ProgramU.S. <strong>Department</strong> <strong>of</strong> <strong>Energy</strong>1000 Independence Avenue SW, EE-92Washington, D.C. 20585(202) 586-0572Steven A. ParkerPacific Northwest National LaboratoryP.O. Box 999, MS K5-08Richland, Washington 99352(509) 375-6366steven.parker@pnl.govTechnical ContactsAndy Walker, Mail Stop 2723National Renewable <strong>Energy</strong> Laboratory1617 Cole BoulevardGolden, CO 80401Phone: (303) 384-7531Fax: (303) 384-7411e-mail: andy_walker@nrel.govProduced for the U.S. <strong>Department</strong><strong>of</strong> <strong>Energy</strong> (DOE) by the NationalRenewable <strong>Energy</strong> Laboratory,a DOE national laboratoryDOE/GO-10098-484April 1998Printed with a renewable-source ink onpaper containing at least 50% wastepaper,including 20% postconsumer waste