- Page 1 and 2:
UNIFIED REPORTER iREPORTULTIMATE GU
- Page 3 and 4:
Table of ContentsTABLE OF CONTENTSC
- Page 5:
Table of Contents6.1.2 Accessing th
- Page 8 and 9:
iReport Ultimate GuideChapter 16 Cr
- Page 10 and 11:
iReport Ultimate Guide• TrueType
- Page 12 and 13:
iReport Ultimate Guide12
- Page 14 and 15:
iReport Ultimate Guide• iReport-x
- Page 16 and 17:
iReport Ultimate GuideFigure 2-2Bui
- Page 18 and 19:
iReport Ultimate GuideFigure 2-5Win
- Page 20 and 21:
iReport Ultimate GuideFigure 2-7Opt
- Page 22 and 23:
iReport Ultimate GuideFigure 2-9Dat
- Page 24 and 25:
iReport Ultimate GuideFigure 2-11Or
- Page 26 and 27:
iReport Ultimate GuideFigure 2-14Re
- Page 28 and 29:
iReport Ultimate GuideFigure 2-17Re
- Page 30 and 31:
iReport Ultimate Guide9. The last s
- Page 32 and 33:
iReport Ultimate GuideWhen we are f
- Page 34 and 35:
iReport Ultimate GuideCode Example
- Page 36:
iReport Ultimate GuideCode Example
- Page 39 and 40:
Basic Notions of iReportjava.util.D
- Page 41 and 42:
Basic Notions of iReportof a date,
- Page 43 and 44:
Basic Notions of iReport(new java.l
- Page 45 and 46:
Report StructureCHAPTER 4REPORT STR
- Page 47 and 48:
Report StructureGroup HeaderDetailG
- Page 49 and 50:
Report StructureThe page margin dim
- Page 51 and 52:
Report StructureFigure 4-6Result of
- Page 53 and 54:
Report StructureMultiple columns ar
- Page 55 and 56:
Report StructureFigure 4-11Properti
- Page 57 and 58:
Report StructureAs you can see in F
- Page 59 and 60:
Report Structure4.1.3.12 ImportsThe
- Page 61 and 62:
Report Structureexample, in a repor
- Page 63 and 64:
Report ElementsCHAPTER 5REPORT ELEM
- Page 65 and 66:
Report ElementsFigure 5-3Guidelines
- Page 67 and 68:
Report ElementsFigure 5-6Element no
- Page 69 and 70:
Report ElementsTable 5-1Formatting
- Page 71 and 72:
Report ElementsFigure 5-10Table 5-2
- Page 73 and 74:
Report ElementsFigure 5-11Custom el
- Page 75 and 76:
Report Elements5.1.5.2 RectangleThe
- Page 77 and 78:
Report ElementsTable 5-4TypeImage E
- Page 79 and 80:
Report ElementsTable 5-5OptionImage
- Page 81 and 82:
Report ElementsCode Example 5-1Dyna
- Page 83 and 84:
Report ElementsCode Example 5-2Prin
- Page 85 and 86:
Report ElementsPDF font namePDF enc
- Page 87 and 88:
Report ElementsFor your convenience
- Page 89 and 90:
Report ElementsHere there are some
- Page 91 and 92:
Report ElementsThe following briefl
- Page 93 and 94:
5.5 Adding Custom Components and Ge
- Page 95 and 96:
Fields, Parameters, and VariablesCH
- Page 97 and 98:
Fields, Parameters, and VariablesIn
- Page 99 and 100:
6.1.2 Accessing the SQL Query Desig
- Page 101 and 102:
Fields, Parameters, and Variables6.
- Page 103 and 104:
6.2.3 Built-in ParametersFields, Pa
- Page 105 and 106:
Fields, Parameters, and VariablesRe
- Page 107 and 108:
Fields, Parameters, and Variables6.
- Page 109 and 110:
Fields, Parameters, and VariablesTa
- Page 111 and 112:
Bands and GroupsCHAPTER 7BANDS AND
- Page 113 and 114:
Bands and Groupsexpression may be r
- Page 115 and 116:
Bands and GroupsFigure 7-6Dragging
- Page 117 and 118:
Bands and GroupsFigure 7-10The firs
- Page 119 and 120:
Bands and GroupsFigure 7-14 shows t
- Page 121 and 122:
7.3 Other Group OptionsBands and Gr
- Page 123 and 124:
Fonts and StylesCHAPTER 8FONTS AND
- Page 125 and 126:
Fonts and StylesThe list of availab
- Page 127 and 128:
Fonts and StylesFigure 8-5Font Exte
- Page 129 and 130:
Fonts and StylesFigure 8-7Font Exte
- Page 131 and 132:
Fonts and StylesFigure 8-10The new
- Page 133 and 134:
Fonts and StylesTo apply a style to
- Page 135 and 136:
Fonts and StylesFigure 8-17The outl
- Page 137 and 138:
TemplatesCHAPTER 9TEMPLATESOne of t
- Page 139 and 140:
TemplatesFigure 9-2Columnar reportA
- Page 141 and 142:
TemplatesFigure 9-4Group by step in
- Page 143 and 144:
TemplatesIf a static text element i
- Page 145 and 146:
TemplatesFigure 9-8Your custom temp
- Page 147 and 148:
TemplatesFigure 9-10New template in
- Page 149 and 150:
TemplatesFigure 9-12Preview of repo
- Page 151 and 152:
SubreportsCHAPTER 10 SUBREPORTSSubr
- Page 153 and 154:
SubreportsFigure 10-3Subreport elem
- Page 155 and 156:
SubreportsFigure 10-4Subreport Para
- Page 157 and 158:
SubreportsFigure 10-7Just a list of
- Page 159 and 160:
SubreportsFigure 10-11 Subreport Wi
- Page 161 and 162:
SubreportsFigure 10-14 The final re
- Page 163 and 164:
Subreports3. Click the Add button t
- Page 165 and 166:
Subreports10.4 Using the Subreport
- Page 167 and 168:
SubreportsFigure 10-21 Subreport co
- Page 169 and 170:
SubreportsFigure 10-23 Setting Subr
- Page 171 and 172:
Data Sources and Query ExecutersCHA
- Page 173 and 174:
Data Sources and Query Executers•
- Page 175 and 176:
Data Sources and Query ExecutersFig
- Page 177 and 178:
Data Sources and Query ExecutersFig
- Page 179 and 180:
Data Sources and Query ExecutersFig
- Page 181 and 182:
Data Sources and Query ExecutersFig
- Page 183 and 184:
Data Sources and Query ExecutersFig
- Page 185 and 186:
Data Sources and Query ExecutersFig
- Page 187 and 188:
Data Sources and Query Executers•
- Page 189 and 190:
Data Sources and Query ExecutersAft
- Page 191 and 192:
Data Sources and Query ExecutersIns
- Page 193 and 194:
Data Sources and Query Executerspub
- Page 195 and 196:
Data Sources and Query ExecutersFig
- Page 197 and 198:
Data Sources and Query ExecutersFig
- Page 199 and 200:
Data Sources and Query Executersbe
- Page 201 and 202:
Data Sources and Query ExecutersFig
- Page 203 and 204:
Data Sources and Query ExecutersWhe
- Page 205 and 206:
Data Sources and Query ExecutersCod
- Page 207 and 208:
Data Sources and Query ExecutersPre
- Page 209 and 210:
Data Sources and Query ExecutersFig
- Page 211 and 212:
Data Sources and Query Executersspe
- Page 213 and 214:
Data Sources and Query Executers•
- Page 215 and 216:
Data Sources and Query Executersof
- Page 217 and 218:
Data Sources and Query ExecutersThi
- Page 219 and 220:
Data Sources and Query ExecutersCod
- Page 221 and 222:
Data Sources and Query ExecutersIf
- Page 223 and 224:
ChartsCHAPTER 12 CHARTSUR provides
- Page 225 and 226:
ChartsFigure 12-3Chart selection wi
- Page 227 and 228:
ChartsFigure 12-6Dataset configurat
- Page 229 and 230:
settings). These four fields have t
- Page 231 and 232:
ChartsFigure 12-10 Chart Theme Desi
- Page 233 and 234:
ChartsFigure 12-12 Example chart th
- Page 235 and 236:
Run your report. iReport should dis
- Page 237 and 238:
Charts1. First create a report.Figu
- Page 239 and 240:
Charts4. Right-click on the chart a
- Page 241 and 242: Flash ChartsCHAPTER 13 FLASH CHARTS
- Page 243 and 244: Flash ChartsThe layout properties f
- Page 245 and 246: Flash ChartsThe following figure sh
- Page 247 and 248: Flash ChartsTable 13-2Entity IDs of
- Page 249 and 250: Flash ChartsTable 13-3Entity expres
- Page 251 and 252: Flash ChartsFigure 13-10 Specifying
- Page 253 and 254: Flash ChartsFigure 13-12 Bar chart
- Page 255 and 256: Flash ChartsFigure 13-16 The Charts
- Page 257 and 258: Flash ChartsFigure 13-19 Advanced o
- Page 259 and 260: Flash ChartsFigure 13-22 Entering t
- Page 261 and 262: Flash ChartsFigure 13-24 Specifying
- Page 263 and 264: Flash ChartsSpark LineSpark ColumnS
- Page 265 and 266: Flash ChartsFigure 13-32 Common opt
- Page 267 and 268: Flash ChartsFigure 13-35 Output of
- Page 269 and 270: Flash ChartsFigure 13-39 Output of
- Page 271 and 272: Flash ChartsFigure 13-43 Example of
- Page 273 and 274: Flash ChartsFigure 13-46 Specifying
- Page 275 and 276: Flash ChartsFigure 13-49 Specifying
- Page 277 and 278: Lists, Tables, and BarcodesCHAPTER
- Page 279 and 280: Lists, Tables, and BarcodesFor your
- Page 281 and 282: Lists, Tables, and Barcodesidentifi
- Page 283 and 284: Lists, Tables, and BarcodesList ele
- Page 285 and 286: 14.2 TablesLists, Tables, and Barco
- Page 287 and 288: Lists, Tables, and BarcodesiReport
- Page 289 and 290: Lists, Tables, and BarcodesFigure 1
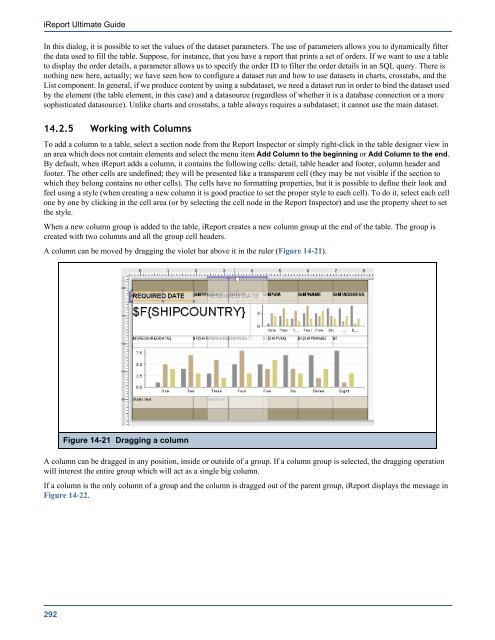
- Page 291: Lists, Tables, and BarcodesSimilarl
- Page 295 and 296: Lists, Tables, and BarcodesFigure 1
- Page 297 and 298: Lists, Tables, and BarcodesWhen usi
- Page 299 and 300: SubdatasetsCHAPTER 15 SUBDATASETSRe
- Page 301 and 302: SubdatasetsUR permits you to use a
- Page 303 and 304: SubdatasetsFigure 15-7Initial layou
- Page 305 and 306: SubdatasetsFigure 15-11 Pie dataset
- Page 307 and 308: CrosstabsCHAPTER 16 CROSSTABSA cros
- Page 309 and 310: CrosstabsUsing the Crosstab Wizard,
- Page 311 and 312: CrosstabsFigure 16-6Outline tree vi
- Page 313 and 314: CrosstabsFigure 16-8Adding a Row Gr
- Page 315 and 316: CrosstabsFigure 16-11 Empty row tot
- Page 317 and 318: CrosstabsFigure 16-16 Crosstab Prop
- Page 319 and 320: CrosstabsFigure 16-19 Crosstab Data
- Page 321 and 322: CrosstabsFigure 16-22 The result of
- Page 323 and 324: InternationalizationCHAPTER 17 INTE
- Page 325 and 326: InternationalizationFigure 17-2Crea
- Page 327 and 328: InternationalizationFigure 17-6New
- Page 329 and 330: InternationalizationFigure 17-7Loca
- Page 331 and 332: ScriptletsCHAPTER 18 SCRIPTLETSA sc
- Page 333 and 334: ScriptletsTable 18-1Report eventsEv
- Page 335 and 336: ScriptletsFigure 18-3Adding a Jar t
- Page 337 and 338: ScriptletsFigure 18-5Build output18
- Page 339 and 340: ScriptletsIf you want to add more s
- Page 341 and 342: ScriptletsThis is what you get in t
- Page 343 and 344:
Scriptletsterminates the report exe
- Page 345 and 346:
Additional ToolsCHAPTER 19 ADDITION
- Page 347 and 348:
Additional ToolsFigure 19-3Date and
- Page 349 and 350:
Additional ToolsFigure 19-4Percenta
- Page 351 and 352:
19.5 How to Run the SamplesAddition
- Page 353 and 354:
Chart Theme ExampleAPPENDIX ACHART
- Page 355 and 356:
Chart Theme ExampleCode Example A-1
- Page 357 and 358:
IndexINDEXAAdd selected field(s) 20
- Page 359 and 360:
Indexcomponents 241embedded in Java
- Page 361 and 362:
Indexscriptlets 53sheets. See prope