iReport Ultimate Guide - Nimsoft Library
iReport Ultimate Guide - Nimsoft Library iReport Ultimate Guide - Nimsoft Library
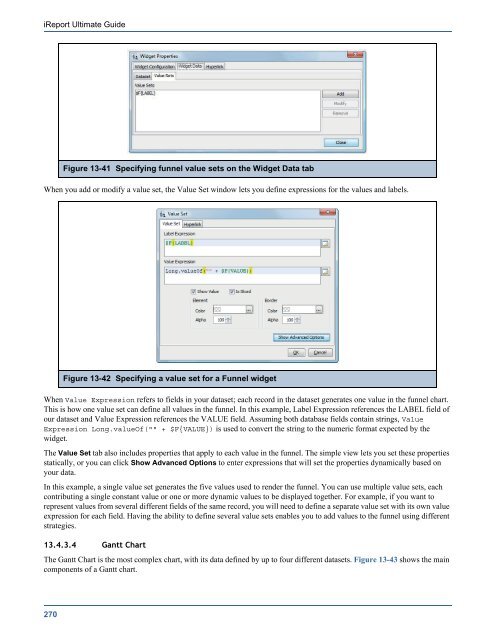
iReport Ultimate GuideFigure 13-41 Specifying funnel value sets on the Widget Data tabWhen you add or modify a value set, the Value Set window lets you define expressions for the values and labels.Figure 13-42 Specifying a value set for a Funnel widgetWhen Value Expression refers to fields in your dataset; each record in the dataset generates one value in the funnel chart.This is how one value set can define all values in the funnel. In this example, Label Expression references the LABEL field ofour dataset and Value Expression references the VALUE field. Assuming both database fields contain strings, ValueExpression Long.valueOf("" + $F{VALUE}) is used to convert the string to the numeric format expected by thewidget.The Value Set tab also includes properties that apply to each value in the funnel. The simple view lets you set these propertiesstatically, or you can click Show Advanced Options to enter expressions that will set the properties dynamically based onyour data.In this example, a single value set generates the five values used to render the funnel. You can use multiple value sets, eachcontributing a single constant value or one or more dynamic values to be displayed together. For example, if you want torepresent values from several different fields of the same record, you will need to define a separate value set with its own valueexpression for each field. Having the ability to define several value sets enables you to add values to the funnel using differentstrategies.13.4.3.4 Gantt ChartThe Gantt Chart is the most complex chart, with its data defined by up to four different datasets. Figure 13-43 shows the maincomponents of a Gantt chart.270
Flash ChartsFigure 13-43 Example of a Gantt chartIn order to create a Gantt chart, you must define at least a category set, a process and a task. Due to its unique options, theGantt chart has more properties tabs than the other widgets.Figure 13-44 Gantt Configuration tab of the Gantt Properties window13.4.3.5 Category SetsA category set is composed of one or more categories; the categories appear in Gantt charts as column headings (seeFigure 13-43). Each category is defined by a time range and a label. The Gantt chart shown in Figure 13-43 has two categorysets, the first one has two categories, one labeled Q4 2009 and the other Q1 2010. The second category set contains fourcategories, one for each month. The date range of each category has been defined to correctly fit the time line, so Q4 2009spans from 2009-10-01 to 2009-12-31, October spans from 2009-10-01 to 2009-10-31 and so on.271
- Page 219 and 220: Data Sources and Query ExecutersCod
- Page 221 and 222: Data Sources and Query ExecutersIf
- Page 223 and 224: ChartsCHAPTER 12 CHARTSUR provides
- Page 225 and 226: ChartsFigure 12-3Chart selection wi
- Page 227 and 228: ChartsFigure 12-6Dataset configurat
- Page 229 and 230: settings). These four fields have t
- Page 231 and 232: ChartsFigure 12-10 Chart Theme Desi
- Page 233 and 234: ChartsFigure 12-12 Example chart th
- Page 235 and 236: Run your report. iReport should dis
- Page 237 and 238: Charts1. First create a report.Figu
- Page 239 and 240: Charts4. Right-click on the chart a
- Page 241 and 242: Flash ChartsCHAPTER 13 FLASH CHARTS
- Page 243 and 244: Flash ChartsThe layout properties f
- Page 245 and 246: Flash ChartsThe following figure sh
- Page 247 and 248: Flash ChartsTable 13-2Entity IDs of
- Page 249 and 250: Flash ChartsTable 13-3Entity expres
- Page 251 and 252: Flash ChartsFigure 13-10 Specifying
- Page 253 and 254: Flash ChartsFigure 13-12 Bar chart
- Page 255 and 256: Flash ChartsFigure 13-16 The Charts
- Page 257 and 258: Flash ChartsFigure 13-19 Advanced o
- Page 259 and 260: Flash ChartsFigure 13-22 Entering t
- Page 261 and 262: Flash ChartsFigure 13-24 Specifying
- Page 263 and 264: Flash ChartsSpark LineSpark ColumnS
- Page 265 and 266: Flash ChartsFigure 13-32 Common opt
- Page 267 and 268: Flash ChartsFigure 13-35 Output of
- Page 269: Flash ChartsFigure 13-39 Output of
- Page 273 and 274: Flash ChartsFigure 13-46 Specifying
- Page 275 and 276: Flash ChartsFigure 13-49 Specifying
- Page 277 and 278: Lists, Tables, and BarcodesCHAPTER
- Page 279 and 280: Lists, Tables, and BarcodesFor your
- Page 281 and 282: Lists, Tables, and Barcodesidentifi
- Page 283 and 284: Lists, Tables, and BarcodesList ele
- Page 285 and 286: 14.2 TablesLists, Tables, and Barco
- Page 287 and 288: Lists, Tables, and BarcodesiReport
- Page 289 and 290: Lists, Tables, and BarcodesFigure 1
- Page 291 and 292: Lists, Tables, and BarcodesSimilarl
- Page 293 and 294: Lists, Tables, and BarcodesFigure 1
- Page 295 and 296: Lists, Tables, and BarcodesFigure 1
- Page 297 and 298: Lists, Tables, and BarcodesWhen usi
- Page 299 and 300: SubdatasetsCHAPTER 15 SUBDATASETSRe
- Page 301 and 302: SubdatasetsUR permits you to use a
- Page 303 and 304: SubdatasetsFigure 15-7Initial layou
- Page 305 and 306: SubdatasetsFigure 15-11 Pie dataset
- Page 307 and 308: CrosstabsCHAPTER 16 CROSSTABSA cros
- Page 309 and 310: CrosstabsUsing the Crosstab Wizard,
- Page 311 and 312: CrosstabsFigure 16-6Outline tree vi
- Page 313 and 314: CrosstabsFigure 16-8Adding a Row Gr
- Page 315 and 316: CrosstabsFigure 16-11 Empty row tot
- Page 317 and 318: CrosstabsFigure 16-16 Crosstab Prop
- Page 319 and 320: CrosstabsFigure 16-19 Crosstab Data
<strong>iReport</strong> <strong>Ultimate</strong> <strong>Guide</strong>Figure 13-41 Specifying funnel value sets on the Widget Data tabWhen you add or modify a value set, the Value Set window lets you define expressions for the values and labels.Figure 13-42 Specifying a value set for a Funnel widgetWhen Value Expression refers to fields in your dataset; each record in the dataset generates one value in the funnel chart.This is how one value set can define all values in the funnel. In this example, Label Expression references the LABEL field ofour dataset and Value Expression references the VALUE field. Assuming both database fields contain strings, ValueExpression Long.valueOf("" + $F{VALUE}) is used to convert the string to the numeric format expected by thewidget.The Value Set tab also includes properties that apply to each value in the funnel. The simple view lets you set these propertiesstatically, or you can click Show Advanced Options to enter expressions that will set the properties dynamically based onyour data.In this example, a single value set generates the five values used to render the funnel. You can use multiple value sets, eachcontributing a single constant value or one or more dynamic values to be displayed together. For example, if you want torepresent values from several different fields of the same record, you will need to define a separate value set with its own valueexpression for each field. Having the ability to define several value sets enables you to add values to the funnel using differentstrategies.13.4.3.4 Gantt ChartThe Gantt Chart is the most complex chart, with its data defined by up to four different datasets. Figure 13-43 shows the maincomponents of a Gantt chart.270


