An Introduction to Bioconductor's ExpressionSet Class
An Introduction to Bioconductor's ExpressionSet Class
An Introduction to Bioconductor's ExpressionSet Class
- No tags were found...
Create successful ePaper yourself
Turn your PDF publications into a flip-book with our unique Google optimized e-Paper software.
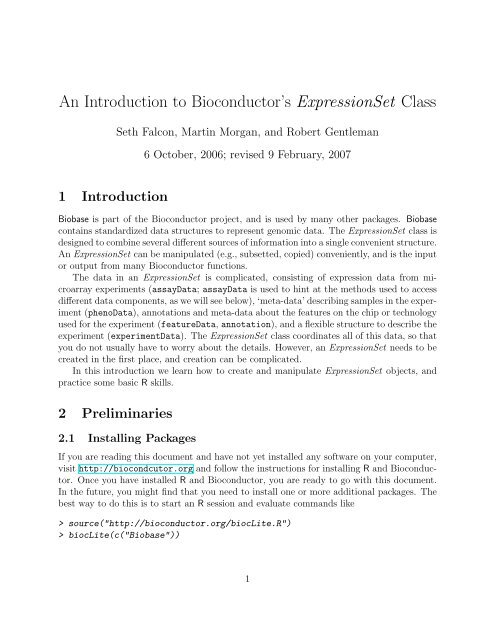
<strong>An</strong> <strong>Introduction</strong> <strong>to</strong> Bioconduc<strong>to</strong>r’s <strong>ExpressionSet</strong> <strong>Class</strong>Seth Falcon, Martin Morgan, and Robert Gentleman6 Oc<strong>to</strong>ber, 2006; revised 9 February, 20071 <strong>Introduction</strong>Biobase is part of the Bioconduc<strong>to</strong>r project, and is used by many other packages. Biobasecontains standardized data structures <strong>to</strong> represent genomic data. The <strong>ExpressionSet</strong> class isdesigned <strong>to</strong> combine several different sources of information in<strong>to</strong> a single convenient structure.<strong>An</strong> <strong>ExpressionSet</strong> can be manipulated (e.g., subsetted, copied) conveniently, and is the inpu<strong>to</strong>r output from many Bioconduc<strong>to</strong>r functions.The data in an <strong>ExpressionSet</strong> is complicated, consisting of expression data from microarrayexperiments (assayData; assayData is used <strong>to</strong> hint at the methods used <strong>to</strong> accessdifferent data components, as we will see below), ‘meta-data’ describing samples in the experiment(phenoData), annotations and meta-data about the features on the chip or technologyused for the experiment (featureData, annotation), and a flexible structure <strong>to</strong> describe theexperiment (experimentData). The <strong>ExpressionSet</strong> class coordinates all of this data, so thatyou do not usually have <strong>to</strong> worry about the details. However, an <strong>ExpressionSet</strong> needs <strong>to</strong> becreated in the first place, and creation can be complicated.In this introduction we learn how <strong>to</strong> create and manipulate <strong>ExpressionSet</strong> objects, andpractice some basic R skills.2 Preliminaries2.1 Installing PackagesIf you are reading this document and have not yet installed any software on your computer,visit http://biocondcu<strong>to</strong>r.org and follow the instructions for installing R and Bioconduc<strong>to</strong>r.Once you have installed R and Bioconduc<strong>to</strong>r, you are ready <strong>to</strong> go with this document.In the future, you might find that you need <strong>to</strong> install one or more additional packages. Thebest way <strong>to</strong> do this is <strong>to</strong> start an R session and evaluate commands like> source("http://bioconduc<strong>to</strong>r.org/biocLite.R")> biocLite(c("Biobase"))1
2.2 Loading PackagesThe definition of the <strong>ExpressionSet</strong> class along with many methods for manipulating ExpressionSe<strong>to</strong>bjects are defined in the Biobase package. In general, you need <strong>to</strong> load classand method definitions before you use them. When using Bioconduc<strong>to</strong>r, this means loadingR packages using library or require.> library("Biobase")Exercise 1What happens when you try <strong>to</strong> load a package that is not installed?When using library, you get an error message. With require, thereturn value is FALSE and a warning is printed.3 Building an <strong>ExpressionSet</strong> From .CEL and other filesMany users have access <strong>to</strong> .CEL or other files produced by microarray chip manufacturerhardware. Usually the strategy is <strong>to</strong> use a Bioconduc<strong>to</strong>r package such as affyPLM, affy, oligo,or limma, <strong>to</strong> read these files. These Bioconduc<strong>to</strong>r packages have functions (e.g., ReadAffy,expresso, or justRMA in affy) <strong>to</strong> read CEL files and perform preliminary preprocessing, and<strong>to</strong> represent the resulting data as an <strong>ExpressionSet</strong> or other type of object. Suppose theresult from reading and preprocessing CEL or other files is named object, and object isdifferent from <strong>ExpressionSet</strong>; a good bet is <strong>to</strong> try, e.g.,> library(convert)> as(object, "<strong>ExpressionSet</strong>")It might be the case that no converter is available. The path then is <strong>to</strong> extract relevant datafrom object and use this <strong>to</strong> create an <strong>ExpressionSet</strong> using the instructions below.4 Building an <strong>ExpressionSet</strong> From ScratchAs mentioned in the introduction, the data from many high-throughput genomic experiments,such as microarray experiments, usually consist of several conceptually distinct parts:assay data, phenotypic meta-data, feature annotations and meta-data, and a description ofthe experiment. We’ll construct each of these components, and then assemble them in<strong>to</strong> an<strong>ExpressionSet</strong>.2
4.1 Assay dataOne important part of the experiment is a matrix of ‘expression’ values. The values areusually derived from microarrays of one sort or another, perhaps after initial processing bymanufacturer software or Bioconduc<strong>to</strong>r packages. The matrix has F rows and S columns,where F is the number of features on the chip and S is the number of samples.A likely scenario is that your assay data is in a ’tab-delimited’ text file (as exported froma spreadsheet, for instance) with rows corresponding <strong>to</strong> features and columns <strong>to</strong> samples.The strategy is <strong>to</strong> read this file in<strong>to</strong> R using the read.table command, converting the result<strong>to</strong> a matrix. A typical command <strong>to</strong> read a tab-delimited file that includes column ‘headers’is> dataDirec<strong>to</strong>ry exprsFile exprs exprsFile class(exprs)[1] "matrix"> dim(exprs)[1] 500 26> colnames(exprs)[1] "A" "B" "C" "D" "E" "F" "G" "H" "I" "J" "K" "L" "M" "N" "O"[16] "P" "Q" "R" "S" "T" "U" "V" "W" "X" "Y" "Z"> head(exprs[, 1:5])3
A B C D EAFFX-MurIL2_at 192.7420 85.75330 176.7570 135.5750 64.49390AFFX-MurIL10_at 97.1370 126.19600 77.9216 93.3713 24.39860AFFX-MurIL4_at 45.8192 8.83135 33.0632 28.7072 5.94492AFFX-MurFAS_at 22.5445 3.60093 14.6883 12.3397 36.86630AFFX-BioB-5_at 96.7875 30.43800 46.1271 70.9319 56.17440AFFX-BioB-M_at 89.0730 25.84610 57.2033 69.9766 49.58220At this point, we can create a minimal <strong>ExpressionSet</strong> object:> minimalSet pDataFile pData dim(pData)[1] 26 3> rownames(pData)[1] "A" "B" "C" "D" "E" "F" "G" "H" "I" "J" "K" "L" "M" "N" "O"[16] "P" "Q" "R" "S" "T" "U" "V" "W" "X" "Y" "Z"> summary(pData)gender type scoreFemale:11 Case :15 Min. :0.1000Male :15 Control:11 1st Qu.:0.3275Median :0.4150Mean :0.53693rd Qu.:0.7650Max. :0.98004
pData[c(15, 20), c("gender", "type")]gender typeO Female CaseT Female Case> pData[pData$score > 0.8, ]gender type scoreE Female Case 0.93G Male Case 0.96X Male Control 0.98Y Female Case 0.94Investiga<strong>to</strong>rs often find that the meaning of simple column names does not provide enoughinformation about the covariate – What is the cryptic name supposed <strong>to</strong> represent? Whatunits are the covariates measured in? We can create a data frame containing such meta-data(or read the information from a file using read.table) with> metadata phenoData phenoData<strong>An</strong> object of class "<strong>An</strong>notatedDataFrame"rowNames: A, B, ..., Z (26 <strong>to</strong>tal)varLabels and varMetadata description:gender: Patient gendertype: Case/control statusscore: Tumor progress on XYZ scaleSome useful operations on an <strong>An</strong>notatedDataFrame include sampleNames, pData (<strong>to</strong> extractthe original pData data.frame), and varMetadata. In addition, <strong>An</strong>notatedDataFrame objectscan be subset much like a data.frame:6
head(pData(phenoData))gender type scoreA Female Control 0.75B Male Case 0.40C Male Control 0.73D Male Case 0.42E Female Case 0.93F Male Control 0.22> phenoData[c("A", "Z"), "gender"]<strong>An</strong> object of class "<strong>An</strong>notatedDataFrame"rowNames: A, ZvarLabels and varMetadata description:gender: Patient gender> pData(phenoData[phenoData$score > 0.8, ])gender type scoreE Female Case 0.93G Male Case 0.96X Male Control 0.98Y Female Case 0.944.3 <strong>An</strong>notations and feature dataMeta-data on features is as important as meta-data on samples, and can be very large anddiverse. A single chip design (i.e., collection of features) is likely <strong>to</strong> be used in many differentexperiments, and it would be inefficient <strong>to</strong> repeatedly collect and coordinate the same metadatafor each <strong>ExpressionSet</strong> instance. Instead, the ideas is <strong>to</strong> construct specialized meta-datapackages for each type of chip or instrument. Many of these packages are available from theBioconduc<strong>to</strong>r web site. These packages contain information such as the gene name, symboland chromosomal location. There are other meta-data packages that contain the informationthat is provided by other initiatives such as GO and KEGG. The annotate package providesbasic data manipulation <strong>to</strong>ols for the meta-data packages.The appropriate way <strong>to</strong> create annotation data for features is very straight-forward: weprovide a character string identifying the type of chip used in the experiment. For instance,the data we are using is from the Affymetrix hgu95av2 chip:> annotation
4.4 Experiment descriptionBasic description about the experiment (e.g., the investiga<strong>to</strong>r or lab where the experimentwas done, an overall title, and other notes) can be recorded by creating a MIAME object.One way <strong>to</strong> create a MIAME object is <strong>to</strong> use the new function:> experimentData exampleSet minimalSet help("<strong>ExpressionSet</strong>-class")When you print an <strong>ExpressionSet</strong> object, a brief summary of the contents of the objectis displayed (displaying the entire object would fill your screen with numbers):> exampleSet8
<strong>ExpressionSet</strong> (s<strong>to</strong>rageMode: lockedEnvironment)assayData: 500 features, 26 sampleselement names: exprsphenoDatasampleNames: A, B, ..., Z (26 <strong>to</strong>tal)varLabels and varMetadata description:gender: Patient gendertype: Case/control statusscore: Tumor progress on XYZ scalefeatureDatafeatureNames: AFFX-MurIL2_at, AFFX-MurIL10_at, ..., 31739_atfvarLabels and fvarMetadata description: noneexperimentData: use 'experimentData(object)'<strong>An</strong>notation: hgu95av2(500 <strong>to</strong>tal)5.1 Accessing Data ElementsA number of accessor functions are available <strong>to</strong> extract data from an <strong>ExpressionSet</strong> instance.You can access the columns of the phenotype data (an <strong>An</strong>notatedDataFrame instance) using$:> exampleSet$gender[1:5][1] Female Male Male Male FemaleLevels: Female Male> exampleSet$gender[1:5] == "Female"[1] TRUE FALSE FALSE FALSE TRUEYou can retrieve the names of the features using featureNames.datasets, the feature names are the probe set identifiers.For many microarray> featureNames(exampleSet)[1:5][1] "AFFX-MurIL2_at" "AFFX-MurIL10_at" "AFFX-MurIL4_at"[4] "AFFX-MurFAS_at" "AFFX-BioB-5_at"The unique identifiers of the samples in the data set are available via the sampleNamesmethod. The varLabels method lists the column names of the phenotype data:> sampleNames(exampleSet)[1:5][1] "A" "B" "C" "D" "E"9
varLabels(exampleSet)[1] "gender" "type" "score"Extract the expression matrix and the <strong>An</strong>notatedDataFrame of sample information usingexprs and phenoData, respectively:> mat dim(mat)[1] 500 26> adf adf<strong>An</strong> object of class "<strong>An</strong>notatedDataFrame"sampleNames: A, B, ..., Z (26 <strong>to</strong>tal)varLabels and varMetadata description:gender: Patient gendertype: Case/control statusscore: Tumor progress on XYZ scale5.1.1 SubsettingProbably the most useful operation <strong>to</strong> perform on <strong>ExpressionSet</strong> objects is subsetting. Subsettingan <strong>ExpressionSet</strong> is very similar <strong>to</strong> subsetting the expression matrix that is containedwithin the <strong>ExpressionSet</strong>, the first argument subsets the features and the second argumentsubsets the samples. Here are some examples: Create a new <strong>ExpressionSet</strong> consisting of the5 features and the first 3 samples:> vv dim(vv)Features Samples5 3> featureNames(vv)[1] "AFFX-MurIL2_at" "AFFX-MurIL10_at" "AFFX-MurIL4_at"[4] "AFFX-MurFAS_at" "AFFX-BioB-5_at"> sampleNames(vv)[1] "A" "B" "C"Create a subset consisting of only the male samples:10
males males<strong>ExpressionSet</strong> (s<strong>to</strong>rageMode: lockedEnvironment)assayData: 500 features, 15 sampleselement names: exprsphenoDatasampleNames: B, C, ..., X (15 <strong>to</strong>tal)varLabels and varMetadata description:gender: Patient gendertype: Case/control statusscore: Tumor progress on XYZ scalefeatureDatafeatureNames: AFFX-MurIL2_at, AFFX-MurIL10_at, ..., 31739_atfvarLabels and fvarMetadata description: noneexperimentData: use 'experimentData(object)'<strong>An</strong>notation: hgu95av2(500 <strong>to</strong>tal)6 What was used <strong>to</strong> create this documentThe version number of R and the packages and their versions that were used <strong>to</strong> generate thisdocument are listed below.ˆ R version 2.9.0 (2009-04-17), i386-pc-mingw32ˆ Locale: LC_COLLATE=English_United States.1252;LC_CTYPE=English_United States.1252;LC_ˆ Base packages: base, datasets, graphics, grDevices, methods, stats, <strong>to</strong>ols, utilsˆ Other packages: Biobase 2.4.111







![Tratamientos y MD_2009 [Modo de compatibilidad].pdf - Catie](https://img.yumpu.com/49175499/1/190x134/tratamientos-y-md-2009-modo-de-compatibilidadpdf-catie.jpg?quality=85)