Wildlife Restoration ROI Report - Association of Fish and Wildlife ...
Wildlife Restoration ROI Report - Association of Fish and Wildlife ...
Wildlife Restoration ROI Report - Association of Fish and Wildlife ...
- No tags were found...

You also want an ePaper? Increase the reach of your titles
YUMPU automatically turns print PDFs into web optimized ePapers that Google loves.
Financial Returns to Industry from theFederal Aid in <strong>Wildlife</strong> <strong>Restoration</strong> ProgramFebruary 15, 2011byAndrew L<strong>of</strong>tus Consulting3116 Munz Drive, Suite A, Annapolis, MD 21403(410) 295-5997al<strong>of</strong>tus@<strong>and</strong>rewl<strong>of</strong>tus.com&Southwick Associates, Inc.PO Box 6435, Fern<strong>and</strong>ina Beach, FL 32035904-277-9765rob@southwickassociates.com
This publication was funded by the Multistate Conservation Grant Program, aprogram supported with funds from the <strong>Wildlife</strong> <strong>and</strong> Sport <strong>Fish</strong> <strong>Restoration</strong> Program<strong>of</strong> the U.S. <strong>Fish</strong> <strong>and</strong> <strong>Wildlife</strong> Service <strong>and</strong> jointly managed with the <strong>Association</strong> <strong>of</strong><strong>Fish</strong> <strong>and</strong> <strong>Wildlife</strong> Agencies
AcknowledgementsThis document was produced for the <strong>Association</strong> <strong>of</strong> <strong>Fish</strong> <strong>and</strong> <strong>Wildlife</strong> Agencies under aMulti-State Conservation grant (#DC M-73-C) awarded by the U.S. <strong>Fish</strong> <strong>and</strong> <strong>Wildlife</strong>Service. Development was contracted to a team led by L<strong>of</strong>tus Consulting <strong>and</strong> SouthwickAssociates, Inc. Authors were Andrew L<strong>of</strong>tus, Rob Southwick, Bob Byrne <strong>and</strong> LisaBragg. Assistance in data collection was provided by Donna Leonard. The project wouldnot have been possible without key input <strong>and</strong> assistance from the following individuals<strong>and</strong> organizations: the project steering team consisting <strong>of</strong> Gordon Robertson <strong>of</strong> theAmerican Sportfishing <strong>Association</strong>, Mitch King <strong>and</strong> Jay McAninch <strong>of</strong> the Archery Trade<strong>Association</strong>, Doug Painter <strong>of</strong> the National Shooting Sports Foundation, <strong>and</strong> ChadKlinkenborg <strong>and</strong> Carol Bambery <strong>of</strong> the <strong>Association</strong> <strong>of</strong> <strong>Fish</strong> <strong>and</strong> <strong>Wildlife</strong> Agencies(AFWA). Special appreciation is extended to Eric Schwaab <strong>and</strong> Christina Zarrella,formerly <strong>of</strong> the AFWA, who led the planning <strong>and</strong> development <strong>of</strong> this project.Other key individuals who assisted in providing ideas <strong>and</strong> information include:Lisa Van Alstyne, USFWS <strong>Wildlife</strong> <strong>and</strong> Sport <strong>Fish</strong> <strong>Restoration</strong> ProgramGlen Salmon, USFWS <strong>Wildlife</strong> <strong>and</strong> Sport <strong>Fish</strong> <strong>Restoration</strong> ProgramThomas McCoy, USFWS <strong>Wildlife</strong> <strong>and</strong> Sport <strong>Fish</strong> <strong>Restoration</strong> ProgramLuther Zachary, USFWS <strong>Wildlife</strong> <strong>and</strong> Sport <strong>Fish</strong> <strong>Restoration</strong> ProgramSteve Barton, USFWS <strong>Wildlife</strong> <strong>and</strong> Sport <strong>Fish</strong> <strong>Restoration</strong> ProgramSteve Williams, <strong>Wildlife</strong> Management InstituteBrian Bohnsack, USFWS Division <strong>of</strong> Partnerships <strong>and</strong> Program SupportDepartment <strong>of</strong> the Interior Library staff, <strong>and</strong> theThe case studies in this report were dependent on data <strong>and</strong> assistance from many statewildlife agency <strong>and</strong> non-government organization staff, including: Brad Gunn, MikeSeamster, Dain Palmer, Genie Walker, Tom Bidrowski, Gary Costanzo, Gary Camus,Pennsylvania Game Commission; Michael Pruss, Pennsylvania Game Commission;Robert Boyd, Benjamin Jones, Melanie Weaver, Boyde Blackwell, Alan Clark, AlanCharles, Ron Fritz, Jeff Rawlinson, Curt Robertson, Rusty Garrison, Jay Cook, Dr. JohnFischer, Leslie Marker, Anna Seidman, Dr. Karl J. Martin, David Macfarl<strong>and</strong>, SteveBittner, <strong>and</strong> Harry Spiker. The authors also wish to thank the many others whogenerously volunteered other case studies <strong>and</strong> assistance, but where the necessarydata ultimately were not available.Despite the contributions <strong>of</strong> many, the authors remain solely responsible for all contentherein.i
EXECUTIVE SUMMARYSince 1932, firearms <strong>and</strong> ammunition manufacturers have paid a federal excise on theproducts they manufacture.However, until 1937 these funds were deposited in the general treasury <strong>of</strong> the UnitedStates <strong>and</strong> did not directly benefit manufacturers. In that year, sportsmen <strong>and</strong>businesses teamed with conservation-minded policy makers to redirect these existingexcise taxes to the new Pittman-Robertson <strong>Wildlife</strong> <strong>Restoration</strong> Program, which hascontinued ever since.The concept <strong>of</strong> redirecting these taxes to benefit wildlife populations was simple: Byinvesting in improvements to wildlife populations <strong>and</strong> public access, more people wouldgo hunting <strong>and</strong> the sales <strong>of</strong> items that generated this tax would increase.This partnership between the hunting <strong>and</strong> shooting-sports industries, hunters, <strong>and</strong> state<strong>and</strong> federal wildlife agencies has restored many wildlife populations to unimaginablenumbers <strong>and</strong> provides an incredible array <strong>of</strong> hunting opportunities, as documented inthis text.Today, there are more than twice as many hunters than there were in 1937. Purchases<strong>of</strong> tax related items by hunters have increased by nearly 45% in constant dollars since1970.Fueling this growth, in part, has been the reliable funding that was provided by theexcise tax. In 2009, excise taxes on hunting equipment totaled $484,765,728 fromsales <strong>of</strong> firearms, archery equipment <strong>and</strong> ammunition. These taxes are distributed tothe states to invest in projects that improve wildlife populations, provide improvedaccess to the huntable l<strong>and</strong>s, or to develop shooting-sports facilities -- in short, toincrease the number <strong>of</strong> recreational hunting <strong>and</strong> shooting opportunities.However, as with any capital investment that a business makes, companies want toknow the quantitative return received from this investment. To help answer this, ananalysis was conducted at the national <strong>and</strong> local levels using actual data on excisetaxes invested <strong>and</strong> hunter purchases <strong>of</strong> excise-tax related products. This analysisrevealed the following long-term <strong>and</strong> short-term insights about the returns from theexcise taxes paid by firearm <strong>and</strong> ammunition manufacturers:Long Term Benefits: In 1937, 11 states had no open seasons for deer <strong>and</strong> three others hadonly local seasons. Virtually all <strong>of</strong> the remaining states had far more restrictiveseasons than enjoyed today. Examples <strong>of</strong> hunting then compared to nowinclude: Missouri's deer season was only three days long, <strong>and</strong> only 108 deerwere harvested. In 2009, hunters in the Show Me state hunted deer for
more than 123 days – more than a 4,000% increase – <strong>and</strong> took morethan 295,000 deer. In 1910, Colorado estimated there were approximately 1,000 elk in thestate. In 1937, Colorado held a seven-day elk season. In 2008, elkhunters in Colorado could potentially hunt for 128 days, <strong>and</strong> 170,500hunters harvested more than 45,200 elk. North Carolina historically had a long fall turkey season even duringtimes when turkeys were scarce. The fall season was closed in 1971,<strong>and</strong> spring turkey hunting was not permitted. By 1977, 144 wild turkeyswere reported taken in the state‟s spring season. By 2008, the springharvest exploded <strong>and</strong> 10,404 birds were taken; an increase <strong>of</strong> 7,200%. Wisconsin grouse hunters would have had to travel out-<strong>of</strong>-state in1937 to hunt ruffed grouse as their season was closed. Today, theBadger state is a destination for grouse hunters from around thecountry, where they enjoy a 136 day season. A pheasant hunter in South Dakota had only restrictive, local seasonsto hunt in 1937. Today, pheasant hunters enjoy an 86-day, state-wideseason. In 2010, 11 states provide more than five times as much waterfowlhunting opportunity (150 or more hunting days); 23 states providemore than four-times as much waterfowl hunting opportunity (120 ormore hunting days); <strong>and</strong> 13 states provide more than three times asmuch waterfowl hunting opportunity (90 or more hunting days)compared to what was available in 1937 (30 days).Though common today, in 1937 no states had dedicated bow ormuzzleloading seasons.With greater wildlife populations, the number <strong>of</strong> Americans hunting – thecustomer base for businesses paying the tax – increased nearly 2-1/2times between 1937 <strong>and</strong> 1982. Even though the number <strong>of</strong> hunters hasrecently declined, there were still more than twice as many hunters in2010 as there were in 1937, based on state license sales.Many more examples for additional states are included within the text.Nearer Term Benefits: In constant dollars, the estimated return on investment to manufacturerswho paid the excise tax (referred to as the “Excise Tax-Related <strong>ROI</strong>”) rangedbetween a low <strong>of</strong> 823% in 1976 to a high <strong>of</strong> 1,588% in 1997. Though it is not possible to determine the <strong>ROI</strong> for all individual projectsfunded by the <strong>Wildlife</strong> <strong>Restoration</strong> Program, <strong>ROI</strong>s ranged from 32% to 3,877%for the positive-<strong>ROI</strong> projects analyzed in this report.iii
Some projects may have a negative <strong>ROI</strong> to the industry, but a positive<strong>ROI</strong> to the economy <strong>and</strong> the sport in general. Such projects <strong>of</strong>fer value byproviding the knowledge needed to develop new hunting opportunities in thefuture, or access to new hunting l<strong>and</strong>s. Efforts funded by the excise tax havehelped defend our right to hunt by upholding modern scientific management <strong>of</strong>wildlife in the face <strong>of</strong> legal challenges seeking to end various hunts.In constant (2009) dollar terms, consumer purchases <strong>of</strong> tax-related hunting <strong>and</strong>shooting equipment at the retail level over the period ranged between a low <strong>of</strong> $2.8billion in 1970 to $5.2 billion in 1996 (in 2009 dollars), while excise tax collectionsranged between a low <strong>of</strong> $177 million in 1984 to a high <strong>of</strong> $324 million in 1994 (in 2009dollars).Several important factors significantly leverage the power <strong>of</strong> excise-tax dollars paid byindustry: By law, excise tax dollars spent by state wildlife agencies must bematched by at least 25% <strong>of</strong> outside funds; in reality this match is much greaterbecause numerous other funding sources also contribute to wildlife restorationefforts. The impact <strong>of</strong> these funds is an inherent “return” to industry sincemany <strong>of</strong> these projects would not likely have been conducted without the corefunding provided by excise taxes. Investment in conservation <strong>and</strong> access projects is long-term <strong>and</strong> builds <strong>of</strong>f<strong>of</strong> investments by previous generations. For example, l<strong>and</strong> <strong>and</strong> water accesspurchased now will benefit hunters <strong>and</strong> industry for generations to come.Thus, some <strong>of</strong> the financial returns attributable to any given year may havebeen sown through investments made in preceding years or decades.While the financial attributes <strong>of</strong> the excise tax that were the focus <strong>of</strong> this analysis areparamount to individual companies, several other aspects <strong>of</strong> the <strong>Wildlife</strong> <strong>Restoration</strong>Program also have implications for a company‟s long-term financial health, including: Prior to passage <strong>of</strong> the <strong>Wildlife</strong> <strong>Restoration</strong> Act, state license fees paid byhunters were <strong>of</strong>ten diverted for purposes not related to hunting, such assupporting public schools. Now, prior to receiving any excise tax dollars, states must certify that theirhunter-license dollars are only used for administration <strong>of</strong> fish or wildlifeprograms, thus protecting those state-license revenues for programsbenefiting hunting <strong>and</strong> their supporting industries. Every year since 1938, the amount <strong>of</strong> hunter-license dollars protected hasexceeded the amount <strong>of</strong> excise taxes paid by manufacturers by as much as1,000%, thus vastly increasing the purchasing power <strong>of</strong> industry‟s investment. By federal law, hunting excise-tax monies must be appropriated byCongress for their intended use <strong>and</strong> cannot be diverted or held up for otherpurposes. An act <strong>of</strong> Congress <strong>and</strong> agreement by the President would berequired to change this.
The investments made in conserving <strong>and</strong> developing hunting opportunities createadditional benefits to other parts <strong>of</strong> the economy beyond hunting <strong>and</strong> shooting-sportsmanufacturers, which are further quantified in this report.The federal excise tax on hunting <strong>and</strong> shooting-sports equipment has created thefoundation for the most successful conservation <strong>and</strong> wildlife-restoration program in theworld. Erosion <strong>of</strong> support for the program or diminishment <strong>of</strong> the payments made intothe excise tax would have immediate impacts on the ability <strong>of</strong> state agencies to providecontinued hunting opportunities.The most dangerous implications for industry from eliminating the excise tax are longterm. However, some impacts would be immediate. Under mounting state budgetdeficits, <strong>and</strong> without the protection afforded by the <strong>Wildlife</strong> <strong>Restoration</strong> Act, state licensedollars would likely be diverted for other purposes. Subsequently, outside fundingcurrently leveraged by excise tax dollars would likely be lost to other uses.To recoup this loss <strong>and</strong> maintain the current level <strong>of</strong> wildlife management, huntinglicensefees would likely have to be increased dramatically, causing huntingparticipation to decline. In addition, the reduced long-term investment into thefoundation <strong>of</strong> the hunting <strong>and</strong> shooting-sports industries -- wildlife populations, publicaccess, <strong>and</strong> the recruitment <strong>of</strong> future customers – would cause a continued downwardspiral <strong>of</strong> hunter participation, which would further diminish hunter spending on theequipment produced by manufacturers. In short, the loss <strong>of</strong> excise-tax funding wouldresult in a loss <strong>of</strong> hunters, a loss <strong>of</strong> hunter spending, a loss <strong>of</strong> wildlife, <strong>and</strong> a smallerpolitical base willing to work on the conservation issues upon which the hunting <strong>and</strong>shooting-sports industries are built.v
TABLE OF CONTENTSIntroduction ..................................................................................................................................... 1Conservation: A Capital Investment in Your Business .............................................................. 1More Than 70 Years Building Field-Sports Industries ............................................................... 2Then <strong>and</strong> Now ............................................................................................................................. 3Overview <strong>of</strong> the <strong>Wildlife</strong> <strong>Restoration</strong> Program .............................................................................. 3What Items Are Taxed? .............................................................................................................. 3<strong>Restoration</strong> Programs: Unique, Protected <strong>and</strong> Strong ................................................................ 3Methods, Definitions <strong>and</strong> Contents................................................................................................. 4Estimating Return On Investment ............................................................................................... 5Estimating Annual Hunter/Angler Spending at the National Level ........................................... 8Case Study Selection................................................................................................................... 8History <strong>and</strong> Evolution <strong>of</strong> the <strong>Wildlife</strong> <strong>Restoration</strong> Program .......................................................... 9Long Term Trends <strong>and</strong> Current Program Status ....................................................................... 11Returns on Investment .............................................................................................................. 16The Effect <strong>of</strong> Time Lags ........................................................................................................... 18Programs Funded By the Tax ................................................................................................... 18Benefits to Industry ....................................................................................................................... 19Leveraged Funds ....................................................................................................................... 19Then And Now: What Would Hunting And Conservation Look Like Without The <strong>Wildlife</strong><strong>Restoration</strong> Program?................................................................................................................ 20More <strong>Wildlife</strong> Translates Into More Hunting ....................................................................... 21Potential Hunting-Opportunity Days ........................................................................................ 21Archers <strong>and</strong> Muzzleloaders Cash In On the Conservation Dividend ................................... 27Case Studies .................................................................................................................................. 29Conservation <strong>and</strong> Management Case Studies ........................................................................... 29Case #1: North Carolina Wild Turkey Re-introduction ........................................................ 29Case #2: Virginia Resident Canada Geese............................................................................ 33Access <strong>and</strong> L<strong>and</strong>-Management Case Studies ........................................................................... 38Case #3: Pennsylvania Game L<strong>and</strong>s ..................................................................................... 38Case #4: Utah's Cooperative <strong>Wildlife</strong>-Management Unit Program ...................................... 40Case #5: Montana Block-Management Program .................................................................. 43Hunter Education <strong>and</strong> Recruitment Case Studies ..................................................................... 47Case #6: Hunter Education in Idaho Case Study .................................................................. 47Case #7: Nebraska National Archery in the School Program ............................................... 50Case #8: Brown County Sportsman Club Shooting Range, South Dakota .......................... 52Case #9: Georgia Shooting Range: Chickasawatchee WMA ............................................... 55Case #10: Ben Avery Shooting Facility, Arizona ................................................................. 57Other Value-Added Case Studies ............................................................................................. 59Case #11: Southeastern Cooperative <strong>Wildlife</strong> Disease Study .............................................. 59Case #12: National <strong>Wildlife</strong> Refuge Hunting Lawsuit ......................................................... 61Case #13: Wisconsin Bear-Population Estimation ............................................................... 64Case #14: Maryl<strong>and</strong> Bear Hunting ....................................................................................... 66Conclusion .................................................................................................................................... 70Appendix A: Taxable Equipment Items ....................................................................................... 73
Appendix B: Hunting Recreation Purchases by Category ............................................................ 75Appendix C: Macro-level Purchase Estimation: Model Results <strong>and</strong> Raw Data .......................... 76Appendix D: Archery <strong>and</strong> Muzzleloader Hunters, Days, <strong>and</strong> Purchases (1975-2006) ............... 79Appendix E: Growth in Hunting Opportunity (Maps): Bear, Grouse, Quail, Rabbit, Squirrel ... 80Appendix F: Growth in Hunting Opportunity (Tables) ............................................................... 83vii
IntroductionEvery three months, companies involved in the hunting, <strong>and</strong> shooting-sports industrieswrite checks to the federal government. This excise tax -- 10% on most products – is alarge investment by companies into the future <strong>of</strong> their industry. However, just as withany investment, companies want to know the financial return they receive from thetaxes paid. To the extent possible, this document evaluates the “return” this excise taxgenerates to the bottom line <strong>of</strong> those paying companies.The original supporters <strong>of</strong> this tax in 1937 recognized the need for a stable fundingsource to bolster America‟s struggling wildlife populations. On the face <strong>of</strong> it, the formulafor the program, termed the <strong>Wildlife</strong> <strong>Restoration</strong> Program, seems simple: abundant,sustainable wildlife populations yield abundant <strong>and</strong> diverse hunting opportunitiesleading to increased sales <strong>of</strong> shooting/archery equipment. However, like manyapparently simple things, they get more complicated once you scratch the surface.So, how do you obtain abundant sustainable wildlife populations? Again, the answerseems simple enough: make long term investments in scientific wildlife management,have a trained <strong>and</strong> dedicated staff to advocate for <strong>and</strong> implement innovative programs,protect wildlife populations <strong>and</strong> habitat, <strong>and</strong> enforce strict wildlife protection laws thatalso allow for regulated harvests that are available to the general public. In a word, thisformula is called Conservation.The system that has been developed <strong>and</strong> implemented in the United States is,arguably, the best system in the world for restoring <strong>and</strong> managing wildlife populations<strong>and</strong> sustaining hunting, <strong>and</strong> shooting-sports businesses. This system, known as theNorth American Model <strong>of</strong> <strong>Wildlife</strong> Conservation, has succeeded in restoring wildlifepopulations to abundance unimaginable by early conservationists. It is also a testamentto those who have followed, have understood the value <strong>of</strong> this system, <strong>and</strong> have beenwilling to continue to make sacrifices <strong>and</strong> investments to strengthen Conservationprograms.Conservation: A Capital Investment in Your BusinessNone <strong>of</strong> this remarkable success could happen without a strong partnership amongsportsmen, state <strong>and</strong> federal fish-<strong>and</strong>-wildlife agencies, <strong>and</strong> the shooting-sports <strong>and</strong>hunting industries. At its core this partnership supplies reliable funding for Conservationthrough the sale <strong>of</strong> hunting licenses combined with excise taxes on shooting sportsequipment.This funding is best viewed as a capital investment in Conservation, where the capitalbeing generated is the wildlife populations themselves. The dividends paid from thiscapital investment are the innumerable hunting opportunities available today. Today‟shunting <strong>and</strong> shooting sports industries can be viewed as positive by-products <strong>of</strong>abundant sustainable wildlife populations that result from investments in Conservation.However, it is important to note that numerous other programs contribute to this1
success. These include, among others: federal <strong>and</strong> state funding for pollutionprevention activities; passage <strong>of</strong> state bonds for game l<strong>and</strong> purchase <strong>and</strong> protection<strong>and</strong> open space; funding for agricultural programs that provide habitat, protect wetl<strong>and</strong>s,<strong>and</strong> conserve soil; federal funding for acquiring <strong>and</strong> managing public l<strong>and</strong>s; privatel<strong>and</strong>owners; <strong>and</strong> numerous contributions made by national <strong>and</strong> local non-governmentorganizations to support wildlife research <strong>and</strong> protect habitat.Viewing wildlife populations as a capital investment is similar to viewing yourmanufacturing facility as a capital investment. Making long-term, continuousinvestments to maintain or improve these buildings is a wise strategy that will maintaintheir value <strong>and</strong> pay dividends over the long-term. It is important to note that most capitalinvestments do not yield immediate returns on investments. However, over time, theseinvestments pay huge dividends to the wise investor.For industry, conservation isn‟t the only factor affecting business. Ensuring that hunters<strong>and</strong> shooting enthusiasts have access to facilities <strong>and</strong> the wildlife resources is alsoparamount. <strong>Wildlife</strong> <strong>Restoration</strong> excise taxes are used to acquire <strong>and</strong> develop l<strong>and</strong>s<strong>and</strong> other infrastructure to ensure that your customers have access to game populations<strong>and</strong> hunting opportunities. Shooting ranges, hunter education classes, <strong>and</strong> educationalfacilities foster the participation <strong>of</strong> the next generation <strong>of</strong> customers who will keep yourbusiness running.A great conservationist, Aldo Leopold, succinctly wrote about this partnership in A S<strong>and</strong>County Almanac: "We fancy that industry supports us, forgetting what supportsindustry." There is no question, Conservation programs support the industry.More Than 70 Years Building Field-Sports IndustriesWhile it is hard to imagine the dire straights that wildlife was in prior to the <strong>Wildlife</strong><strong>Restoration</strong> Program, it is equally hard to imagine what the hunting <strong>and</strong> shooting-sportsindustries would be like if these Conservation programs were not successful. Thesuccess <strong>of</strong> these programs has allowed millions <strong>of</strong> Americans to enjoy hunting in waysthat were not possible even 50 years ago. The success <strong>of</strong> these Conservation programsalso allowed the development <strong>of</strong> shooting-sports <strong>and</strong> hunting industries that are theenvy <strong>of</strong> the rest <strong>of</strong> the world!Keeping the partnership among sportsmen, state <strong>and</strong> federal wildlife agencies, <strong>and</strong> theshooting-sports industries strong is the only way to provide abundant, sustainablewildlife populations for the future. While the success <strong>of</strong> these programs is remarkable,the work is far from over. At a time when today‟s state agencies face a multitude <strong>of</strong> newissues <strong>and</strong> dem<strong>and</strong>s beyond traditional fish-<strong>and</strong>-game activities, continued excise-taxfunding is critical to the continuing efforts to maintain <strong>and</strong> improve wildlife conservation,l<strong>and</strong> acquisition <strong>and</strong> the development <strong>of</strong> effective recruitment <strong>and</strong> retention efforts thatwill continue to build the base on which our user-pays/user-benefits system depends.
Taken together, investing in Conservation, access to the resources, <strong>and</strong> recruitment <strong>of</strong>the next generation <strong>of</strong> sportsmen through your excise taxes has paid huge dividends forthe hunting <strong>and</strong> shooting-sports industries for well over 70 years. Beyond simplyhighlighting the multitudes <strong>of</strong> good projects supported through the years, this reportdemonstrates the financial return that investment into the <strong>Wildlife</strong> <strong>Restoration</strong> excisetaxes brings to your industry.Then <strong>and</strong> NowThe “Then <strong>and</strong> Now” section <strong>of</strong> this report illustrates how dire wildlife conservation wasa mere 100 years ago. It further shows the success <strong>of</strong> programs that are currently inplace across the nation. The “Now” portion <strong>of</strong> that section reflects these dividends. Thehunting <strong>and</strong> shooting-sports industries, <strong>and</strong> the hunting opportunities, are the byproducts<strong>of</strong> abundant, sustainable wildlife populations that result from long-terminvestments in Conservation.Overview <strong>of</strong> the <strong>Wildlife</strong> <strong>Restoration</strong> ProgramThe <strong>Wildlife</strong> <strong>Restoration</strong> Program is <strong>of</strong>ten called one <strong>of</strong> the most successful userpays/user-benefitsprograms in the world. Industry, through its payment <strong>of</strong> dedicatedexcise taxes, provides the foundation for wildlife management programs, which in turnbenefit hunters who purchase equipment from those same manufacturers. In 2009,wildlife-related companies provided $484,765,728 for the Pittman-Robertson <strong>Wildlife</strong><strong>Restoration</strong> fund from the sale <strong>of</strong> firearms, archery equipment <strong>and</strong> ammunition.What Items Are Taxed?A complete list <strong>of</strong> items currently subject to the manufacturer‟s excise tax is found inAppendix A. In general, these items are used predominately by hunters, <strong>and</strong> shootingenthusiasts. While numerous changes have been made to the items taxed <strong>and</strong> thevarious tax rates on specific items, for the most part the core list <strong>of</strong> items taxed has notchanged substantially since originally being implemented.<strong>Restoration</strong> Programs: Unique, Protected <strong>and</strong> StrongThe <strong>Wildlife</strong> <strong>Restoration</strong> Program contains several ingenious provisions that are rarelyfound in federal legislation. For example, the act establishing this program captures anexcise tax that was already being paid by manufacturers <strong>and</strong> applies it directly toprograms that benefit recreational hunting <strong>and</strong> shooting activities <strong>and</strong> industries. Inaddition, two other provisions deserve mention.The “permanent appropriation” language, now incorporated into the act, is also unique.This concept, originally included in <strong>Wildlife</strong> <strong>Restoration</strong>‟s sister program, the Sport <strong>Fish</strong><strong>Restoration</strong> Program, was so objectionable to politicians that they convinced then-3
President Truman to veto the first Sport <strong>Fish</strong> <strong>Restoration</strong> bill because <strong>of</strong> it. Thisprovision now m<strong>and</strong>ates Congress to allocate the funds collected from the excise tax tothe <strong>Wildlife</strong> <strong>Restoration</strong> Program. It would take another act <strong>of</strong> Congress <strong>and</strong> agreementby the President to redirect these funds for something other than supporting wildlifeconservation. In addition, the provision that all funds must “remain available untilexpended” also is a rarity in a political system that is well known for budgetmaneuvering by the powers <strong>of</strong> the day.Another uniquely significant provision <strong>of</strong> the <strong>Wildlife</strong> <strong>Restoration</strong> Program is a conditionthat requires states to enact a prohibition against the diversion <strong>of</strong> the license fees paidby anglers <strong>and</strong> hunters for any purpose other than the administration <strong>of</strong> state fish <strong>and</strong>game departments. Prior to enactment <strong>of</strong> this federal legislation, license dollars fromsportsmen were <strong>of</strong>ten viewed by state governments as simply another source <strong>of</strong> generalfund revenue to build roads, schools, prisons etc. Because <strong>of</strong> this provision, the <strong>Wildlife</strong><strong>Restoration</strong> Act protects hunters‟ dollars that likely would not be applied to enhancingwildlife populations. Over the years this provision has paid huge dividends; in everyyear the amount <strong>of</strong> funding made available through hunter licenses outstrips the fundsmade available through <strong>Wildlife</strong> <strong>Restoration</strong> Program funds. In 2010 this provisionensured that $776,886,267 in hunting license revenue went toward state wildlifeconservation efforts 1 . These funds were matched by $472,719,710 from the <strong>Wildlife</strong><strong>Restoration</strong> tax 2 .As a result, industry‟s investment is more than doubled even before thefunding hits the ground.Methods, Definitions <strong>and</strong> ContentsDeveloping a st<strong>and</strong>ard Return-On-Investment (<strong>ROI</strong>) relationship for a program wheremoney flows between private industry, the federal government, more than 50state/territorial governments, hunters, <strong>and</strong> back to industry is very complex. Differentaccounting systems at each level complicate calculations.Furthermore, both <strong>Wildlife</strong> <strong>Restoration</strong> program requires that states contribute additionalfunds to match the industry‟s contribution into specific projects. While the minimum“st<strong>and</strong>ard” match is 25%, most projects utilize the <strong>Wildlife</strong> <strong>Restoration</strong> funds as corefunding that is <strong>of</strong>ten leveraged with additional funds. States commonly buildsignificantly greater project budgets by leveraging other state, federal, <strong>and</strong> privatefunding sources. Despite this, the <strong>Wildlife</strong> <strong>Restoration</strong> funds are <strong>of</strong>ten irreplaceablecatalysts for these projects, even though the final contribution to the budget may be onlya fraction <strong>of</strong> the total project costs.In addition, calculations are complicated because <strong>of</strong> inherent time lags between the timea product is manufactured, the time <strong>of</strong> first sale <strong>and</strong> tax collection, the time when the tax1 Source: U.S. <strong>Fish</strong> <strong>and</strong> <strong>Wildlife</strong> Service, <strong>Wildlife</strong> <strong>and</strong> Sport <strong>Fish</strong> <strong>Restoration</strong> Program, license certification for2010.2 Source; Final apportionment figures from U.S. <strong>Fish</strong> <strong>and</strong> <strong>Wildlife</strong> Service, <strong>Wildlife</strong> <strong>and</strong> Sport <strong>Fish</strong> <strong>Restoration</strong>Program.
is appropriated to the state agencies, when the funds are budgeted for a project, <strong>and</strong>when a project is fully implemented. As a result, it can be years between themanufacture <strong>of</strong> a product <strong>and</strong> the implementation <strong>of</strong> a new conservation project.Perhaps most importantly, investments into conservation projects are <strong>of</strong>ten long-terminvestments <strong>and</strong> difficult to assess. Rebuilding depleted wildlife populations orconducting comprehensive habitat improvements can take years or decades to paydividends in the form <strong>of</strong> improved wildlife populations <strong>and</strong> increased hunting activitywhich generates sales <strong>of</strong> products.Despite these complexities, a multi-tiered approach has been developed to assessreturns to industry. This approach relies on several levels <strong>of</strong> data analysis: A macro-level analysis <strong>of</strong> the growth <strong>of</strong> the hunting <strong>and</strong> shooting-sportsindustries since the initiation <strong>of</strong> the <strong>Wildlife</strong> <strong>Restoration</strong> Programs.A fine-scale review <strong>of</strong> selected case studies (specific projects) that haveutilized <strong>Wildlife</strong> <strong>Restoration</strong> funding.A vision <strong>of</strong> the implications to hunting in the absence <strong>of</strong> the <strong>Wildlife</strong><strong>Restoration</strong> Program.Although the benefits <strong>of</strong> a project may be a result <strong>of</strong> investments from a variety <strong>of</strong>funding sources, it is assumed in each case that the <strong>Wildlife</strong> <strong>Restoration</strong> funding wasvital to the conduct <strong>of</strong> the projects.Estimating Return On InvestmentThe “return on investment measure” compares net benefits from the investment to thecosts <strong>of</strong> the investment. The metric is very flexible <strong>and</strong> can be modified by adjusting thedefinition <strong>of</strong> benefits <strong>and</strong> costs. This approach applies the measure at two scales. Thesmaller scale, which is the return to the tax-paying companies from their investment <strong>of</strong>the excise tax, is represented by the following equation:Excise-Tax-Related <strong>ROI</strong> = [(Wholesale adjusted spending by hunters ontax-related equipment items) - (Excise-tax-related investments)] /(Excise-tax-related investments).The benefit to industry is defined as the retail on tax-related equipment items by hunters<strong>and</strong> shooting sports enthusiasts, adjusted to account for the amount <strong>of</strong> each salepassed from retailers <strong>and</strong> wholesalers to manufacturers who pay the tax. An averagemark-up <strong>of</strong> 30 percent is assumed. 3 Investments are defined as the amount <strong>of</strong> excisetax collected (macro analysis) or invested into a specific project (micro analysis). AnExcise Tax-Related <strong>ROI</strong> is estimated for the nation as whole <strong>and</strong> for each individualcase study.3 National Sports Shooting Foundation: Annual Retail Survey. Southwick Associates. 2009.5
The larger scale <strong>ROI</strong> is the return to the overall economy from all investments made intoa project <strong>and</strong> is represented by the following equation:Total Project <strong>ROI</strong> = [(Total trip <strong>and</strong> equipment spending onhunting/shooting related recreation) – (Total project investments)] /(Total project investments).Benefits (or “return”) are defined as total purchases by hunters <strong>and</strong> shooting sportsenthusiasts across both trip <strong>and</strong> equipment categories (lodging, food, transportation,equipment, etc.). Investments are defined as the total dollar value <strong>of</strong> investmentscontributed to cover project costs. This calculation shows the return from allinvestments, including additional funds leveraged by excise tax dollars, <strong>and</strong> is meant tohelp communicate benefits from the program to communities <strong>and</strong> others besidescompanies who pay the tax. Adjustments are not made for manufacturing-to-retail pricemark-ups.In either case, the estimated ratio can be either positive or negative. A negative <strong>ROI</strong>indicates that the project generated benefits less than the funds invested. A positive<strong>ROI</strong> indicates that the project generated net benefits greater than those fund invested.It is important to note that positive <strong>ROI</strong> estimates are expressed in terms reflecting thatthe initial investment, at a minimum, is returned. Using the Excise Tax-Related <strong>ROI</strong> asan example, a <strong>ROI</strong> <strong>of</strong> 95% can be interpreted the following way:Invested Funds: $100,000Wholesale adjusted sales in tax-related equipment items: $195,000Net Benefit: $95,000Excise Tax-Related <strong>ROI</strong>: 95%In this case, industry received, in taxable equipment-related sales, the amount <strong>of</strong> theinitial investment plus an additional amount that was equal to 95% <strong>of</strong> the initialinvestment.Typical hunter tax-related purchases, per day <strong>and</strong> annual, were derived from theNational Survey <strong>of</strong> <strong>Fish</strong>ing, Hunting, <strong>and</strong> <strong>Wildlife</strong>-Associated Recreation (“NationalSurvey”). All purchase data reflect only those associated with hunting-relatedrecreation. Tax-related purchases reflect only those items that are taxed. Thesesurveys are conducted on a five-to-six year basis, yet many <strong>of</strong> the case studiespresented here span multiple years <strong>and</strong> in some cases multiple decades. As a result,hunter purchases were interpolated, when necessary, to estimate spending duringintervening years. A simple linear interpolation method was applied. An equivalenttechnique was utilized for the macro-level analysis. A second approach, linearregression, was also incorporated at the national level, <strong>and</strong> the methodology isdiscussed in greater depth in the following subsection.
National Survey data are reported at both the national <strong>and</strong> state level as well as threesub-categories based upon game pursued (big game, small game, <strong>and</strong> migratory bird).Whenever possible, estimates are most closely related to the data for a particular regionor state <strong>and</strong> type <strong>of</strong> game animal pursued. However, the state-level data for a particularquarry (big game, migratory bird) lists only “equipment” which includes items outside <strong>of</strong>the tax related list. On the other h<strong>and</strong>, the national level report itemizes the equipmentcategories according to quarry <strong>and</strong> breaks out a specific “hunting equipment” category.Therefore, the national level data allows the determination <strong>of</strong> exactly which items aretax-related <strong>and</strong> the amount spent by hunters across the nation. To accommodate thesedifferences <strong>and</strong> add specificity to the state level analysis for individual case studies, theproportion <strong>of</strong> total purchases attributable only to tax related items at the national levelwas applied to total purchases at the state level to estimate purchases for tax relateditems at the state level. For example, to determine the dollars spent by big gamehunters in Montana on taxable items, if big game hunting represents 16.7 percent <strong>of</strong>national purchases made by hunters for taxable items, then this same percentage, 16.7percent, is applied to the total purchases by hunters in Montana. 4<strong>Wildlife</strong> <strong>Restoration</strong> funds work to improve game-species habitat <strong>and</strong> populationsdirectly. Many indirect effects also accrue as a result <strong>of</strong> those efforts, such as l<strong>and</strong>preservation <strong>and</strong> species biodiversity. These benefits go well beyond retail salesgenerated on tax-related items, but are outside <strong>of</strong> the realm <strong>of</strong> this investigation.The investment portion <strong>of</strong> the estimated return, again, is defined as either the actual<strong>Wildlife</strong> <strong>Restoration</strong> funds (for Excise Tax-Related <strong>ROI</strong> ) or total funds invested by allproject partners (Total Project <strong>ROI</strong>) to cover project costs. Overhead costs are notincluded at the case study level. Recording <strong>and</strong> accounting practices in place do notenable us to accurately capture project-related overhead costs at the case study level.At the national or macro-level, overhead costs are implicitly included in the Excise Tax-Related <strong>ROI</strong> estimation. With the exception <strong>of</strong> the macro-level analysis, all projectinvestments, including <strong>Wildlife</strong> <strong>Restoration</strong> tax-related investment funds, are reporteddirectly from the states in which the project exists.All costs <strong>and</strong> purchases are inflated to current-day (2009) purchasing power using anappropriate CPI provided by the Bureau <strong>of</strong> Labor Statistics.It is important to note two caveats with respect to interpretation <strong>of</strong> the return-oninvestmentmeasure. First, the Excise-Tax-Related <strong>ROI</strong> excludes leveraged dollarsfrom the definition <strong>of</strong> investments <strong>and</strong> therefore from the calculation. The result is that,in most but not all instances, some may consider the estimated return upwardly biasedfrom the industry perspective. However, this is a valid approach since, without theinvestment <strong>of</strong> excise-tax dollars as a base, most projects would not be able to leverage4 This approach was ground-truthed using detailed National Survey estimates available for each state for 2006 only.The proportionally adjusted tax-related item purchases for 2006 did indeed align with the tax-related equipment itempurchases calculated from the itemized state-level budgets. As a result, it is reasonable to utilize the proportionaladjustment approach using state-level data in the case study analysis.”7
additional matching contributions <strong>and</strong> therefore would not be conducted. Thus theimpact <strong>of</strong> the leveraged dollars is an implicit “return” to the industry on their excise-taxinvestments. Second, return-on-investment estimates can, <strong>and</strong> will, change during thelife <strong>of</strong> a project, <strong>and</strong> different types <strong>of</strong> projects will likely have different ratio estimates.The case studies selected represent a cross section <strong>of</strong> types <strong>of</strong> projects supported byexcise-tax funds.Estimating Annual Hunter/Angler Spending at the National Level<strong>Wildlife</strong> <strong>Restoration</strong> investments at the national level reflect gross receipts received fromthe sale <strong>of</strong> tax-related hunting equipment <strong>and</strong> is obtained directly from the U.S. <strong>Fish</strong> <strong>and</strong><strong>Wildlife</strong> Service. Hunter tax-related equipment purchases are derived from NationalSurvey data <strong>and</strong> reflect only those associated with hunting –related recreation. Bearingin mind that surveys are only conducted every five to six years, two approaches areapplied to estimate hunter spending during non-survey years at the national level. Thefirst approach involved simple linear interpolation. In other words, the differencebetween two consecutive survey years is divided equally over the number <strong>of</strong> interveningyears <strong>and</strong> added to the total tax-related equipment item purchases <strong>of</strong> the previous year.The second approach involved linear regression. There is a strong linear relationshipbetween gross excise-tax receipts <strong>and</strong> tax-related item purchases, which allows asimple regression. .The following model was estimated:Purchases t = f ( collections (t-3) , lic_hold t ).Purchases are defined as hunter purchases <strong>of</strong> tax-related equipment as reported in theeight previous National Surveys. Collections are defined as gross excise-tax receiptsthree years prior to the survey years. This time lag was employed to accommodate thetime lag between point <strong>of</strong> first sale at the manufacturer level (when excise tax is paid)<strong>and</strong> retail sale. A time lag <strong>of</strong> one, two, three, <strong>and</strong> four years was investigated <strong>and</strong> thethree-year time lag reflects the highest level <strong>of</strong> correlation between receipts <strong>and</strong>purchases as well as the best estimator for known purchase values. The “lic_hold”variable reflects certified license holders <strong>and</strong> incorporates the influence <strong>of</strong> the number <strong>of</strong>hunters <strong>and</strong> anglers on total purchases. Detailed statistical output is included inAppendix C. Detailed tables that reflect the model‟s performance are included in theCurrent Status section <strong>and</strong> Appendix C.Case Study SelectionThe vast majority <strong>of</strong> projects funded by <strong>Wildlife</strong> <strong>Restoration</strong> funds simply do not havethe necessary data to calculate an <strong>ROI</strong>. These projects should not be judged as beingless important to wildlife conservation as a result <strong>of</strong> data shortcomings. With fewprojects available to choose from, <strong>and</strong> based on the need to show case studies fromacross the spectrum <strong>of</strong> funded wildlife <strong>and</strong> shooting sports projects, the case studies
presented here were h<strong>and</strong> selected <strong>and</strong> do not represent a r<strong>and</strong>om sampling <strong>of</strong> all<strong>Wildlife</strong> <strong>Restoration</strong> projects.Case studies presented here were identified using a two pronged approach The firstround occurred in early 2009 when state fish-<strong>and</strong>-wildlife departments nationwide wereasked to identify projects that met budget <strong>and</strong> hunter participation data requirements.Approximately 11 projects receiving <strong>Wildlife</strong> <strong>Restoration</strong> funds were received. Followupcontact was made with each project manager to discuss the project as well asinvestigate the availability <strong>of</strong> required data. While a number <strong>of</strong> projects initiallynominated are included as case studies, the breadth <strong>of</strong> projects identified was notviewed to be fully representative <strong>of</strong> the variety <strong>of</strong> projects across the nation receiving<strong>Wildlife</strong> <strong>Restoration</strong> funds. Some project types by themselves do not lend themselves toa quantitative <strong>ROI</strong> analysis (e.g., wildlife health research, education centers) eventhough they ultimately contribute to continued participation in hunting <strong>and</strong> shootingsports. In other cases, investments have not been made to collect the necessary data(e.g., participation before <strong>and</strong> after the project) or the accounting mechanisms in placeat the state level are not suited for breaking out the investment data as needed for an<strong>ROI</strong> analysis.The second approach involved a review <strong>of</strong> U.S. <strong>Fish</strong> <strong>and</strong> <strong>Wildlife</strong> Service‟s Federal AidInformation Management System (FAIMS) database. The goal was to select projectsfor follow-up that would, as a whole, reflect a broad cross-section <strong>of</strong> projects basedupon project type <strong>and</strong> location. Project managers were contacted to discuss the projectas well as investigate the availability <strong>of</strong> required data.None <strong>of</strong> the cases presented should be seen as an affirmation <strong>of</strong> any one particularproject over another. All projects were explored in depth to determine the level <strong>of</strong> dataavailable to analyze a return on investment. Those studies presented here are thosethat <strong>of</strong>fered a rich level <strong>of</strong> data, as well as representing a diverse array <strong>of</strong> fundedprojects.History <strong>and</strong> Evolution <strong>of</strong> the <strong>Wildlife</strong> <strong>Restoration</strong> ProgramWhile the Federal Aid in <strong>Wildlife</strong> <strong>Restoration</strong> program [commonly known as the Pittman-Robertson Act (or PR) in honor <strong>of</strong> its two prime sponsors, Senators Key Pittman (NV)<strong>and</strong> A. Willis Robertson (VA)], was passed into law in 1937, its roots go back more thana decade prior to its passage. In 1919, John B. Burnham, president <strong>of</strong> the AmericanGame <strong>Association</strong> (the predecessor <strong>of</strong> the <strong>Wildlife</strong> Management Institute) wrote, "If theyoung men <strong>of</strong> the next generation are to enjoy from the country's wild life anything likethe benefits derived by present outdoor man, we must be the ones that shoulder the9
urden <strong>and</strong> see that our thoughtlessness or selfishness does not allow us to squ<strong>and</strong>erthat which we hold in trust.” 5The idea behind this statement was to create a network <strong>of</strong> "shooting grounds" <strong>and</strong>"refuges" for the perpetuation <strong>of</strong> wildlife <strong>and</strong> hunting. Shortly thereafter, a proposal wasdrafted to enact a federal hunting stamp. While this idea enjoyed broad support fromnumerous recreational hunting <strong>and</strong> shooting groups, it also had its critics <strong>and</strong> failed tobecome law.However, the debate on how to fund wildlife conservation continued. In 1925, acommittee was formed to find an alternative funding mechanism to the federal-stampidea. This group recommended that an existing 10 percent excise tax on sporting arms<strong>and</strong> ammunition be diverted from general tax receipts to fund the shooting grounds <strong>and</strong>refuge proposal. 6 Before the idea <strong>of</strong> redirecting this existing tax could be implemented,all excise taxes, including those on firearms <strong>and</strong> ammunition, were repealed.The hiatus from paying excise taxes did not last long, <strong>and</strong> they were reinstated in 1932.However, these taxes continued to go into the general tax fund.The reinstatement <strong>of</strong> excise taxes renewed the interest in redirecting the excise tax onfirearms <strong>and</strong> ammunition to fund wildlife conservation. Numerous drafts <strong>of</strong> a potentialbill were written by Carl Shoemaker in early 1937. The drafts were vetted among asmall cadre <strong>of</strong> ardent conservations before they were widely circulated. The bill wasunveiled in the spring <strong>of</strong> 1937 <strong>and</strong> support <strong>of</strong> the bill, with relatively minor changes, wasobtained from the Sporting Arms <strong>and</strong> Ammunition Manufacturers Institute (SAAMI) <strong>and</strong>other conservation-minded organizations. The bill was signed into law on September 2,1937 7 , when the existing excise tax on sporting arms <strong>and</strong> ammunition was redirectedfrom general tax revenue to fund conservation programs.This law has been amended several times since then. The funds were put into a"permanent <strong>and</strong> indefinite" account in 1951, which took them out <strong>of</strong> the annualappropriations process. In 1969, Congressman John Dingle (MI) <strong>and</strong> Senator HughScott (PA) sponsored legislation that redirected an existing excise tax on h<strong>and</strong>guns <strong>and</strong>h<strong>and</strong>gun ammunition into the fund. In 1972, Congressman George Goodling (PA) <strong>and</strong>Senator Frank Moss (UT) sponsored amendments to levy an excise tax on archeryequipment. Hunter education <strong>and</strong> shooting-range construction were added to theallowable projects for funding when h<strong>and</strong>gun <strong>and</strong> archery excise taxes were added tothe fund. 8The funds are collected by the federal government <strong>and</strong> held for one year <strong>and</strong>apportioned to the states for use the next year. They are apportioned through grants5 Restoring America's <strong>Wildlife</strong>: 1937-1987. 1987. United States Department <strong>of</strong> the Interior, <strong>Fish</strong> <strong>and</strong> <strong>Wildlife</strong>Service. U.S. Government Printing Office, Washington, DC. Page 5.6 Ibid. Page 6.7 Ibid. Page 9.8 Ibid. Pages 14-15.
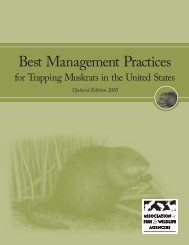
administered by the U.S. <strong>Fish</strong> <strong>and</strong> <strong>Wildlife</strong> Service to the states <strong>and</strong> territories based ona formula that includes the state's population, area <strong>and</strong> hunting license sales. Only statewildlife agencies <strong>and</strong> their counterparts in U.S.-held territories <strong>and</strong> Commonwealths areeligible for these grants. To maintain eligibility, the states <strong>and</strong> territories must enact lawsthat prohibit the diversion <strong>of</strong> hunting-license fees for any purpose other than theadministration <strong>of</strong> "said agencies.” 9 Allowable projects are funded on a 3:1 matchingbasis. In most cases, states use hunting-license dollars for their 25 percent match.The initial legislation focused on wildlife research <strong>and</strong> habit acquisition. However, the list<strong>of</strong> allowable projects has exp<strong>and</strong>ed as new sources <strong>of</strong> funds were added to the program<strong>and</strong> new needs were identified. Funding for law enforcement is specifically prohibitedfrom eligibility. Until 1982, projects were approved on a project-by-project basis.However, today grants are <strong>of</strong>ten approved to fund comprehensive planning <strong>and</strong>management activities. In both cases, projects <strong>of</strong>ten have numerous sub-projects (jobs)<strong>and</strong> tasks assigned to them. Annual reviews <strong>of</strong> projects <strong>and</strong> project approval are jointlyconducted by state <strong>and</strong> federal managers. In addition, independent program audits areconducted in each state every five years to ensure funds are spent according to thelegislation‟s requirements.Over the years, millions <strong>of</strong> dollars have been invested in wildlife conservation from thisfund. This investment created recreational hunting <strong>and</strong> shooting opportunities, which inturn, generated billions <strong>of</strong> dollars in purchases <strong>of</strong> hunting <strong>and</strong> shooting equipment.Long Term Trends <strong>and</strong> Current Program StatusOver the last five years (2005-2009), industry contributed an annual average amount <strong>of</strong>$335,226,416 into the <strong>Wildlife</strong> <strong>Restoration</strong> account. Of this, $76,376,012 (23%) came from theexcise taxes on pistols <strong>and</strong> revolvers; $122,592,006 (36%) from long-guns; $106,635,282 (32%)from ammunition; <strong>and</strong> $29,623,116 (9%) from archery equipment (Figure 1).9 Ibid, Page 21.11
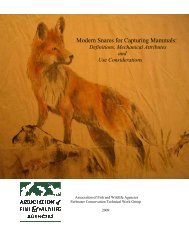
Figure 1. Average Annual Contributions to <strong>Wildlife</strong> <strong>Restoration</strong> Account(2005-2009)Bows & Arrows$29,623,1169%Pistols - Revolvers$76,376,01223%Ammunition$106,635,28232%Firearms$122,592,00636%Source: U.S. <strong>Fish</strong> <strong>and</strong> <strong>Wildlife</strong> ServiceEvery year since 1939, the revenue generated by hunting licenses in the United Stateshas exceeded that provided by <strong>Wildlife</strong> <strong>Restoration</strong> (Figure 2). The amount by whichhunting license revenue has exceeded <strong>Wildlife</strong> <strong>Restoration</strong> funding has been as high as1,000 percent in the early years <strong>of</strong> the program (1943 <strong>and</strong> 1944), <strong>and</strong> has averaged228% annually during the life <strong>of</strong> the program.This means is that before the industry investment even hits the ground, its value isdoubled. As mentioned earlier, without the provision that states cannot divert huntinglicensefunds to other purposes, license money would not likely be available for wildlifemanagement <strong>and</strong> conservation programs.
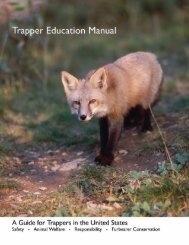
Figure 2. <strong>Wildlife</strong> <strong>Restoration</strong> <strong>and</strong> Hunting License Income in the UnitedStates (1937-2009)From 1937 until 1982, the number <strong>of</strong> certified hunting license holders in the UnitedStates grew steadily (Figure 3). Hunter participation peaked in 1982 at nearly 2-1/2times the number <strong>of</strong> hunters in 1937. Since 1982, the number <strong>of</strong> hunters has declinedby approximately 15%. However, even though the number <strong>of</strong> hunters has recentlydeclined, there were still more than twice as many hunters in 2010 as there were in1937.13
Figure 3. Recreational Hunters in the United States (1937-2009)Source: U.S. <strong>Fish</strong> <strong>and</strong> <strong>Wildlife</strong> Service's National License Certification <strong>Report</strong> <strong>and</strong> National Hunting Statistics <strong>Report</strong>.From 1976-1999, the excise-tax collections on sport-hunting equipment fluctuated, butbegan to increase again in the last ten years (Figure 4). The sharp increase in 2008-09was led by significant increases in excise taxes collected for ammunition <strong>and</strong> h<strong>and</strong>guns.The 2009 excise-tax collections were the highest collections since the program began.
Figure 4. <strong>Wildlife</strong> <strong>Restoration</strong> Excise-Tax Collections (1939-2009) in 2009dollarsAlthough industry has been a long-term partner in the development <strong>and</strong> continuedsuccess <strong>of</strong> these programs, today‟s competitive business climate presents difficultchallenges to companies. The <strong>Wildlife</strong> <strong>Restoration</strong> excise tax is <strong>of</strong>ten one <strong>of</strong> the topthree expenses for a company, challenging the business value <strong>of</strong> paying these taxes,particularly in the absence <strong>of</strong> a measure connecting this expenditure to companypr<strong>of</strong>itability. Traditional communications over the years have described <strong>Wildlife</strong><strong>Restoration</strong> “success” in terms <strong>of</strong> how much money was spent, not how much wasreturned. While this approach is valuable, it is only mildly effective from a businessperspective as companies measure success in earnings.Table 1 provides a comparison between <strong>Wildlife</strong> <strong>Restoration</strong> excise-tax collections <strong>and</strong>hunter purchases <strong>of</strong> tax-related equipment items for the last seven cycles <strong>of</strong> theNational (conducted every five years between 1955 <strong>and</strong> 2006). In years prior to 1970,purchases <strong>of</strong> hunting equipment are reported as an aggregate thereby not allowingitemization <strong>of</strong> spending on tax-related items. It is also important to note that the itemsimpacted by tax collections changed over this period <strong>and</strong> adjustments were made tocalculations to accurately reflect spending on only those items where taxes werecollected. For example, bows <strong>and</strong> arrows were not subject to excise-tax collections priorto the 1975 survey, therefore they are not included as part <strong>of</strong> hunter purchases <strong>of</strong> taxrelateditems in 1970.15
Returns on InvestmentDuring the period available for analysis (1970-2006), excise tax collections rangedbetween a low <strong>of</strong> $177 million in 1984 to a high <strong>of</strong> $305 million in 1995 (based onconstant 2009 dollars). Hunter spending on tax-related equipment items over the periodranged from a low <strong>of</strong> $2.8 billion to a high <strong>of</strong> $5.2 billion. Hunter retail spending is only arough indicator <strong>of</strong> the amount <strong>of</strong> the tax contributed by industry because the tax is leviedat the point <strong>of</strong> first sale, <strong>and</strong> sales related to non-hunting activities such as targetshooting are not included. To estimate an manufacturer-level return on investment, it isnecessary to remove mark-ups in the market chain. Therefore, to account for the markupin prices from manufacturers (which is reflected in the excise tax collections) to retail(which is reflected in hunter purchases), retail purchases were adjusted by a factor <strong>of</strong>1.3, which assumes a thirty percent mark-up. Wholesale adjusted spending rangesbetween $2.1 billion <strong>and</strong> $4.0 billion. An estimated Excise Tax-Related return oninvestment, which reports the returns to manufacturers who pay the tax, rangesbetween a low <strong>of</strong> 957% in 2006 to a high <strong>of</strong> 1,540% in 1996.It is important to remember that the reported returns to manufacturers (Excise-Tax-Related <strong>ROI</strong>) only include the <strong>Wildlife</strong> <strong>Restoration</strong> excise tax as the "investment," whichresults in rather high <strong>ROI</strong>s. Adding in the hunting license funds <strong>and</strong> other leveragedfunding sources not paid directly by manufacturers would greatly reduce the <strong>ROI</strong>sreported in this document, but these would not adequately explain the true <strong>ROI</strong>s to thecompanies who collectively pay the excise tax.Table 1. <strong>Wildlife</strong> Tax Collections <strong>and</strong> Hunter Purchases <strong>of</strong> Tax Related EquipmentItems, 1970-2006 *<strong>Wildlife</strong> <strong>Restoration</strong> ExciseTax CollectionsHunter Purchase <strong>of</strong> Tax Related Equipment ItemsYear** Actual $s 2009 $s Actual $s 2009 $sWholesaleAdjusted 2009$sExciseTax-Related<strong>ROI</strong>1970 $32,805,725 $181,392,830 $506,680,000 $2,801,587,813 $2,155,067,549 1088%1980 $90,644,651 $236,002,809 $1,456,349,000 $3,791,756,619 $2,916,735,861 1136%1985 $115,999,616 $231,284,476 $1,958,339,000 $3,904,611,283 $3,003,547,141 1199%1991 $172,777,090 $272,151,825 $2,431,274,000 $3,829,649,267 $2,945,884,051 982%1996 $180,000,000 $246,122,753 $3,837,045,000 $5,246,578,223 $4,035,829,402 1540%2001 $198,485,863 $240,443,600 $3,080,860,000 $3,732,120,055 $2,870,861,581 1094%2006 $278,244,176 $296,099,557 $3,822,853,000 $4,068,171,697 $3,129,362,844 957%* In years prior to 1970, purchases <strong>of</strong> hunting equipment are reported as an aggregate thereby not allowing itemization <strong>of</strong>spending on tax-related items**In 1975, data was collected by a private contractor utilizing different methodology <strong>and</strong> reporting detail that does not enablecomparisons with other survey years.Figure 5 compares these same excise tax receipts to hunter purchases on taxablehunting equipment (expressed in 2009 dollars) <strong>and</strong> broadens the picture beyond thoseyears when National Survey data were collected. (Note the two graphs are on differentscales.) Similar to Figure 4, annual excise-tax collections fluctuated between $338million in 1976 <strong>and</strong> $177 million in 1984, then rose sharply to $485 million in 2009.
Tax Related Equipment Item Expenditures ($)<strong>Wildlife</strong> <strong>Restoration</strong> Collections ($)Hunter purchases reported for the National Survey are reflected in each <strong>of</strong> the redpoints. 10 To overcome the limitation <strong>of</strong> having data available related to hunter purchasesonly every five or six years, spending is estimated using two different approaches. Thefirst involves linear interpolation between survey years. These estimated hunterpurchases are reflected by the solid black line. It is arguable that spending likely did notsteadily increase from one year to the next, particularly given that excise tax collections,which are a reflection <strong>of</strong> hunter spending, showed annual fluctuations over the period.A second approach utilized the correlation between excise-tax collections <strong>and</strong> hunterspending <strong>and</strong> utilized linear regression. Regression-estimated hunter purchases arereflected by the broken black line. These regression-estimated purchases do sharesome fluctuations with the tax collections.Figure 5. <strong>Wildlife</strong> Tax Collections <strong>and</strong> Tax-Related Equipment Item Purchases:Actual <strong>and</strong> Estimated (1970-2009). All estimates expressed in 2009 dollars.$6,000,000,000$5,500,000,000$5,000,000,000$4,500,000,000$550,000,000$500,000,000$450,000,000$4,000,000,000$3,500,000,000$3,000,000,000$2,500,000,000$2,000,000,000$1,500,000,000$400,000,000$350,000,000$300,000,000$250,000,000$1,000,000,000$500,000,000$0National Survey: Realized ExpendituresRegression Estimated Tax Related ExpendituresLinear Interpolation <strong>of</strong> Tax Related Expenditures<strong>Wildlife</strong> <strong>Restoration</strong> Collections1970 1975 1980 1985 1990 1995 2000 2005 2010Year$200,000,000$150,000,000*A break is placed between National Survey collection years <strong>of</strong> 1985 <strong>and</strong> 1991 to denote a methodological change in surveyimplementation to minimize recall bias. Hunters were asked to report purchases three times during the year to minimize recallbias. This change to implementation impacts the ability to make direct comparisons over the whole period.Using these hunter-spending estimates, it is possible to calculate an annual Excise Tax-Related <strong>ROI</strong> for the whole period between 1970 <strong>and</strong> 2006. After adjusting for marketchain mark-ups <strong>and</strong> inflation, the average annual purchase <strong>of</strong> tax-related items is10 The data point for 1975was interpolated using total hunter purchases <strong>of</strong> tax related equipment items in 1970 <strong>and</strong>1980.17
estimated to be between $3.09 billion <strong>and</strong> $3.13 billion over the period from 1970 to2006. Over the same period, average annual tax collections are $252 million. Thisresults in an estimated annual Excise Tax-Related <strong>ROI</strong> between 1,147% (interpolatedrange: 823% <strong>and</strong> 1588%) <strong>and</strong> 1,161% (regression range: 688% <strong>and</strong> 20,989%). Annualcollections, equipment purchases <strong>and</strong> Excise- Tax-Related <strong>ROI</strong> values are reported forthe whole period in Appendix table C1.The Effect <strong>of</strong> Time LagsIn reality, there is a delay in the time from when the excise-tax payments are made <strong>and</strong>when the resulting hunter purchases take place. Not only are there time lags in thenormal marketplace, but state agencies take time to invest the excise tax funds intoprojects <strong>and</strong> additional time is necessary for those projects to impact the wildliferesources <strong>and</strong> hunter participation. A simple project, such as calculating deer-huntersuccess rates, will have a relatively short time lag since hunters can judge their successagainst the rate <strong>of</strong> other hunters <strong>and</strong> will invest in equipment to improve their chances <strong>of</strong>success. However, projects such as habitat improvement or wildlife reintroductions maytake years to produce changes that create new hunting opportunities or become evidentin equipment purchases. To account for these time lags, comparing excise-taxcollections in a period <strong>of</strong> years prior to purchases may be a more realistic way toevaluate return-on-investment.Using the <strong>of</strong>f-set approach (collections between 1970 – 2001 <strong>and</strong> purchases 1975 –2006, all expressed in 2009 dollars) yields the following: collections total $7.9 billion<strong>and</strong> adjusted hunter purchases <strong>of</strong> tax- related items are estimated to range between$101 billion <strong>and</strong> $105 billion. The estimated Excise-Tax-Related <strong>ROI</strong> is between1,175% <strong>and</strong> 1,222%.Programs Funded By the TaxExcise taxes on sporting arms <strong>and</strong> ammunition, h<strong>and</strong>guns <strong>and</strong> archery equipment aredeposited into the U.S. Treasury, but are collected by the Internal Revenue Service (forarchery-related products), U.S. Customs <strong>and</strong> Border Protection (for imported items),<strong>and</strong> Tax <strong>and</strong> Trade Bureau (for domestically produced firearms <strong>and</strong> ammunition). Theexcise tax paid on imports is due on entering the country. The tax on other equipment ispaid quarterly. The funds are transferred from the U.S. Treasury to the dedicated<strong>Wildlife</strong> <strong>Restoration</strong> Account. The funds are held for one year before they are distributedto eligible agencies according to an allocation formula. The allocation formula wasrecently updated in 2005.Programs eligible for funding include: <strong>Wildlife</strong> <strong>Restoration</strong> (for the restoration, conservation, management, <strong>and</strong>enhancement <strong>of</strong> wild birds <strong>and</strong> wild mammals; <strong>and</strong> providing for public use <strong>and</strong>benefit from these resources).
Hunter Education <strong>and</strong> Shooting Ranges (up to 50 % <strong>of</strong> the receipts fromarchery <strong>and</strong> h<strong>and</strong>guns may be used for educating responsible hunters <strong>and</strong>archers in skills, knowledge, <strong>and</strong> attitudes). Enhancements to the Hunter Education <strong>and</strong> Shooting Range program (fixed at$8 million per year). Administration <strong>of</strong> the program (at the national level; fixed at $3 million per year). Funding <strong>of</strong> the National Survey <strong>of</strong> <strong>Fish</strong>ing, Hunting, <strong>and</strong> <strong>Wildlife</strong>-AssociatedRecreation. Multi-state Conservation Grants (capped at $3 million per year).The <strong>Wildlife</strong> <strong>Restoration</strong> <strong>and</strong> Hunter Education portions <strong>of</strong> these funds are distributed asgrants to states by a formula that takes into account the state's l<strong>and</strong> area <strong>and</strong> number <strong>of</strong>certified licensed hunters. Each year, every state sends in a report certifying the number<strong>of</strong> license holders it has. This report is used in the allocation <strong>of</strong> the funds. All funds arematched on a 3:1 basis. The funds are only paid (reimbursed) after work is completedfor approved projects. Hunter-education programs may use the time contributed byvolunteer instructors as a match for federal funds.Figure 6. Areas <strong>of</strong> invesment <strong>of</strong> <strong>Wildlife</strong> <strong>Restoration</strong> state grants, 2009-2010.Benefits to IndustryLeveraged FundsAn <strong>of</strong>ten overlooked benefit <strong>of</strong> the <strong>Wildlife</strong> <strong>Restoration</strong> Program to the hunting <strong>and</strong>shooting sports industries is the program‟s ability to leverage outside funding for wildlifeenhancementprojects. The most obvious demonstration <strong>of</strong> this leveraging ability is theprovision requiring states to utilize hunter <strong>and</strong> angler license dollars for wildlife <strong>and</strong> sportfish programs as a condition <strong>of</strong> receiving funds. Undoubtedly, if these provisions wereweakened, or the <strong>Wildlife</strong> <strong>Restoration</strong> Program was eliminated, the majority <strong>of</strong> hunting-19
license dollars would eventually be redirected by state legislatures to programs otherthan wildlife management. This is poignantly true in today‟s fiscal climate where stategovernments are facing unprecedented shortfalls <strong>and</strong> are searching for revenuewherever it can be found.Additional leveraging <strong>of</strong>ten occurs when various conservation non-governmentorganizations (NGOs) provide additional funding for specific conservation projects.However, while important, funds from NGOs are <strong>of</strong>ten far outstripped by investmentsfrom state bonds for open space, by federal agencies through agricultural <strong>and</strong> pollutionpreventionprograms, or wildlife research efforts. In addition, private l<strong>and</strong>owners havealso implemented practices to enhance wildlife. These investments have resulted inimproved habitat conditions for wildlife <strong>and</strong> open space that hunters can enjoy. Many <strong>of</strong>these investments would not have been made if the state wildlife agency was unable to<strong>of</strong>fer initial investments from the <strong>Wildlife</strong> <strong>Restoration</strong> Program.The total impact <strong>of</strong> these programs has allowed the hunting <strong>and</strong> shooting sportsindustries to grow far beyond what existed in 1937. The array <strong>of</strong> products manufacturedfor hunters‟ use <strong>and</strong> displayed in various catalogs numbers in the thous<strong>and</strong>s <strong>of</strong> items<strong>and</strong> hundreds <strong>of</strong> pages (<strong>and</strong> can be measured in pounds <strong>of</strong> paper in some catalogs!).While not all <strong>of</strong> these items are subject to excise taxes, they are all dependent onhealthy, sustainable wildlife populations.In addition, the success <strong>of</strong> these wildlife conservation programs also has created a largeconstituency that is politically active in supporting conservation <strong>and</strong> other importantprograms beneficial to hunting <strong>and</strong> shooting sports.Then And Now: What Would Hunting And Conservation Look LikeWithout The <strong>Wildlife</strong> <strong>Restoration</strong> Program?It is important to note that the excise tax on long guns <strong>and</strong> ammunition, h<strong>and</strong>guns <strong>and</strong>ammunition were existing excise taxes that were transferred in the 1930‟s from thegeneral treasury to the <strong>Wildlife</strong> Trust Fund <strong>and</strong> dedicated to wildlife conservation. Some<strong>of</strong> these taxes were in place in the early 1900s, <strong>and</strong> all <strong>of</strong> them have continuouslyexisted since at least 1932, well before the <strong>Wildlife</strong> <strong>Restoration</strong> Program wasestablished.Prior to their inclusion in the trust fund, taxes on sporting arms <strong>and</strong> ammunition wereused to support general government programs. This historical perspective is importantbecause in 1982, <strong>and</strong> again in 1994, some members <strong>of</strong> Congress recommended thatthese excise taxes be redirected to fund a crime victim's assistance program.Conservationists, state wildlife agencies, <strong>and</strong> arms <strong>and</strong> ammunition manufacturersrallied in defense <strong>of</strong> the current trust fund <strong>and</strong> prevailed. In short, unlike many othertaxes, this excise tax provides direct benefit to the industries on which the tax is levied.Its continued existence – as a positive contributor to wildlife conservation <strong>and</strong> thehunting <strong>and</strong> shooting-sports industries – depends on a vigilant defense <strong>and</strong> strongalliance from all <strong>of</strong> its partners.
If the <strong>Wildlife</strong> <strong>Restoration</strong> program were rescinded or reallocated, the direct annual loss<strong>of</strong> $484,765,728 in state conservation grants would have to be made up in license feesto maintain current programs. This would require an across the board increase inhunting license fees <strong>of</strong> more than 36%! Assuming that state agencies could hold <strong>of</strong>fstate-legislated diversions <strong>of</strong> these license dollars, which might be unlikely, this increasein license fees <strong>and</strong> in the overall cost <strong>of</strong> hunting would cause a decline in hunters. Thisdecrease in participation would, in turn, further decrease overall sales by huntingmanufacturers <strong>and</strong> other businesses. Plus, the degradation <strong>of</strong> wildlife conservationfunding would seriously undermine long-term conservation efforts <strong>and</strong> likely destroywhat is widely regarded as the most successful wildlife conservation program in theworld!More <strong>Wildlife</strong> Translates Into More HuntingIn simple terms, abundant wildlife populations equate to more hunting opportunities;more hunting opportunities equate to increased purchases <strong>of</strong> hunting <strong>and</strong> shootingequipment. For example, in 1937, 11 states had no open seasons for deer <strong>and</strong> threeothers had only local seasons. Virtually all <strong>of</strong> the remaining states had far morerestrictive seasons than enjoyed today.When comparing “Then <strong>and</strong> Now,” an obvious question is: "How large would the hunting<strong>and</strong> shooting-sports industries be today if wildlife populations were not restored?"An exact answer to this question is not possible, but clearly, the hunting <strong>and</strong> shootingsportsindustries <strong>of</strong> today exist largely because wildlife populations have been restoredto numbers inconceivable in the early 1900s. These restored wildlife populationsprovide millions <strong>of</strong> Americans opportunities to hunt a wide array <strong>of</strong> species with adiversity <strong>of</strong> equipment that was not even dreamed about when the <strong>Wildlife</strong> <strong>Restoration</strong>Act was passed.Potential Hunting-Opportunity DaysThe purpose <strong>of</strong> the maps to follow <strong>and</strong> the corresponding maps <strong>and</strong> detailed table inAppendices E <strong>and</strong> F respectively is to illustrate the success <strong>of</strong> modern wildlifemanagement that is the result <strong>of</strong> the partnership between the hunting <strong>and</strong> shootingsportsindustries, state <strong>and</strong> federal wildlife <strong>and</strong> l<strong>and</strong> management agencies, <strong>and</strong>conservation minded non-government organizations.The precise number <strong>of</strong> hunting-opportunity days varies annually as a result <strong>of</strong> theseason- setting processes used by each state, as well as calendar-day adjustments.Some seasons may be slightly inflated because Sundays may be included in thecalculations. However, hunting on Sunday is not legal in all states or on all l<strong>and</strong>s withina state. Readers should consult specific hunting regulations for details on huntingopportunities available for specific species. The numbers cited are used to illustrate therelative success <strong>of</strong> our collective conservation efforts.Potential hunting-opportunity days were developed as a result <strong>of</strong> a careful review <strong>of</strong>state- agency websites <strong>and</strong> the Federal Register (for waterfowl seasons). Opportunity21
days were calculated by adding the hunting days available for general firearmsseasons, archery seasons, muzzleloader seasons, youth hunting seasons, spring <strong>and</strong>fall seasons, <strong>and</strong> duck <strong>and</strong> goose seasons. Waterfowl seasons are an aggregate <strong>of</strong>duck, goose <strong>and</strong> brant seasons. However, for waterfowl seasons, a "day" was onlycounted once when multiple species were open at the same time. Essentially, an"opportunity day" was counted when that particular species was open somewhere in thestate.Big-game seasons may include hunts that are limited entry or available by drawing aspecial tag or urban population control hunts. Generally, a threshold <strong>of</strong> 100 participantswas needed before that day <strong>of</strong> a limited entry or special season was included. Specialanimal damage control hunts were generally excluded, as were special draw hunts thatwere extremely limited. The actual hunting opportunity for any individual hunter is likelyto be less than what it is identified because the ability to draw multiple tags or hunt withall equipment types is limited. In addition, some hunts may be available on private l<strong>and</strong>sonly.Figures 6 through 10 reflect the growth in hunting seasons available across the nationbetween 1937 <strong>and</strong> 2010 for deer, elk, turkey, pheasant <strong>and</strong> waterfowl hunters. Thesupporting data is presented in two successive tables in Appendix F. State huntingopportunities are characterized using two different <strong>and</strong> complimentary approaches.First, changes to the number <strong>of</strong> days open to hunting are defined in either four- or fivecolorschematics. Those states that are not assigned a color reflect states where thereare either no hunting seasons indicated or the state is outside <strong>of</strong> the particular speciesrange. Second, states that have transitioned from either a localized season or a closedseason since 1937 or have since closed a season in 2010 are identified by distincthatch markings.
Figure 7. National Growth in Deer Hunting Days (1937-2010)23
Figure 8. National Growth in Elk Hunting Days (1937-2010)Figure 9. National Growth in Turkey Hunting Days (1937-2010)Note: In 1937, turkey hunters in the southeast had liberal fall seasons, but the turkey harvest was relatively low. Under currentmodern management programs, the turkey populations <strong>and</strong> hunter harvests have grown substantially in all states, includingthose in the southeast.
Figure 10. National Growth in Pheasant Hunting Days (1937-2010)Figure 11. National Growth in Waterfowl Hunting Days (1937-2010)25
Here are a few more examples comparing hunting opportunities available in 1937 towhat is available today:In 1937, Missouri's deer season was only three days long, <strong>and</strong> they harvestedonly 108 deer. Today hunters in the Show Me state potentially can hunt deerfor 123 days – more than a 4000% increase! During 2009, Missouri huntersused this time afield to take more than 295,000 deer.Today, Kansas is a destination state for deer hunting, <strong>and</strong> hunters enjoy morethan 140 days <strong>of</strong> deer hunting with a variety <strong>of</strong> equipment. They regularlyharvest more than 100,000 deer each year. In 1937, the deer season wasclosed <strong>and</strong> would remain closed until 1965.In 1937, the deer population in Illinois was estimated to be 3,000 animals, <strong>and</strong>the hunting season was closed. In 2010, hunters in Illinois could potentiallyhunt deer for 108 days. In 2008, hunters harvested more than 188,400 deer.A New Jersey deer hunter in 1937 enjoyed 6 days <strong>of</strong> deer hunting; huntersharvested 2,173 deer. In 2009, there were more than 161 deer hunting daysavailable to Garden State hunters, <strong>and</strong> they harvested 52,784 deer.In 1910, Colorado estimated there were approximately 1,000 elk in the state..In 1937, Colorado held a seven-day elk season. In 2008, elk hunters inColorado could potentially hunt for 128 days. In 2008, 170,500 hunters spentmore than 1.1 million days elk hunting, <strong>and</strong> harvested more than 45,200 elk. In 1937, Wyoming elk hunters had only limited local seasons. Today, 170days <strong>of</strong> elk hunting are available for various specialty hunts. More than53,000 hunters took advantage <strong>of</strong> these seasons, putting in more than412,000 hunter-days devoted to elk hunting <strong>and</strong> harvesting approximately23,000 elk.In 1937, turkey hunting was unheard <strong>of</strong> in Kentucky because the season wasclosed. Today, Kentucky turkey hunters enjoy 159 days <strong>of</strong> turkey huntingannually.North Carolina historically had a long fall turkey season even during timeswhen turkeys were scarce. The fall season was closed in 1971, <strong>and</strong> a springseason was established in 1972. During the spring <strong>of</strong> 1977, 144 wild turkeyswere reported taken. By 2008, the spring harvest exploded <strong>and</strong> 10,404 birdswere taken; an increase <strong>of</strong> 7,200 %.During Ohio's first turkey season in 1966, hunters took 12 birds; in 2009 theytook 20,710.While Arkansas had a 30-day turkey season in the 1930's, hunting successwas pretty dismal – an estimated 300 birds were taken each year. Today,turkey hunters in Arkansas enjoyed a 72-day season <strong>and</strong> harvested morethan 11,700 birds.Wisconsin grouse hunters would have had to travel out-<strong>of</strong>-state in 1937 tohunt ruffed grouse because the season was closed. Today, the Badger state
is a destination for grouse hunters from around the country, <strong>and</strong> they enjoy a136 day season.A pheasant hunter in South Dakota had only restrictive, local seasons inwhich to hunt in 1937. Today, pheasant hunters enjoy an 86-day, state-wideseason.In 2010, 11 states provide more than five times as much waterfowl huntingopportunity (150 or more hunting days); 23 states provide more than fourtimesas much waterfowl hunting opportunity (120 or more hunting days); <strong>and</strong>13 states provide more than three times as much waterfowl huntingopportunity (90 or more hunting days) compared to what was available in1937 (30 days).Archers <strong>and</strong> Muzzleloaders Cash In On the Conservation DividendIn 1937, very few states even permitted archery equipment to be used during biggamehunting seasons. Since then, all states have recognized archery equipment asa valid means <strong>of</strong> hunting <strong>and</strong> most have established special archery-only seasons.The growth <strong>of</strong> archery-only seasons began in the 1960s <strong>and</strong> continues today. Inmany cases, special archery-only seasons are now being used to manage difficultto-controldeer herds in urban <strong>and</strong> suburban areas where firearms are not practical.Some <strong>of</strong> these situations have extended hunting opportunities by months.By the same token, muzzleloader hunters have also benefited from the conservationdividend resulting from improved wildlife-management programs. It is likely thatmuzzle-loading equipment was permitted to be used during the 1937 huntingseasons. However, special seasons specifically set up for primitive weapons are arelatively recent phenomenon.In addition, Appendix D illustrates the national growth <strong>of</strong> archery <strong>and</strong> muzzle-loadingparticipation <strong>and</strong> hunter spending during the last 30 years. Since 1991, the number<strong>of</strong> hunters using bows <strong>and</strong> arrows for hunting has risen from 2.7 million to 3.5 millionhunters in 2006. Retail spending on archery equipment has fluctuated during thistime between $542.2 million (1991) <strong>and</strong> $717.4 million (2006) in current dollars.Today‟s bow-<strong>and</strong>-arrow hunter is estimated to spend $204.91 annually at the retaillevel on tax-related archery equipment.Similarly, the number <strong>of</strong> hunters using muzzleloaders has shown consistent growtheach year since 1991. Today there are roughly 2.5 million hunters usingmuzzleloaders or primitive firearms. This is an increase <strong>of</strong> more than one millionhunters in just the last 15 years. Retail spending on muzzleloaders <strong>and</strong> primitivefirearms has fluctuated but is currently estimated to be $196 million or $78.90 perhunter per year, in current dollars.27
Table 2 reflects current hunting opportunity for archery <strong>and</strong> muzzleloadingequipment in selected states. Most state hunting seasons have experienced similargrowth. Note that none <strong>of</strong> these special seasons existed in 1937.Table 2. Archery <strong>and</strong> Muzzleloading Hunting OpportunitiesStateSpeciesArchery MuzzleloadingHunting Days* Hunting Days*Wyoming Elk 30 NIColorado Elk 30 9Idaho Elk 39 32Oregon Elk 60 79**Washington Elk 52 46Illinois Deer 108 3Iowa Deer 95 40Wisconsin Deer 104 10Kansas Deer 143 14Kentucky Deer 136 11Ohio Deer 135 10New Jersey Deer 161 49Maryl<strong>and</strong> Deer 104 24Connecticut Deer 139 24Michigan Deer 77 17Mississippi Deer 118 53Texas Deer 35 14Washington Deer 62 50California Deer 175 30***Florida Deer 98 56Oregon Deer 60 72*** = Includes early, late <strong>and</strong> special permit seasons; as well as Sundays.** = Permit seasons*** = Additional permit seasons availableNI + No special seasonsindicated
Case StudiesCase studies <strong>of</strong> how local projects funded through the <strong>Wildlife</strong> <strong>Restoration</strong> Programbenefit industry were identified using a two-pronged approach. The first round involvedstate self-nomination <strong>of</strong> projects. The second involved a review <strong>of</strong> U.S. <strong>Fish</strong> <strong>and</strong> <strong>Wildlife</strong>Services‟ IFAIMS database. All projects were explored in depth to determine the level <strong>of</strong>data available to analyze return on investments. Those studies presented here arethose which <strong>of</strong>fered a rich level <strong>of</strong> data <strong>and</strong> should not be seen as an affirmation <strong>of</strong> anyone particular project over another.The following section develops brief narratives fourteen case studies. Every effort ismade to report either an Excise-Tax-Related <strong>ROI</strong> or Total Project <strong>ROI</strong> or both in all casestudies. However, not all case studies will present a <strong>ROI</strong>. Some will provide a synopsis<strong>of</strong> economic or other benefits to industry from specific hunting/shooting opportunities.As seen earlier in this report, the overall Return-On-Investment to industry related to theexcise tax nationwide regularly exceeds 1,000 %. Individual projects funded with theexcise tax can be viewed as individual holdings in an investment portfolio. While someholdings yield a positive return, others yield a negative return. Likewise, with wildlifeenhancementprojects, most pay positive returns (as evidenced by the significant overall<strong>ROI</strong>) but others, when measured as a st<strong>and</strong>-alone entity, are negative. Those withnegative financial returns are not inherently “bad investments.” They may pay hugedividends to the advancement <strong>of</strong> knowledge to wildlife management <strong>and</strong> science thatcan be applied to make other projects a success – dividends that cannot be measuredby traditional financial metrics. Additionally, a state relies on a mix <strong>of</strong> huntingopportunities to attract sportsmen <strong>and</strong> women to hunt in their state. Similar to grocerystores <strong>of</strong>fering loss leaders in order to provide a wide selection <strong>of</strong> products that attractcustomers, a diversity <strong>of</strong> hunting/shooting opportunities in a state--some with positive<strong>ROI</strong>s to industry <strong>and</strong> some with negative--attracts more hunters. This is fine as long asthe cumulative result <strong>of</strong> all projects is positive for industry.It is important to note that many <strong>of</strong> these case studies investigate projects that havespanned many decades <strong>and</strong> total program expenses are not attainable. In these cases,a period <strong>of</strong> “recent history” is highlighted to reflect annual rather than total investments,purchases <strong>and</strong> return on investments.Conservation <strong>and</strong> Management Case StudiesCase #1: North Carolina Wild Turkey Re-introductionData Contributors: North Carolina <strong>Wildlife</strong> Resources Commission, NationalWild Turkey Federation.29
SYNOPSIS (1990-2008)Project TypeConservation/ManagementExcise Tax Investment (b) $1.50 million (1990-2008)Additional Investment (d) Approximately $917,000: $608,000 from NC<strong>Wildlife</strong> Resources Commission <strong>and</strong>$309,000 from the NC State Chapter, NWTF.Hunter Spending on Tax Related $29.6 millionItems (a)Hunter Spending on All Hunting $200.2 millionRecreation Items (c)Excise Tax-Related <strong>ROI</strong> 1,865% (cumulative 1990-2008)Total Project <strong>ROI</strong> 9,883% (cumulative 1990-2008)Project LifespanIndefiniteExcise Tax-Related <strong>ROI</strong>= (a-b)/b <strong>and</strong> Total Project <strong>ROI</strong> =(c-(d+b))/(d+b)Most hunters <strong>and</strong> shooting sports industry staff are aware <strong>of</strong> the tremendous successfor restoring the wild turkey to America's forests. This story has been featured in theNational Shooting Sports Foundation‟s Un-Endangered Species education campaign formore than a decade.However, while many people are aware <strong>of</strong> the final outcome, few are aware <strong>of</strong> what ittook to get there.There was keen interest in restoring wild-turkey populations right from the beginning <strong>of</strong>the modern conservation era in the early part <strong>of</strong> the 20th century. However, it took manyyears <strong>and</strong> many false starts before the success that we now take for granted becamereality.These false starts included releasing <strong>of</strong> pen-reared turkeys, establishing a "refuge"system, <strong>and</strong> using primitive capture techniques. From 1953 through 1969, agencypersonnel in North Carolina relocated an average <strong>of</strong> less than 10 birds per year. In the1970s improved capture techniques using capture drugs, cannon nets, <strong>and</strong> moreefficient rocket nets were used. Successful restoration areas also began providingadditional sites in-state to trap birds. As a result, several hundred birds were relocatedeach year during this time frame. In addition, the National Wild Turkey Federationassisted states with coordinating the interstate shipment <strong>of</strong> wild turkeys.Throughout most <strong>of</strong> the early reintroduction efforts, very liberal fall turkey seasons <strong>and</strong>bag limits were the norm. Despite tremendous opposition all across the state, the fallseason was closed in North Carolina in 1971 <strong>and</strong> a spring gobbler season wasestablished statewide in 1972.The concentrated wild-turkey restoration efforts <strong>of</strong> the 1970s, 1980s <strong>and</strong> 1990s hadbrought wild- turkeys number from an all time low <strong>of</strong> only about 2,000 birds in 1970 toan estimated 130,000 birds in 2000. Not only did turkey populations increase, but theiroccupied range also increased. In 1980, approximately 8,900 square miles <strong>of</strong> habitat
was occupied by turkeys. By 2000, this increased to more than 31,000 square miles.Not only were there more turkeys to hunt, but turkey hunters did not have to travel far t<strong>of</strong>ind them.During the spring <strong>of</strong> 1977, the first year <strong>of</strong> m<strong>and</strong>atory harvest reporting, 144 wild turkeyswere reported taken. Over the next 28 years the growth in the reported harvest mirroredthe growth in wild-turkey population levels in the state. In 1985, the reported harvesttopped the 500 mark (509); in 1988, it topped 1,000 (1,032); in 1999, it topped the 5,000mark (5,340); <strong>and</strong> in the spring <strong>of</strong> 2008, 10,404 birds were reported taken.Surveys indicated that in 1977 approximately 4,800 hunters hunted 33,000 days. Thisincreased to approximately 41,000 turkey hunters <strong>and</strong> more than 211,000 days in 2001,<strong>and</strong> to 72,609 hunters <strong>and</strong> 400,489 days in 2008.Hunting effort over the last 19 years (1990 through 2008) is highlighted for theestimation <strong>of</strong> a return on investment. During this period, current estimates <strong>of</strong> tax-relatedequipment item sales for turkey hunters over the last two decades range between$405,000 <strong>and</strong> $3.8 million per year (Table 3). Annual spending on all items totaledbetween $2.0 million <strong>and</strong> $29.0 million.These total <strong>and</strong> tax-related equipment item purchases are calculated from NationalSurvey state-level reports for North Carolina for 1991, 1996, 2001, <strong>and</strong> 2006. 11 Anassumption is made that turkey hunters are most likely to be reflected by migratory-birdhunters <strong>and</strong> their purchases given the regulatory guidelines for hunting turkey in thestate. Online state-level reports do not provide the same level <strong>of</strong> detailed huntingequipment purchases that is reported at the national level but can be estimatedfollowing another assumption that the purchasing pattern for the average big- gamehunter in North Carolina is similar to other migratory-bird hunters across the nation. 12As a result, equipment related purchases are estimated for North Carolina using thenational percentage <strong>of</strong> total hunter spending which is allocated to tax-related equipmentitems relative to total spending (1991: 26%, 1996: 22%, 2001: 21%, <strong>and</strong> 2006: 17%). Allpurchases from 1991 through 2006 are inflated to 2009 dollars. Average tax relatedequipment item purchases per hunter-day range between $5.18 <strong>and</strong> $10.89 in 2009dollars, after adjusting for a 30% market chain markup. Total spending per hunter perday ranges between $31.53 <strong>and</strong> $72.62. In order to estimate a return on investment,annual per-day purchases <strong>and</strong> hunter days were interpolated using a simple straightlineassumption between two survey years.11 State-level data for 1991 is not available online. As a result, national estimates are utilized for per-day hunterpurchases.12 Wild turkeys are typically considered to be part <strong>of</strong> the big-game category. A recently release addendum to the2006 National Survey, which looks specifically at turkey hunters relative to other quarry categories such as biggame, small game, <strong>and</strong> migratory birds, indicates that turkey-hunter purchases are comparable to migratory-birdhunter spending at the national level. For example, total spending (trip <strong>and</strong> equipment) per hunter day is $61 forturkey hunters <strong>and</strong> $68 for migratory-bird hunters; while big-game hunters spend roughly $71 per day.31
Table 3. North Carolina Wild Turkey <strong>Restoration</strong> Funds Invested, Hunter Purchases<strong>and</strong> Returns on Investments. All figures expressed in 2009 constant dollars.Return onInvestmentsHunter PurchasesInvestmentExciseYearHunterDays a<strong>Wildlife</strong><strong>Restoration</strong>Partial Total(Federal &State) bTax RelatedEquipmentItemsHuntingRecreationTotalTax-Related<strong>ROI</strong>ProjectTotal<strong>ROI</strong> b1990 39,938 $49,243 $65,658 $405,470 $2,022,405 723% 2980%1991 51,644 $47,255 $63,006 $503,145 $2,509,591 965% 3883%1992 63,351 $179,482 $239,309 $633,662 $3,297,116 253% 1278%1993 75,057 $263,903 $351,870 $768,623 $4,147,871 191% 1079%1994 83,675 $43,429 $57,905 $878,623 $4,894,579 1923% 8353%1995 92,292 $63,348 $84,463 $988,680 $5,663,822 1461% 6606%1996 100,910 $61,531 $82,041 $1,099,138 $6,454,665 1686% 7768%1997 120,807 $175,439 $233,919 $1,167,078 $6,883,882 565% 2843%1998 140,703 $0 $0 $1,201,667 $7,126,135 na na1999 160,600 $0 $0 $1,189,208 $7,099,807 na na2000 177,564 $0 $0 $1,108,675 $6,676,413 na na2001 194,528 $131,739 $175,651 $1,006,943 $6,133,946 664% 3392%2002 211,492 $89,440 $119,253 $1,316,856 $8,694,347 1372% 7191%2003 242,992 $0 $0 $1,747,910 $12,158,593 na na2004 274,491 $85,179 $113,572 $2,218,865 $16,010,343 2505% 13997%2005 305,991 $82,387 $109,850 $2,711,147 $20,100,518 3191% 18198%2006 337,490 $79,813 $106,417 $3,237,328 $24,508,995 3956% 22931%2007 368,990 $77,603 $103,470 $3,539,483 $26,796,533 4461% 25798%2008 400,489 $74,733 $99,644 $3,841,638 $29,084,071 5040% 29088%Total(1990-2008) 3,443,003 $1,504,522 $2,006,030 $29,564,140 $200,263,631 1865% 9883%a Grey shading represents years where survey data on hunter days are available. Intervening years are estimated with linearinterpolation.b Total investments include only federal <strong>and</strong> state funds. Additional leveraged funds were provided by NC State Chapter, NWTF.The exact timing <strong>of</strong> these contributions is somewhat uncertain. As a result, the <strong>ROI</strong>-TIE should be considered a maximum possiblereturn.<strong>Wildlife</strong> <strong>Restoration</strong> funds were also inflated to current dollars <strong>and</strong> range between$43,000 <strong>and</strong> $263,000. The resulting Excise Tax-Related <strong>ROI</strong> ranges between 191%<strong>and</strong> 5040% <strong>and</strong> is estimated to be 1865% over the period.(Historic information adapted from: Seamster, Michael H. 2004. Wild TurkeyManagement in North Carolina. North Carolina <strong>Wildlife</strong> Resources Commission.Raleigh, N.C.. Survey Data supplied by Dain Palmer <strong>and</strong> Brad Gunn, North Carolina<strong>Wildlife</strong> Resources Commission. Raleigh, N.C.)
Case #2: Virginia Resident Canada GeeseData Contributors: Virginia Department <strong>of</strong> Game <strong>and</strong> Inl<strong>and</strong> <strong>Fish</strong>eriesSYNOPSIS (2009 $s)Project TypeConservation/managementExcise Tax Investment (b)$16,954 average annual investmentbetween 1993 <strong>and</strong> current (Totalinvestment between 1985 <strong>and</strong> 2009 isestimated to be$877,067)Additional Investment (d)Not yet determinedHunter Spending on Tax Related Items (a) $672,465 (average annual)Annual Hunter Spending on All Hunting N/ARecreation Items (c)Excise Tax-Related <strong>ROI</strong>3877% (average annual)Total Project <strong>ROI</strong>N/AProject LifespanIndefiniteExcise Tax-Related <strong>ROI</strong>=(a-b)/b <strong>and</strong> Total Project=(c-(d+b))/(d+b)While Canada geese all pretty much look alike to us, their populations are composed <strong>of</strong>family groups which make up numerous sub-populations. Some Canada geese migratelong distances <strong>and</strong> some do not migrate at all. Not all sub-populations are doing as wellas desired, especially those that migrate.By employing coordinated research among state <strong>and</strong> federal wildlife agencies,waterfowl biologists have been able to parse out these sub-populations <strong>and</strong> developmanagement plans for each. As a result, hunting season structures have beendeveloped that allow different levels <strong>of</strong> hunting pressure to be applied to various suppopulationsat different times <strong>of</strong> the year. This has meant increased hunting opportunity,increased hunter participation, increased goose harvests, <strong>and</strong> increased equipmentsales.For example, in Virginia, biologists began b<strong>and</strong>ing birds <strong>and</strong> tracking their movementsin 1986. This research was coordinated with similar research in the 17 states that makeup the Atlantic flyway. Some <strong>of</strong> this research is still on-going, but at a much-reducedlevel. Annual research assessments <strong>of</strong> the impact that the hunting seasons may behaving on various sub-populations are required to meet the annual season-settingrequirements established by law.The <strong>Wildlife</strong> Management Institute contributed valuable coordination <strong>and</strong> bankingservices that allowed the research to be conducted flyway-wide, rather than beingrestricted to individual states. In1986, the combined flyway-wide costs, spread amongall states for this coordinated research was $63,000. Virginia contributed $4,500 to this33
effort. States annually contributed $4,500 to this project until 1990 when the per-stateamount was raised to $6,500.In addition to this flyway–wide research, Virginia also invested approximately $34,000per year in <strong>Wildlife</strong> <strong>Restoration</strong> funds to support establishing resident goose seasons fora total <strong>of</strong> 40,000 per year. These funds were invested for six years for a total initialinvestment <strong>of</strong> $240,000.Virginia continues to invest approximately $15,000 <strong>of</strong> <strong>Wildlife</strong> <strong>Restoration</strong> fundsannually in on-going goose research <strong>and</strong> collecting hunter-harvest information. Currentdayvalues <strong>of</strong> these annual investments made by the state, between 1985 <strong>and</strong> 2009,range between $15,000 <strong>and</strong> $79,753. Over the last 25 years, <strong>Wildlife</strong> <strong>Restoration</strong>investments have totaled roughly $800,000. The largest portion ($509,831, 64%) wasinvested prior to opening a goose season in the state.As a result <strong>of</strong> the flyway-wide research, the first 15-day late-season Canada gooseseason was held in Connecticut in 1986, <strong>and</strong> the first ten-day September residentCanada goose season was held in North Carolina. As additional research refinedknowledge <strong>of</strong> sub-populations, additional states exp<strong>and</strong>ed hunting opportunities. Within10 years, eight states added late seasons to their goose-hunting seasons, <strong>and</strong> 14 satesadded early-September seasons.Virginia instituted a September resident goose season in 1993 <strong>and</strong> a late goose seasonin 1996.In addition, the seasons themselves were exp<strong>and</strong>ed. The initial Virginia Septemberseason was only 10 days long. This was exp<strong>and</strong>ed to 15 days in 1994 <strong>and</strong> then to 25days by 1996. A similar expansion occurred to the late-season hunting opportunity. Itwas initially only 15 days long, but was preceded by a break in the hunting season toprotect migratory birds whose populations were not doing as well as desired. Thecurrent early season for resident geese is 25 days <strong>and</strong> the late season is 30 days longin Virginia.. The late season now runs without any breaks after the "regular" gooseseason. Many other states implemented similar season expansions for Canada geese.This research also allowed waterfowl managers to "zone" states into sub-regions thatallow seasons to be tailored to the specific birds that use a particular part <strong>of</strong> the state.For example, Virginia is divided into three zones, each with its own season structure.This optimizes goose-hunting opportunity. Before the biological knowledge wasavailable to zone the state, only one season structure was available for Virginia goosemanagers, <strong>and</strong> this structure was restricted by the need to protect the migratory-goosepopulation from James Bay. As a result, very restrictive "regular" goose seasons werepermitted. In some states the regular goose season was closed altogether for severalyears in order to protect the James Bay sub-population.Not only has season length increased, but so has the daily bag limit. In the early days <strong>of</strong>the experimental resident goose seasons, bag limits were <strong>of</strong>ten only one or two birds
Daysper day. Now these special early or late seasons allow daily bags <strong>of</strong> 5 or more birds. Asresult the harvests <strong>of</strong> resident Canada geese have also increased. In Virginia, huntersparticipating in the first September season in 1993 harvested an estimated 3,677 birds.In 2008, that number increased to 17,500. Today, Virginia allows 10 birds to be takeneach day in the September season <strong>and</strong> five birds per day in the late season.The late-season harvests are a bit more difficult to track because the regular <strong>and</strong> lateseason harvests were combined for the first few years. However, overall goose harvestsduring this time frame rose as well. In 1999, the first year that separate statistics werekept, Virginia hunters took 9,000 geese during the regular season <strong>and</strong> 14,300 in the lateseason. In 2008, goose hunters took 38,000 geese in the regular season <strong>and</strong> 16,800 inthe late season. However, the regular seasons in some <strong>of</strong> the Virginia goose huntingzones were reestablished (they were actually closed during some years), <strong>and</strong> exp<strong>and</strong>edin other zones.From an Atlantic flyway perspective, the creation <strong>of</strong> the early September residentCanada goose season resulted in a harvest <strong>of</strong> approximately 238,000 geese in 2008,<strong>and</strong> additional 19,500 geese were taken in the extended late season.Figure 12. Growth in the number <strong>of</strong> Virginia Goose Hunting Days (1999 to 2008)80,00070,00060,00050,00040,00030,00020,0001999 2000 2001 2002 2003 2004 2005 2006 2007 2008 2009YearThe creation <strong>of</strong> these extended early <strong>and</strong> late seasons not only resulted in increasedharvests, but also increased participation by goose hunters. In 1999, Virginia estimatedthat it had approximately 9,100 active goose hunters who hunted approximately 32,292days (Figure 11). This increased to 15,200 hunters in 2008 <strong>and</strong> 73,383 hunter-days.Almost 50 % <strong>of</strong> the hunter effort now takes place during the early <strong>and</strong> late seasons(Figure 12).35
Figure 13. Estimated Hunter effort in Virginia over three seasons (2008)Estimated hunter effort (Days)Late Season,19,813, 27%Early Season,16,144, 22%Regular Season,37,425, 51%Virginia verified the increased interest in waterfowl hunting during a telephone surveyconducted in 2004. Seventeen percent <strong>of</strong> the respondents indicated that they eitherstarted or returned to waterfowl hunting as a result <strong>of</strong> the increased goose-huntingopportunity. This equated to more than 2,000 new or returning waterfowl hunters. Thirtyfivepercent <strong>of</strong> hunters participating in this survey indicated that they hunted in the earlySeptember season <strong>and</strong> 41 percent indicated that they hunted in the late extendedseason.Most <strong>of</strong> the 17 states that belong to the Atlantic flyway have similarly invested inimproving their underst<strong>and</strong>ing <strong>of</strong> resident Canada goose populations. This informationhas resulted in similar expansions <strong>of</strong> hunting opportunities.As we previously mentioned, Virginia has contributed <strong>Wildlife</strong> <strong>Restoration</strong> funds towardsresearch since 1985 that total roughly $800,000, with approximately $500,000 <strong>of</strong> thatamount spent prior to the extended-season openings. It is challenging to develop along-run return on investment with a great level <strong>of</strong> certainty; instead, the focus in on thelast decade. Since 1999, Virginia has seen strong growth in the number <strong>of</strong> hunter daysspent pursuing resident Canada geese. These hunting efforts have resulted in taxrelatedequipment item purchases ranging between $392,000 <strong>and</strong> $1.0 million (Table4).These tax-related hunter purchases <strong>and</strong> days related to equipment purchases formigratory birds are isolated from National Survey state-level reports for Virginia for 2001
<strong>and</strong> 2006. These online state-level reports do not provide the same level <strong>of</strong> detailedhunting equipment purchases that is reported at the national level, but can be estimatedfollowing the assumption that the purchasing pattern for the average migratory-birdhunter in Virginia is similar to other hunters across the nation. As a result, equipmentrelatedpurchases are estimated for Virginia using the national percentage <strong>of</strong> totalhunter spending that is allocated to tax-related equipment items relative to totalspending (2001: 21% <strong>and</strong> 2006: 17%). Average purchases per hunter day are $14.52for 2001 <strong>and</strong> $8.62 for 2006, in current day (2009) dollars <strong>and</strong> adjusting for a 30%market chain markup. 13Table 4. Virginia’s Resident Canada Goose Hunting: Annual Tax-RelatedInvestments, Purchases <strong>and</strong> Returns (2009 $s)YearAnnual <strong>Wildlife</strong> Annual Tax Related Annual Excise1999 <strong>Restoration</strong> $19,316.06 Funds Equipment Purchases $391,658 Tax-Related 1928% <strong>ROI</strong>2000 Invested $18,687.89 $647,393 3364%2001 $18,170.84 $1,033,435 5587%2002 $17,888.02 $930,516 5102%2003 $17,489.43 $733,804 4096%2004 $17,035.76 $661,717 3784%2005 $16,477.50 $624,306 3689%2006 $15,962.57 $521,440 3167%2007 $15,520.52 $588,391 3691%2008 $14,946.63 $632,228 4130%2009 $15,000.00 $632,228 4115%Average Annual $16,954.11 $672,464.94 3877%An important assumption is that hunter effort is spread equally across all seasons. Thisis not likely the case because the daily bag limit for the regular season is 2 or 3 birdsdepending on the hunting zone; the daily bag limits for the extended season is 10birds/day in September <strong>and</strong> 5 birds/day in the late season. This increased opportunityfor harvest is likely to have increased participation during the extended seasons.Evidence does suggest that industry has recouped their investment in research <strong>and</strong>management <strong>of</strong> resident Canada geese in Virginia <strong>and</strong> continues to earn positivebenefits on annual investments. In fact, in 2009 alone, migratory-bird hunters spent anestimated $623,228 on tax related items based upon hunting days spent in Virginia.This is a marked increase ($240,570) in annual purchases relative to spending bygoose hunters in 1999 ($391,658).When reviewing the return on investments, it is also critical to remember that effortsacross the flyway <strong>and</strong> within Virginia, in particular, extend well before 1999. The periodhighlighted reflects a period that might be described as the later portion <strong>of</strong> recoverywhen returns on investments tend to be larger as direct monetary investments trend13 Intervening years are estimated using simple linear interpolation.37
towards smaller amounts. The success enjoyed today would not have been possiblewithout the significant investments <strong>and</strong> efforts made in the mid-1980s.Access <strong>and</strong> L<strong>and</strong>-Management Case StudiesCase #3: Pennsylvania Game L<strong>and</strong>sData Contributors: Pennsylvania Game CommissionSYNOPSISProject TypeAccessAnnual Excise Tax Investment (b) $9.39 million (average between 2006-2008)Annual Additional Investment (d) None (Maintenance <strong>and</strong> habitat work issupported by excise tax funds. However, asignificant amount <strong>of</strong> leverage funds wereused to purchase the l<strong>and</strong>s currentlymanaged)Annual Hunter Spending on Tax $12,377,709Related Items (a)Annual Hunter Spending on All $84,109,754Hunting Recreation Items (c)Excise Tax-Related <strong>ROI</strong>31.8% (average annual)Total Project <strong>ROI</strong>796% (average annual)Project LifespanIndefiniteExcise Tax-Related <strong>ROI</strong>=(a-b)/b <strong>and</strong> Total Project <strong>ROI</strong>=(c-(d+b))/(d+b)Finding a place to hunt has become increasingly difficult during the last few years. Infact, not having a place to hunt is <strong>of</strong>ten cited as one <strong>of</strong> the most important reasons forpeople who drop out <strong>of</strong> hunting. Finding a place to hunt is generally not difficult inPennsylvania.The Pennsylvania Game Commission (PGC) has invested heavily in both the purchase<strong>and</strong> maintenance <strong>of</strong> public l<strong>and</strong>s for hunting. They own <strong>and</strong> maintain public huntingareas in 65 <strong>of</strong> the states' 67 counties.This investment started in 1920. By 1936, the PGC had purchased approximately500,000 acres; by 1965, it exceeded 1 million acres; <strong>and</strong> today PGC has 304 GameL<strong>and</strong>s comprising more than 1,450,000 acres. In addition, PGC has numerous otherprograms that open private l<strong>and</strong>s to public hunting. While these l<strong>and</strong> holdings aresubstantial, only about 180,000 acres were purchased with <strong>Wildlife</strong> <strong>Restoration</strong> funds.In total, these l<strong>and</strong>s cost $4.6 million, an average <strong>of</strong> $25.55 per acre. Eighty-sevenpercent <strong>of</strong> the l<strong>and</strong> currently managed was purchased with leveraged funds obtained
through hunting license dollars, state bonds or other non-<strong>Wildlife</strong> <strong>Restoration</strong> fundingmechanisms.However, since 2001 the maintenance costs <strong>and</strong> habitat work for all <strong>of</strong> the PGC'sholdings is covered by the <strong>Wildlife</strong> <strong>Restoration</strong> program. This amounts to approximately$9.2 million per year in <strong>Wildlife</strong> <strong>Restoration</strong> funding over the period highlighted in thiscase study (2006-2008). These funds are used for maintaining forest openings;controlling invasive plants; controlled burning; planting shrubs, trees <strong>and</strong> other wildlifefood; providing <strong>and</strong> maintaining access roads <strong>and</strong> parking areas; maintaining <strong>and</strong>posting boundaries; publishing maps <strong>of</strong> the areas; <strong>and</strong> other habitat management <strong>and</strong>public-access activities.Surveys indicate that 40% <strong>of</strong> Pennsylvania's deer hunters hunt primarily on the state'spublic l<strong>and</strong>s, <strong>and</strong> 27 % <strong>of</strong> Pennsylvania's turkey hunters hunt primarily on State GameL<strong>and</strong>s. In 2009, this equated to 689,244 deer hunter days <strong>and</strong> 386,014 turkey hunterdays on Game L<strong>and</strong>s. Similar hunter use has been generated each year. This estimaterepresents a minimum number <strong>of</strong> hunter days because hunters pursuing grouse,squirrel <strong>and</strong> other game also use Game L<strong>and</strong>s extensively.In Pennsylvania, both deer <strong>and</strong> turkey are considered big game. For that reason, huntertax-related equipment <strong>and</strong> total purchases are calculated using state-level estimatesfrom 2006 National Survey data for total purchases by big-game hunters only. Becausestate-level big-game purchases are not itemized by category, a national-leveladjustment factor <strong>of</strong> 19.1% is utilized to isolate tax-related item sales from these totalpurchases. It is assumed that Pennsylvania‟s big-game hunters‟ purchasing patternsare similar to those <strong>of</strong> other big-game hunters across the nation.Per-day tax related purchases are estimated to have a current day value <strong>of</strong> $11.51 afteradjusting for a 30% market-chain mark-up. Annual tax-related item purchases <strong>of</strong> the 1.1million deer <strong>and</strong> turkey hunter days utilizing state game l<strong>and</strong>s are estimated to total$12,377,709. Total purchases are estimated to be $78.22 per day, which translates to$84,109,754 per year.Table 5: Return on Investment Analysis: Pennsylvania Game L<strong>and</strong>sYearTotal WRInvestments(2009 $s)Excise Tax-Related <strong>ROI</strong>TotalProject<strong>ROI</strong>2006 $8,552,380 44.7% 883%2007 $9,548,591 29.6% 781%2008 $10,064,365 23.0% 736%Average $9,388,445 31.8% 796%<strong>Wildlife</strong> <strong>Restoration</strong> investment funds are also inflated to 2009 dollars <strong>and</strong> average $9.4million per year (Table 5). Both total <strong>and</strong> tax related equipment item purchasesexceeded those funds invested in the program. Net return on total purchases rangesbetween $74.0 <strong>and</strong> $75.5 million generating a Total Project <strong>ROI</strong> between 736% <strong>and</strong>39
883%. The net return on tax related items ranges between $2.3 <strong>and</strong> $3.8 million peryear <strong>and</strong> average $3.0 million over the last three years. As a result, industryinvestments in Pennsylvania towards the maintenance <strong>and</strong> management <strong>of</strong> public gamel<strong>and</strong>s supports hunter spending at a level that has earned an Excise Tax-Related <strong>ROI</strong>between 23% <strong>and</strong> 45% over the last three years.Case #4: Utah's Cooperative <strong>Wildlife</strong>-Management Unit ProgramData Contributors: Utah Division <strong>of</strong> <strong>Wildlife</strong> ResourcesProject TypeSYNOPSISConservation/ManagementAnnual Excise Tax Investment (b) $150,000Annual Additional Investment (d) $ 50,000Annual Hunter Spending on Tax $399,152 (Most Recent Participation Scenario)Related Items (a)Annual Hunter Spending on All $2,712,339 (Most Recent Participation Scenario)Hunting Recreation Items (c)Excise Tax-Related <strong>ROI</strong>166% (Annual Return for most recentparticipation Scenario) 318% <strong>and</strong> (Annual Returnfor the highest year participation scenario)Total Project <strong>ROI</strong>1,256% (Annual return for most recentparticipation scenario) <strong>and</strong> 2,032% (Annualreturn for the highest year participation scenario)Project Lifespan:Excise Tax-Related <strong>ROI</strong>=(a-b)/b <strong>and</strong> Total Project <strong>ROI</strong>=(c-(d+b))/(d+b)Developing innovative programs that provide private l<strong>and</strong>owners with incentives tomanage wildlife, while at the same time maintaining the state's public-trustresponsibilities for managing wildlife <strong>and</strong> increasing the public's access to huntingopportunities, is a tall order. However, the Utah Division <strong>of</strong> <strong>Wildlife</strong> Resources (UDWR)accomplished all <strong>of</strong> these objectives when they created their Cooperative <strong>Wildlife</strong>Management Unit (CWMU) program. Versions <strong>of</strong> this program had been around formore than five decades, but managers realized that the old program was in need <strong>of</strong> anew implementation strategy to make it relevant to changing times. A task force wascreated in 1987 to develop recommendations for modernizing the program. Prior to theprogram's full implementation, a three-year pilot study was conducted to work out thebugs. The program was codified into law in 1993. It has been a huge success eversince.
The program creatively used the antlered (bull <strong>and</strong> buck) <strong>and</strong> antlerless tags the UDWRwas issuing as incentives for private l<strong>and</strong>owners to open up their l<strong>and</strong> for public hunting.Prior to the creation <strong>of</strong> the CWMU program, the agency was having difficulty meeting itsbig-game population objectives in many game-management units that werepredominantly private l<strong>and</strong>s.The CWMU program permitted the UDWR to allow qualified l<strong>and</strong>owners to sell biggametag vouchers directly to hunters at whatever price the market would support. Thevouchers were redeemable at the UDWR for big-game tags.In return for this important economic incentive, the private l<strong>and</strong>owners had to agree toallow the public access to their l<strong>and</strong>. In addition, a certain percentage <strong>of</strong> both antlered<strong>and</strong> antlerless tags were reserved for public drawings at their face value. In 2009, 2,700bull <strong>and</strong> buck tags <strong>and</strong> 1,500 antlerless tags were issued through the program.The precise allocation <strong>of</strong> the tags varies with the wildlife-management option thatindividual l<strong>and</strong>holders select. However, approximately 80 % <strong>of</strong> the bull tags are soldthrough the cooperating l<strong>and</strong>owners to resident <strong>and</strong> non-resident hunters, <strong>and</strong>approximately 80% <strong>of</strong> the antlerless tags are available to resident hunters via publicdrawings. The dem<strong>and</strong> for these tags remains high, <strong>and</strong> in many <strong>of</strong> the popular units itmay take several years to draw a tag. The tag vouchers sold by cooperating l<strong>and</strong>ownerscan be purchased annually <strong>and</strong> are available based on market conditions.To qualify to participate in the CWMU program, l<strong>and</strong>owners had to meet minimumacreages <strong>and</strong> have a wildlife-management plan. The minimum l<strong>and</strong> holding needed toparticipate in the deer <strong>and</strong> antelope program is 5,000 acres. This increases to 10,000acres for participation in the elk <strong>and</strong> moose program. In many situations, adjacentl<strong>and</strong>owners pool their l<strong>and</strong>s in order to qualify. In 2009, approximately 2.1 million acres<strong>of</strong> private l<strong>and</strong> was enrolled in the program <strong>and</strong> opened to public hunting.The wildlife-management plans were cooperatively developed between the UDWR <strong>and</strong>the l<strong>and</strong>owners. They included population goals, permit numbers <strong>and</strong> allocations, aswell as habitat-improvement programs. Each plan is updated annually. The program isworking so well that many l<strong>and</strong>owners are now including wildlife in their ranchingoperational plans.UDWR's investment has averaged approximately, $150,000 <strong>of</strong> <strong>Wildlife</strong> <strong>Restoration</strong>funds matched with $50,000 <strong>of</strong> state funding each year since 1993 14 . This investmentconsists largely <strong>of</strong> the staff time biologists devote to developing <strong>and</strong> updating thewildlife-management plans.As a result, in 2009, approximately 11,655 hunter-days were generated by bull <strong>and</strong> bucktag holders <strong>and</strong> 7,500 hunter-days were generated by antlerless tag holders. In yearspast, Utah has issued up to at least 3,500 bull <strong>and</strong> buck tags as well as 3,000 antlerless14 It is important to note that, as part <strong>of</strong> a larger comprehensive management project, Utah’s CWMU programmatictracking <strong>of</strong> investments provides only an estimate <strong>of</strong> funds invested.41
tags. Two scenarios were developed to investigate annual return on investments. Thefirst case reflects current hunter days (11,655 days for bulls <strong>and</strong> buck tag holders <strong>and</strong>7,500 days for antlerless tag holders). The second case reflects the historical maximumhunter days under the program (approximately 15,000 days for bulls <strong>and</strong> buck tagholders <strong>and</strong> 7,500 days for antlerless tag holders). 15Hunter-day tax-related equipment item <strong>and</strong> total purchases are calculated using statelevelestimates from 2006 National Survey data for total purchases by big-game huntersonly. Because state-level big-game purchases are not itemized by category, a nationalleveladjustment factor <strong>of</strong> 19.1% is utilized to isolate tax-related item sales from thesetotal purchases. The assumption is that purchasing patterns <strong>of</strong> Utah‟s big-game hunters‟are similar to those <strong>of</strong> other big-game hunters across the nation. Per-day tax relateditem purchases, adjusted for a 30% market chain mark-up, are estimated at $20.84.Total purchases are estimated to be $141.60 per hunter day.Annual tax related equipment <strong>and</strong> total purchases are estimated to be $399,152 <strong>and</strong>$2.7 million, respectively for the current hunter-day scenario (Table 6). Estimates <strong>of</strong> taxrelatedequipment <strong>and</strong> total purchases for the maximum hunter-day scenario are$627,397 <strong>and</strong> $4.2 million, respectively. <strong>Wildlife</strong> <strong>Restoration</strong> investments allocated tothe program are $150,000 annually. The estimated Excise Tax-Related <strong>ROI</strong>s for the twoscenarios are 166% <strong>and</strong> 318% respectively.Table 6: Annual Return on Investment: Utah CWMUCurrentMaximumAnnual <strong>Wildlife</strong> <strong>Restoration</strong> Investment $150,000 $150,000Annual Additional Leveraged Investments $50,000 $50,000Annual Tax Related Equipment Purchases $399,152 $627,397Annual Hunting Recreation Related Purchases $2,712,339 $4,263,326Excise Tax-Related <strong>ROI</strong> 166% 318%Total Project <strong>ROI</strong> 1,256% 2,032%This creative program improved UDWR's ability to manage wildlife on private l<strong>and</strong>s,improved agency-l<strong>and</strong>owner relationships, provided l<strong>and</strong>owners an incentive to managewildlife on their l<strong>and</strong>s, improved l<strong>and</strong>owner tolerance for wildlife on their property, <strong>and</strong>opened up more than 2 million acres <strong>of</strong> private l<strong>and</strong>s to public hunting. It truly is a winwin-winfor all involved. The key in putting all <strong>of</strong> these pieces together is having atrained biological staff that is sensitive to the needs <strong>of</strong> private l<strong>and</strong>owners, wildlife <strong>and</strong>the hunting public. The <strong>Wildlife</strong> <strong>Restoration</strong> program provides a large part <strong>of</strong> the fundingthat is critical to maintaining this trained biological staff.15 Over the life <strong>of</strong> the program, a maximum <strong>of</strong> 2,700 bulls & bucks <strong>and</strong> 1,500 antlerless tags were issued. Hunterdays are then calculated using the “current” case where hunter days average 4.3 for bulls & bucks <strong>and</strong> 5 days forantlerless.
Case #5: Montana Block-Management ProgramData Contributors: Montana <strong>Fish</strong>, <strong>Wildlife</strong> & Parks DepartmentSYNOPSIS (Average Annual 1998-2009)Project TypeAccessExcise Tax Investment (b) $331,701Additional Investment (d) $5,127,817Hunter Spending on Tax Related $6.5 millionItems (a)Hunter Spending on All Hunting $54.5 millionRecreation Items (c)Excise Tax-Related <strong>ROI</strong> 1,884%Total Project <strong>ROI</strong> 906%Project LifespanIndefiniteExcise Tax-Related <strong>ROI</strong>=(a-b)/b <strong>and</strong> Total Project <strong>ROI</strong>=(c-(d+b))/(d+b)One <strong>of</strong> the most valuable things to a hunter is access to good hunting l<strong>and</strong>s. And whenthat hunting l<strong>and</strong> is in your back yard, it is even better. When you think <strong>of</strong> Montana youmight not think that access to hunting l<strong>and</strong> is an issue. Indeed the state has a significantamount <strong>of</strong> publicly accessible hunting l<strong>and</strong>s held by a variety <strong>of</strong> state <strong>and</strong> federalentities. However, much <strong>of</strong> Montana‟s l<strong>and</strong> is privately held. Concerned, by diminishingpublic access to l<strong>and</strong>s <strong>of</strong>fering hunting opportunities, the state created the HuntingAccess Enhancement Program (HAEP) in the mid-1980s. The goal <strong>of</strong> the program is tomaintain public access to private <strong>and</strong> isolated public l<strong>and</strong>s. Three programs exist underthe umbrella <strong>of</strong> HAEP: 1) Block Management, 2) Access Public L<strong>and</strong> Program, <strong>and</strong> 3)Special Access Projects Program. The Block Management Program is the spotlight <strong>of</strong>this study. Its focus is solely on privately held l<strong>and</strong>, supports l<strong>and</strong>owners throughmanagement <strong>of</strong> public hunting, <strong>and</strong> provides ways to compensate l<strong>and</strong>owners for theimpact <strong>of</strong> hunting. It has proven to be a win-win program for both hunters <strong>and</strong>l<strong>and</strong>owners, <strong>and</strong> as this case study illustrates, it is also a win for the hunting <strong>and</strong>shooting sports industries.As <strong>of</strong> today, more than 1,200 l<strong>and</strong>owners are enrolled in the program, which comprisesjust over 9.0 million acres (Figure 13). The presence <strong>of</strong> Block Management Areas(BMAs) is strongest in the north-central <strong>and</strong> western portions <strong>of</strong> the state where theneed for access is potentially the greatest. From year to year, l<strong>and</strong>owners can chooseto re-enroll or drop out <strong>of</strong> the program. A high level <strong>of</strong> satisfaction with the program haslead many to renew each year. These low levels <strong>of</strong> attrition (4.4% in 2009) providepredictable points <strong>of</strong> access for hunting opportunities, potentially improving orenhancing the hunting experience.<strong>Wildlife</strong> <strong>Restoration</strong> investments support HAEP as a whole, with all three programsreceiving a portion <strong>of</strong> funds. It is difficult to isolate those funds that are specifically43
AcresL<strong>and</strong>ownersapplied to Block Management. However, The Block Management Program receives thebulk <strong>of</strong> invested funds relative to the other two programs, Access Public L<strong>and</strong>s <strong>and</strong>Special Projects, which receive a much smaller portion. Annual investments haveranged between $306,000 <strong>and</strong> $350,000 over the last twelve years. Yet these fundshave only contributed to less than 10% <strong>of</strong> the total program expenses per year.Figure 14. Total L<strong>and</strong>owner <strong>and</strong> Acreage Enrollment in Montana’s Block-Management Program (1996 to 2009)9,000,0008,500,000Total AcresTotal Cooperators1,5001,4001,3001,2001,1008,000,0001,0009007,500,0008007007,000,00019961997199819992000200120022003Year200420052006200720082009500600There is no direct charge to hunt on BMA l<strong>and</strong>s. Rather, these <strong>Wildlife</strong> <strong>Restoration</strong>funds are leveraged with funds from various license sales, including the variable-priced,non-resident hunting licenses allocated to outfitters, non-resident upl<strong>and</strong> game birdlicenses, resident <strong>and</strong> non-resident hunting access enhancement fees <strong>and</strong> "Supertag"license lotteries.Over the last decade, Montana has seen a 56% growth <strong>of</strong> hunter days spent on BMAs.The days ranged from a low <strong>of</strong> 294,784 in 1999 to the current day high <strong>of</strong> 460,757(Figure 14). In 2006, a total <strong>of</strong> 2.14 million days were spent hunting in Montana by bothresidents <strong>and</strong> non-residents. 16 Block Management Program l<strong>and</strong>s supported 20% <strong>of</strong>16 U.S. Department <strong>of</strong> the Interior, <strong>Fish</strong> <strong>and</strong> <strong>Wildlife</strong> Service <strong>and</strong> U.S. Department <strong>of</strong> Commerce, U.S. CensusBureau. 2006 National Survey <strong>of</strong> <strong>Fish</strong>ing, Hunting, <strong>and</strong> <strong>Wildlife</strong>-Associated Recreation.
Daysthose hunting days. In 2009 alone, roughly 85,000 hunters spent an average <strong>of</strong> 10 dayshunting on four or five different BMAs. 17Figure 15. Montana’s Block-Management Program Total Hunter Days500,000450,000400,000350,000300,000250,00019961997199819992000200120022003YearNote: Hunter days reflect only those spend on Block Management Program L<strong>and</strong>s45200420052006200720082009As a whole, BMA l<strong>and</strong>s support big game, upl<strong>and</strong> birds, <strong>and</strong> waterfowl. For that reason,hunter tax-related equipment items <strong>and</strong> total purchases are calculated using state-levelestimates from National Survey data for all game hunters over the period from 1996through 2006. Intervening years were interpolated using the simple linear approach.Because state-level purchases are not itemized by category, a national-level adjustmentfactor (18.6% in 1996, 14.9% in 2001, <strong>and</strong> 16.7% in 2006) is utilized to isolate taxrelated item sales from this total purchase value. It is assumed that Montana hunters‟purchasing patterns are similar to those <strong>of</strong> other hunters across the nation.Per-day tax-related equipment item purchases, adjusted based upon a 30% marketchain mark-up, are estimated to have current day values between $12.19 <strong>and</strong> $20.07.This translates into total annual tax related item purchases ranging from a low <strong>of</strong> $4.2million in 2001 to a high <strong>of</strong> $8.8 million in 2009 (Table 7). It is important to note thathunting days used in the calculation <strong>of</strong> hunter purchases on tax related items reflectonly hunting days tracked on BMAs <strong>and</strong> not on l<strong>and</strong>s involved with either Access PublicL<strong>and</strong>s or the Special Projects Program. Here again, the largest proportion <strong>of</strong> huntingdays are spent in BMAs relative to the other two programs. Thus, it is safe to say thatthe largest proportion <strong>of</strong> tax related item hunter sales is generated by those days spenthunting on Block Management l<strong>and</strong>s.17 Lewis, M.S. <strong>and</strong> A. Charles, “Summary <strong>of</strong> Research: Block Management L<strong>and</strong>owner & Hunter Evaluations fromthe 2009 Montana Hunting Season.” Montana <strong>Fish</strong>, <strong>Wildlife</strong>, <strong>and</strong> Parks. June 2010.
In light <strong>of</strong> the fact that this return should be viewed as a minimum return because it onlyreflects hunting days on BMAs, industry has consistently earned positive returns oninvestments made in Montana‟s HAEP over recent years. Returns on the <strong>Wildlife</strong><strong>Restoration</strong> funds (only) investment in this program reached a low <strong>of</strong> 1,139% during theperiod when investments were relatively high <strong>and</strong> hunter purchases were relatively low(2001-2003) <strong>and</strong> a high <strong>of</strong> 2,670% when the opposite was true (2006-2007).Total daily purchases have current-day (2009) values between $105.99 <strong>and</strong> $149.38.Annual total purchases range between $39.9 million <strong>and</strong> $68.8 million. <strong>Wildlife</strong><strong>Restoration</strong> investments are leveraged with license funds, which have ranged between$3.5 million <strong>and</strong> $6.5 million over the last twelve years. Together these investmentscover programmatic costs <strong>of</strong> $3.9 million <strong>and</strong> $6.8 million. Annual Total Project <strong>ROI</strong> isestimated to range between 787% <strong>and</strong> 1,022%, with an annual average <strong>of</strong> 906%.Table 7. <strong>Wildlife</strong> <strong>Restoration</strong> Funds Invested relative to Tax Related Item SalesGenerated (2009$)Year Investments PurchasesTotal TaxRelated<strong>Wildlife</strong><strong>Restoration</strong>AdditionalFundsEquipmentItemsExciseTax-Related<strong>ROI</strong>TotalHuntingRecreationPurchasesTotalProject<strong>ROI</strong>1998 $322,233 $3,733,904 $5,031,650 1,461% $40,752,067 905%1999 $332,166 $3,534,666 $4,522,008 1,261% $39,923,458 932%2000 $350,383 $3,540,123 $4,489,419 1,181% $43,661,304 1022%2001 $342,946 $3,927,625 $4,247,524 1,139% $46,102,763 980%2002 $348,092 $4,519,392 $5,142,099 1,377% $50,590,516 939%2003 $344,058 $5,870,101 $6,116,406 1,678% $55,125,457 787%2004 $340,119 $5,850,923 $6,734,253 1,880% $56,083,286 806%2005 $334,690 $6,042,606 $7,500,219 2,141% $58,135,687 812%2006 $313,415 $5,793,298 $8,371,385 2,571% $60,763,931 895%2007 $306,364 $5,848,213 $8,486,344 2,670% $66,066,616 973%2008 $326,142 $6,389,949 $8,739,922 2,580% $68,040,736 913%2009 $319,800 $6,483,009 $8,841,315 2,665% $68,830,085 912%AverageAnnual $331,701 $5,127,817 $6,518,545 1,884% $54,506,325 906%
All <strong>of</strong> the program partners are committed to the continued success <strong>of</strong> the program. TheBMA program enjoys strong support among enrolled l<strong>and</strong> owners <strong>and</strong> hunters,strengthening the relationship between the two. Continued growth in amount <strong>of</strong> l<strong>and</strong>available <strong>and</strong> days spent hunting on BMA l<strong>and</strong>s can only strengthen returns to industryin the future.Hunter Education <strong>and</strong> Recruitment Case StudiesCase #6: Hunter Education in Idaho Case StudyData Contributors: Idaho Department <strong>of</strong> <strong>Fish</strong> <strong>and</strong> Game$924,208SYNOPSISProject Type:Hunter EducationAnnual Average Excise Tax Investment (b) $439,949Average Additional Investment (d) $146,733Average Annual Hunter Spending on Tax RelatedItems (a)Average Annual Hunter Spending on All Hunting$8.8 millionRecreation Items (c)Excise Tax-Related <strong>ROI</strong> 110%Total Project <strong>ROI</strong> 1,406%Project LifespanAnnualExcise Tax-Related <strong>ROI</strong>=(a-b)/b <strong>and</strong> Total Project <strong>ROI</strong>=(c-(d+b))/(d+b)Hunter education has improved safety in the field, thereby improving the public's image<strong>of</strong> hunting <strong>and</strong> hunters. The high public support for hunting is partly due to the requiredsafety training that hunters must undergo. When seen from the non-hunting public'sview, taking hunter education is a cost <strong>of</strong> participation that the public strongly supports.In addition, a very strong majority <strong>of</strong> existing hunters support required hunter education.In the case <strong>of</strong> Idaho, without pro<strong>of</strong> <strong>of</strong> a valid hunting license, all hunters born afterJanuary 1, 1975, are required to complete a basic hunter education course prior topurchasing a hunting license. Any hunter interested in participating in an archery-onlyhunting season must also complete a bow hunter education course. After a surge inattendance in 2003-2004 due to the lowering <strong>of</strong> the minimum hunting age from 12 to 10years <strong>of</strong> age, Idaho has graduated, on average, 10,000 hunters from the combinedbasic <strong>and</strong> bow hunter education classes each year since 2005. Similar laws are in placein many other states,Great strides have been taken to improve the course availability <strong>and</strong> make sure thatcourses are effectively <strong>and</strong> efficiently delivered. Instructor-led hunter education coursesare <strong>of</strong>fered statewide with the largest portion <strong>of</strong> classes held in the southwest region <strong>of</strong>47
the state meeting a population-driven need. Over recent years, Idaho has also improvedinstructor recruitment <strong>and</strong> training, use <strong>of</strong> class-room technology for learning, <strong>and</strong>added more h<strong>and</strong>s-on activities, including a live-fire range field-day requirement. Inrecent years, Idaho has also worked to implement online versions <strong>of</strong> both the basic <strong>and</strong>bow hunter education courses. While enrollment in these home-based courses isgrowing, the majority <strong>of</strong> students (90% <strong>of</strong> basic education students <strong>and</strong> 70% <strong>of</strong> bowhunter students) graduate from instructor-led courses. While no formal satisfactionsurveys are available, the popularity <strong>of</strong> classroom-based instruction may be indicative <strong>of</strong>student preference.Between 2003 <strong>and</strong> 2008, <strong>Wildlife</strong> <strong>Restoration</strong> funds have contributed $2.6 million tosupport the hunter education program. This translates to an average investment peryear <strong>of</strong> $438,402 or per student <strong>of</strong> just over $41. It is important to note that all instructortime is volunteered, <strong>and</strong> an estimated 15,800 hours are allocated to student instructioneach year. 18Nationally, research shows that the youngest age cohorts spend less than the averagehunter, regardless <strong>of</strong> quarry, on total purchases including tax related equipment items.Average equipment purchases for hunters age 16-17 are roughly half <strong>of</strong> purchases forhunters aged 45-54, <strong>and</strong> total purchases are roughly one-third <strong>of</strong> the amount spent bythe older cohort. 19 Idaho hunter education graduates are more reflective <strong>of</strong> this youngerage cohort <strong>and</strong> are estimated to spend roughly $122 per year on tax-related huntingequipment <strong>and</strong> $935 in total per year on hunting recreation. This translates into justunder $1 million per year in annual equipment purchases <strong>and</strong> at least $5.8 million intotal spending per year for this group (Table 8). These per-hunter tax related equipmentitem expenses are calculated using national retail purchases for hunting from 2006National Survey data adjusted for a 30% market chain mark-up.Table 8. Minimum Return on Investment: Idaho Hunter EducationAverage Annual:Including2003 & 2004Excluding2003 & 2004<strong>Wildlife</strong> <strong>Restoration</strong> Investments $438,402 $439,949Funds Invested (<strong>Wildlife</strong> <strong>Restoration</strong> <strong>and</strong>State)$584,592 $586,681Tax Related Equipment Item Purchases $967,271 $924,208Trip <strong>and</strong> Equipment Purchases onHunting Recreation$9,310,251 $8,810,586Estimated Excise Tax-Related <strong>ROI</strong> 121% 110%Estimated Total Project <strong>ROI</strong> 1,496% 1,406%Note: <strong>Wildlife</strong> <strong>Restoration</strong> funds are leveraged with state funds at an annual rate <strong>of</strong> $146,733, excluding 2003-04. Thenumber <strong>of</strong> students graduated from the program is 10,593 (including 2003-04) <strong>and</strong> 10,061 (excluding 2003-04). The2003 <strong>and</strong> 2004 numbers represent atypical years due to an influx <strong>of</strong> young hunters as a result <strong>of</strong> a legislative changeto the minimum hunting age.18 At an hourly rate <strong>of</strong> $28.20, this volunteer time provides an in-kind match <strong>of</strong> roughly $445,000. This hourly rate isan agreed upon rate between Idaho Department <strong>of</strong> <strong>Fish</strong> <strong>and</strong> Game <strong>and</strong> U.S. <strong>Fish</strong> & <strong>Wildlife</strong> Service <strong>and</strong> is basedupon the average salary <strong>and</strong> benefits <strong>of</strong> a <strong>Wildlife</strong> Educator who typically performs educational functions verysimilar to the Hunter Education Program volunteer instructors.19 Lifetime Retail Sales Value from Newly Recruited Hunters <strong>and</strong> Target Shooters. Southwick Associates. 2007.
Dollars (2009)Comparing <strong>Wildlife</strong> <strong>Restoration</strong> program investments to hunter tax related equipmentitem purchases, it is evident that invested funds quickly earn positive net benefits.Again, 2003 <strong>and</strong> 2004 represent atypical years due to an influx <strong>of</strong> young hunters as aresult <strong>of</strong> a legislative change to the minimum hunting age. Even excluding these twoyears, Figure 16 shows that purchases are consistently greater than investments. Theestimated Excise Tax-Related <strong>ROI</strong> is 110% <strong>and</strong> Total Project <strong>ROI</strong> is 1,406%.For a couple <strong>of</strong> reasons, this return should be considered cautiously. First, the <strong>ROI</strong>estimation focuses only on hunter graduate purchases on tax related items. Thepurchases are, in reality, generated from hunting activity <strong>and</strong> not from the educationalexperience. However, without the successfully completing the hunter educationprogram, the other purchases cannot happen. It is arguable that only a portion <strong>of</strong> thebenefit at this point is attributable to the investment allocated to hunter education, <strong>and</strong> alarger portion <strong>of</strong> the return should be allocated to <strong>Wildlife</strong> <strong>Restoration</strong> funds invested inmanagement <strong>of</strong> the wildlife resource.The Idaho <strong>Fish</strong> <strong>and</strong> Game Department also <strong>of</strong>fers a number <strong>of</strong> specialized instructionalopportunities that provide additional "next step" <strong>and</strong> "how-to" activities. These includeArchery for Women, Elk Hunting for Beginners, <strong>and</strong> advanced youth hunting clinics. Allincrease the skills <strong>and</strong> knowledge <strong>of</strong> attendees so that they can take advantage <strong>of</strong> thebreadth <strong>of</strong> opportunities available. This potentially results in diversification <strong>of</strong> equipmentpurchasingpatterns. At present, this is impossible to quantify.Figure 16. Trends in Annual <strong>Wildlife</strong> <strong>Restoration</strong> Funds <strong>and</strong> Purchases <strong>of</strong> TaxRelated Equipment Items for Hunter Education Graduates in Idaho$1,200,000$1,000,000$800,000$600,000$400,000$200,000<strong>Wildlife</strong> <strong>Restoration</strong> Funds InvestedTax Related Item Expenditures by Course Graduates$02003 2004 2005 2006 2007 2008Year49
More importantly, hunter-education graduates tend to be younger <strong>and</strong> just starting outtheir hunting careers. The average age for a basic education graduate is between 11<strong>and</strong> 14 years <strong>and</strong> 21 to 30 years for bow hunter graduates. Given the ideal, this groupwould hunt for many years to come. However, Idaho is experiencing a period <strong>of</strong> lowhunter graduate loyalty with their estimates indicating that approximately 55% <strong>of</strong>graduates purchased a license the year following graduation, with even fewerpurchasing two years after graduation. In all likelihood, this reflects their young age <strong>and</strong>changing interests. The above return estimate does not account for purchases beyondone year. State-level survey estimates indicate that just under half <strong>of</strong> graduates, roughly4,500 young hunters, purchase a license <strong>and</strong> hunt the second year following graduationresulting in just over $750,000 in tax related item sales.Some additional societal benefits <strong>of</strong> hunter education classes include enhancing thesocial support network <strong>of</strong> hunters, <strong>of</strong>fering a place where new members <strong>of</strong> the huntingcommunity can participate in an event with other members <strong>of</strong> the hunting community,<strong>and</strong> reaffirming hunting as an accepted activity among both hunting <strong>and</strong> non-huntingcommunities. These benefits are likely to become more important in the future as otherhunting community events <strong>and</strong> activities such as game check stations (in many places,game can now be remotely checked via phone or internet); license vendors at localsports shops, hardware stores, etc.; <strong>and</strong> local "big buck" (turkey/elk) contestssponsored by local businesses disappear.Case #7: Nebraska National Archery in the School ProgramData Contributors: Nebraska Game <strong>and</strong> Parks CommissionProject TypeAnnual Excise Tax Investment (b)Annual Additional Investment (d)Annual Hunter Spending on TaxRelated Items (a)Annual Hunter Spending on AllHunting Recreation Items (c)Excise Tax-Related <strong>ROI</strong>Total Project <strong>ROI</strong>Project LifespanSYNOPSISHunter Education$35,000 annuallyThe program has many partners, local <strong>and</strong>national, which leverage the <strong>Wildlife</strong> Fundsthrough monetary <strong>and</strong> non-monetary support.nanaNon-traditional (10% return if roughly 1% <strong>of</strong>class takes up hunting or target shooting)naAnnualFrom its small roots in Kentucky, the National Archery in the School Program has grownto a point where it is now introducing target archery in physical-education classes for
elementary <strong>and</strong> secondary students in 5,000 schools in five countries. Core courseinstruction includes archer technique <strong>and</strong> safety. In addition to many <strong>of</strong> the state‟scommunity recreation centers, nearly 140 <strong>of</strong> Nebraska‟s schools <strong>of</strong>fer the program ingrades 4-12 <strong>and</strong> reach at least 20,000 students. The annual <strong>Wildlife</strong> <strong>Restoration</strong>investment totals $35,000, <strong>and</strong> covers the costs <strong>of</strong> a coordinator <strong>and</strong> program supplies.The potential for a return on investment was investigated from the st<strong>and</strong>point that theprogram has multiple benefits, including being a gateway between archery <strong>and</strong> otherhunting <strong>and</strong> target shooting recreational activities. It is difficult to know with any level <strong>of</strong>certainty just how many program graduates actually take up hunting or target shootingas a result <strong>of</strong> exposure to the course. This makes estimating a typical return oninvestment a bit challenging. It is possible, however, to estimate the number <strong>of</strong>graduates who would need to take up either hunting or target shooting in order generatea certain level <strong>of</strong> return on investment.In order to do this, we estimated the tax-related equipment item purchases <strong>of</strong> graduatesas if they were hunters or target shooters <strong>and</strong> then how many would actually need to beconverted to active hunters or shooters in order to cover program costs. Per-hunter ortarget shooter tax related equipment item expenses are calculated using national retailpurchases for hunting from 2006 National Survey data adjusted for a 30% market chainmark-up.A recent study that looks at the lifetime retail sales <strong>of</strong> recruited hunters <strong>and</strong> targetshooters annually across seven age cohorts from 16 years <strong>of</strong> age to 65 years <strong>and</strong>older 20 was used to guide these calculations. The age cohort that most closely reflectsprogram graduates are hunter or target shooters who are aged 16 to 17. Using nationalestimates, hunters in this age group are expected to spend $122 annually on tax relatedhunting equipment items. Target shooters typically spend slightly more (54%) onequipment because they <strong>of</strong>ten hunt as well. As a result, shooters in this age group areestimated to spend $188 annually.In the case <strong>of</strong> Nebraska, it would only take between 1.0% <strong>and</strong> 1.6% <strong>of</strong> students (205 to317) to take up either recreational hunting or shooting for one year as a result <strong>of</strong> takingthe program to earn a return <strong>of</strong> 10%. These estimates are certainly achievable giventhat, on average, 48% <strong>of</strong> students completing the course indicate that they willparticipate in archery in the future. Another 32% <strong>of</strong> students indicate that they havemore interest in other shooting sports since having completed a school-based archeryclass. 21 Successfully recruited young hunters or shooters continue to provide benefitsto industry. Over a lifetime, it is estimated that an individual has the potential to spendbetween $17,000 <strong>and</strong> $23,000 on primary hunting equipment, including both tax related<strong>and</strong> tax exempt items. 22 These younger hunters are also likely to recruit family20 Lifetime Retail Sales Value from Newly Recruited Hunters <strong>and</strong> Target Shooters. Southwick Associates. 2007.21 An Assessment <strong>and</strong> Evaluation <strong>of</strong> the National Archery in the Schools Program-Phase II: Student Survey Results,Responsive Management, 2009.22 ibid51
members into hunting or shooting sports. In fact, 11% <strong>of</strong> students indicate that theirexperiences with archery at school have had an indirect, <strong>and</strong> positive, impact on theirfamily‟s interest in archery. As a result, returns on investment estimated based uponstudent recruitment should be viewed as a minimum return.Shooting-Range Development Case StudiesCase #8: Brown County Sportsman Club Shooting Range, South DakotaData Contributors: South Dakota Game, <strong>Fish</strong> <strong>and</strong> Parks DepartmentSYNOPSISProject TypeShooting Range Construction/DevelopmentExcise Tax Investment (b) $215,445 (Phase 1) <strong>and</strong> $48,500 (Phase 2)Additional Investment (d) $71,815 (Phase 1) <strong>and</strong> $16,167 (Phase 2)Hunter Spending on Tax Related $370,678 (Phase 1) <strong>and</strong> $67,019 (Phase 2)Items (a)Hunter Spending on All Hunting $2.36 million (Phase 1) <strong>and</strong> $427,050 (Phase 2)Recreation Items (c)Excise Tax-Related <strong>ROI</strong> 72% (Phase 1) <strong>and</strong> 38% (Phase 2)Total Project <strong>ROI</strong> 722% (Phase 1) <strong>and</strong> 560% (Phase 2)Project LifespanLifespan after Phase 2 could be up to 25 yearsExcise Tax-Related <strong>ROI</strong>=(a-b)/b <strong>and</strong> Total Project <strong>ROI</strong>=(c-(d+b))/(d+b)The Brown County Sportsman Club Shooting Range is located in Aberdeen, SouthDakota. Historically, the site was utilized for agricultural purposes. After developing theshooting range, it now functions as a public shooting range, sportsman club, <strong>and</strong> youthevent center hosting hunter education classes <strong>and</strong> other programs. The range isoperated by a volunteer staff on a part-time basis. It is open to the public seven months<strong>of</strong> the year, mid-April through mid-November, for a minimum <strong>of</strong> two days <strong>of</strong> shooting perweek.The range is host to an average <strong>of</strong> 400 to 500 target shooters per year who average atotal <strong>of</strong> 2,500 to 3,000 shooter days. Special events open the range to roughly 200 kidsfor National Rifle <strong>Association</strong> Youthfest as well as 200 hunter education students.Return on Investment estimates looked at two periods over the life <strong>of</strong> the range (Tables9 <strong>and</strong> 10). The first highlights the shooting range development <strong>and</strong> construction phase<strong>and</strong> the range‟s initial utilization, covering a lifespan <strong>of</strong> just over 10 years (1996 to2008). Range development included initial design, survey, major construction, bermwork, <strong>and</strong> baffle construction. <strong>Wildlife</strong> <strong>Restoration</strong> funds invested in development <strong>of</strong> therange totaled $215,000. Total investments accrued to $287,261 after including the statematch. The second period highlights 2009 when <strong>Wildlife</strong> <strong>Restoration</strong> funds were utilized
for maintenance <strong>and</strong> rehabilitation <strong>of</strong> the baffle system. This investment totaledapproximately $64,000 between federal <strong>and</strong> state monies.Target-shooter purchases are based on state-level National Survey data for 2006. 23 A2007 report studying the lifetime purchases <strong>of</strong> hunters <strong>and</strong> target shooters found thatshooters spend more (54.4%) on equipment than hunters. 24 Assuming that thisproportion would not change dramatically since 2007 <strong>and</strong> adjusting the national surveyretail sales information results in an estimate <strong>of</strong> $13.48 in sales per day <strong>of</strong> tax relatedequipment, net <strong>of</strong> a 30% market chain mark-up, <strong>and</strong> $85.89 in total purchases made bySouth Dakota target shooters. Annual visitation is assumed to average 2,750 resultingin annual tax related retail sales <strong>of</strong> $37,068. Total annual purchases are estimated to be$236,198. Spending estimates driven by visitation to the range are conservativeestimates as they do not include spending by NRA Youthfest attendees <strong>and</strong> huntereducation students.Table 9. Brown County Shooting Range: Phase IPeriod One: Initial Construction <strong>and</strong> Opening<strong>Wildlife</strong><strong>Restoration</strong>(2009$)Total(<strong>Wildlife</strong> <strong>Restoration</strong><strong>and</strong> State Funds)(2009$)Total Funds Invested $ 215,445 $287,261Annual Target Shooter Tax Related ItemSales $37,068 $236,198Lifespan10 yearsTotal Tax Related Purchases (1999-2008) $370,678 $2,361,977Net Benefit $155,233 $2,074,716<strong>ROI</strong> 72% 722%The range opened to the public after construction was complete in 1999 <strong>and</strong> continuedto operate for roughly ten years before any major maintenance or improvements werenecessary. Over this period, target shooter retail sales on tax related items totaled$371,000. Net benefits earned from the initial investment are in excess <strong>of</strong> $155,000 <strong>and</strong>earned a positive Excise Tax-Related <strong>ROI</strong> <strong>of</strong> 72%. Similarly, total spending on huntingrecreation grew to $2.36 million. Net benefits are in excess <strong>of</strong> $2.07 million earning aTotal Project <strong>ROI</strong> <strong>of</strong> 722%.23 U.S. Department <strong>of</strong> the Interior, <strong>Fish</strong> <strong>and</strong> <strong>Wildlife</strong> Service <strong>and</strong> U.S. Department <strong>of</strong> Commerce, U.S. CensusBureau. 2006 National Survey <strong>of</strong> <strong>Fish</strong>ing, Hunting, <strong>and</strong> <strong>Wildlife</strong>-Associated Recreation.24 Lifetime Retail Sales Value from Newly Recruited Hunters <strong>and</strong> Target Shooters. Southwick Associates. 2007.53
Table 10. Brown County Shooting Range: Phase IIPeriod Two: Second Investment for RehabilitationTotal(<strong>Wildlife</strong> <strong>Restoration</strong><strong>and</strong> State Funds)<strong>Wildlife</strong><strong>Restoration</strong>Total <strong>Wildlife</strong> <strong>Restoration</strong> Funds Invested $48,500 $64,667Annual Target Shooter Tax Related Item RetailSales $37,068 $236,198Discount Rate 7%Time Horizon (years)2 aPresent Value <strong>of</strong> Annual Tax Related Purchases $67,019 $427,050Net benefit $18,519 $362,383<strong>ROI</strong> 38% 560%a Assumes that the next lifespan is short, relative to phase one, <strong>and</strong> that maintenance or improvements occur in2011.Phase II: 2009The range baffle systems were rehabilitated in 2009. <strong>Wildlife</strong> <strong>Restoration</strong> fundingapplied toward that project totaled $48,500. Given that annual target shooter retail saleson tax related items are slightly more than $37,000, industry begins to see positive netbenefits <strong>and</strong> return on investment just shortly after one year. It is difficult to know exactlywhen the next major maintenance effort will be necessary, but these returns have thepotential for growth even over just a few short years. Applying a discount rate <strong>of</strong> 7% todetermine the present value <strong>of</strong> annual target shooter purchases on tax related itemsover just two years estimates the return to the excise tax investment at 38%. Using thesame approach estimates a Total Project <strong>ROI</strong> <strong>of</strong> 560%.
Case #9: Georgia Shooting Range: Chickasawatchee WMAData Contributors: Georgia Department <strong>of</strong> Natural Resources$4,057,372SYNOPSISProject TypeShooting RangeConstruction/DevelopmentExcise Tax Investment (b) $364,357Additional Investment (d) $125,139Hunter Spending on Tax Related Items (a) $791,502Hunter Spending on All HuntingRecreation Items (c)Excise Tax-Related <strong>ROI</strong> 117%Total Project <strong>ROI</strong> 729%Project Lifespan25 yearsExcise Tax-Related <strong>ROI</strong>=(a-b)/b <strong>and</strong> Total Project <strong>ROI</strong>=(c-(d+b))/(d+b)The Georgia Department <strong>of</strong> Natural Resources shooting ranges have a strong presenceacross the state, <strong>and</strong> federal excise tax dollars have a similarly strong presence in theiroperation, maintenance, <strong>and</strong> construction. The state is guided by two core approacheswhen allocating funds: 1) a previously completed needs-assessment survey <strong>of</strong> existingranges, <strong>and</strong> 2) a goal to provide a shooting range within 30 miles <strong>of</strong> every Georgiaresident.One newly constructed range has been selected as the focus <strong>of</strong> this case study. Therange is located in the Chickasawatchee <strong>Wildlife</strong> Management area in the southwestregion <strong>of</strong> the state <strong>and</strong> opened to the public in late 2008. The range operates yearround six days a week. The range supported more than 2,000 user days in the first eightmonths <strong>of</strong> operations alone. Construction <strong>of</strong> the range, from design <strong>and</strong> plan tocompletion, took place between 2007 <strong>and</strong> 2009. <strong>Wildlife</strong> <strong>Restoration</strong> funds invested inconstruction total $111,632. An additional $37,211 in leveraged state funds contributedto construction.<strong>Restoration</strong> funds are also currently used for annual operation <strong>and</strong> maintenance. In2009, operation <strong>and</strong> maintenance costs totaled $42,000. For 2010, these sameexpenses are on track to total approximately $27,000. <strong>Wildlife</strong> <strong>Restoration</strong> funds areallocated to cover roughly $20,000 <strong>of</strong> that expense. These costs are largely devoted tomaintaining a team <strong>of</strong> safety <strong>of</strong>ficers at the range. Their duties include h<strong>and</strong>s-onmaintenance, educational outreach to new target shooters, as well as enforcement <strong>of</strong>range-safety rules. Georgia has had great success with the implementation <strong>of</strong> rangesafety <strong>of</strong>ficers across the state. As a whole, they have found a reduction in complaints<strong>and</strong> an improved shooting experience that is translating into increased participation.55
The range has seen over 2,200 user days during the first eight months <strong>of</strong> operationresulting in an estimated $39,500 <strong>of</strong> retail purchases through June <strong>of</strong> 2009. Targetshooterpurchases are based on state-level National Survey data for 2006. A 2007report studying the lifetime purchases <strong>of</strong> hunters <strong>and</strong> target shooters found thatshooters spend more (54.4%) on equipment than hunters. 25 Shooters also typicallyspend less on travel relative to those who only hunt. As a result, the trip-relatedpurchases <strong>of</strong> total hunting recreation spending were reduced by 56.5%. Assuming thatthis proportion would not change dramatically from 2007 <strong>and</strong> adjusting the NationalSurvey retail sales information provides an estimate <strong>of</strong> $13.76 in sales per day <strong>of</strong> taxrelated equipment, net <strong>of</strong> a 30% market chain mark-up, <strong>and</strong> $70.54 in total huntingrelated recreational spending made by Georgia target shooters.Because this is a new shooting range it is important to remember that the bulk <strong>of</strong> thereturn to industry has not yet occurred. To estimate future benefits to industry a presentvalue calculation was applied. Future annual visitation is assumed to average 5,000user days resulting in annual tax related retail sales <strong>of</strong> $68,809 <strong>and</strong> total sales <strong>of</strong>$352,728 (Table 11).Table 11. Georgia Shooting Range ProjectTotal<strong>Wildlife</strong> <strong>Restoration</strong> (WR+Leveraged)Construction <strong>and</strong> Operation/Maintenance Investments (Past &Future) $364,357 $489,497Future Annual Purchases. $68,809 a $352,728Present Value <strong>of</strong> Future Purchases $791,502 $4,057,372Net benefit $427,145 $3,567,876117% (Excise Tax- 729% (Total<strong>ROI</strong>Related)Project)a An annual visitation level <strong>of</strong> 5,000 user days is assumed based upon un<strong>of</strong>ficial visitation for FY 2010.b Present value calculations assume a 25 year lifespan <strong>and</strong> a 7% discount rate.A lifespan <strong>of</strong> 25 years is assumed for the range before any major rehabilitation needs tooccur <strong>and</strong> a discount rate <strong>of</strong> 7% is applied. The present value <strong>of</strong> tax related sales isestimated at $791,502. Assuming that <strong>Wildlife</strong> <strong>Restoration</strong> funds will support futureoperation <strong>and</strong> maintenance costs <strong>and</strong> applying the same present value application to anannual cost <strong>of</strong> $20,000, past <strong>and</strong> future investments total $364,357 in current-daydollars. Net benefit to industry is estimated to be $427,145 ,which earns an Excise Tax-Related <strong>ROI</strong> <strong>of</strong> 117%. These benefits are anticipated to grow over the next few years asthis new range is discovered <strong>and</strong> used by more people. It is anticipated that rangeutilization could reach 6,000 user days in just the next few years. If this is the case, thereturn to industry from tax related items could reach as high as 159%.Assuming continued support <strong>of</strong> operation <strong>and</strong> maintenance at an average cost <strong>of</strong>$27,000, total investments (past <strong>and</strong> future) are estimated to have a current day value25 Lifetime Retail Sales Value from Newly Recruited Hunters <strong>and</strong> Target Shooters. Southwick Associates. 2007.
<strong>of</strong> $489,497. Net benefit to industry on all investments from spending on target-shootingrecreation is estimated to be $3.6 million, generating a Total Project <strong>ROI</strong> <strong>of</strong> 729%(assuming 5,000 user days). The return to industry jumps to 905% with an additional1,000 annual user days.Case #10: Ben Avery Shooting Facility, ArizonaData Contributors: Arizona Game <strong>and</strong> <strong>Fish</strong> DepartmentSYNOPSIS (2003-2009)Project TypeShooting Range Construction/DevelopmentExcise Tax Investment (b) $4,431,105Additional Investment (d) $3,64,760Hunter Spending on Tax Related $24,923,801Items (a)Hunter Spending on All Hunting $91,549,043Recreation Items (c)Excise Tax-Related <strong>ROI</strong> 462%Total Project <strong>ROI</strong> 1,032%Project LifespanExcise Tax-Related <strong>ROI</strong>=(a-b)/b <strong>and</strong> Total Project <strong>ROI</strong>=(c-(d+b))/(d+b)Located just north <strong>of</strong> Phoenix, Arizona, the Ben Avery Shooting Facility is nationallyrecognized by the National <strong>Association</strong> <strong>of</strong> Shooting Ranges <strong>and</strong> plays host to a number<strong>of</strong> major events every year. The complex <strong>of</strong> shooting ranges provides shootingopportunities <strong>and</strong> safety education for both new <strong>and</strong> experienced marksmen. <strong>Wildlife</strong><strong>Restoration</strong> funds for this particular case focus only on investments made, <strong>and</strong> shooterdays spent, at the main range complex during the period between 2003 <strong>and</strong> 2009, <strong>and</strong>exclude the archery <strong>and</strong> clay-target ranges.This facility is not typical <strong>of</strong> the majority <strong>of</strong> shooting ranges frequented by targetshooters across the country. In fact, the range is only a part <strong>of</strong> the 1,650-acre BenAvery Facility, which <strong>of</strong>fers recreational shooting <strong>of</strong> multiple types as well ascampground facilities, <strong>and</strong> houses the agencies' headquarters <strong>of</strong>fices. Utilization <strong>of</strong> themain range has shown slight growth over the last few years (15% between 2006 <strong>and</strong>2009) <strong>and</strong> averages just over 104,000 target shooter days annually (Figure 16).57
Number <strong>of</strong> Target Shooter DaysFigure 17. Ben Avery Main Range Annual Target Shooter Utilization (2003-2009)Annual Target Shooter Utilization140,000120,000100,00080,00060,00040,00020,00002003 2004 2005 2006 2007 2008 2009YearTarget-shooter purchases are based on state-level National Survey data for 2006inflated to 2009 dollars. A 2007 report studying the lifetime purchases <strong>of</strong> hunters <strong>and</strong>target shooters found that shooters spend more (54.4%) on equipment than hunters. 26Shooters also typically spend less on travel, relative to those who only hunt, by 56%. Asa result, tax-related equipment purchases were increased by 54.4% <strong>and</strong> the trip-relatedpurchases <strong>of</strong> total hunting recreation spending was reduced by 56.5%. Assuming thatthis proportion would not change dramatically from 2007 <strong>and</strong> adjusting the NationalSurvey retail sales information provides an estimate <strong>of</strong> $34.23 in sales per day <strong>of</strong> taxrelated equipment, net <strong>of</strong> a 30% wholesale mark-up, <strong>and</strong> $125.71 per day in total salesmade by Arizona target shooters. These values do not include purchases unique tohunting such as hunting dogs, boats, <strong>and</strong> taxidermy.Table 12. <strong>Wildlife</strong> <strong>Restoration</strong> Investments <strong>and</strong> Target-Shooter Purchases:Ben Avery Shooting Facility (2003-2009) All estimates in 2009 dollars.Year Investments PurchasesTax-RelatedEquipmentItems TotalExciseTax-Related<strong>ROI</strong>Total HuntingRecreationPurchasesTotalProject<strong>ROI</strong><strong>Wildlife</strong><strong>Restoration</strong>AdditionalFunds2003 $613,717 $488,238.02 $3,493,271 469% $12,831,333 1064%2004 $582,134 $475,771.37 $3,438,921 491% $12,631,698 1094%2005 $582,586 $385,862.28 $2,809,587 382% $10,320,054 966%2006 $576,905 $469,246.79 $3,463,598 500% $12,722,339 1116%2007 $710,162 $516,718.25 $3,832,683 440% $14,078,047 1047%2008 $716,309 $562,221.59 $3,899,901 444% $14,324,951 1020%2009 $649,292 $756,702.00 $3,985,841 514% $14,640,621 941%Average $633,015 $522,108.61 $3,560,543 462% $13,078,435 1032%26 Lifetime Retail Sales Value from Newly Recruited Hunters <strong>and</strong> Target Shooters. Southwick Associates. 2007.
In constant (2009) dollars, annual target-shooter purchases on tax related items rangebetween $2.8 <strong>and</strong> $3.9 million dollars, with an average <strong>of</strong> $3.5 million per year (Table12). Similarly, total purchases ranged between $10.3 million <strong>and</strong> $14.6 million,averaging $13.1 million per year. The increased utilization <strong>of</strong> the shooting facility overthe last five years has equated to rising purchases over the same time frame.<strong>Wildlife</strong> <strong>Restoration</strong> investment funds have fluctuated between $582,000 <strong>and</strong> $716,000<strong>and</strong> average $633,000 per year. <strong>Wildlife</strong> <strong>Restoration</strong> funds are a significant portion(55%) <strong>of</strong> funding for the shooting range but they are leveraged by additional donations<strong>and</strong> Arizona <strong>Fish</strong> & Game Department funds as well as revenues generated on-site.Additional investments, provided by revenue from the main range, are slightly less <strong>and</strong>have annually generated between $386,000 <strong>and</strong> $757,000. The estimated Excise Tax-Related <strong>ROI</strong> has been calculated to be between 382% <strong>and</strong> 514% <strong>and</strong> Total Project <strong>ROI</strong>has s been calculated to be between 966% <strong>and</strong> 1,094%.Other Value-Added Case StudiesCase #11: Southeastern Cooperative <strong>Wildlife</strong> Disease StudyData Contributors: Southeastern Cooperative <strong>Wildlife</strong> Disease Study (SCWDS)at the University <strong>of</strong> Georgia's College <strong>of</strong> Veterinary Medicine.Project TypeTotal Excise TaxInvestmentTotal AdditionalInvestmentHunter SpendingExcise Tax-Related <strong>and</strong>Total Project <strong>ROI</strong>Project LifespanAverage Annual Return:SYNOPSISConservation/ManagementUncertain (A portion <strong>of</strong> each state’s $15,000 annualinvestment)Uncertain (Funds are leveraged by at least 20:1)Not applicableAtypical (<strong>Wildlife</strong> population health)IndefiniteNot applicableWhat is the value <strong>of</strong> scientific credibility? What is the benefit <strong>of</strong> underst<strong>and</strong>ing the cause<strong>of</strong> death <strong>of</strong> individual wild animals? What is the value <strong>of</strong> underst<strong>and</strong>ing the diseasetransmission mechanisms <strong>and</strong> interactions among <strong>and</strong> between wildlife populations?What is the value <strong>of</strong> underst<strong>and</strong>ing the potential transmissions <strong>and</strong> interactions betweenwildlife diseases, domestic animals <strong>and</strong> humans? Putting a monetary value on theanswers to these questions is difficult, but most people would conclude that finding theanswers to these questions is critically important.59
These are the basic questions that the Southeastern Cooperative <strong>Wildlife</strong> DiseaseStudy (SCWDS) grapples with every day. SCWDS is a specialized unit <strong>of</strong> the University<strong>of</strong> Georgia's College <strong>of</strong> Veterinary Medicine. SCWDS was initially started in 1957 when11 Southeastern state wildlife agencies pooled their money to study a mysterious deerdisease that almost derailed their initial deer restocking efforts.Some <strong>of</strong> the initial outbreaks <strong>of</strong> what is now known as hemorrhagic disease killed morethan 90% <strong>of</strong> the local deer population <strong>and</strong> caused some to question the feasibility <strong>of</strong>restoring deer in the Southeast.The answers to the cause <strong>and</strong> management implications <strong>of</strong> this disease, <strong>and</strong> numerousother diseases, are <strong>of</strong>ten slow in coming. However, because <strong>of</strong> their nature <strong>and</strong>potential to have pr<strong>of</strong>ound impacts, it is critical to underst<strong>and</strong> wildlife diseases.Underst<strong>and</strong>ing wildlife diseases is a specialty that was initially recognized by the statewildlife agencies <strong>and</strong> has since proven its value to numerous other cooperators.It is impossible to say how much <strong>of</strong> the initial funds were from the <strong>Wildlife</strong> <strong>Restoration</strong>excise tax. However, many wildlife historians conclude that it is likely that a large portionif SCWDS' initial budget <strong>of</strong> $18,000 was from <strong>Wildlife</strong> <strong>Restoration</strong> funds. Even today, itis difficult to precisely determine how much <strong>of</strong> each state's $15,000 annual contributionto SCWDS is <strong>Wildlife</strong> <strong>Restoration</strong> funds. Needless to say, this initial pooling <strong>of</strong> fundsformed the nucleus <strong>of</strong> what is today one <strong>of</strong> the world's premier wildlife-diseaselaboratories. It's budget is approximately $4 million <strong>and</strong> cooperators include theDepartment <strong>of</strong> the Interior, 17 state wildlife agencies, Department <strong>of</strong> Agriculture'sAnimal <strong>and</strong> Plant Health Inspection Services, National Institute <strong>of</strong> Health, the Center forDisease Control <strong>and</strong> Prevention <strong>and</strong> several non-government organizations, includingthe National Wild Turkey Foundation, Rocky Mountain Elk Foundation <strong>and</strong> Safari ClubInternational. If all <strong>of</strong> the state funding that goes into SCWDS is provided by the <strong>Wildlife</strong><strong>Restoration</strong> funds, it is annually leveraged at least 20:1!The purpose <strong>of</strong> this case study is not to sing the praises <strong>of</strong> SCWDS, although they areplenty <strong>and</strong> include: developing the abomasal parasite count which is used as an indexfor managing deer populations throughout the southeast; determining that it was NOTnecessary to eradicate deer populations in order to control tropical cattle fever <strong>and</strong>protect our food supply; developing the CapChur gun to used by biologists worldwide totranquilize animals; underst<strong>and</strong>ing transmission pathways <strong>of</strong> important poultry diseasessuch as Newcastle disease, which prevented the need to eradicate wild birds to controlthis disease from spreading; <strong>and</strong> developing monitor protocols for emerging diseaseslike avian influenza (N1H1).The purpose <strong>of</strong> this case study is to illustrate four important concepts: 1) <strong>ROI</strong> cannotalways be calculated for specific projects; 2) <strong>Wildlife</strong> <strong>Restoration</strong> funding <strong>of</strong>ten forms thecore for much larger efforts; 3) <strong>Wildlife</strong> <strong>Restoration</strong> funds are <strong>of</strong>ten heavily leveraged bynumerous other funding sources; <strong>and</strong> 4) <strong>Wildlife</strong> <strong>Restoration</strong> funding frequently fund
projects that are critically important yet largely invisible to people not intimately familiarwith the inner workings <strong>of</strong> the program.Case #12: National <strong>Wildlife</strong> Refuge Hunting LawsuitData Contributors: U.S. <strong>Fish</strong> <strong>and</strong> <strong>Wildlife</strong> Service, Safari Club InternationalProject TypeTotal Excise Tax InvestmentTotal Additional InvestmentHunter Spending on TaxRelated ItemsHunter Spending on AllHunting Recreation ItemsExcise Tax-Related <strong>and</strong> TotalProject <strong>ROI</strong>Project LifespanAverage Annual InvestmentSYNOPSISConservation/ManagementUncertainUncertain$ 4.5 million (Lawsuit sub-set)$24.0 million (Lawsuit sub-set)Atypical (Value-added use <strong>of</strong> data generated forother purposes)IndefiniteNot applicableWhile the federal excise taxes paid on hunting equipment are clearly dedicated towildlife conservation at the state level, the use <strong>and</strong> application <strong>of</strong> the informationgenerated from projects paid by these funds is used by a variety <strong>of</strong> agencies <strong>and</strong>organizations.One critical use <strong>of</strong> this information was in the defense <strong>of</strong> hunting programs on 60National <strong>Wildlife</strong> Refuges (Refuges) scattered across 26 states. The use <strong>of</strong> stategenerateddata will be a critical part <strong>of</strong> maintaining current hunting programs <strong>and</strong>developing new hunting programs on all Refuges in the future.Refuges supply hunting opportunities on millions <strong>of</strong> acres for thous<strong>and</strong>s <strong>of</strong> hunters eachyear.This state-generated data was used in support <strong>of</strong> hunting from a lawsuit filed in 2003 bythe Fund for Animals (FFA) that challenged hunting on Refuges. In that suit, the FFAalleged that the U.S. <strong>Fish</strong> <strong>and</strong> <strong>Wildlife</strong> Service (FWS) violated National EnvironmentalPolicy Act (NEPA) by failing to analyze a variety <strong>of</strong> environmental issues when the FWSopened or exp<strong>and</strong>ed hunting opportunities on 37 Refuges between 1996 <strong>and</strong> 2003. Thesuit was exp<strong>and</strong>ed to include 23 additional Refuges the FWS opened to hunting in2007.The FFA claimed that these increased recreational hunting opportunities have adetrimental impact on the habitat, breeding <strong>and</strong> other normal behaviors <strong>of</strong> the wildlifethat reside in the refuges.61
As a result <strong>of</strong> the suit, the FWS re-drafted the Environmental Assessments (EAs) for the60 Refuges involved in the litigation.In completing individual EAs, the Refuges were compelled to analyze (among otherenvironmental issues) the "direct, indirect <strong>and</strong> cumulative impacts" <strong>of</strong> hunting on huntedmigratory birds <strong>and</strong> hunted resident species.Fortunately, the states, through projects funded by the <strong>Wildlife</strong> <strong>Restoration</strong> program,have been collecting abundance, breeding success, <strong>and</strong> annual harvest estimates formany years on hunted species. Critical data at the state-level was combined withnational-level data for more than 30 species <strong>of</strong> ducks <strong>and</strong> geese, plus woodcock <strong>and</strong>doves to provide the needed information.In addition, states provided similar data for 21 species <strong>of</strong> resident small <strong>and</strong> upl<strong>and</strong>game, <strong>and</strong> eight species <strong>of</strong> resident big-game. Again, this information was collectedthrough projects funded by the <strong>Wildlife</strong> <strong>Restoration</strong> program. The basic biologicalhistories <strong>of</strong> these species were also utilized to illustrate the minimal impacts (<strong>and</strong> insome cases beneficial impacts) that hunting has on Refuges.While this lawsuit has not yet been decided, the preparers <strong>of</strong> the EAs are confident thatthe questions on the direct, indirect <strong>and</strong> cumulative impact that hunting has on huntedspecies were more than adequately answered, thanks to the investment that hunters<strong>and</strong> the hunting <strong>and</strong> shooting sports industry has made in wildlife management duringthe past decades. This investment will continue to be critical because, by law, allhunting programs on Refuges have to be reviewed every 10 years. This cycle <strong>of</strong> draftingEAs <strong>and</strong> examining direct, indirect <strong>and</strong> cumulative impact <strong>of</strong> hunting likely will continueuntil all 318 Refuges that currently allow hunting have been completed. In addition, thisrequirement is also necessary for all new refuges that are open for hunting.It would be extremely difficult to estimate a traditional return on investment in thisinstance for a number <strong>of</strong> reasons. First <strong>and</strong> foremost, this case spans many states <strong>and</strong>species <strong>and</strong> as a result draws from many different sources <strong>of</strong> state <strong>and</strong> federal funding.However, we can calculate part <strong>of</strong> the story by identifying the retail spending by huntersutilizing the Refuge system. Table 13 reports hunter visitation <strong>and</strong> tax related equipmentitem purchases for hunters using Refuges.
Table 13. National <strong>Wildlife</strong> Refuge Hunting: Visitation <strong>and</strong> Spending by Hunters(2009$s)National <strong>Wildlife</strong>RefugeVisitation (Days)LawsuitSubsetNationalNational <strong>Wildlife</strong> RefugeTax Related EquipmentItem PurchasesLawsuitSubset63NationalNational <strong>Wildlife</strong> RefugeTotal Purchases forHunting RecreationLawsuitSubsetNationalWaterfowl 157,701 833,189 $1,464,731 $7,738,664$11,089,111 $58,587,469Othermigratory bird 13,124 69,339 $121,897 $644,021 $922,849 $4,875,720Upl<strong>and</strong> game 118,434 625,728 $986,045 $5,209,604 $9,088,819 $48,019,259Big game 181,641 959,669 $1,973,334$10,425,779$13,409,314$70,845,878Total hunting 470,901 2,487,925 $4,546,006$24,018,067$34,510,093$182,328,326Visitation days are derived from surveys conducted for the Refuge Annual PerformancePlan. Purchases are estimated using the 2006 National <strong>Fish</strong>ing, Hunting <strong>and</strong> <strong>Wildlife</strong>-Associated Recreation (National Survey). Using this information, we determined theamount <strong>of</strong> retail spending on tax related equipment items per hunting day specific to thegame pursued as well as the total amount spent on hunting related recreation (lodging,food, fuel, etc.). Per day purchases on tax related items, adjusted for a 30% marketchain markup, for waterfowl <strong>and</strong> other migratory birds are $9.29, for upl<strong>and</strong> game are$8.33, <strong>and</strong> for big game are $10.86. Total purchases per day for waterfowl <strong>and</strong> othermigratory birds are $70.32, for upl<strong>and</strong> game are $76.74, <strong>and</strong> big game are $73.82.National refuge visitation is estimated to be 2.5 million hunter days per year. Totalhunting visits to the 60 refuges involved in the lawsuit is estimated to be approximately471,000. The impact <strong>of</strong> these days on industry is roughly $24 million dollars in retailadjustedsales on tax related hunting equipment items across the entire refuge system<strong>and</strong> $4.5 million across the refuges involved in the lawsuit. Total spending is estimatedto be $182.3 million for the entire refuge system <strong>and</strong> $34.5 million for the sixty refuges.While this lawsuit is obviously important to the hunters that participate in the refugehunts, its ramifications go far beyond the thous<strong>and</strong>s <strong>of</strong> hunters that may be directlyimpacted. Refuges are visited by nearly 40 million wildlife enthusiasts every year, most<strong>of</strong> which are non-hunters. Well-managed hunting programs on these Refuges areaccepted by most <strong>of</strong> these visitors as part <strong>of</strong> the purpose <strong>of</strong> the Refuge <strong>and</strong> as a part <strong>of</strong>mainstream wildlife-dependent recreation. By inference, the public accepts the ideathat, if hunting is okay on a National <strong>Wildlife</strong> Refuge, then it must be okay on otherl<strong>and</strong>s. Without the data supplied by state agencies to meet the legal requirements <strong>of</strong>EAs, this public acceptance would likely diminish <strong>and</strong> hunting – both on <strong>and</strong> <strong>of</strong>f Refuges– would suffer.
Case #13: Wisconsin Bear-Population EstimationData Contributors: Wisconsin Department <strong>of</strong> Natural Resources.SYNOPSISProject TypeConservation/ManagementTotal Excise Tax Investment (b) $157,174 (2006-2009)Total Additional Investment (d) $212,926 (In in-kind funding from the University<strong>of</strong> Wisconsin <strong>and</strong> donations from the WisconsinBear hunters <strong>Association</strong>, including500 volunteers donating more than 8,000 hours.)Hunter Spending on Tax Related $129,035Items (a)Hunter Spending on All Hunting $876,825Recreation Items (c)Excise Tax-Related <strong>ROI</strong> -17.9%Total Project <strong>ROI</strong> 137%Project LifespanExcise Tax-Related <strong>ROI</strong>=(a-b)/b <strong>and</strong> Total Project <strong>ROI</strong>=(c-(d+b))/(d+b)In 2006, the Wisconsin Department <strong>of</strong> Natural Resources (WDNR) employed a new,simple-yet-sophisticated, research method to estimate bear populations. The researchwas conducted by graduate students at the University <strong>of</strong> Wisconsin – Madison, but paidfor from funds from the <strong>Wildlife</strong> <strong>Restoration</strong> program <strong>and</strong> other partners.A growing number <strong>of</strong> bear sightings, bear damage <strong>and</strong> nuisance complaints, <strong>and</strong> veryhigh hunter success rates all indicated that the bear population may be higher thanestimates indicated. The availability <strong>of</strong> new technology, <strong>and</strong> its successful application ina neighboring state, prompted WDNR to fund a research project aimed at obtaining anupdated population estimate.Researchers placed bacon strips that were wrapped around tetracycline pills atlocations around the state. The baits were placed inside wooden boxes which wereattached to trees 5 feet <strong>of</strong>f <strong>of</strong> the ground to minimize consumption by other animals.Approximately 2,200 baits were distributed in 29 counties by more than 500 volunteersfrom the Wisconsin Bear Hunters <strong>Association</strong>. Approximately 970 baits were consumedby bears.Because a small portion <strong>of</strong> tetracycline is permanently incorporated into the body tissue<strong>of</strong> anything that eats it, these bears were "captured" <strong>and</strong> could be used to calculate thebear population if they were "recaptured" at some future date.
The recapture process involved hunters voluntarily submitting a small portion <strong>of</strong> a bearrib-bone from any bear that was harvested. Hunters whole-heartedly embraced theresearch project <strong>and</strong> submitted more than 2,500 rib-bones for analysis. Sixty-nine ribbonestested positive for tetracycline <strong>and</strong>, therefore, represented "re-captured" bears.Statisticians at the University were able to estimate the population <strong>of</strong> bears bycomparing the ratio <strong>of</strong> captured <strong>and</strong> re-captured bears to the number <strong>of</strong> harvestedbears. The revised estimate was almost twice as large as any previous estimate. Asecond year <strong>of</strong> research verified the larger population estimate.In addition, other on-going research to identify preferred habitat <strong>and</strong> use by bears alsosupported the larger population size. This research indicated that occupied habitat was30 percent greater than initially estimated. Additional research is planned to furtherrefine the population estimate <strong>and</strong> habitat use information.Once the research was completed in 2008, the Wisconsin bear managers, armed withnew population numbers, quickly responded by increasing the bear quota licenses by55 percent – from 4,700 to more than 7,300! The additional 2,600 bear huntersharvested approximately 1,000 more bears <strong>and</strong> spent more than 16,400 days huntingbears!An additional 45,000 "trips" were dedicated to setting-up <strong>and</strong> maintaining bait sites (notesome <strong>of</strong> these trips occurred during the season <strong>and</strong> likely occurred in conjunction withthe actual hunt; an estimated 30,000 non-hunting baiting trips occurred). An untoldamount <strong>of</strong> time <strong>and</strong> resources were also dedicated to training dogs <strong>and</strong> scouting newbear hunting areas by the new bear hunters.Tax related equipment item purchases on hunting equipment are estimated using thereported hunter days <strong>of</strong> 16,443 <strong>and</strong> tax related equipment purchases at $7.62 per day,once adjusted for a 30% market chain markup. Per day equipment related expenses arecalculated using state-level estimates from 2006 National Survey data for totalpurchases <strong>of</strong> big game hunters only. Because state-level big game purchases are notitemized by category, a national-level adjustment factor <strong>of</strong> 19.1% is utilized to isolate taxrelated item sales from this total purchase value. The assumption being thatWisconsin‟s big game hunters‟ purchasing patterns are similar to that <strong>of</strong> other big gamehunters across the nation. Total spending on bear hunter recreation is estimated at$51.75 per hunting day.65
Table 14. Return on Investment: Wisconsin Bear Population (2009). Expressed inconstant (2009) dollars.Total <strong>Wildlife</strong> <strong>Restoration</strong> Investments (2006-2009) $157,174Total Additional Leveraged Funds (2006-2009) $212,926Tax Related Equipment Item Purchases $129,035Total Hunting Recreation Purchases $876,825Excise Tax-Related <strong>ROI</strong> -17.9%Total Project <strong>ROI</strong> 137%Note: Additional leveraged funding sources are from University <strong>of</strong> Wisconsin <strong>and</strong> Wisconsin Bear Hunters <strong>Association</strong>Per day hunter purchases <strong>of</strong> taxable equipment items is then estimated to be $129,035<strong>and</strong> total purchases is $876,825 (Table 14). Excise tax investments allocated towardsthis research total $157,174 between 2006 <strong>and</strong> 2009. Additional leverage funds total$212,926. Net benefits are currently negative <strong>and</strong> the estimated Excise Tax-Related<strong>ROI</strong> is -17.9%. However, the Total Project <strong>ROI</strong> is 137%.Because Wisconsin bear permits are allocated on a quota system, the amount <strong>of</strong>waiting time to be selected for a permit has also been reduced <strong>and</strong> over time morehunters will be participating in this new opportunity. Both the Excise Tax-Related <strong>ROI</strong><strong>and</strong> the Total Project <strong>ROI</strong> will likely increase over time as more permits are issued,more hunters take advantage <strong>of</strong> this opportunity, <strong>and</strong> the research costs needed tosupport the bear hunt decline.Case #14: Maryl<strong>and</strong> Bear HuntingData Contributors: Maryl<strong>and</strong> Department <strong>of</strong> Natural Resources.SYNOPSIS: 2007-2009Project TypeConservation/ManagementTotal Excise Tax Investment (b) $523,429Total Additional Investment (d) $174,476The cost to the agency <strong>of</strong> the litigation isunknown. However, this cost wasnecessary to support the scientificcredibility <strong>and</strong> pr<strong>of</strong>essionalism <strong>of</strong> theMaryl<strong>and</strong> Department <strong>of</strong> NaturalResources <strong>and</strong> the public trust doctrine.Hunter Spending on Tax Related Items (a) $23,037Hunter Spending on All Hunting$151,920Recreation Items (c)Average Annual Excise Tax-Related <strong>ROI</strong> -95.6%Average Annual Total Project <strong>ROI</strong> -77.6%Excise Tax-Related <strong>ROI</strong>=(a-b)/b <strong>and</strong> Total Project <strong>ROI</strong> =(c-(d+b))/(d+b)
In October 2004, Maryl<strong>and</strong>‟s Department <strong>of</strong> Natural Resources (DNR) implementedMaryl<strong>and</strong>‟s first bear-hunting season in 51 years. Subsequent hunts have been heldeach year since.This conservation triumph did not happen by accident, nor did it come about withoutcontroversy. You see, Maryl<strong>and</strong> is also home to the Humane Society <strong>of</strong> the UnitedStates <strong>and</strong> the Fund for Animals. Both <strong>of</strong> these anti-hunting groups challenged the initialhunt <strong>and</strong> have brought frivolous lawsuits virtually every year since. These groups havebeen beaten in court each <strong>and</strong> every year because <strong>of</strong> the credibility <strong>of</strong> the DNR <strong>and</strong> thescientific data collected <strong>and</strong> analyzed by their bear biologists. Both the biologists <strong>and</strong>the data collected are funded, by the excise tax dollars contributed by industry <strong>and</strong>sportsmen. Twenty-five percent <strong>of</strong> the cost <strong>of</strong> the project was funded from huntinglicense dollars. Maryl<strong>and</strong>‟s bear season is a tribute to the long-st<strong>and</strong>ing partnershipamong state wildlife agencies, hunters, <strong>and</strong> the hunting <strong>and</strong> shooting sports industries.However, as the calculated <strong>ROI</strong> indicates, the economic return to hunting <strong>and</strong> shootingsports industry for this project was not positive. Nonetheless, the non-economic benefits<strong>of</strong> this project are significant for the future <strong>of</strong> hunting. This investment supported thelong st<strong>and</strong>ing public trust doctrine where wildlife is held – <strong>and</strong> managed – for the benefit<strong>of</strong> the public by trained wildlife pr<strong>of</strong>essionals <strong>and</strong> not on the emotional whims <strong>of</strong> a smallminority. Time <strong>and</strong> time again, the courts <strong>of</strong> Maryl<strong>and</strong> supported the pr<strong>of</strong>essionalbiologist employed by the DNR, the science they used to make their decisions, <strong>and</strong> thepublic trust doctrine.Essentially, this investment is best measured in decades <strong>and</strong> not dollars. Theconservation success that it represents is remarkable in it own right.In 1972, the black bears in Maryl<strong>and</strong> were declared an „endangered species.‟ However,because <strong>of</strong> protective laws <strong>and</strong> improving habitat conditions, bear populations began torecover. In 1985, the black bear was removed from the endangered species list <strong>and</strong>declared a „forest game animal‟ but with a closed season.About that time, biologists started to monitor bear populations <strong>and</strong> over time began toimplement more sophisticated scientific research efforts. For example, bearreproductive rates were first calculated in 1986 <strong>and</strong> have been periodically reassessedsince then. These rates have consistently ranged between 2.5 <strong>and</strong> 3.5 cubs per sow.This reproductive rate is one <strong>of</strong> the highest long-term rates ever recorded, <strong>and</strong> providedthe first insights that Black bear populations in Maryl<strong>and</strong> might be sustainable <strong>and</strong>provide hunting opportunities.In addition, population densities have been calculated. In 1991, the population density inGarrett County was estimated to be 12 bears/square mile. This estimate was recalculatedin 2000 using a more sophisticated technique – for both Garrett <strong>and</strong> AlleganyCounties – to be 27 bears per square mile. Based on these calculations the bearpopulation increased more than 127%!67
During that same time frame, bear auto collisions, nuisance bear complaints <strong>and</strong>agricultural damage also increased substantially. These negative interactions betweenbears <strong>and</strong> people helped the public underst<strong>and</strong> the need for managing the bearpopulation.Armed with the scientific evidence <strong>of</strong> a bear population that had exceeded the "culturalcarrying capacity" (or human tolerance for bears), the Maryl<strong>and</strong> DNR proposed a highlyregulated bear hunting season. A bear harvest quota was established <strong>and</strong> permits wereavailable by a limited drawing. Hunters were required to call in each night to find out ifthe harvest quota had been reached <strong>and</strong> if the hunt would continue the next day.Two hundred permits were issued in 2004 <strong>and</strong> 2005; 220 in 2006, 2007 <strong>and</strong> 2008 <strong>and</strong>the hunt area exp<strong>and</strong>ed; <strong>and</strong> 240 permits were issued in 2009. Harvest quotas haveranged from 30 to 75 bears between 2004 <strong>and</strong> 2008; <strong>and</strong> between 60 – 85 bears for2009. Actual harvests have ranged from 20 to 56 bears <strong>and</strong> each year the seasonshave been closed early to avoid any possibility <strong>of</strong> over harvest.Total hunting recreation <strong>and</strong> tax related equipment item purchases are estimated usingtotal hunter days using the reported hunter numbers (220-240) <strong>and</strong> a season length <strong>of</strong>four days. Total purchases are estimated to be $57.55 per big game hunter day. Taxrelated equipment purchases, after adjusting for markup, are estimated to be $10.78 perbig game hunter day. Per day equipment related expenses are calculated using statelevelestimates from 2006 National Survey data for total purchases <strong>of</strong> big game huntersonly. Because state-level big game purchases are not itemized by category, a nationalleveladjustment factor <strong>of</strong> 19.1% is utilized to isolate tax related equipment sales fromthis total purchase value. The assumption being that Maryl<strong>and</strong>‟s big game hunters‟purchasing patterns are similar to that <strong>of</strong> other big game hunters across the nation.Hunter purchases <strong>of</strong> taxable equipment items are then estimated to total $23,037 since2007 (Table 15).Table 15. Maryl<strong>and</strong> Bear-Hunting Return on Investment (2009$)Year Investments PurchasesTotal TaxRelated<strong>Wildlife</strong><strong>Restoration</strong>AdditionalFundsEquipmentItems2007 $176,879 $58,960 $7,4532008 $174,051 $58,017 $7,4532009 $172,500 $57,500 $8,131Total $523,429 $174,476 $23,037ExcisetaxRelated<strong>ROI</strong>-TotalHuntingRecreationPurchases95.8% $50,645.21-95.7% $50,645.21-95.3% $55,249.32-95.6% $156,540TotalProject<strong>ROI</strong>-78.5%-78.2%-76.0%-77.6%
The funding for these efforts were borne jointly by a <strong>Wildlife</strong> <strong>Restoration</strong> grant toMaryl<strong>and</strong> DNR <strong>and</strong> hunting license funds. The exact cost prior to 2007 is difficult todetermine because the bear research was combined with grouse, turkey <strong>and</strong> squirrelresearch. Since 2007 the bear project is a separate line-item in the budget <strong>and</strong> hasaveraged approximately $230,000 per year between both <strong>Wildlife</strong> <strong>Restoration</strong> <strong>and</strong> statefunds. Benefits relate to costs are negative <strong>and</strong> the estimated Excise Tax-Related <strong>ROI</strong>is -95.6% <strong>and</strong> Total Project <strong>ROI</strong> is -77.6%.Some people may question the cost <strong>of</strong> all <strong>of</strong> this effort for providing a few hundredhunters with an opportunity to hunt bears. However, the real benefits far exceed thecosts. First <strong>and</strong> foremost, Maryl<strong>and</strong> is fulfilling its public trust responsibility by managingbears for their long-term viability. The state wildlife agency has repeatedly demonstratedits credibility as the foremost wildlife authority within the state. As a result <strong>of</strong> theagencies' credibility, scientific data <strong>and</strong> long-term management perspective, the publichas accepted <strong>of</strong> the need for a highly regulated recreational hunting opportunity forbears. It is important to remember that this hunt is a by-product <strong>of</strong> effective bearmanagement. Additional investments in scientific bear management data collection isplanned <strong>and</strong> will be necessary in order to maintain this hunting season.It is important to underst<strong>and</strong> that not all <strong>ROI</strong>s will be positive. Some <strong>ROI</strong>s, such as thisBlack bear case study, will improve over time. However, in this instance the project willnot likely yield a positive <strong>ROI</strong> because the hunting opportunity will remain very limited<strong>and</strong> the costs <strong>of</strong> supporting the hunting season will remain very high. Nonetheless,there are non-monitory benefits that are also important to factor into the conservationequation. These include, among other issues, enhancing the agencies' scientificcredibility <strong>and</strong> having the agency pro-actively embrace its public trust responsibilities.Both <strong>of</strong> these are core elements that support long-term conservation initiatives whichprovide long-term hunting opportunities for other species.From a philosophical point <strong>of</strong> view, the planning, collecting <strong>and</strong> analyzing scientific dataon bear populations is expensive; however, beating anti-hunters in court – in their ownbackyard – is priceless!69
ConclusionThe abundance <strong>of</strong> wildlife that we know today, <strong>and</strong> the hunting opportunities that resultfrom this abundance, is the result <strong>of</strong> numerous investments from a variety <strong>of</strong> sources,including excise taxes, license dollars, state, federal <strong>and</strong> private l<strong>and</strong> acquisitionprograms, pollution prevention <strong>and</strong> management programs, agricultural programs, <strong>and</strong>conservation minded non-government organizations.As a result, it is difficult to calculate a return-on-investment in the classical businesssense. This is largely due to the difficulty in determining what the "total investment" is,as well as what the "total return" is. Nonetheless, the conservation programs in theUnited States, <strong>and</strong> the funding mechanisms that support them, are unique, <strong>and</strong>arguably, the best in the world. The level <strong>of</strong> wildlife restoration that has resulted fromthese programs would likely be unimaginable to the visionaries who established thecore programs that we have today.During the past decades, "conservation equity" has been built up, in the form <strong>of</strong>abundant wildlife populations <strong>and</strong> the habitat that supports them. This has lead toincreased hunting opportunities for millions <strong>of</strong> Americans. As a result, the hunting <strong>and</strong>shooting sports industries have, <strong>and</strong> continue to, benefit from the past <strong>and</strong> currentinvestments in conservation programs.The <strong>Wildlife</strong> <strong>Restoration</strong> excise tax is the core funding source for these successfulprograms. These funds, as mentioned earlier, are <strong>of</strong>ten leveraged by many othersources – not just license dollars – to benefit hunting.In addition to the core funding <strong>and</strong> leveraging aspects <strong>of</strong> the excise tax, the existence <strong>of</strong>this tax, because <strong>of</strong> unique provisions in the law, protects hunting license dollars frombeing diverted to other uses by state legislatures.If this core funding were lost, it would be devastating to conservation efforts, <strong>and</strong> to thehunting <strong>and</strong> shooting sports industries, because it would require a 40-70 percentincrease in license fees to recoup the lost funds. This would likely result in a significantloss in the number <strong>of</strong> hunters, which, in turn, would significantly erode the industries'customer base. The conservation equity that we now enjoy would eventually bedepleted <strong>and</strong> the hunting heritage that we proudly support would become a mereshadow <strong>of</strong> its former self.The success <strong>of</strong> the investments in conservation throughout the nation – both inrestoring wildlife populations to levels where regulated hunting is possible <strong>and</strong> inestablishing public l<strong>and</strong>s open to all – is the primary factor that has enabled millions <strong>of</strong>Americans from all walks <strong>of</strong> life to enjoy the great outdoors. These participants are bothconservationists <strong>and</strong> our industries' customer base.
The future <strong>of</strong> conservation, participation in recreational hunting <strong>and</strong> shooting, <strong>and</strong> thehunting <strong>and</strong> shooting sports industries, is inseparable from our past. The partnership <strong>of</strong>the past is the blueprint for the future. At a time when today‟s state agencies face amultitude <strong>of</strong> new issues <strong>and</strong> dem<strong>and</strong>s beyond traditional fish <strong>and</strong> game activities,continued, indeed strengthened, excise tax funding is critical in continuing efforts forwildlife conservation <strong>and</strong> l<strong>and</strong> acquisition, as well as recruitment <strong>and</strong> retention efforts.This partnership is the foundation which supports the customer base that our “user pay”system depends.71
APPENDICESAppendix A: Taxable Equipment ItemsAppendix B: Hunting Recreation Total Purchases by CategoryAppendix C: Macro-level Purchase Estimation: Model Results <strong>and</strong> Raw DataAppendix D: Archery <strong>and</strong> Muzzleloader Hunters, Days, <strong>and</strong> Purchases (1975-2006)Appendix E: Growth in Hunting Opportunity (Maps): Bear, Grouse, Quail, Rabbit, TreeSquirrelAppendix F: Growth in Hunting Opportunity (Tables)
Appendix A: Taxable Equipment ItemsTable A1. List <strong>of</strong> Items Subject to the <strong>Wildlife</strong> <strong>Restoration</strong> Excise Tax. Table is forgeneral reference only. Consult IRS guidelines for specific items subject to the tax.Hunting <strong>and</strong> Shooting Sports Equipment List <strong>of</strong> Taxable Items in the <strong>Wildlife</strong><strong>Restoration</strong> Program As <strong>of</strong> May 2010Sporting firearms <strong>and</strong> ammunition are taxed at 11%; H<strong>and</strong>guns are taxed at 10%.These include:PistolsRevolversFirearms (other than pistols <strong>and</strong> revolvers)ShellsCartridgesFirearm parts/accessories – if in knockdown/kit form <strong>and</strong> contain allcomponentsRiflesShotgun <strong>and</strong> combination gunsComponent parts for shells/cartridges sold as a “kit”Reloaded ammunition for resale (some exemptions apply)Portable weapons that use matchlock, flintlock, percussion cap ignition system,or black powder firearmsCenterfire rifles including autoloaders, lever action, slide action, bolt action,single shot, drillings, combination guns, <strong>and</strong> double riflesRimfire rifles including autoloaders, lever action, slide action, bolt action, <strong>and</strong>single shotCompetition rifles: both centerfire <strong>and</strong> rimfireShotguns including autoloaders, slide actions, over/under, side by sides, boltaction <strong>and</strong> single shotArchery equipment is taxed at 11% for bows <strong>and</strong> archery accessories that are attachedto a bow, quivers, points <strong>and</strong> broadheads.Arrow shafts are taxed at $0.45 per shaft (as <strong>of</strong> 1/1/09) whether sold separately orincorporated as part <strong>of</strong> a finished product (including bow fishing arrows);regardless <strong>of</strong> shaft material or the type <strong>of</strong> head, that measure 18 inches or morein overall length (including the tip or head, <strong>and</strong> nock), <strong>and</strong> all arrows sold after9/30/84 that measure less than 18 inches in overall length, <strong>and</strong> are suitable foruse with a taxable bow; wood arrows designed for use by children are exempt.Arrow points including field, target, bow fishing <strong>and</strong> broadheads.73
Arrow holders (all items to be affixed to a to a bow to hold an arrow in ready position)Arrow plates (whether fixed, adjustable, spring loaded etc.)Arrow rests (whether bow shelf or auxiliary type)Quivers designed to provide ready access to taxable arrows during the time that anarcher is engaged in target shooting, hunting or fishing regardless <strong>of</strong> materialfrom which constructed including bow quivers for attaching to bows <strong>and</strong> groundquiversBows – peak draw weight 30 pounds or more including laminated, composite bows,solid glass, wood, steel, etc., bows <strong>and</strong> crossbows.Bow parts <strong>and</strong> accessories, including: bow h<strong>and</strong>les, h<strong>and</strong>le sections, bow levels, bow limbs bow saddles (including interchangeable or replaceable bow grips) bow sights <strong>and</strong> bow sight extensions (including parts <strong>and</strong> attachmentstherefore) bow silencing pads bow stabilizers (all attachments <strong>and</strong> weights for use on bows to effectstabilization, counterbalancing or modification <strong>of</strong> weight distribution) bowstrings bow wrist slings draw stops finger protectors attached to bowstring) grip formers kisser buttons (all items attached to bowstring to establish consistent anchorpoint) knocking points (all items attached to bowstring to establish arrow positioning) bowstring silencers bow tip protectors brush buttons cushion nocks cable guards <strong>and</strong> slides camouflaged bow covers (slip over cover cloth, self adhesive tape type, etc.) draw checks (spring loaded clickers, mirrors, or any other device attached to abow or string to insure consistent draw length) release draw bars string peeps (all items attached to bowstring for use in sighting)
Appendix B: Hunting Recreation Purchases by CategoryFigure B1. Total Retail Purchases for Hunting Recreation by Category (2006)Hunting Equip.:Tax Related Items,$3,822,853, 16%Hunting Equip.:Non-tax RelatedItems, $1,543,504,7%Food <strong>and</strong> Lodging,$2,791,245, 12%Transportation,$2,696,924, 11%Auxiliaryequipment,$1,330,216, 6%Other expenditures,$6,225,544, 26%Other trip costs,$1,190,445, 5%Special equipment,$4,034,928, 17%Source: 2006 National Survey <strong>of</strong> <strong>Fish</strong>ing, Hunting, <strong>and</strong> <strong>Wildlife</strong>-Associated RecreationFigure B1 above presents monies spent in 2006 on hunting related activities in theUnited States across eight different sub-categories. Their definitions are:Food <strong>and</strong> lodging: Includes food <strong>and</strong> meal purchases as well as costsrelated to lodging.Transportation: Includes both public <strong>and</strong> private transportation relatedexpensesOther trip costs: Includes guide fees, pack trip or package fees, l<strong>and</strong> usefees, equipment rental, boating costs (mooring, maintenance, insurance,fuel, etc), <strong>and</strong> heating or cooking fuel.Hunting equipmentTax Related Items: Includes rifles, shotguns, muzzleloaders, primitivefirearms, pistols, h<strong>and</strong>guns, ammunition, bows, arrows, <strong>and</strong> archeryequipment.Non-tax Related Items: Includes sights, decoys <strong>and</strong> game calls, h<strong>and</strong>loading equipment, hunting dogs <strong>and</strong> associated costs, <strong>and</strong> otherhunting related equipment.Auxillary equipment: Includes camping equipment, field glasses, telescopes,hunting clothing, boots <strong>and</strong> foul weather gear as well as processing <strong>and</strong>taxidermy costsSpecial equipment: Includes boats, campers, trail bikes, etc.Other purchases: Includes magazines, books, memberships, l<strong>and</strong> leasing orownership costs, licenses, stamps, tags, <strong>and</strong> permits.75
Appendix C: Macro-level Purchase Estimation: ModelResults <strong>and</strong> Raw DataMacro-level Linear Regression Model Output <strong>and</strong> PerformanceModel Summary bModel R R Square Adjusted R SquareStd. Error <strong>of</strong> theEstimate1 .992 a .985 .978 1.84541E8 2.633a. Predictors: (Constant), cert_lic, hunt_t3b. Dependent Variable: hunt_expANOVA bDurbin-WatsonModel Sum <strong>of</strong> Squares df Mean Square F Sig.1 Regression 1.091E19 2 5.454E18 160.151 .000 aResidual 1.703E17 5 3.406E16Total 1.108E19 7a. Predictors: (Constant), cert_lic, hunt_t3b. Dependent Variable: hunt_expCoefficients aUnst<strong>and</strong>ardized CoefficientsSt<strong>and</strong>ardizedCoefficientsModelB Std. Error BetatSig.1 (Constant) -4.140E9 3.463E9 -1.196 .285hunt_t3 19.651 1.895 1.102 10.368 .000cert_lic 258.284 209.069 .131 1.235 .272a. Dependent Variable: hunt_exp
Table C1. Tax Related Equipment Item Purchases: Actual <strong>and</strong> Estimated (1970-2006)National Survey: Tax RelatedEquipment Item Purchases Linear Interpolation Regression EstimationInflated (2009$) Wholesale ExciseInflated (2009$)Excise Tax Adjustment <strong>of</strong> Tax Actual Excise Excise TaxInflated Actual Excise Tax Related Inflated TR Exp Related Tax Related Related(2009$) Related Purchases Purchases (2009$). <strong>ROI</strong> Purchases PurchasesWholesaleAdjustment <strong>of</strong>Inflated Exp(2009$)Difference betweenactual <strong>and</strong> regressionestimated exp.Year Actual1970 $506,680,000 $2,801,587,813 $506,680,000 $2,801,587,813 $2,155,067,549 1088% $450,373,869 $2,490,254,092 $1,915,580,071 956% $56,306,131 11%1971 $601,646,900 $3,187,049,901 $2,451,576,847 1161% $601,805,553 $3,187,890,321 $2,452,223,323 1161%1972 $696,613,800 $3,575,345,330 $2,750,265,639 1137% $461,039,875 $2,366,270,612 $1,820,208,163 718%1973 $791,580,700 $3,824,850,195 $2,942,192,457 1123% $510,140,377 $2,464,954,639 $1,896,118,953 688%1974 $886,547,600 $3,857,956,642 $2,967,658,956 1099% $822,027,376 $3,577,186,351 $2,751,681,808 1012%1975 $981,514,500 $3,913,962,385 $981,514,500 $3,913,962,385 $3,010,740,296 1098% $998,343,677 $3,981,071,699 $3,062,362,845 1118% -$16,829,177 -2%1976 $1,076,481,400 $4,058,788,930 $3,122,145,331 823% $1,051,876,030 $3,966,016,307 $3,050,781,775 802%1977 $1,171,448,300 $4,147,178,283 $3,190,137,141 1229% $1,160,349,972 $4,107,887,820 $3,159,913,708 1217%1978 $1,266,415,200 $4,167,069,291 $3,205,437,916 1033% $1,330,150,785 $4,376,787,714 $3,366,759,780 1090%1979 $1,361,382,100 $4,022,959,113 $3,094,583,933 1014% $1,897,200,687 $5,606,332,560 $4,312,563,508 1453%1980 $1,456,349,000 $3,791,756,619 $1,456,349,000 $3,791,756,619 $2,916,735,861 1136% $1,390,739,640 $3,620,935,803 $2,785,335,233 1080% $65,609,360 5%1981 $1,556,747,000 $3,674,145,557 $2,826,265,813 882% $1,852,742,094 $4,372,736,310 $3,363,643,315 1069%1982 $1,657,145,000 $3,684,133,854 $2,833,949,118 1044% $2,032,236,627 $4,518,030,563 $3,475,408,125 1303%1983 $1,757,543,000 $3,785,722,918 $2,912,094,552 1343% $1,869,788,324 $4,027,497,767 $3,098,075,206 1435%1984 $1,857,941,000 $3,836,353,112 $2,951,040,855 1564% $2,453,992,302 $5,067,104,393 $3,897,772,610 2098%1985 $1,958,339,000 $3,904,611,283 $1,958,339,000 $3,904,611,283 $3,003,547,141 1199% $2,151,294,940 $4,289,334,225 $3,299,487,865 1327% -$192,955,940 -10%1986 $2,037,161,500 $3,987,650,700 $3,067,423,615 1268% $1,775,064,314 $3,474,607,416 $2,672,774,935 1092%1987 $2,115,984,000 $3,996,099,115 $3,073,922,396 1314% $1,631,269,457 $3,080,701,193 $2,369,770,149 990%1988 $2,194,806,500 $3,980,280,660 $3,061,754,354 1234% $2,250,680,724 $4,081,608,541 $3,139,698,878 1268%1989 $2,273,629,000 $3,933,689,877 $3,025,915,290 1275% $2,232,456,538 $3,862,455,873 $2,971,119,902 1250%1990 $2,352,451,500 $3,861,422,245 $2,970,324,804 958% $2,201,478,790 $3,613,608,685 $2,779,698,988 890%1991 $2,431,274,000 $3,829,649,267 $2,431,274,000 $3,829,649,267 $2,945,884,051 982% $2,406,120,562 $3,790,028,539 $2,915,406,568 971% $25,153,438 1%1992 $2,712,428,200 $4,147,656,513 $3,190,505,010 1164% $2,426,284,940 $3,710,106,146 $2,853,927,805 1031%1993 $2,993,582,400 $4,444,527,248 $3,418,867,114 1101% $3,258,043,811 $4,837,169,171 $3,720,899,362 1207%1994 $3,274,736,600 $4,740,567,921 $3,646,590,709 1026% $3,217,847,799 $4,658,214,664 $3,583,242,049 1007%1995 $3,555,890,800 $5,005,709,610 $3,850,545,854 1162% $3,037,005,497 $4,275,262,784 $3,288,663,680 978%1996 $3,837,045,000 $5,246,578,223 $3,837,045,000 $5,246,578,223 $4,035,829,402 1540% $3,539,411,864 $4,839,609,962 $3,722,776,894 1413% $297,633,136 8%1997 $3,685,808,000 $4,926,742,622 $3,789,802,017 1588% $4,104,853,126 $5,486,871,495 $4,220,670,381 1780%1998 $3,534,571,000 $4,652,124,286 $3,578,557,143 1413% $3,963,642,358 $5,216,858,531 $4,012,968,101 1596%1999 $3,383,334,000 $4,356,844,696 $3,351,418,997 1159% $3,308,466,685 $4,260,435,277 $3,277,257,906 1131%2000 $3,232,097,000 $4,026,738,642 $3,097,491,263 1057% $3,046,752,163 $3,795,825,023 $2,919,865,402 990%2001 $3,080,860,000 $3,732,120,055 $3,080,860,000 $3,732,120,055 $2,870,861,581 1094% $3,263,415,252 $3,953,265,488 $3,040,973,452 1165% -$182,555,252 -6%2002 $3,229,258,600 $3,851,003,070 $2,962,310,054 1010% $3,787,213,749 $4,516,383,969 $3,474,141,515 1202%2003 $3,377,657,200 $3,938,219,797 $3,029,399,844 1112% $3,890,509,006 $4,536,185,492 $3,489,373,456 1296%2004 $3,526,055,800 $4,004,602,611 $3,080,463,547 1005% $3,625,706,822 $4,117,778,001 $3,167,521,539 1037%2005 $3,674,454,400 $4,036,387,218 $3,104,913,244 1056% $4,049,163,215 $4,448,004,755 $3,421,542,119 1174%2006 $3,822,853,000 $4,068,171,697 $3,822,853,000 $4,068,171,697 $3,129,362,844 957% $3,875,214,686 $4,123,893,517 $3,172,225,783 971% -$52,361,686 -1%ExciseTaxRelated<strong>ROI</strong>77
Table C2. Annual Purchases, Collections <strong>and</strong> <strong>ROI</strong>-TR: 1970-2006Linear InterpolationRegression EstimationYearNational Survey: TaxRelated Equipment ItemPurchases (2009 $s)Excise Tax Collections(2009 $s)Estimated Tax RelatedEquipment ItemPurchases (2009 $s)Wholesale Adjustment <strong>of</strong>Linear InterpolatedPurchases (2009 $s)ExciseTaxRelated<strong>ROI</strong>Estimated Tax RelatedEquipment ItemPurchases (2009 $s)Wholesale Adjustment <strong>of</strong>Regression EstimatedPurchase (2009 $s)ExciseTaxRelated<strong>ROI</strong>1970 $2,801,587,813 $181,392,830 $2,801,587,813 $2,155,067,549 1088% $2,490,254,092 $1,915,580,071 956%1971 $194,429,264 $3,187,049,901 $2,451,576,847 1161% $3,187,890,321 $2,452,223,323 1161%1972 $222,407,802 $3,575,345,330 $2,750,265,639 1137% $2,366,270,612 $1,820,208,163 718%1973 $240,630,633 $3,824,850,195 $2,942,192,457 1123% $2,464,954,639 $1,896,118,953 688%1974 $247,412,388 $3,857,956,642 $2,967,658,956 1099% $3,577,186,351 $2,751,681,808 1012%1975 $3,913,962,385 $251,409,634 $3,913,962,385 $3,010,740,296 1098% $3,981,071,699 $3,062,362,845 1118%1976 $338,158,400 $4,058,788,930 $3,122,145,331 823% $3,966,016,307 $3,050,781,775 802%1977 $239,988,721 $4,147,178,283 $3,190,137,141 1229% $4,107,887,820 $3,159,913,708 1217%1978 $283,039,562 $4,167,069,291 $3,205,437,916 1033% $4,376,787,714 $3,366,759,780 1090%1979 $277,698,649 $4,022,959,113 $3,094,583,933 1014% $5,606,332,560 $4,312,563,508 1453%1980 $3,791,756,619 $236,002,809 $3,791,756,619 $2,916,735,861 1136% $3,620,935,803 $2,785,335,233 1080%1981 $287,673,109 $3,674,145,557 $2,826,265,813 882% $4,372,736,310 $3,363,643,315 1069%1982 $247,782,518 $3,684,133,854 $2,833,949,118 1044% $4,518,030,563 $3,475,408,125 1303%1983 $201,842,919 $3,785,722,918 $2,912,094,552 1343% $4,027,497,767 $3,098,075,206 1435%1984 $177,312,567 $3,836,353,112 $2,951,040,855 1564% $5,067,104,393 $3,897,772,610 2098%1985 $3,904,611,283 $231,284,476 $3,904,611,283 $3,003,547,141 1199% $4,289,334,225 $3,299,487,865 1327%1986 $224,160,707 $3,987,650,700 $3,067,423,615 1268% $3,474,607,416 $2,672,774,935 1092%1987 $217,349,495 $3,996,099,115 $3,073,922,396 1314% $3,080,701,193 $2,369,770,149 990%1988 $229,469,482 $3,980,280,660 $3,061,754,354 1234% $4,081,608,541 $3,139,698,878 1268%1989 $220,063,058 $3,933,689,877 $3,025,915,290 1275% $3,862,455,873 $2,971,119,902 1250%1990 $280,824,721 $3,861,422,245 $2,970,324,804 958% $3,613,608,685 $2,779,698,988 890%1991 $3,829,649,267 $272,151,825 $3,829,649,267 $2,945,884,051 982% $3,790,028,539 $2,915,406,568 971%1992 $252,347,606 $4,147,656,513 $3,190,505,010 1164% $3,710,106,146 $2,853,927,805 1031%1993 $284,697,737 $4,444,527,248 $3,418,867,114 1101% $4,837,169,171 $3,720,899,362 1207%1994 $323,762,202 $4,740,567,921 $3,646,590,709 1026% $4,658,214,664 $3,583,242,049 1007%1995 $305,059,910 $5,005,709,610 $3,850,545,854 1162% $4,275,262,784 $3,288,663,680 978%1996 $5,246,578,223 $246,122,753 $5,246,578,223 $4,035,829,402 1540% $4,839,609,962 $3,722,776,894 1413%1997 $224,562,093 $4,926,742,622 $3,789,802,017 1588% $5,486,871,495 $4,220,670,381 1780%1998 $236,559,330 $4,652,124,286 $3,578,557,143 1413% $5,216,858,531 $4,012,968,101 1596%1999 $266,181,182 $4,356,844,696 $3,351,418,997 1159% $4,260,435,277 $3,277,257,906 1131%2000 $267,778,022 $4,026,738,642 $3,097,491,263 1057% $3,795,825,023 $2,919,865,402 990%2001 $3,732,120,055 $240,443,600 $3,732,120,055 $2,870,861,581 1094% $3,953,265,488 $3,040,973,452 1165%2002 $266,903,141 $3,851,003,070 $2,962,310,054 1010% $4,516,383,969 $3,474,141,515 1202%2003 $249,908,724 $3,938,219,797 $3,029,399,844 1112% $4,536,185,492 $3,489,373,456 1296%2004 $278,689,808 $4,004,602,611 $3,080,463,547 1005% $4,117,778,001 $3,167,521,539 1037%2005 $268,630,812 $4,036,387,218 $3,104,913,244 1056% $4,448,004,755 $3,421,542,119 1174%2006 $4,068,171,697 $296,099,557 $4,068,171,697 $3,129,362,844 957% $4,123,893,517 $3,172,225,783 971%
Appendix D: Archery <strong>and</strong> Muzzleloader Hunters, Days, <strong>and</strong> Purchases (1975-2006)Table D1. Archery Excise Tax Collections, Retail Purchases, Hunters, <strong>and</strong> Days (1975-2006)1975 1980 1985 1991 1996 2001 2006<strong>Wildlife</strong> <strong>Restoration</strong> Excise Tax Collection(Bow & Arrow ONLY)<strong>Wildlife</strong> <strong>Restoration</strong> Excise TaxCollection: Bow & Arrow ONLY(2009 $s)Bow & Arrow Retail Purchases(actual $s)Bow & Arrow Retail Purchases(2009 $s)$546,137 $6,160,076 $8,399,239 $15,096,809 $18,000,000 $22,668,686 $28,667,274$2,177,831 $16,038,374 $16,746,403 $23,780,494 $24,611,400 $27,460,846 $30,507,713N/A $104,507,000 $196,740,000 $344,239,000 $589,565,000 $462,097,000 $674,117,000N/A $272,094,425 $392,260,212 $542,245,273 $806,112,225 $559,784,306 $717,395,311Archery Hunters 2,302,000 2,015,000 2,369,000 2,732,000 3,289,000 3,070,000 3,501,000Archery Hunter Days 23,143,000 17,474,000 N/A N/A 41,467,000 38,705,000 50,027,000Purchases per Hunter (2009 $s) N/A $135.03 $165.58 $198.48 $245.09 $182.34 $204.91Purchases per Day (2009 $s) N/A $15.57 N/A N/A $19.44 $14.46 $14.34Source: Collections-U.S. <strong>Fish</strong> <strong>and</strong> <strong>Wildlife</strong> Service Certified Collections. Note-<strong>Wildlife</strong> <strong>Restoration</strong> Excise tax collections on bows <strong>and</strong> arrows began in fiscal year 1975.Source: Purchases, hunters, <strong>and</strong> days-National Survey on <strong>Fish</strong>ing, Hunting, <strong>and</strong> <strong>Wildlife</strong> Associated Recreation. Note-Data pre- <strong>and</strong> post 1991 are not directly comparable due to a change in methodology.Table D2. Muzzleloader Retail Purchases, Hunters, <strong>and</strong> Days (1975-2006)1975 1980 1985 1991 1996 2001 2006Muzzleloader & Primitive FirearmRetail Purchases (actual $s)Muzzleloader & Primitive FirearmRetail Purchases (2009 $s)Muzzleloader & Primitive FirearmHuntersMuzzleloader & Primitive FirearmHunter DaysN/A N/A $57,227,000 $83,852,000 $171,949,000 $105,507,000 $184,157,000N/A N/A $114,099,193 $132,083,670 $235,105,868 $127,811,180 $195,979,879415,000 833,000 853,000 1,439,000 1,677,000 2,050,000 2,484,0002,756,000 5,553,000 N/A N/A 9,120,000 12,841,000 16,787,000Purchases per Hunter (2009 $s) N/A N/A $133.76 $91.79 $140.19 $62.35 $78.90Purchases per Day (2009$s) N/A N/A $0.00 N/A $25.78 $9.95 $11.67Note-<strong>Wildlife</strong> <strong>Restoration</strong> excise tax collections related to muzzleloaders <strong>and</strong> other primitive firearms are tallied collectively with other firearms. As a result, collections for this category <strong>of</strong>firearms are not reported.Source: Expenditures, hunters, <strong>and</strong> days-National Survey on <strong>Fish</strong>ing, Hunting, <strong>and</strong> <strong>Wildlife</strong> Associated Recreation. Note-Data pre- <strong>and</strong> post 1991 are not directly comparable due to a changein methodology.79
Appendix E: Growth in Hunting Opportunity (Maps): Bear,Grouse, Quail, Rabbit, SquirrelFigures E1 through E5 reflect the growth in hunting seasons available across the nationbetween 1937 <strong>and</strong> 2010 for bear, grouse, quail, rabbit <strong>and</strong> tree squirrel hunters. Thesupporting data is presented in two successive tables in Appendix F. State huntingopportunities are characterized using two different <strong>and</strong> complimentary approaches.First, changes to the number <strong>of</strong> days open to hunting are defined in either four or fivecolor schematics. Those states that are not assigned a color reflect states where thereare either no hunting seasons indicated or the state is outside <strong>of</strong> the particular speciesrange. Second, states that have transitioned from either a localized season or a closedseason since 1937 or have since closed a season in 2010 are identified by distincthatch markings.Figure E1: National Growth in Bear Hunting Days (1937-2010)Note: In 1937 some states had very liberal bear seasons because bear were considered predators <strong>and</strong> not managed as gameanimals.
Figure E2. National Growth in Grouse Hunting Days (1937-2010)Figure E3: National Growth in Quail Hunting Days (1937-2010)81
Figure E4. National Growth in Rabbit Hunting Days (1937-2010)Figure E5. National Growth in Tree Squirrel Hunting Days (1937-2010)Note: The state <strong>of</strong> Tennessee does <strong>of</strong>fer more than 200 days <strong>of</strong> hunting opportunity but had no change in the length <strong>of</strong> huntingseason between 1937 <strong>and</strong> 2010.
Appendix F: Growth in Hunting Opportunity (Tables)Table F1. Growth in Hunting Opportunity Days: by state (1937-2010)Hunting Opportunities: 1937 vs 2010Maximum Annual Days <strong>of</strong> Hunting Allowed, Per SpeciesDeer Elk Bear Turkey PheasantState 1937 2010 % Incr 1937 2010 % Incr 1937 2010 % Incr 1937 2010 % Incr 1937 2010 % IncrALABAMA 42 109 159.5% NP 123 NOS 74 89 20.3% 42 PALASKA 93 153 64.5% NSI 153 293 365 24.6% NSI NP NSI NPARIZONA 31 133 329.0% NOS 120 31 148 377.4% 31 62 100.0% NOS 15ARKANSAS 15 151 906.7% NSI 15 NOS 68 30 53 76.7% NOS NOS/PCALIFORNIA 76 175 130.3% NSI 31 61 120 96.7% NOS 67 6 44 633.3%COLORADO 7 121 1628.6% 7 128 1728.6% 7 52 642.9% NOS 96 NSI 80 NACONNECTICUT NOS 138 NP NP NSI NOS NSI 62 35 85 142.9%DELAWARE NOS 153 NOS NP NOS NP NSI 22 6 76 1166.7%FLORIDA 47 212 351.1% NP NP NSI NOS 88 139 58.0% NOS P NAGEORGIA 52 143 175.0% NP NP 101 86 -14.9% 102 51 -50.0% NOS P NAHAWAII 214 365** 70.5% NP NP NP NP NSI 53 64 22 -65.6%IDAHO LS 125 LS 125 365 173 -52.6% NP 141 LS 84 NAILLINOIS NOS 108 NP NP NSI NOS NOS 52 6 71 1083.3%INDIANA NOS 110 NP NP NP NP NOS 80 3 45 1400.0%IOWA NOS 132 NP NP NP NP NSI 123 3 75 2400.0%KANSAS NOS 143 NP 196 NP NP NSI 164 NOS 82 NAKENTUCKY NOS 136 NP 108 NP 2 NOS 162 NOS P NALOUISIANA 62 136 119.4% NOS NP 62 NOS NOS 32 NOS 101 (P) NAMAINE LS 92 NP NP 61 90 47.5% NP 61 NOS 92 NAMARYLAND 5 138 2660.0% NP NP NSI 6 47 45 -4.3% 47 71 51.1%MASSACHUSETTS 6 75 1150.0% NP NP NSI 39 NP 35 NSI 44 NAMICHIGAN 16 104 550.0% NP 27 16 47 193.8% NOS 104 17 68 300.0%MINNESOTA 11 105 854.5% NSI 18 11 47 327.3% NSI 75 9 79 777.8%MISSISSIPPI 43 138 220.9% NP NP NOS NOS 20 89 345.0% NOS P NAMISSOURI 3 123 4000.0% NP NP NSI NOS 31 136 338.7% NOS 78 NAMONTANA 32 86 168.8% 32 86 168.8% 212 149 -29.7% NOS 160 NOS 84 NANEBRASKA NOS 126 NSI 100 NSI NOS NOS 176 NOS 96 NANEVADA 30 146 386.7% NSI 153 NSI NOS NSI 43 2 30 1400.0%NEW HAMPSHIRE 15 92 513.3% NSI NP NSI 84 NSI 123 10 92 820.0%NEW JERSEY 5 161 3120.0% NP NP NSI 6 36 36 0.0% 36 99 175.0%NEW MEXICO 15 98 553.3% 15 147 880.0% 71 108 52.1% 15 40 166.7% NOS 4 NANEW YORK 32 114 256.3% NP NP 32 95 196.9% NSI 88 73 153 109.6%NORTHCAROLINA 93 148 59.1% NP 93 54 -41.9% 88 31 -64.8% NSI 74 NANORTH DAKOTA 4 122 2950.0% NSI 153 NSI NOS NSI 131 9 87 866.7%OHIO NOS 135 NP NP NSI NOS NSI 82 11 70 536.4%OKLAHOMA NSI 123 NOS 123 NSI 31 NOS 157 NOS 62 NAOREGON 36 184 411.1% 8 243 2937.5% 30 215 NOS 127 17 84 394.1%PENNSYLVANIA 13 104 700.0% NOS 12 6 8 25 43 72.0% 25 84 236.0%83
Table F1. (cont’d)Deer Elk Bear Turkey Pheasant1937 2010 % Incr 1937 2010 % Incr 1937 2010 % Incr 1937 2010 % Incr 1937 2010 % IncrRHODE ISLAND NOS 125 NSI NP NSI NOS NSI 57 61 96 57.4%SOUTHCAROLINA 140 142 1.4% NSI NP NSI 14 98 48 -51.0% NOS NP NASOUTH DAKOTA 20 143 615.0% 20 76 280.0% NSI NOS NSI 167 LS 87 NATENNESSEE 15 109 626.7% NSI 5 NSI 27 62 58 -6.5% NOS P NATEXAS 47 121 157.4% NSI NOS 47 NOS NA 47 212 NOS 149 NAUTAH 11 59 436.4% NSI 76 NSI 107 NSI 53 NOS 30 NAVERMONT 10 50 400.0% NSI NP NSI 78 NSI 69 9 98 988.9%VIRGINIA 47 204 334.0% 3 LS 47 85 80.9% 71 109 47 87 85.1%WASHINGTON 25 110 340.0% 8 LS 74 NA 25 139 456.0% NSI 89 8 115 1337.5%WEST VIRGINIA 2 88 4300.0% NSI NOS 34 80 135.3% 34 56 64.7% NSI 57 NAWISCONSIN 7 113 1514.3% NSI NOS 7 35 400.0% NOS 126 6 77 1183.3%WYOMING LS 127 NA LS 170 NSI 138 NSI 142 32 56 75.0%ALL -- Ducks, geese, brant <strong>and</strong> coots. The 1937 figure includes jacksnipe.NSI =No season identifiedNP = Not presentNOS = No Open SeasonLS: Local SeasonsZS: Zone SeasonsX / X: 2 Seasons**= Open year round on private l<strong>and</strong>; seasons on public l<strong>and</strong>s varyP= pen raised onlySH = Showshoe HarePC = Prairie Chicken84
Table F1. (cont’d)Quail Grouse Tree Squirrel Rabbit Waterfowl - ALLState 1937 2010 % Incr 1937 2010 % Incr 1937 2010 % Incr 1937 2010 % Incr 1937 2010 % IncrALABAMA 93 108 16.1% NOS NOS 93 151 62.4% NSI 151 30 111 270.0%ALASKA NSI NP 181 288 59.1% NSI 365 NSI 365 LS 144ARIZONA 32 129 303.1% NOS 66 NOS 365 ZS 365 30 119 296.7%ARKANSAS 62 98 58.1% 125 290 132.0% NSI 181 30 108 260.0%CALIFORNIA 47 142 202.1% NOS 31 NOS 142 47 213 30 145 383.3%COLORADO NOS 80 7 82 1071.4% NSI 212 NSI 212 30 160 433.3%CONNECTICUT NOS 85 35 45 28.6% 35 195 457.1% 61 165 170.5% 30 188 526.7%DELAWARE 47 76 61.7% NSI NP 48 145 202.1% 47 97 106.4% 30 152 406.7%FLORIDA 88 114 29.5% NOS NP 88 114 29.5% NSI 365 30 98 226.7%GEORGIA 102 108 5.9% NOS 137 107 198 85.0% NSI 108 30 83 176.7%HAWAII 61 22 NSI 22 NSI NP NSI NP 120 NOSIDAHO LS 136 LS 155 NSI NOS NSI 181 30 132 340.0%ILLINOIS 30 71 136.7% NOS NOS 122 205 52 78 30 127 323.3%INDIANA 41 72 75.6% NOS 92 LS 170 62 138 122.6% 30 144 380.0%IOWA 31 94 203.2% NSI 122 62 150 141.9% 213 178 -16.4% 30 120 300.0%KANSAS 11 82 645.5% NOS 105 (PC) 154 243 NSI 365 30 146 386.7%KENTUCKY 47 100 112.8% NOS 118 122 196 60.7% 47 100 112.8% 30 85 183.3%LOUISIANA 83 101 21.7% NSI NP 107 173 61.7% 152 150 -1.3% 30 90 200.0%MAINE NOS 92 46 92 100.0% 31 92 196.8% 151 182 (SH) 20.5% 30 142 373.3%MARYLAND 47 102 117.0% 47 122 159.6% 15 178 1086.7% 47 115 144.7% 30 140 366.7%MASSACHUSETTS 32 43 34.4% 32 43 34.4% 32 111 246.9% 105 136 29.5% 30 147 390.0%MICHIGAN NOS 26 29 93 220.7% NOS 168 123 198 61.0% 30 146 386.7%MINNESOTA 15 107 613.3% NOS 107 79 164 107.6% NSI 164 30 108 260.0%MISSISSIPPI 53 101 90.6% NOS NOS 123 157 27.6% 73 136 86.3% 30 100 233.3%MISSOURI 52 78 50.0% NOS NOS 183 270 47.5% NSI 138 30 121 303.3%MONTANA NOS NP 5 123 2360.0% NSI 365 NSI 365 30 105 250.0%NEBRASKA NOS 94 NOS 136 92 184 NSI 181 30 140 366.7%NEVADA 2 123 6050.0% 2 122 6000.0% NSI NSI 61 181 30 150 400.0%NEW HAMPSHIRE 31 92 61 92 31 122 293.5% 123 182 (SH) 48.0% 30 117 290.0%NEW JERSEY 36 99 175.0% 36 63 75.0% 36 141 291.7% 36 141 291.7% 30 159 430.0%NEW MEXICO 31 93 200.0% 7 61 771.4% 15 91 506.7% NSI 365 30 129 330.0%NEW YORK 61 151 75 162 116.0% 75 181 141.3% 106 171 61.3% 30 174 480.0%NORTHCAROLINA 88 101 14.8% 26 134 415.4% 107 134 88 101 14.8% 30 146 386.7%NORTH DAKOTA NOS NP 9 114 1166.7% NSI 114 NSI 365 30 115 283.3%OHIO NOS 24 NOS 115 16 153 856.3% 48 120 150.0% 30 125 316.7%85
Table F1. (cont’d)Quail Grouse Tree Squirrel Rabbit Waterfowl - ALL1937 2010 % Incr 1937 2010 1937 2010 % Incr 1937 2010 1937 2010 % Incr 1937 2010OKLAHOMA 43 95 120.9% NSI NP 231 260 NSI 166 30 146 386.7%OREGON 17 153 LS 122 36 39 8.3% NSI 365 30 159 430.0%PENNSYLVANIA 13 32 146.2% 13 72 453.8% 25 90 260.0% 25 102 308.0% 30 151 403.3%RHODE ISLAND 61 44 -27.9% 61 44 -27.9% 61 135 61 135 30 157 423.3%SOUTHCAROLINA 97 100 3.1% NOS 97 182 152 -16.5% 182 97 30 105 250.0%SOUTH DAKOTA NOS 79 NOS 107 NSI 181 NSI 181 30 161 436.7%TENNESSEE 62 108 74.2% 62 143 130.6% 215 215 0.0% 62 108 74.2% 30 134 346.7%TEXAS 47 149 217.0% NOS NOS 184 365 98.4% NSI 365 30 121 303.3%UTAH NOS 56 NOS 112 NSI Restricted NSI 171 30 142 373.3%VERMONT 77 365 374.0% 45 98 117.8% 31 122 293.5% 151 170 30 109 263.3%VIRGINIA 71 87 22.5% 71 112 57.7% 146 166 13.7% 71 122 71.8% 30 173 476.7%WASHINGTON 8 109 1262.5% 5 122 31 NOS NA 128 196 30 140 366.7%WEST VIRGINIA 15 57 280.0% 34 136 300.0% 34 115 238.2% 15 115 666.7% 26 108 315.4%WISCONSIN NSI 54 NOS 137 LS 137 LS 164 30 121 303.3%WYOMING NOS P 11 91 727.3% NSI 182 NSI 182 30 144 380.0%ALL -- Ducks, geese, brant <strong>and</strong> coots. The 1937 figure includes jacksnipe.NSI =No season identifiedNP = Not presentNOS = No Open SeasonLS: Local SeasonsZS: Zone SeasonsX / X: 2 Seasons**= Open year round on private l<strong>and</strong>; seasons on public l<strong>and</strong>s varyP= pen raised onlySH = Showshoe HarePC = Prairie Chicken86