Calculus Grapher lesson plan for math.pdf - PhET
Calculus Grapher lesson plan for math.pdf - PhET
Calculus Grapher lesson plan for math.pdf - PhET
- No tags were found...

Create successful ePaper yourself
Turn your PDF publications into a flip-book with our unique Google optimized e-Paper software.
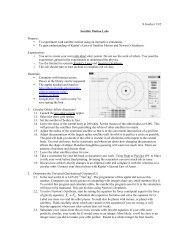
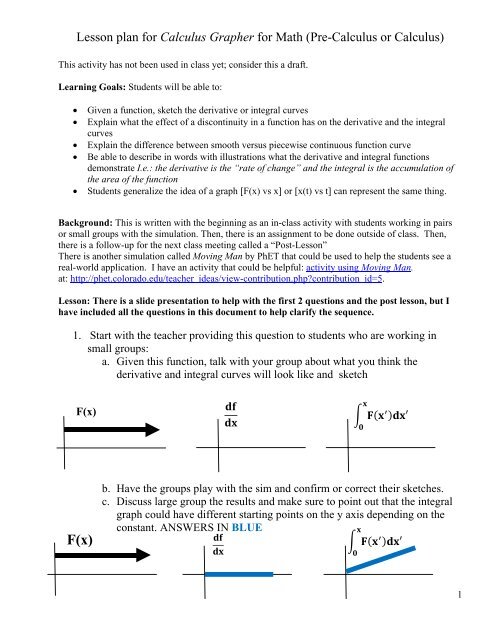
Lesson <strong>plan</strong> <strong>for</strong> <strong>Calculus</strong> <strong>Grapher</strong> <strong>for</strong> Math (Pre-<strong>Calculus</strong> or <strong>Calculus</strong>)This activity has not been used in class yet; consider this a draft.Learning Goals: Students will be able to:• Given a function, sketch the derivative or integral curves• Explain what the effect of a discontinuity in a function has on the derivative and the integralcurves• Explain the difference between smooth versus piecewise continuous function curve• Be able to describe in words with illustrations what the derivative and integral functionsdemonstrate I.e.: the derivative is the “rate of change” and the integral is the accumulation ofthe area of the function• Students generalize the idea of a graph [F(x) vs x] or [x(t) vs t] can represent the same thing.Background: This is written with the beginning as an in-class activity with students working in pairsor small groups with the simulation. Then, there is an assignment to be done outside of class. Then,there is a follow-up <strong>for</strong> the next class meeting called a “Post-Lesson”There is another simulation called Moving Man by <strong>PhET</strong> that could be used to help the students see areal-world application. I have an activity that could be helpful: activity using Moving Man.at: http://phet.colorado.edu/teacher_ideas/view-contribution.php?contribution_id=5.Lesson: There is a slide presentation to help with the first 2 questions and the post <strong>lesson</strong>, but Ihave included all the questions in this document to help clarify the sequence.1. Start with the teacher providing this question to students who are working insmall groups:a. Given this function, talk with your group about what you think thederivative and integral curves will look like and sketchF(x) F(x)b. Have the groups play with the sim and confirm or correct their sketches.c. Discuss large group the results and make sure to point out that the integralgraph could have different starting points on the y axis depending on theconstant. ANSWERS IN BLUE 1
Lesson <strong>plan</strong> <strong>for</strong> <strong>Calculus</strong> <strong>Grapher</strong> <strong>for</strong> Math (Pre-<strong>Calculus</strong> or <strong>Calculus</strong>)This activity has not been used in class yet; consider this a draft.2. Do one more example to demonstrate that 1) the graphs need to align verticallyand 2) each graph has ZOOM ability that is independent of the other graphs. Startwith the teacher providing this question to students who are working in smallgroups:a. Given this function, talk with your group about what you think thederivative and integral curves will look like and sketchF(x) b. Have the groups play with the sim and confirm or correct their sketches.c. Discuss large group the results and make sure to point outthat the integral graph could have different starting pointson the y axis depending on the constant. This is ZOOMEDon the integral graph to magnify the relevant portions.3. Then give the students independent time to practice using the Student Directionshandout. This will probably require time outside of class.Post-<strong>lesson</strong>: After the students have completed the “Student Directions”. There areslides <strong>for</strong> this part. The teacher should make sure to demonstrate how shifting andtilting effects graphs. This is best done with the simulation, but I have includedexamples of typical graphs.1. Given this derivative graph, what would the function graph look like?2
Lesson <strong>plan</strong> <strong>for</strong> <strong>Calculus</strong> <strong>Grapher</strong> <strong>for</strong> Math (Pre-<strong>Calculus</strong> or <strong>Calculus</strong>)This activity has not been used in class yet; consider this a draft.Make sure to demonstrate that this is just a straight line graph with constantslope; the line can be SHIFTED to many places. All must have same slope, soTILT will not give same derivative.2. Given this derivative graph, what would the function graph look like?Make sure to demonstrate that this is just a straight line graph with constantslope; the line can be SHIFTED to many places All must have same slope, soTILT will not give same derivative.3
Lesson <strong>plan</strong> <strong>for</strong> <strong>Calculus</strong> <strong>Grapher</strong> <strong>for</strong> Math (Pre-<strong>Calculus</strong> or <strong>Calculus</strong>)This activity has not been used in class yet; consider this a draft.3. There are concept questions included in the Power Point presentation that could be used tohelp with the goal: Students generalize the idea of a graph [F(x) vs x] or [x(t) vs t] canrepresent the same thingAnswers to STUDENT DIRECTIONS have not been included in this <strong>lesson</strong> <strong>plan</strong>.Below are some images that you may find useful if you are writing your own <strong>lesson</strong>All three graphs groupedF(x) Each graph as a grouped image:F(x) 4