Athens: Use of Key Performance Indicators (KPI) as a ... - SPUTNIC
Athens: Use of Key Performance Indicators (KPI) as a ... - SPUTNIC
Athens: Use of Key Performance Indicators (KPI) as a ... - SPUTNIC
- No tags were found...

You also want an ePaper? Increase the reach of your titles
YUMPU automatically turns print PDFs into web optimized ePapers that Google loves.
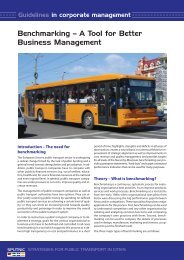
MARKETORGANISATIONCORPORATEMANAGEMENTCUSTOMERRELATIONSEQUIPMENTANDOPERATIONSATHENS S.A.ATHENS, GREECE<strong>Use</strong> <strong>of</strong> <strong>Key</strong> <strong>Performance</strong> <strong>Indicators</strong> (<strong>KPI</strong>)<strong>as</strong> a Management ToolBackground/contextThe Public Transport Company <strong>of</strong> <strong>Athens</strong>, a subsidiary <strong>of</strong>Attiko Metro S.A., is a public service corporation supervisedby the Minister <strong>of</strong> Transport and Communication. It operatesaccording to the rules <strong>of</strong> the private economy.The company focuses on the design, development, operationand exploitation <strong>of</strong> contemporary networks <strong>of</strong> urbantramway or any other network <strong>of</strong> fixed-track transportation,along with the necessary facilities and vehicles.C<strong>as</strong>e DescriptionThe c<strong>as</strong>e illustrates the use <strong>of</strong> key performance indicators(<strong>KPI</strong>s) <strong>as</strong> a management tool in helping to stay focused oncompany goals and quantify results and thus better manageand operate systems and reduce costs.There are two main types <strong>of</strong> indicators:• those requiring qualitative data; and• those requiring quantitative data.Overall, the <strong>KPI</strong>s used by Tram SA can be cl<strong>as</strong>sified in fourmain categories:1. RELIABILITYP<strong>as</strong>senger kilometres: Total annual number <strong>of</strong> p<strong>as</strong>sengerkilometresStarting reliability: Percentage <strong>of</strong> planned departures <strong>of</strong>service journeys that are unreliable, i.e. early, delayed orabandoned at the origin <strong>of</strong> the serviceExample: Percentage <strong>of</strong> service journey departures that areat le<strong>as</strong>t two minutes earlyTiming point reliability: Percentage <strong>of</strong> planned servicejourneys that are early, delayed or abandoned at selectedtiming points (stops/stations)Example: Percentage <strong>of</strong> service journeys departures thatare at le<strong>as</strong>t two minutes early at timing pointsAbandoned service journeys: Percentage <strong>of</strong> planned servicejourneys that are not carried out, categorised by thecause <strong>of</strong> abandonmentThe service is cl<strong>as</strong>sed <strong>as</strong> abandoned if the vehicle or a replacementvehicle does not reach the service destinationor if a vehicle does not leave the point <strong>of</strong> origin.Example: Percentage <strong>of</strong> service journeys abandoned becauseno is staff availableDelayed service journeys: Percentage <strong>of</strong> planned servicejourneys that are delayed at the origin and/or destination<strong>of</strong> the service, categorised by the cause <strong>of</strong> delay.The service is cl<strong>as</strong>sed <strong>as</strong> delayed if (i) it departs more thanfive minutes late from its origin or (ii) it arrives more thanfive minutes late at its destination.Example: Percentage <strong>of</strong> service journeys delayed becauseno staff availablePUBLIC TRANSPORT CASE STUDYStrategies for Public Transport in CitiesSputnic is a projectsupported by theEuropean Union
PUBLIC TRANSPORT CASE STUDY2. TECHNICAL PERFORMANCEFleet reliability: Average number <strong>of</strong> breakdowns that makethe vehicle unroadworthy and lead to a delay in the serviceper million vehicle kilometresThe delay could take place at the origin <strong>of</strong> the service orafter leaving the origin.Example: average number <strong>of</strong> breakdowns per million vehiclekilometres3. SAFETY & SECURITYIncidents: Number <strong>of</strong> incidents per million vehicle kilometres.This indicator is concerned with incidents that causedamage to vehicles.4. COSTUMER SATISFACTIONP<strong>as</strong>senger feedback ratio: Number <strong>of</strong> recorded positiveand negative comments by p<strong>as</strong>sengers per 1,000,000 vehiclekilometres.Cost and FinancingThere is no need for any major investment for setting upsuch a monitoring mechanism.ResultsThe use <strong>of</strong> performance indicators h<strong>as</strong> provided the opportunityfor following, monitoring and improving the operations<strong>of</strong> the company and h<strong>as</strong> also acted <strong>as</strong> a diagnostictool in improving functions within the organisation.ProblemsGood quality data is important <strong>as</strong> it enables companies toderive the greatest benefit.Good quality data means that it is fit for the purpose forwhich it is required. It should not contain an inherent bi<strong>as</strong> inthe me<strong>as</strong>urements. Whether using a complete record or <strong>as</strong>ample, it is very e<strong>as</strong>y for bi<strong>as</strong> to affect results. For example:• Although some indicators are not affected by se<strong>as</strong>on,others will be affected by time <strong>of</strong> year in which theme<strong>as</strong>urement is carried out.• Misinterpreting the definition <strong>of</strong> an indicator maymean that results are not comparable. Sometimes thishappens by accident, but at other times, it results froman intentional effort to embellish the record, e.g. theunder-reporting <strong>of</strong> minor accidents.Me<strong>as</strong>urements should be taken with sufficient precision.Transferability and success factorsThe approach is to be used by operators <strong>of</strong> the most frequentlyused modes <strong>of</strong> land-b<strong>as</strong>ed public transport. This includesbus, trolley bus, tram, metro/light rail and local heavyrail operators. The approach is suitable for different types <strong>of</strong>operators, e.g. small, medium-sized, large, urban, rural andinter-urban. It is transferable to other cities. Each city canset up its own key performance indicators b<strong>as</strong>ed on its priorities,operating environment and other conditions.Lessons learntBy introducing <strong>KPI</strong>s the management <strong>of</strong> the company w<strong>as</strong>able to better follow the operation <strong>of</strong> the company and toreport it to the City Council with which it h<strong>as</strong> a contractualarrangement.References and contactsContact: Mr. Haris KanakisE-mail: hkanakis@tramsa.grTel: +30-210-997-8019Company: TRAM S.A.Address: Aeropori<strong>as</strong> Street; 167 77 Elliniko, GreeceWeb: www.tramsa.gr<strong>SPUTNIC</strong> (Strategies for Public Transport in Cities) is a project funded by the European Commission under the 6th Framework Programme.<strong>SPUTNIC</strong> is dedicated to challenges faced by local and regional public transport systems in transition. These challenges include the emergence<strong>of</strong> a competitive environment, changing institutional frameworks and incre<strong>as</strong>ingly scarce financial resources. <strong>SPUTNIC</strong> seeks to help makepublic transport systems more attractive and efficient by providing: support to stakeholders to anticipate and prepare for emergingchallenges; an overview <strong>of</strong> state-<strong>of</strong>-the-art knowledge and research; and specific guidelines and practical tools.