Hale Sector Boundaries.pdf - Leif and Vera Svalgaard's
Hale Sector Boundaries.pdf - Leif and Vera Svalgaard's
Hale Sector Boundaries.pdf - Leif and Vera Svalgaard's
- No tags were found...

Create successful ePaper yourself
Turn your PDF publications into a flip-book with our unique Google optimized e-Paper software.
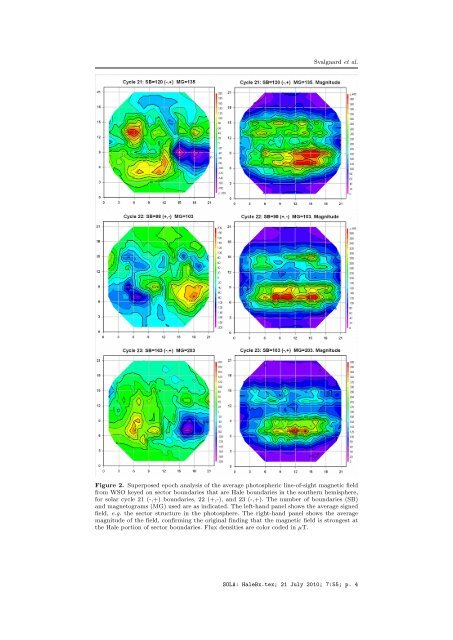
Svalgaard et al.Figure 2. Superposed epoch analysis of the average photospheric line-of-sight magnetic fieldfrom WSO keyed on sector boundaries that are <strong>Hale</strong> boundaries in the southern hemisphere,for solar cycle 21 (-,+) boundaries, 22 (+,-), <strong>and</strong> 23 (-,+). The number of boundaries (SB)<strong>and</strong> magnetograms (MG) used are as indicated. The left-h<strong>and</strong> panel shows the average signedfield, e.g. the sector structure in the photosphere. The right-h<strong>and</strong> panel shows the averagemagnitude of the field, confirming the original finding that the magnetic field is strongest atthe <strong>Hale</strong> portion of sector boundaries. Flux densities are color coded in µT.SOLA: <strong>Hale</strong>Bx.tex; 21 July 2010; 7:55; p. 4
![When the Heliospheric Current Sheet [Figure 1] - Leif and Vera ...](https://img.yumpu.com/51383897/1/190x245/when-the-heliospheric-current-sheet-figure-1-leif-and-vera-.jpg?quality=85)

![The sum of two COSine waves is equal to [twice] the product of two ...](https://img.yumpu.com/32653111/1/190x245/the-sum-of-two-cosine-waves-is-equal-to-twice-the-product-of-two-.jpg?quality=85)