Hale Sector Boundaries.pdf - Leif and Vera Svalgaard's
Hale Sector Boundaries.pdf - Leif and Vera Svalgaard's
Hale Sector Boundaries.pdf - Leif and Vera Svalgaard's
- No tags were found...

Create successful ePaper yourself
Turn your PDF publications into a flip-book with our unique Google optimized e-Paper software.
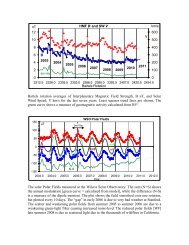
<strong>Hale</strong> <strong>Sector</strong> <strong>Boundaries</strong>high-latitude geomagnetic signature (Svalgaard, 1973; Wilcox et al., 1975). Byconvention, a well-defined sector boundary has four days of same polarity oneither side of the boundary. Nominally, the sector boundary is assigned to thebeginning of the UT day. Since WSO observes late in the UT day (noon is at20:09 UT), the nominal transit time of 4½ day must be taken to almost a daylater to translate the time at Earth back to the time of central meridian passageof the sector boundary on the Sun. The Rosenberg-Coleman effect (Echer <strong>and</strong>Svalgaard, 2004) introduces a slight systematic extraneous, annual smearing ofthe sector boundary key times during the ascending phase of the solar cycle. Wehave not tried to correct for that, wishing to stay as close as possible to the rawdata.2.3. Superposed Epoch ProcedureFor each well-defined sector boundary we check to see if there are magnetograms5 days earlier. If so, all magnetograms on that day are selected. If no magnetogramswere available, we try the day before or the day thereafter. If anymagnetograms were selected they are stacked <strong>and</strong> an average magnetogram forall well-defined sector boundaries is computed. We perform the analysis separatelyfor each type of polarity change boundary: (-,+) if the polarity when thesector boundary sweeps past the Earth changes from - (toward the Sun) to +(away from the Sun), <strong>and</strong> (+,-) for the opposite change.With the typical variation of WSO field values <strong>and</strong> the number of sectorboundaries, the statistical error of the averages is about 20µT or one contour line<strong>and</strong> color step. The zero-level of the WSO magnetograms is carefully controlledby observing the magnetic signal on a non-magnetic (g = 0) line before <strong>and</strong> afterthe magnetogram <strong>and</strong> subtracting the so determined, spurious systematic error(usually less that 10µT).Since the <strong>Hale</strong> polarity changes between cycles, we perform the analysisseparately for each cycle. Figure 2 shows the average field [strictly speaking:magnetogram] at boundaries that are <strong>Hale</strong> boundaries in the southern hemisphere<strong>and</strong> Figure 3 shows the situation for <strong>Hale</strong> boundaries in the northernhemisphere. Cycle 24 [not shown] does not yet have enough boundaries to allowa statistically significant result, although the same tendency as in cycle 22 isseen, as expected.SOLA: <strong>Hale</strong>Bx.tex; 21 July 2010; 7:55; p. 3
![When the Heliospheric Current Sheet [Figure 1] - Leif and Vera ...](https://img.yumpu.com/51383897/1/190x245/when-the-heliospheric-current-sheet-figure-1-leif-and-vera-.jpg?quality=85)


![The sum of two COSine waves is equal to [twice] the product of two ...](https://img.yumpu.com/32653111/1/190x245/the-sum-of-two-cosine-waves-is-equal-to-twice-the-product-of-two-.jpg?quality=85)