Charge Transfer Luminescence of Yb3+
Charge Transfer Luminescence of Yb3+
Charge Transfer Luminescence of Yb3+
- No tags were found...

You also want an ePaper? Increase the reach of your titles
YUMPU automatically turns print PDFs into web optimized ePapers that Google loves.
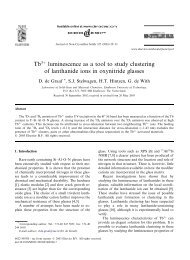
L. van Pieterson et al. / Journal <strong>of</strong> <strong>Luminescence</strong> 91 (2000) 177–193 181emission is in most cases observed in a spectralregion where the SPEX/ccd sensitivity curve isrelatively flat. Emission due to the transitionbetween the two 4f states can be observed assharp peaks in the infrared at 979 nm.In the excitation spectrum <strong>of</strong> the Yb 3+ emissionat 270 nm, the host lattice absorption edge isobserved at 168 nm. At 195 nm the 2 F 7/2 ! CTexcitation band is observed. The position <strong>of</strong> thisexcitation band is in good agreement with thecharge transfer absorption band in the reflectionspectrum.At low temperature, a decay time <strong>of</strong> 163 25 nshas been measured for the charge transfer luminescence,similar to the decay times measured forYb 3+ charge transfer luminescence in LuPO 4 andYPO 4 [3,4]. To study the temperature quenching<strong>of</strong> the charge transfer luminescence, temperaturedependentlifetime measurements and intensitymeasurements were performed. In Fig. 4, theintensity <strong>of</strong> the 270 nm emission band and thedecay time <strong>of</strong> this emission are given as a function<strong>of</strong> temperature. There is a good agreementbetween the decrease in intensity and decay time.If we define the quenching temperature as thetemperature at which the luminescence intensity orthe decay time have decreased to half <strong>of</strong> its initialvalue, the quenching temperature <strong>of</strong> the Yb 3+charge transfer luminescence is estimated to beabout 225 K.Also for Yb 3+ in other orthophosphates luminescence,reflection and lifetime measurementswere performed and compared with the luminescence<strong>of</strong> the undoped host lattices. In Table 1, theFig. 3. Emission and excitation spectra <strong>of</strong> the ScPO 4 hostlattice (a, b) and <strong>of</strong> ScPO 4 doped with 1% Yb 3+ (c, d) measuredat 10 K. The emission spectra for the ScPO 4 host lattice andYb 3+ -doped sample were both recorded for excitation at140 nm, for the excitation spectrum <strong>of</strong> the host lattice the emissionwavelength was at 210 nm, for the Yb 3+ -doped sample itwas at 270 nm. In the emission spectra the broken linerepresents measurements performed with a SEYA monochromator,the solid line represents measurements performed with aSPEX monochromator equipped with a Tektronics ccd-array.Fig. 4. Decay time (*), on the left axis, and luminescenceintensity (&), on the right axis, <strong>of</strong> the charge transferluminescence at 270 nm as a function <strong>of</strong> temperature forScPO 4 :Yb 3+ (l exc =140 nm).