Charge Transfer Luminescence of Yb3+
Charge Transfer Luminescence of Yb3+
Charge Transfer Luminescence of Yb3+
- No tags were found...

Create successful ePaper yourself
Turn your PDF publications into a flip-book with our unique Google optimized e-Paper software.
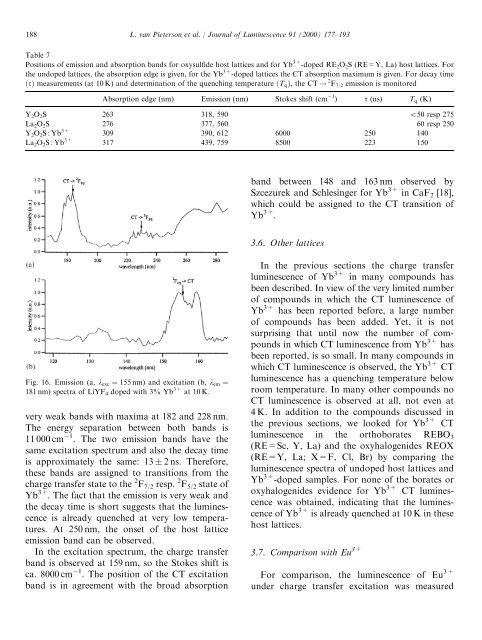
188L. van Pieterson et al. / Journal <strong>of</strong> <strong>Luminescence</strong> 91 (2000) 177–193Table 7Positions <strong>of</strong> emission and absorption bands for oxysulfide host lattices and for Yb 3+ -doped RE 2 O 2 S (RE=Y, La) host lattices. Forthe undoped lattices, the absorption edge is given, for the Yb 3+ -doped lattices the CT absorption maximum is given. For decay timeðtÞ measurements (at 10 K) and determination <strong>of</strong> the quenching temperature ðT q Þ, the CT ! 2 F 7/2 emission is monitoredAbsorption edge (nm) Emission (nm) Stokes shift (cm 1 ) t (ns) T q (K)Y 2 O 2 S 263 318, 590 550 resp 275La 2 O 2 S 276 377, 560 60 resp 250Y 2 O 2 S:Yb 3+ 309 390, 612 6000 250 140La 2 O 2 S:Yb 3+ 317 439, 759 8500 223 150band between 148 and 163 nm observed bySzcezurek and Schlesinger for Yb 3+ in CaF 2 [18],which could be assigned to the CT transition <strong>of</strong>Yb 3+ .3.6. Other latticesFig. 16. Emission (a, l exc ¼ 155 nm) and excitation (b, l em ¼181 nm) spectra <strong>of</strong> LiYF 4 doped with 3% Yb 3+ at 10 K.very weak bands with maxima at 182 and 228 nm.The energy separation between both bands is11 000 cm 1 . The two emission bands have thesame excitation spectrum and also the decay timeis approximately the same: 13 2 ns. Therefore,these bands are assigned to transitions from thecharge transfer state to the 2 F 7/2 resp. 2 F 5/2 state <strong>of</strong>Yb 3+ . The fact that the emission is very weak andthe decay time is short suggests that the luminescenceis already quenched at very low temperatures.At 250 nm, the onset <strong>of</strong> the host latticeemission band can be observed.In the excitation spectrum, the charge transferband is observed at 159 nm, so the Stokes shift isca. 8000 cm 1 . The position <strong>of</strong> the CT excitationband is in agreement with the broad absorptionIn the previous sections the charge transferluminescence <strong>of</strong> Yb 3+ in many compounds hasbeen described. In view <strong>of</strong> the very limited number<strong>of</strong> compounds in which the CT luminescence <strong>of</strong>Yb 3+ has been reported before, a large number<strong>of</strong> compounds has been added. Yet, it is notsurprising that until now the number <strong>of</strong> compoundsin which CT luminescence from Yb 3+ hasbeen reported, is so small. In many compounds inwhich CT luminescence is observed, the Yb 3+ CTluminescence has a quenching temperature belowroom temperature. In many other compounds noCT luminescence is observed at all, not even at4 K. In addition to the compounds discussed inthe previous sections, we looked for Yb 3+ CTluminescence in the orthoborates REBO 3(RE=Sc, Y, La) and the oxyhalogenides REOX(RE=Y, La; X=F, Cl, Br) by comparing theluminescence spectra <strong>of</strong> undoped host lattices andYb 3+ -doped samples. For none <strong>of</strong> the borates oroxyhalogenides evidence for Yb 3+ CT luminescencewas obtained, indicating that the luminescence<strong>of</strong> Yb 3+ is already quenched at 10 K in thesehost lattices.3.7. Comparison with Eu 3+For comparison, the luminescence <strong>of</strong> Eu 3+under charge transfer excitation was measured