Paper - Statistics Singapore
Paper - Statistics Singapore
Paper - Statistics Singapore
- No tags were found...

Create successful ePaper yourself
Turn your PDF publications into a flip-book with our unique Google optimized e-Paper software.
information paperonComplete Life TableComplete Life Tables 2003-2006for <strong>Singapore</strong> Resident Population<strong>Singapore</strong> Department of <strong>Statistics</strong>February 2008<strong>Paper</strong>s in this Information <strong>Paper</strong> Series are intended to inform and clarify conceptual and methodologicalchanges and improvements in official statistics. The views expressed are based on the latestmethodological developments in the international statistical community. Statistical estimates presented inthe papers are based on new or revised official statistics compiled from the best available data.Comments and suggestions are welcome.© <strong>Singapore</strong> Department of <strong>Statistics</strong>. All rights reserved.
Please direct enquiries on this information paper to:Population <strong>Statistics</strong> Section<strong>Singapore</strong> Department of <strong>Statistics</strong>Tel : 6332 7716Email : goh_jingni@singstat.gov.sgApplication for the copyright owner’s written permission toreproduce any part of this publication should be addressed tothe Chief Statistician and emailed to the above address.
Complete Life Tables 2003-2006 for <strong>Singapore</strong>’s Resident PopulationIIntroduction1. Current life tables depict the mortality experience of a given population,based on the assumption that this group is subject to the age-specific mortalityrates of the reference period throughout their lives. Life expectancy of persons atvarious ages are derived from life tables, and shows the average number of yearsthat persons (at birth or at a specific age such as age 65 years) might expect to liveif they experience these mortality rates. The derived life expectancies give anindication of the average longevity of the population, but do not necessarily reflectthe longevity of an individual.2. Life tables can be classified into either complete life tables or abridged lifetables according to the length of the age interval in which the data are compiledand presented. A complete life table contains data for every single year of age. Anabridged life table contains data at 5-year or 10-year age intervals. Abridged lifetables are more commonly produced than complete life tables, and are sufficientfor most purposes when the degree of detail needed is not so great.3. The <strong>Singapore</strong> Department of <strong>Statistics</strong> (DOS) has been compiling annualabridged life tables that provide data at 5-year age intervals and up to age 85 yearsand over. With the growing proportion of elderly persons in <strong>Singapore</strong>, and thegreater demand for data at specific ages, there is increasing need for complete lifetables covering single years of age up to age 100 years and over.4. DOS has concluded its review of methodology for constructing completelife table and has compiled the complete life tables for <strong>Singapore</strong> for the years2003-2006. This will be an improvement over the abridged life tables as data forsingle years of age will be available instead of the current 5-year age groupingsand for older ages beyond the current age cut-off of 85 years.5. DOS's release of complete life tables is consistent with the practices inother countries which issue new/revised life tables based on more refined methodsof constructing life tables. For example, the US National Center for Health<strong>Statistics</strong> started to compile complete life tables annually and changed fromclosing age 85 years and over to 100 years and over since Dec 1999 1 , prior towhich abridged life tables were produced annually with lower age cut-off at 85years and over. The Australia Bureau of <strong>Statistics</strong> revised its life table1 National Center for Health <strong>Statistics</strong>. Vital Health and <strong>Statistics</strong> 2(129). 1999, Method for ConstructingComplete Annual U.S. Life Tables. http://www.cdc.gov/nchs/data/series/sr_02/sr02_129.pdf1
methodology in Feb 1997 2 using three years’ population and deaths to reduce theimpact of year-to-year statistical variations. The new methodology also usesactuarially graduated 3 data and excludes Australian residents temporarily overseas.6. This paper provides the methodology for constructing complete life tablesfor the <strong>Singapore</strong> resident population. It also presents key trends in lifeexpectancies based on the complete life tables for 2003-2006.IIEstimation of Central Death Rates7. The complete life table is derived from the probability of death ( q x), whichis computed from the central death rates ( m x) for each single year of age x. Thecentral death rates of the reference year require annual deaths data and the stockpopulation in <strong>Singapore</strong> as at the mid-point of the reference year.8. The annual deaths data refer to deaths occurring in <strong>Singapore</strong> among<strong>Singapore</strong> residents. The population data refer to <strong>Singapore</strong> residents (citizens andPermanent Residents) with usual residence in <strong>Singapore</strong>.Derivation and Graduation of Central Death Rates9. Given <strong>Singapore</strong>’s small population size, the number of deaths is sparselydistributed by single years of age. As a result, the central death rates at single yearof age derived directly from the raw data have significant random fluctuations.10. In order to reduce the impact of random fluctuations, the central death ratesfor age 0 4 , age group 1-4 years and quinquennial age groups 5-9 years, 10-14 years,etc are first derived by dividing the 3-year average number of deaths 5 among<strong>Singapore</strong> residents by the estimated <strong>Singapore</strong> resident population in the agegroup 6 .2 Australian Bureau of <strong>Statistics</strong>, 3302.0 - Deaths, Australia, 1995.3 Graduated on the same principles which were used for the quinquennial Australian life tables prepared bythe Australian Government Actuary.4 Refers to infants below one year old.5 The approach of using deaths averaged over three years is also adopted by Australia Bureau of <strong>Statistics</strong>(ABS) and <strong>Statistics</strong> New Zealand (SNZ), so as to minimise the impact of year to year random fluctuationsnot reflective of the underlying causes or long term movements.6 For reference year t where the deaths data for year t+1 are not yet available, preliminary death rates arederived based on the average number of deaths in year t and year t-1.2
11. Central death rates at single year of age x are then derived using linearinterpolation. For the purpose of linear interpolation, m n xis treated as the singleyear central death rate at the mid-point of its corresponding age group. That is, m7is set as m 5 5, m as m 12 5 10, and so on7 . Mortality rate at age 1 ( m 1) is taken to bem 4 1without any interpolation to avoid unnecessary distortion due to thedomination of m0. The remaining values of the single year central death rates arethen derived using linear interpolation method.12. To ensure that there is a smooth progression of mortality rates with age, thederived for each single year of age x was graduated using the Whittaker-m xHenderson method of graduation. Graduated death ratesminimise the following equation:gm xare chosen toJ = F + hS ≡n∑x=0( mgx− m )x2+ hn-3∑x=03( ∆ mgx)2wherem xgm xis the initial estimate of death rate at age xis the graduated value of the death rate at age xh is a non-negative parameter∆ is a forward difference operator13. In the equation, F is a measure of fitness and S is a measure of smoothness.The relative importance of smoothness and fit is determined by the value of h. Alarge value will optimise smoothness while a small value will optimise fit. Tobalance goodness of fit and smoothness, h is chosen to be 0.5 8 . Small changes in hhave a negligible effect on the overall result.14. The death rate at age 0, m 0, is significantly larger than the death rates atages 1 to 4. To ensure that the graduated death rates reflect the underlying deathm1rates at ages 1 to 4, a pseudo m 0(computed as m1× ) replaces the original m 0m2during the graduation process9 .7refers to the death rate among persons aged x to x+n-1, where x is the lower limit of the age groupn m xand n refers to the duration in years after age x. In instances where n=1, the left subscript n is omittedaccording to usual conventions.8 This is used in the paper “Estimation of Complete Period Life Tables for <strong>Singapore</strong>ans” published in theJournal of Actuarial Practice Vol 11, 2004.9 This approach is adopted by the Hong Kong <strong>Statistics</strong> and Census Department.3
Estimation of Mortality Rates in High Ages15. As mortality rates at the oldest ages have very high random fluctuations dueto the small population at risk and small numbers of deaths, model-based mortalityrates are usually substituted for rates based on raw data at the oldest ages. Thisapproach is practiced by Hong Kong, New Zealand, Canada, and the USA.16. The Coale-Kisker method is used to estimate <strong>Singapore</strong>’s death rates atsingle year of age for ages 85 – 99 years 10 . The Coale-Kisker method assumes adecline in the rate of increase in mortality in high ages, that is, for age x ≥ 85,mx= mx− 1× exp( kx) where kx= kx −1− R and R is a constant. Details on the derivationof R are shown in Annex 1.17. The graduated death rates at single year of age 0 to 99 years are then usedto construct the complete life table.IIIConstruction of the Complete Life Table18. The life table functions are computed according to conventionalmethodology.Probability of Dying19. For each single year of age x, the probability that a person at age x will diebefore reaching age x+1 (i.e. q x) is computed from the central death rates usingthe formulas below:At age x =0,q0m0=1+(1 − f ) m00wheref 0is the separation factor derived from historical data.At ages 1 to 99,qxmx=1+ 0.5mxFor the open-ended age group 100 years and over,will die in this open-ended age group.q = 1∞ 100as all persons10 The Coale-Kisker method is adopted by <strong>Statistics</strong> Canada, Hong Kong <strong>Statistics</strong> and Census Departmentand the United Nations to estimate mortality rates at old ages for constructing complete life tables.4
Number of Survivors at Age x20. The number of persons living at age 0, l 0, is set at 100,000. For agesgreater than 0, the number of persons expected to be living at each age x is derivedusing the proportions dying in each age interval based on the formulal l − ( l q ) 1.x=x− 1 x−1×x−Number of Deaths between ages x and x+121. The number of persons expected to die between age x and x+1 is obtainedby applying the probability of dying at age x to the number of survivors at thebeginning of that age, that is, d = l × q .Number of Person-years Lived between ages x and x+1xxx22. L xis the number of person-years lived within the age interval x to x+1 bysurvivors at age x. For x ≥ 1, mortality is assumed to be evenly distributed withinthe age interval, and therefore L = xl + 0. x+ 15dxfor x ≥ 1.23. At age x = 0, deaths tend to be concentrated in the first few months of life.The formula for L0is therefore modified using the separation factor f0andcomputed as L = l + f .0 1 0d024. For the open-ended age group 100 years and over, L ∞ 100is calculated bysurviving the life table cohort from age 100 until the age at which L xis essentiallyzero. The corresponding values for ages 100 years and over are then summed togive .∞ L 100Total number of Person-Years Lived after Age x25. The total number of person-years expected to be lived by survivors at age x100∑ +=is obtained by using the formula T xL x.Life Expectancyx26. Life expectancy is the average number of years which a person living at agex is expected to live. It is derived by dividing the number of person-years expectedTxto be lived at age x by the number of survivors at age x, that is, ex= .lx5
IVHighlights of Results27. This section presents key trends in life expectancies a nd the proportionexpected to be alive at selected ages for the <strong>Singapore</strong> resident population basedon the complete life table. Data for 2006 are preliminary.Life Expectancy28. Life expectancy at birth is an estimate of the average number of years anew born baby might expect to live, if he or she were to experience the ageratesof the reference period throughout his or her life. Lifespecific mortalityexpectancy at age 65 years 11 is an estimate of the average number of additionalyears a person who has reached the age of 65 years might expect to live, if he orshe were to experience the age-specific mortality rates of the reference period forthe remainder of his or her life.29. In 2006, a new-born <strong>Singapore</strong> resident could expect to live to 80 years, upfrom 79 years in 2003 (Table 1). Females could expect to live longer than males.A boy born in 2006 could expect to live an average of 78 years while a girl couldexpect to live an average of 83 years.30. Life expectancy at age 65 years has also improved. In 2006, the average 65-year old male and female can expect to live an average of 17 and 21 more yearsrespectively compared with 16 and 20 more years respectively in 2003.Table 1 Life Expectancy of <strong>Singapore</strong>’s Resident PopulationYearsAt BirthAt Age 65 yearsTotal Males Females Total Males Females2003 79.1 76.6 81.6 18.0 16.2 19.62004 79.6 77.1 82.0 18.4 16.5 20.02005 80.1 77.6 82.5 18.7 16.9 20.4P2006 80.4 78.0 82.8 19.0 17.2 20.6Proportion Expected t o be Living at Selected Ages31. Based on the age-specific mortality rates of the reference period, theproportion of persons at age x expected to be living at age x+t is computed as thenumber of persons expected to be living at age x+t divided by the number of11 For statistical purpose, the elderly population in <strong>Singapore</strong> is defined as those aged 65 years and over.6
lpersons expected to be living at age x, that islxproportion expected to be living at age x+t declines with increasing t.x+ t. For a given age x, the32. In 2006, 89 per cent of new-born babies could expect to be living at age 65years (Chart 1). The proportion of new-born babies alive at older ages decreaseswith increasing age, with a faster decline for males than for females. About 33 percent of newborn boys could expect to be living at age 85 years compared with 50per cent of newborn girls.Chart 1 Proportion of New Born Babies Expected to be Alive at Selected Ages, 2006Per Cent8991Total Male Female86797366423350106.21465 75 85 95Age (years)33. Among persons who were alive at age 65 years in 2006, 39 per cent ofmales and 55 per cent of females could expect to be living at age 85 years (Chart2).Chart 2 Proportion of Residents Aged 65 years Expected to be Alive at Selected Ages, 2006Per Cent827786Total Male Female473955127.21575 85 95Age (years)7
VInternational ComparisonLife Expectancy34. <strong>Singapore</strong>’s life expectancy compares favourably with those in selecteddeveloped countries/areas. While <strong>Singapore</strong>’s life expectancies are lower thanSweden’s, Australia’s, Hong Kong’s and Japan’s, they are generally higher thanthe life expectancies in South Korea and United Kingdom (Charts 3 and 4).YearsMalesChart 3 Life Expectancy at BirthFemalesHong KongJapanAustraliaSweden<strong>Singapore</strong>United KingdomUSASouth KoreaTaiwan79.479.078.778.778.076.975.275.174.9JapanHong KongAustraliaSweden<strong>Singapore</strong>South KoreaTaiwanUnited KingdomUSA85.885.583.582.982.881.981.481.380.4Chart 4 Life Expectancy at Age 65 yearsYearsMalesFemalesJapan18.5Japan23.4Australia18.3Hong Kong22.9Hong Kong18.2Australia21.5Sweden17.6Sweden20.8Taiwan17.3<strong>Singapore</strong>20.6<strong>Singapore</strong>17.2Taiwan20.2USA17.2USA20.0United Kingdom16.9South Korea19.9South Korea15.8United Kingdom19.7Note: (1) Data are reported by countries and refer to the latest data available for the country (Annex 2).(2) Figure for <strong>Singapore</strong> refer to 2006 and is preliminary.8
Proportion Expected to be Alive at Selected Ages35. The proportion of <strong>Singapore</strong> residents expected to be living at age 85 yearsis also comparable with selected developed countries/areas (Charts 5 and 6).Per CentJapanAustraliaHong KongSweden<strong>Singapore</strong>United KingdomUSATaiwanSouth KoreaChart 5 Proportion of New Born Babies Expected to be Alive at Age 85MalesFemales39Japan6438Hong Kong6038Australia5636Sweden5333<strong>Singapore</strong>5031South Korea4731Taiwan4730UnitedKingdom4626USA45Chart 6 Proportion of Persons Aged 65 years Expected to be Alive at Age 85Per CentMalesFemalesJapan45Japan69Australia44Hong Kong64Hong Kong44Australia60Sweden41Sweden58Taiwan39<strong>Singapore</strong>55<strong>Singapore</strong>39Taiwan53USA39USA52United Kingdom37United Kingdom52South Korea32South Korea51Note: (1) Data are reported by countries and refer to the latest data available for the country (Annex 2).(2) Figure for <strong>Singapore</strong> refer to 2006 and is preliminary.SINGAPORE DEPARTMENT OF STATISTICSFEBRUARY 20089
ReferencesAnderson, R. (1999). Method for Constructing Complete Annual U.S. Life Tables.Vital and Health <strong>Statistics</strong>. 2(129). National Center for Health <strong>Statistics</strong>.Australia Bureau of <strong>Statistics</strong> (1997). Deaths, Australia, 1995. Australia Bureauof <strong>Statistics</strong>, Canberra.Australian Government Actuary (1999). Australian Life Tables 1995-97.Australian Government Actuary, Canberra.Benjamin B and Pollard J H. (1980). The Analysis of Mortality and OtherActuarial <strong>Statistics</strong>. William Heinemann Ltd: London.Census and <strong>Statistics</strong> Department (2007). Hong Kong Life Tables 2001-2036.Demographic <strong>Statistics</strong> Section, Census and <strong>Statistics</strong> Department, Hong Kong.Chan, W.S. and Li, S.H. (2004). Estimation of Complete Period Life Tables for<strong>Singapore</strong>ans. Journal of Actuarial Practice. Vol. 11: 127-146.Coale, A. and Kisker, E. (1990). Defects in Data on Old-age Mortality in theUnited States: New Procedures for Calculating Mortality Schedules and LifeTables at the Highest Ages. Asian and Pacific Population Forum. 4(1):1-31.Lowrie, W.B (1993). Multidimensional Whittaker-Henderson Graduations withConstraints and Mixed Differences. Transactions of the Society of Actuaries: 215–256.Mathers CD, Vos T, Lopez AD, Salomon J, Ezzati M (ed.) (2001). NationalBurden of Disease Studies: A Practical Guide. Edition 2.0. Global Program onEvidence for Health Policy. Geneva: World Health Organization.Shryock HS, Siegel JS, et al. (1971). The Methods and Materials of Demography,vol. 2. U.S. Census Bureau. Washington: U.S. Government Printing Office.<strong>Statistics</strong> Canada (2006). Life Tables, Canada, Provinces and Territories.<strong>Statistics</strong> Canada Health <strong>Statistics</strong> Division, Ottawa, Ontario.<strong>Statistics</strong> New Zealand (2004). New Zealand Life Tables, 2000-2002. <strong>Statistics</strong>New Zealand, Wellington, New Zealand.Thomas Buettner and Hania Zlotnik (2005). Prospects for Increasing Longevity asAssessed by the United Nations. Genus. LXI (No.1).10
Estimating Mortality Rates at High Ages (Coale-Kisker method)Annex 1The Coale-Kisker method assumes a decline in the rate of increase in mortality inhigh ages, that is, m m × exp( k ) .x=x−1 xFor age x >= 85 years, definekx= kx−1− Rwherekxm= lnmxx−1Extending the formula up to age 110 yieldsk = k84= k…= k85−k86 84−k110 84−Summing the above 26 formulae, we havek84R2R26R85+ ... + k110= 26k − R(1 + ... + 26)The left hand side of the equation simplifies to ln( m110 ) − ln(m84). Solving for R,we obtain:26k84+ ln(m84) − ln(m110)R = ……… (1)351*To minimize the effects of random fluctuations, is replaced by , which isk 84k 84k*84==k82+ k83+ k845k + k83+ 3k845+ k82−853R+ k861-1
*Similarly, ln( m84 ) is replaced by ln(m ) , which is defined as84* *ln(m84) = k84+ ln(m*83* m82+ m83+ m84where ln(m83)= ln()3)**Substituting k and ln(m ) into equation (1), we obtain8484R =27[k582+ k83+ 3k84m82+ m] + ln(327 × 3351+583+ m84) − ln(m110)1-2
Annex 2Data Sources(1) AustraliaReference year: 2004-2006.Source: Australia Bureau of <strong>Statistics</strong>. “Deaths, Australia, 2006”. RetrievedJanuary 7, 2008, fromhttp://www.ausstats.abs.gov.au/Ausstats/subscriber.nsf/0/D80EDF33BD075923CA25738D000F4CA9/$File/33020_2006.pdf(2) Hong KongReference year: 2006Source: Census and <strong>Statistics</strong> Department, Hong Kong. “Hong Kong Life Tables,1971-2006”. Retrieved January 7, 2008, fromhttp://www.statistics.gov.hk/stat_table/population/D5320184BXXXXXXXXB.xls(3) JapanReference year: 2006Source: <strong>Statistics</strong> and Information Department, Ministry of Health, Labour andWelfare, Japan. “Abridged Life Tables for Japan 2006”. Retrieved January 7,2008, fromhttp://www.mhlw.go.jp/english/database/db-hw/lifetb06/dl/contents.pdf(4) South KoreaReference year: 2005Source: Korea National Statistical Office. “Korea Statistical Yearbook 2006”.(5) SwedenReference year: 2006Source: <strong>Statistics</strong> Sweden. “Life Tables 2006”Retrieved January 28, 2008 fromhttp://www.scb.se/statistik/BE/BE0101/2006A01a/Be0101Livslängdstabeller_06_eng.xls2-1
(6) TaiwanReference year: 2006Source: Department of <strong>Statistics</strong>, Ministry of the Interior, Taiwan. “Abridged LifeTables in Taiwan-Fuchien Area 2006”. Retrieved January 7, 2008, fromhttp://sowf.moi.gov.tw/stat/english/elife/te95200.htm(7) United KingdomReference year: 2004-2006Source: Office for National <strong>Statistics</strong>, United Kingdom. “Interim Life Tables2004-06”. Retrieved January 29, 2008, fromhttp://www.statistics.gov.uk/downloads/theme_population/Interim_Life/ILTUK0406Reg.xls(8) USAReference year:a) Life expectancy data refer to 2005 and are preliminary.b) Data on proportion expected to be living at age 85 years refer to 2004. UnitedStates Life Tables for 2005 are not yet available to compute the statistics.Source:Kung HC, Hoyert DL, Xu J, Murphy SL. Deaths: Preliminary Data for 2005.Health E-Stats. Sep 2007. Retrieved January 7, 2008, fromhttp://www.cdc.gov/nchs/products/pubs/pubd/hestats/prelimdeaths05/prelimdeaths05.htmNational Center for Health <strong>Statistics</strong> “United States Life Tables, 2004”Retrieved January 29, 2008, fromhttp://www.cdc.gov/nchs/data/nvsr/nvsr56/nvsr56_09.pdf2-2
Annex 3Table 1 Complete Life Table for <strong>Singapore</strong> Resident Population, 2003Age x(years)Number ofsurvivors atexact age xNumber ofdeaths betweenexact age x andage x+1Number ofperson-yearslived betweenexact age x andage x+1Totalperson-yearslived afterexact age xq x l x d x L x T x e xProbability ofdying betweenexact age x andage x+1Expectationof life atexact age x0 0.00246 100,000 246 99,799 7,914,439 79.11 0.00019 99,754 19 99,745 7,814,640 78.32 0.00018 99,736 18 99,726 7,714,895 77.43 0.00017 99,717 17 99,709 7,615,169 76.44 0.00015 99,700 15 99,693 7,515,460 75.45 0.00013 99,685 13 99,679 7,415,767 74.46 0.00011 99,672 11 99,667 7,316,088 73.47 0.00010 99,661 10 99,656 7,216,422 72.48 0.00010 99,651 10 99,646 7,116,766 71.49 0.00010 99,641 10 99,636 7,017,120 70.410 0.00011 99,630 11 99,625 6,917,484 69.411 0.00012 99,619 12 99,614 6,817,860 68.412 0.00013 99,608 13 99,601 6,718,246 67.413 0.00016 99,595 16 99,587 6,618,645 66.514 0.00020 99,579 20 99,569 6,519,058 65.515 0.00024 99,559 24 99,547 6,419,489 64.516 0.00028 99,535 28 99,522 6,319,942 63.517 0.00031 99,508 31 99,492 6,220,420 62.518 0.00035 99,477 35 99,459 6,120,928 61.519 0.00039 99,441 39 99,422 6,021,469 60.620 0.00043 99,403 43 99,381 5,922,047 59.621 0.00047 99,360 47 99,336 5,822,666 58.622 0.00049 99,313 49 99,289 5,723,329 57.623 0.00048 99,265 48 99,241 5,624,040 56.724 0.00046 99,216 46 99,193 5,524,800 55.725 0.00044 99,170 43 99,149 5,425,606 54.726 0.00042 99,127 41 99,106 5,326,458 53.727 0.00041 99,086 41 99,066 5,227,351 52.828 0.00042 99,045 42 99,024 5,128,286 51.829 0.00045 99,004 44 98,982 5,029,261 50.830 0.00047 98,959 47 98,936 4,930,280 49.831 0.00050 98,913 50 98,888 4,831,344 48.832 0.00053 98,863 53 98,837 4,732,456 47.933 0.00058 98,810 57 98,782 4,633,619 46.934 0.00062 98,753 62 98,723 4,534,837 45.935 0.00067 98,692 66 98,659 4,436,115 44.936 0.00072 98,625 71 98,590 4,337,456 44.037 0.00079 98,554 78 98,515 4,238,866 43.038 0.00087 98,476 85 98,434 4,140,351 42.039 0.00096 98,391 94 98,344 4,041,918 41.13-1
Annex 3Table 1 Complete Life Table for <strong>Singapore</strong> Resident Population, 2003 (Continued)Age x(years)Number ofsurvivors atexact age xNumber ofdeaths betweenexact age x andage x+1Number ofperson-yearslived betweenexact age x andage x+1Totalperson-yearslived afterexact age xq x l x d x L x T x e xProbability ofdying betweenexact age x andage x+1Expectationof life atexact age x40 0.00105 98,296 103 98,245 3,943,574 40.141 0.00115 98,193 113 98,137 3,845,329 39.242 0.00126 98,081 124 98,019 3,747,192 38.243 0.00141 97,957 138 97,888 3,649,174 37.344 0.00156 97,819 153 97,742 3,551,286 36.345 0.00173 97,666 169 97,582 3,453,544 35.446 0.00190 97,497 185 97,405 3,355,962 34.447 0.00210 97,312 204 97,210 3,258,557 33.548 0.00234 97,108 228 96,995 3,161,347 32.649 0.00261 96,881 253 96,754 3,064,352 31.650 0.00289 96,628 279 96,488 2,967,598 30.751 0.00318 96,348 307 96,195 2,871,110 29.852 0.00353 96,042 339 95,872 2,774,915 28.953 0.00396 95,703 379 95,513 2,679,042 28.054 0.00444 95,324 424 95,112 2,583,529 27.155 0.00494 94,900 469 94,666 2,488,417 26.256 0.00545 94,432 515 94,174 2,393,752 25.357 0.00605 93,916 568 93,633 2,299,577 24.558 0.00675 93,349 630 93,033 2,205,945 23.659 0.00752 92,718 697 92,370 2,112,911 22.860 0.00830 92,021 764 91,639 2,020,542 22.061 0.00913 91,258 833 90,841 1,928,902 21.162 0.01013 90,425 916 89,967 1,838,061 20.363 0.01140 89,509 1,021 88,999 1,748,094 19.564 0.01285 88,488 1,137 87,920 1,659,095 18.765 0.01433 87,351 1,252 86,725 1,571,176 18.066 0.01586 86,099 1,366 85,416 1,484,450 17.267 0.01752 84,734 1,484 83,991 1,399,034 16.568 0.01937 83,249 1,612 82,443 1,315,043 15.869 0.02130 81,637 1,739 80,767 1,232,600 15.170 0.02323 79,898 1,856 78,970 1,151,832 14.471 0.02532 78,042 1,976 77,054 1,072,862 13.772 0.02797 76,066 2,128 75,003 995,808 13.173 0.03149 73,939 2,328 72,775 920,805 12.574 0.03555 71,610 2,546 70,338 848,030 11.875 0.03976 69,065 2,746 67,692 777,693 11.376 0.04397 66,319 2,916 64,861 710,001 10.777 0.04829 63,403 3,062 61,872 645,141 10.278 0.05283 60,341 3,188 58,747 583,269 9.779 0.05748 57,153 3,285 55,510 524,522 9.23-2
Annex 3Table 1 Complete Life Table for <strong>Singapore</strong> Resident Population, 2003 (Continued)Age x(years)Number ofsurvivors atexact age xNumber ofdeaths betweenexact age x andage x+1Number ofperson-yearslived betweenexact age x andage x+1Totalperson-yearslived afterexact age xq x l x d x L x T x e xProbability ofdying betweenexact age x andage x+1Expectationof life atexact age x80 0.06210 53,868 3,345 52,195 469,012 8.781 0.06681 50,523 3,376 48,835 416,816 8.382 0.07202 47,147 3,395 45,449 367,981 7.883 0.07814 43,752 3,419 42,042 322,532 7.484 0.08522 40,333 3,437 38,614 280,490 7.085 0.09259 36,895 3,416 35,187 241,876 6.686 0.10056 33,479 3,367 31,796 206,689 6.287 0.10918 30,113 3,288 28,469 174,893 5.888 0.11848 26,825 3,178 25,236 146,424 5.589 0.12853 23,647 3,039 22,127 121,188 5.190 0.13937 20,607 2,872 19,171 99,061 4.891 0.15105 17,735 2,679 16,396 79,890 4.592 0.16362 15,056 2,463 13,825 63,494 4.293 0.17713 12,593 2,231 11,478 49,669 3.994 0.19165 10,362 1,986 9,369 38,191 3.795 0.20722 8,376 1,736 7,509 28,822 3.496 0.22389 6,641 1,487 5,897 21,314 3.297 0.24173 5,154 1,246 4,531 15,416 3.098 0.26078 3,908 1,019 3,398 10,885 2.899 0.28110 2,889 812 2,483 7,487 2.6100+ 1.00000 2,077 2,077 5,004 5,004 2.43-3
Annex 3Age x(years)Table 2 Complete Life Table for <strong>Singapore</strong> Resident Males, 2003Number ofsurvivors atexact age xNumber ofdeaths betweenexact age x andage x+1Number ofperson-yearslived betweenexact age x andage x+1Totalperson-yearslived afterexact age xq x l x d x L x T x e xProbability ofdying betweenexact age x andage x+1Expectationof life atexact age x0 0.00282 100,000 282 99,769 7,663,601 76.61 0.00021 99,718 21 99,708 7,563,833 75.92 0.00020 99,697 20 99,687 7,464,125 74.93 0.00019 99,677 19 99,668 7,364,438 73.94 0.00017 99,659 17 99,650 7,264,770 72.95 0.00015 99,642 15 99,634 7,165,120 71.96 0.00013 99,627 13 99,620 7,065,486 70.97 0.00012 99,613 12 99,607 6,965,866 69.98 0.00012 99,601 12 99,595 6,866,259 68.99 0.00012 99,589 12 99,583 6,766,664 67.910 0.00013 99,577 12 99,571 6,667,081 67.011 0.00013 99,564 13 99,558 6,567,510 66.012 0.00015 99,551 15 99,544 6,467,952 65.013 0.00018 99,537 18 99,528 6,368,408 64.014 0.00023 99,519 23 99,507 6,268,881 63.015 0.00028 99,496 27 99,482 6,169,373 62.016 0.00032 99,469 32 99,452 6,069,891 61.017 0.00037 99,436 37 99,418 5,970,439 60.018 0.00043 99,399 43 99,378 5,871,021 59.119 0.00050 99,356 50 99,331 5,771,643 58.120 0.00057 99,307 56 99,278 5,672,312 57.121 0.00063 99,250 63 99,219 5,573,033 56.222 0.00067 99,188 66 99,155 5,473,814 55.223 0.00066 99,122 66 99,089 5,374,660 54.224 0.00063 99,056 63 99,024 5,275,571 53.325 0.00060 98,993 59 98,963 5,176,547 52.326 0.00057 98,934 56 98,906 5,077,583 51.327 0.00056 98,878 55 98,850 4,978,678 50.428 0.00057 98,823 56 98,795 4,879,827 49.429 0.00060 98,766 59 98,737 4,781,033 48.430 0.00064 98,707 63 98,676 4,682,296 47.431 0.00067 98,644 66 98,611 4,583,620 46.532 0.00071 98,578 70 98,543 4,485,009 45.533 0.00076 98,508 75 98,470 4,386,467 44.534 0.00081 98,433 80 98,393 4,287,996 43.635 0.00086 98,353 84 98,311 4,189,603 42.636 0.00091 98,269 90 98,224 4,091,292 41.637 0.00099 98,179 97 98,130 3,993,068 40.738 0.00110 98,082 108 98,028 3,894,938 39.739 0.00122 97,974 120 97,914 3,796,910 38.83-4
Annex 3Table 2 Complete Life Table for <strong>Singapore</strong> Resident Males, 2003 (Continued)Age x(years)Number ofsurvivors atexact age xNumber ofdeaths betweenexact age x andage x+1Number ofperson-yearslived betweenexact age x andage x+1Totalperson-yearslived afterexact age xq x l x d x L x T x e xProbability ofdying betweenexact age x andage x+1Expectationof life atexact age x40 0.00135 97,855 132 97,789 3,698,996 37.841 0.00148 97,723 145 97,650 3,601,207 36.942 0.00163 97,578 159 97,498 3,503,557 35.943 0.00181 97,419 176 97,330 3,406,059 35.044 0.00200 97,242 195 97,145 3,308,729 34.045 0.00220 97,048 213 96,941 3,211,584 33.146 0.00240 96,834 233 96,718 3,114,643 32.247 0.00265 96,602 256 96,474 3,017,925 31.248 0.00294 96,346 283 96,205 2,921,451 30.349 0.00325 96,063 312 95,907 2,825,246 29.450 0.00357 95,751 342 95,580 2,729,339 28.551 0.00392 95,409 374 95,222 2,633,759 27.652 0.00436 95,035 414 94,828 2,538,537 26.753 0.00494 94,621 467 94,388 2,443,709 25.854 0.00561 94,154 528 93,890 2,349,321 25.055 0.00630 93,626 590 93,331 2,255,431 24.156 0.00702 93,036 653 92,709 2,162,100 23.257 0.00782 92,382 723 92,021 2,069,391 22.458 0.00875 91,660 802 91,259 1,977,370 21.659 0.00976 90,857 886 90,414 1,886,112 20.860 0.01077 89,971 969 89,487 1,795,697 20.061 0.01185 89,002 1,054 88,475 1,706,211 19.262 0.01315 87,948 1,156 87,370 1,617,736 18.463 0.01480 86,791 1,284 86,149 1,530,366 17.664 0.01666 85,507 1,424 84,795 1,444,217 16.965 0.01858 84,083 1,562 83,302 1,359,422 16.266 0.02054 82,521 1,695 81,673 1,276,120 15.567 0.02267 80,825 1,833 79,909 1,194,447 14.868 0.02504 78,993 1,978 78,004 1,114,538 14.169 0.02750 77,015 2,118 75,956 1,036,534 13.570 0.02996 74,897 2,244 73,775 960,578 12.871 0.03262 72,653 2,370 71,468 886,803 12.272 0.03599 70,283 2,530 69,018 815,334 11.673 0.04048 67,753 2,742 66,382 746,316 11.074 0.04568 65,011 2,969 63,526 679,934 10.575 0.05107 62,041 3,168 60,457 616,408 9.976 0.05639 58,873 3,320 57,213 555,951 9.477 0.06161 55,553 3,422 53,842 498,738 9.078 0.06671 52,131 3,478 50,392 444,896 8.579 0.07166 48,653 3,486 46,910 394,504 8.13-5
Annex 3Age x(years)Table 2 Complete Life Table for <strong>Singapore</strong> Resident Males, 2003 (Continued)Number ofsurvivors atexact age xNumber ofdeaths betweenexact age x andage x+1Number ofperson-yearslived betweenexact age x andage x+1Totalperson-yearslived afterexact age xq x l x d x L x T x e xProbability ofdying betweenexact age x andage x+1Expectationof life atexact age x80 0.07642 45,167 3,452 43,441 347,594 7.781 0.08122 41,715 3,388 40,021 304,153 7.382 0.08670 38,327 3,323 36,665 264,132 6.983 0.09356 35,004 3,275 33,367 227,467 6.584 0.10227 31,729 3,245 30,107 194,100 6.185 0.11091 28,484 3,159 26,905 163,994 5.886 0.12024 25,325 3,045 23,803 137,089 5.487 0.13030 22,280 2,903 20,828 113,286 5.188 0.14114 19,377 2,735 18,010 92,458 4.889 0.15281 16,642 2,543 15,371 74,448 4.590 0.16535 14,099 2,331 12,933 59,078 4.291 0.17883 11,768 2,104 10,716 46,144 3.992 0.19328 9,663 1,868 8,730 35,429 3.793 0.20877 7,796 1,628 6,982 26,699 3.494 0.22535 6,168 1,390 5,473 19,717 3.295 0.24307 4,778 1,161 4,197 14,244 3.096 0.26197 3,617 947 3,143 10,047 2.897 0.28211 2,669 753 2,293 6,904 2.698 0.30352 1,916 582 1,625 4,611 2.499 0.32625 1,335 435 1,117 2,986 2.2100+ 1.00000 899 899 1,869 1,869 2.13-6
Annex 3Age x(years)Table 3 Complete Life Table for <strong>Singapore</strong> Resident Females, 2003Number ofsurvivors atexact age xNumber ofdeaths betweenexact age x andage x+1Number ofperson-yearslived betweenexact age x andage x+1Totalperson-yearslived afterexact age xq x l x d x L x T x e xProbability ofdying betweenexact age x andage x+1Expectationof life atexact age x0 0.00207 100,000 207 99,830 8,155,364 81.61 0.00017 99,793 17 99,784 8,055,534 80.72 0.00016 99,776 16 99,768 7,955,750 79.73 0.00015 99,759 15 99,752 7,855,982 78.74 0.00013 99,744 13 99,738 7,756,230 77.85 0.00011 99,731 11 99,726 7,656,492 76.86 0.00009 99,720 9 99,716 7,556,766 75.87 0.00008 99,711 8 99,707 7,457,051 74.88 0.00008 99,703 8 99,699 7,357,343 73.89 0.00009 99,695 9 99,691 7,257,644 72.810 0.00009 99,687 9 99,682 7,157,953 71.811 0.00010 99,677 10 99,672 7,058,271 70.812 0.00011 99,667 11 99,662 6,958,599 69.813 0.00014 99,656 14 99,649 6,858,937 68.814 0.00017 99,642 17 99,634 6,759,288 67.815 0.00020 99,626 20 99,616 6,659,654 66.816 0.00023 99,606 23 99,595 6,560,038 65.917 0.00025 99,583 25 99,571 6,460,443 64.918 0.00027 99,558 27 99,545 6,360,872 63.919 0.00028 99,532 28 99,517 6,261,327 62.920 0.00030 99,503 29 99,489 6,161,810 61.921 0.00031 99,474 30 99,459 6,062,321 60.922 0.00031 99,444 31 99,428 5,962,862 60.023 0.00031 99,413 31 99,397 5,863,434 59.024 0.00030 99,382 30 99,367 5,764,037 58.025 0.00029 99,352 28 99,338 5,664,670 57.026 0.00028 99,324 27 99,310 5,565,332 56.027 0.00027 99,297 27 99,283 5,466,022 55.028 0.00028 99,269 28 99,255 5,366,739 54.129 0.00030 99,241 30 99,226 5,267,483 53.130 0.00032 99,211 32 99,195 5,168,257 52.131 0.00034 99,179 34 99,162 5,069,062 51.132 0.00037 99,145 37 99,127 4,969,900 50.133 0.00040 99,109 40 99,089 4,870,773 49.134 0.00045 99,069 44 99,047 4,771,684 48.235 0.00049 99,024 49 99,000 4,672,637 47.236 0.00054 98,976 53 98,949 4,573,637 46.237 0.00059 98,922 58 98,893 4,474,688 45.238 0.00064 98,864 63 98,833 4,375,795 44.339 0.00069 98,801 68 98,767 4,276,962 43.33-7
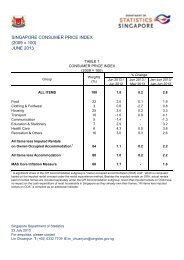
Annex 3Age x(years)Table 3 Complete Life Table for <strong>Singapore</strong> Resident Females, 2003 (Continued)Number ofsurvivors atexact age xNumber ofdeaths betweenexact age x andage x+1Number ofperson-yearslived betweenexact age x andage x+1Totalperson-yearslived afterexact age xq x l x d x L x T x e xProbability ofdying betweenexact age x andage x+1Expectationof life atexact age x40 0.00075 98,733 74 98,696 4,178,195 42.341 0.00081 98,659 80 98,619 4,079,499 41.342 0.00089 98,579 87 98,536 3,980,880 40.443 0.00099 98,492 98 98,443 3,882,345 39.444 0.00112 98,394 110 98,339 3,783,902 38.545 0.00124 98,284 122 98,223 3,685,562 37.546 0.00138 98,162 135 98,094 3,587,339 36.547 0.00154 98,026 151 97,951 3,489,245 35.648 0.00174 97,876 170 97,791 3,391,294 34.649 0.00196 97,705 192 97,610 3,293,504 33.750 0.00220 97,514 214 97,406 3,195,894 32.851 0.00244 97,299 237 97,181 3,098,488 31.852 0.00269 97,062 261 96,931 3,001,307 30.953 0.00298 96,801 288 96,656 2,904,376 30.054 0.00328 96,512 316 96,354 2,807,719 29.155 0.00358 96,196 344 96,024 2,711,365 28.256 0.00390 95,852 374 95,665 2,615,341 27.357 0.00430 95,478 410 95,273 2,519,676 26.458 0.00480 95,068 456 94,840 2,424,403 25.559 0.00536 94,612 508 94,358 2,329,563 24.660 0.00594 94,104 559 93,825 2,235,206 23.861 0.00656 93,545 613 93,238 2,141,381 22.962 0.00730 92,932 678 92,593 2,048,143 22.063 0.00824 92,254 760 91,873 1,955,550 21.264 0.00931 91,493 852 91,067 1,863,677 20.465 0.01041 90,641 944 90,169 1,772,609 19.666 0.01155 89,698 1,036 89,179 1,682,440 18.867 0.01282 88,661 1,137 88,093 1,593,260 18.068 0.01427 87,525 1,249 86,900 1,505,167 17.269 0.01580 86,276 1,363 85,594 1,418,267 16.470 0.01734 84,912 1,473 84,176 1,332,674 15.771 0.01903 83,439 1,588 82,646 1,248,498 15.072 0.02120 81,852 1,736 80,984 1,165,852 14.273 0.02413 80,116 1,934 79,150 1,084,868 13.574 0.02752 78,183 2,152 77,107 1,005,718 12.975 0.03102 76,031 2,359 74,852 928,611 12.276 0.03460 73,672 2,549 72,398 853,760 11.677 0.03848 71,124 2,737 69,755 781,362 11.078 0.04287 68,387 2,932 66,921 711,607 10.479 0.04756 65,455 3,113 63,898 644,686 9.83-8
Annex 3Age x(years)Table 3 Complete Life Table for <strong>Singapore</strong> Resident Females, 2003 (Continued)Number ofsurvivors atexact age xNumber ofdeaths betweenexact age x andage x+1Number ofperson-yearslived betweenexact age x andage x+1Totalperson-yearslived afterexact age xq x l x d x L x T x e xProbability ofdying betweenexact age x andage x+1Expectationof life atexact age x80 0.05230 62,342 3,260 60,711 580,787 9.381 0.05712 59,081 3,375 57,394 520,076 8.882 0.06239 55,707 3,475 53,969 462,682 8.383 0.06851 52,231 3,579 50,442 408,713 7.884 0.07548 48,653 3,672 46,817 358,271 7.485 0.08283 44,981 3,726 43,118 311,455 6.986 0.09082 41,255 3,747 39,381 268,337 6.587 0.09948 37,508 3,731 35,643 228,955 6.188 0.10885 33,777 3,677 31,939 193,313 5.789 0.11899 30,100 3,582 28,309 161,374 5.490 0.12993 26,519 3,446 24,796 133,065 5.091 0.14172 23,073 3,270 21,438 108,269 4.792 0.15441 19,803 3,058 18,274 86,831 4.493 0.16804 16,745 2,814 15,338 68,557 4.194 0.18265 13,932 2,545 12,659 53,218 3.895 0.19828 11,387 2,258 10,258 40,559 3.696 0.21498 9,129 1,963 8,148 30,301 3.397 0.23278 7,167 1,668 6,332 22,153 3.198 0.25171 5,498 1,384 4,806 15,821 2.999 0.27180 4,114 1,118 3,555 11,014 2.7100+ 1.00000 2,996 2,996 7,459 7,459 2.53-9
Annex 3Age x(years)Table 4 Complete Life Table for <strong>Singapore</strong> Resident Population, 2004Number ofsurvivors atexact age xNumber ofdeaths betweenexact age x andage x+1Number ofperson-yearslived betweenexact age x andage x+1Totalperson-yearslived afterexact age xq x l x d x L x T x e xProbability ofdying betweenexact age x andage x+1Expectationof life atexact age x0 0.00227 100,000 227 99,814 7,963,198 79.61 0.00019 99,773 19 99,763 7,863,384 78.82 0.00018 99,754 18 99,745 7,763,620 77.83 0.00017 99,736 17 99,727 7,663,876 76.84 0.00015 99,719 15 99,711 7,564,148 75.95 0.00014 99,703 14 99,696 7,464,438 74.96 0.00012 99,689 12 99,683 7,364,741 73.97 0.00011 99,677 11 99,672 7,265,058 72.98 0.00011 99,667 11 99,661 7,165,386 71.99 0.00011 99,656 11 99,651 7,065,725 70.910 0.00011 99,645 11 99,640 6,966,074 69.911 0.00011 99,634 11 99,628 6,866,434 68.912 0.00013 99,623 13 99,616 6,766,806 67.913 0.00015 99,610 15 99,603 6,667,190 66.914 0.00018 99,595 18 99,586 6,567,587 65.915 0.00022 99,577 21 99,566 6,468,001 65.016 0.00025 99,556 25 99,543 6,368,434 64.017 0.00028 99,531 28 99,517 6,268,891 63.018 0.00032 99,503 32 99,486 6,169,375 62.019 0.00037 99,470 37 99,452 6,069,888 61.020 0.00041 99,434 41 99,413 5,970,436 60.021 0.00045 99,393 45 99,370 5,871,023 59.122 0.00048 99,347 47 99,324 5,771,653 58.123 0.00047 99,300 47 99,277 5,672,329 57.124 0.00045 99,253 44 99,231 5,573,052 56.125 0.00042 99,209 41 99,188 5,473,822 55.226 0.00039 99,167 39 99,148 5,374,634 54.227 0.00038 99,128 38 99,110 5,275,486 53.228 0.00039 99,091 39 99,071 5,176,376 52.229 0.00042 99,052 42 99,031 5,077,305 51.330 0.00045 99,010 45 98,988 4,978,274 50.331 0.00048 98,965 48 98,941 4,879,287 49.332 0.00051 98,918 51 98,892 4,780,345 48.333 0.00055 98,867 55 98,839 4,681,453 47.434 0.00060 98,812 59 98,783 4,582,614 46.435 0.00064 98,753 63 98,721 4,483,831 45.436 0.00069 98,690 68 98,656 4,385,110 44.437 0.00075 98,622 74 98,585 4,286,454 43.538 0.00083 98,548 82 98,507 4,187,869 42.539 0.00092 98,466 91 98,421 4,089,362 41.53-10
Annex 3Table 4 Complete Life Table for <strong>Singapore</strong> Resident Population, 2004 (Continued)Age x(years)Number ofsurvivors atexact age xNumber ofdeaths betweenexact age x andage x+1Number ofperson-yearslived betweenexact age x andage x+1Totalperson-yearslived afterexact age xq x l x d x L x T x e xProbability ofdying betweenexact age x andage x+1Expectationof life atexact age x40 0.00102 98,375 100 98,325 3,990,941 40.641 0.00112 98,275 110 98,220 3,892,616 39.642 0.00123 98,165 121 98,105 3,794,396 38.743 0.00137 98,044 135 97,977 3,696,291 37.744 0.00152 97,909 149 97,835 3,598,315 36.845 0.00167 97,760 164 97,679 3,500,480 35.846 0.00184 97,597 179 97,507 3,402,801 34.947 0.00203 97,418 198 97,319 3,305,294 33.948 0.00228 97,220 221 97,109 3,207,975 33.049 0.00255 96,999 247 96,875 3,110,866 32.150 0.00283 96,752 274 96,615 3,013,991 31.251 0.00312 96,478 301 96,327 2,917,376 30.252 0.00346 96,177 333 96,010 2,821,048 29.353 0.00388 95,844 372 95,658 2,725,038 28.454 0.00435 95,472 415 95,264 2,629,380 27.555 0.00482 95,057 459 94,828 2,534,116 26.756 0.00532 94,598 503 94,347 2,439,288 25.857 0.00588 94,095 553 93,818 2,344,942 24.958 0.00652 93,542 610 93,237 2,251,123 24.159 0.00720 92,932 670 92,598 2,157,886 23.260 0.00790 92,263 729 91,898 2,065,289 22.461 0.00864 91,534 791 91,139 1,973,390 21.662 0.00957 90,743 868 90,309 1,882,252 20.763 0.01076 89,875 967 89,391 1,791,943 19.964 0.01213 88,907 1,079 88,368 1,702,552 19.165 0.01354 87,829 1,189 87,234 1,614,183 18.466 0.01499 86,640 1,299 85,990 1,526,949 17.667 0.01657 85,341 1,414 84,634 1,440,959 16.968 0.01835 83,927 1,540 83,157 1,356,325 16.269 0.02023 82,387 1,667 81,553 1,273,169 15.570 0.02214 80,719 1,787 79,826 1,191,616 14.871 0.02416 78,933 1,907 77,979 1,111,790 14.172 0.02658 77,026 2,047 76,002 1,033,811 13.473 0.02961 74,979 2,220 73,868 957,808 12.874 0.03299 72,758 2,401 71,558 883,940 12.175 0.03645 70,358 2,565 69,075 812,382 11.576 0.04003 67,793 2,714 66,436 743,307 11.077 0.04406 65,079 2,867 63,646 676,870 10.478 0.04883 62,212 3,038 60,693 613,224 9.979 0.05404 59,174 3,198 57,576 552,531 9.33-11
Annex 3Table 4 Complete Life Table for <strong>Singapore</strong> Resident Population, 2004 (Continued)Age x(years)Number ofsurvivors atexact age xNumber ofdeaths betweenexact age x andage x+1Number ofperson-yearslived betweenexact age x andage x+1Totalperson-yearslived afterexact age xq x l x d x L x T x e xProbability ofdying betweenexact age x andage x+1Expectationof life atexact age x80 0.05935 55,977 3,322 54,316 494,956 8.881 0.06467 52,655 3,405 50,952 440,640 8.482 0.07027 49,249 3,461 47,519 389,688 7.983 0.07645 45,788 3,501 44,038 342,169 7.584 0.08321 42,288 3,519 40,528 298,131 7.185 0.09049 38,769 3,508 37,015 257,602 6.686 0.09838 35,261 3,469 33,526 220,588 6.387 0.10691 31,792 3,399 30,093 187,061 5.988 0.11613 28,393 3,297 26,744 156,969 5.589 0.12610 25,096 3,165 23,514 130,224 5.290 0.13686 21,931 3,002 20,430 106,711 4.991 0.14847 18,930 2,810 17,524 86,280 4.692 0.16098 16,119 2,595 14,822 68,756 4.393 0.17444 13,524 2,359 12,345 53,934 4.094 0.18891 11,165 2,109 10,111 41,589 3.795 0.20445 9,056 1,851 8,130 31,479 3.596 0.22111 7,204 1,593 6,408 23,348 3.297 0.23894 5,612 1,341 4,941 16,940 3.098 0.25801 4,271 1,102 3,720 11,999 2.899 0.27836 3,169 882 2,728 8,280 2.6100+ 1.00000 2,287 2,287 5,552 5,552 2.43-12
Annex 3Age x(years)Table 5 Complete Life Table for <strong>Singapore</strong> Resident Males, 2004Number ofsurvivors atexact age xNumber ofdeaths betweenexact age x andage x+1Number ofperson-yearslived betweenexact age x andage x+1Totalperson-yearslived afterexact age xq x l x d x L x T x e xProbability ofdying betweenexact age x andage x+1Expectationof life atexact age x0 0.00255 100,000 255 99,791 7,711,192 77.11 0.00020 99,745 20 99,735 7,611,401 76.32 0.00020 99,725 20 99,715 7,511,667 75.33 0.00018 99,705 18 99,696 7,411,952 74.34 0.00017 99,686 17 99,678 7,312,256 73.45 0.00015 99,670 15 99,662 7,212,578 72.46 0.00013 99,655 13 99,648 7,112,916 71.47 0.00012 99,642 12 99,635 7,013,268 70.48 0.00012 99,629 12 99,623 6,913,632 69.49 0.00012 99,618 12 99,612 6,814,009 68.410 0.00012 99,606 12 99,600 6,714,397 67.411 0.00012 99,594 12 99,588 6,614,797 66.412 0.00013 99,582 13 99,576 6,515,209 65.413 0.00017 99,569 17 99,561 6,415,633 64.414 0.00021 99,552 21 99,541 6,316,072 63.415 0.00026 99,531 26 99,518 6,216,531 62.516 0.00031 99,505 31 99,489 6,117,013 61.517 0.00036 99,473 36 99,455 6,017,524 60.518 0.00042 99,437 42 99,416 5,918,069 59.519 0.00049 99,395 49 99,371 5,818,653 58.520 0.00056 99,347 55 99,319 5,719,282 57.621 0.00062 99,291 61 99,261 5,619,963 56.622 0.00066 99,230 65 99,197 5,520,702 55.623 0.00065 99,165 65 99,133 5,421,505 54.724 0.00062 99,100 61 99,070 5,322,372 53.725 0.00058 99,039 57 99,010 5,223,303 52.726 0.00055 98,982 54 98,955 5,124,292 51.827 0.00053 98,928 53 98,901 5,025,338 50.828 0.00055 98,875 54 98,848 4,926,437 49.829 0.00058 98,821 58 98,792 4,827,589 48.930 0.00062 98,763 61 98,732 4,728,797 47.931 0.00066 98,702 65 98,669 4,630,064 46.932 0.00070 98,637 69 98,602 4,531,395 45.933 0.00074 98,568 73 98,531 4,432,793 45.034 0.00079 98,495 77 98,456 4,334,261 44.035 0.00083 98,417 82 98,376 4,235,805 43.036 0.00088 98,335 87 98,292 4,137,429 42.137 0.00095 98,249 94 98,202 4,039,137 41.138 0.00105 98,155 103 98,103 3,940,935 40.239 0.00117 98,052 115 97,994 3,842,832 39.23-13
Annex 3Age x(years)Table 5 Complete Life Table for <strong>Singapore</strong> Resident Males, 2004 (Continued)Number ofsurvivors atexact age xNumber ofdeaths betweenexact age x andage x+1Number ofperson-yearslived betweenexact age x andage x+1Totalperson-yearslived afterexact age xq x l x d x L x T x e xProbability ofdying betweenexact age x andage x+1Expectationof life atexact age x40 0.00130 97,937 127 97,873 3,744,838 38.241 0.00142 97,810 139 97,740 3,646,964 37.342 0.00157 97,670 153 97,594 3,549,224 36.343 0.00174 97,517 170 97,432 3,451,631 35.444 0.00192 97,347 187 97,254 3,354,198 34.545 0.00211 97,160 205 97,057 3,256,945 33.546 0.00231 96,955 224 96,843 3,159,887 32.647 0.00255 96,731 247 96,607 3,063,044 31.748 0.00285 96,484 275 96,346 2,966,437 30.749 0.00319 96,208 307 96,055 2,870,091 29.850 0.00353 95,902 338 95,733 2,774,036 28.951 0.00389 95,564 372 95,378 2,678,303 28.052 0.00433 95,192 412 94,986 2,582,925 27.153 0.00489 94,780 463 94,548 2,487,939 26.254 0.00552 94,316 521 94,056 2,393,391 25.455 0.00617 93,796 579 93,506 2,299,335 24.556 0.00685 93,217 638 92,897 2,205,829 23.757 0.00759 92,578 703 92,227 2,112,932 22.858 0.00843 91,876 774 91,489 2,020,705 22.059 0.00931 91,101 848 90,677 1,929,216 21.260 0.01020 90,253 921 89,793 1,838,539 20.461 0.01116 89,333 997 88,834 1,748,746 19.662 0.01238 88,335 1,094 87,788 1,659,912 18.863 0.01399 87,242 1,221 86,631 1,572,124 18.064 0.01585 86,021 1,363 85,339 1,485,492 17.365 0.01777 84,657 1,504 83,905 1,400,153 16.566 0.01973 83,153 1,640 82,333 1,316,248 15.867 0.02183 81,513 1,779 80,623 1,233,915 15.168 0.02415 79,734 1,926 78,771 1,153,292 14.569 0.02660 77,808 2,070 76,773 1,074,522 13.870 0.02906 75,738 2,201 74,638 997,749 13.271 0.03165 73,537 2,328 72,373 923,111 12.672 0.03470 71,209 2,471 69,974 850,738 11.973 0.03845 68,738 2,643 67,417 780,764 11.474 0.04260 66,095 2,816 64,688 713,347 10.875 0.04684 63,280 2,964 61,798 648,660 10.376 0.05118 60,316 3,087 58,772 586,862 9.777 0.05592 57,229 3,200 55,629 528,090 9.278 0.06128 54,029 3,311 52,373 472,461 8.779 0.06699 50,718 3,398 49,019 420,088 8.33-14
Annex 3Age x(years)Table 5 Complete Life Table for <strong>Singapore</strong> Resident Males, 2004 (Continued)Number ofsurvivors atexact age xNumber ofdeaths betweenexact age x andage x+1Number ofperson-yearslived betweenexact age x andage x+1Totalperson-yearslived afterexact age xq x l x d x L x T x e xProbability ofdying betweenexact age x andage x+1Expectationof life atexact age x80 0.07268 47,320 3,439 45,600 371,070 7.881 0.07833 43,881 3,437 42,162 325,469 7.482 0.08437 40,444 3,412 38,738 283,307 7.083 0.09133 37,032 3,382 35,341 244,569 6.684 0.09960 33,650 3,352 31,974 209,229 6.285 0.10814 30,298 3,276 28,660 177,255 5.986 0.11736 27,022 3,171 25,436 148,595 5.587 0.12731 23,851 3,036 22,332 123,159 5.288 0.13805 20,814 2,873 19,377 100,826 4.889 0.14962 17,941 2,684 16,599 81,449 4.590 0.16208 15,256 2,473 14,020 64,851 4.391 0.17547 12,784 2,243 11,662 50,831 4.092 0.18986 10,540 2,001 9,540 39,168 3.793 0.20529 8,539 1,753 7,663 29,629 3.594 0.22183 6,786 1,505 6,034 21,966 3.295 0.23952 5,281 1,265 4,648 15,932 3.096 0.25841 4,016 1,038 3,497 11,284 2.897 0.27856 2,978 830 2,563 7,787 2.698 0.30001 2,149 645 1,826 5,223 2.499 0.32280 1,504 485 1,261 3,397 2.3100+ 1.00000 1,019 1,019 2,136 2,136 2.13-15
Annex 3Age x(years)Table 6 Complete Life Table for <strong>Singapore</strong> Resident Females, 2004Number ofsurvivors atexact age xNumber ofdeaths betweenexact age x andage x+1Number ofperson-yearslived betweenexact age x andage x+1Totalperson-yearslived afterexact age xq x l x d x L x T x e xProbability ofdying betweenexact age x andage x+1Expectationof life atexact age x0 0.00197 100,000 197 99,838 8,204,197 82.01 0.00018 99,803 18 99,794 8,104,358 81.22 0.00017 99,785 17 99,777 8,004,564 80.23 0.00016 99,768 16 99,760 7,904,788 79.24 0.00014 99,753 14 99,746 7,805,027 78.25 0.00012 99,739 12 99,732 7,705,281 77.36 0.00011 99,726 11 99,721 7,605,549 76.37 0.00010 99,716 10 99,711 7,505,828 75.38 0.00009 99,706 9 99,701 7,406,117 74.39 0.00010 99,697 10 99,692 7,306,416 73.310 0.00010 99,687 10 99,682 7,206,724 72.311 0.00011 99,676 11 99,671 7,107,042 71.312 0.00012 99,666 12 99,660 7,007,371 70.313 0.00013 99,654 13 99,647 6,907,712 69.314 0.00015 99,641 15 99,634 6,808,064 68.315 0.00016 99,626 16 99,618 6,708,431 67.316 0.00018 99,610 18 99,601 6,608,813 66.317 0.00020 99,592 20 99,582 6,509,212 65.418 0.00022 99,572 22 99,561 6,409,630 64.419 0.00024 99,550 24 99,538 6,310,069 63.420 0.00027 99,526 27 99,513 6,210,531 62.421 0.00029 99,499 29 99,485 6,111,019 61.422 0.00030 99,471 30 99,456 6,011,534 60.423 0.00030 99,441 29 99,426 5,912,078 59.524 0.00028 99,411 28 99,398 5,812,652 58.525 0.00026 99,384 26 99,371 5,713,254 57.526 0.00025 99,358 25 99,345 5,613,884 56.527 0.00024 99,333 24 99,321 5,514,539 55.528 0.00025 99,309 25 99,296 5,415,218 54.529 0.00027 99,284 27 99,270 5,315,921 53.530 0.00029 99,257 29 99,242 5,216,651 52.631 0.00032 99,227 31 99,212 5,117,409 51.632 0.00034 99,196 34 99,179 5,018,198 50.633 0.00038 99,162 37 99,143 4,919,019 49.634 0.00042 99,125 41 99,104 4,819,875 48.635 0.00046 99,083 45 99,061 4,720,771 47.636 0.00050 99,038 50 99,013 4,621,711 46.737 0.00055 98,988 54 98,961 4,522,698 45.738 0.00061 98,934 60 98,904 4,423,737 44.739 0.00067 98,874 67 98,840 4,324,833 43.73-16
Annex 3Age x(years)Table 6 Complete Life Table for <strong>Singapore</strong> Resident Females, 2004 (Continued)Number ofsurvivors atexact age xNumber ofdeaths betweenexact age x andage x+1Number ofperson-yearslived betweenexact age x andage x+1Totalperson-yearslived afterexact age xq x l x d x L x T x e xProbability ofdying betweenexact age x andage x+1Expectationof life atexact age x40 0.00074 98,807 73 98,771 4,225,992 42.841 0.00081 98,734 80 98,694 4,127,222 41.842 0.00089 98,654 88 98,610 4,028,528 40.843 0.00100 98,566 98 98,517 3,929,918 39.944 0.00111 98,468 109 98,413 3,831,401 38.945 0.00123 98,358 121 98,298 3,732,988 38.046 0.00135 98,238 133 98,171 3,634,690 37.047 0.00150 98,105 147 98,031 3,536,518 36.048 0.00169 97,958 165 97,875 3,438,487 35.149 0.00190 97,792 185 97,700 3,340,612 34.250 0.00211 97,607 206 97,504 3,242,912 33.251 0.00234 97,401 228 97,287 3,145,409 32.352 0.00258 97,173 251 97,048 3,048,121 31.453 0.00286 96,922 278 96,784 2,951,074 30.454 0.00317 96,645 306 96,492 2,854,290 29.555 0.00347 96,339 334 96,172 2,757,798 28.656 0.00380 96,004 364 95,822 2,661,627 27.757 0.00418 95,640 399 95,440 2,565,805 26.858 0.00464 95,240 442 95,019 2,470,365 25.959 0.00516 94,798 489 94,554 2,375,345 25.160 0.00568 94,309 536 94,041 2,280,792 24.261 0.00624 93,773 585 93,481 2,186,750 23.362 0.00691 93,188 643 92,866 2,093,270 22.563 0.00774 92,545 716 92,186 2,000,403 21.664 0.00867 91,828 796 91,430 1,908,217 20.865 0.00963 91,032 877 90,594 1,816,787 20.066 0.01063 90,155 959 89,676 1,726,193 19.167 0.01178 89,197 1,051 88,671 1,636,517 18.368 0.01314 88,146 1,159 87,567 1,547,846 17.669 0.01461 86,987 1,271 86,352 1,460,279 16.870 0.01610 85,716 1,380 85,026 1,373,928 16.071 0.01771 84,336 1,494 83,589 1,288,902 15.372 0.01973 82,842 1,635 82,025 1,205,313 14.573 0.02236 81,207 1,816 80,299 1,123,288 13.874 0.02534 79,392 2,011 78,386 1,042,988 13.175 0.02839 77,380 2,197 76,282 964,603 12.576 0.03158 75,184 2,374 73,996 888,321 11.877 0.03530 72,809 2,570 71,524 814,324 11.278 0.03986 70,239 2,800 68,840 742,800 10.679 0.04493 67,440 3,030 65,925 673,960 10.03-17
Annex 3Age x(years)Table 6 Complete Life Table for <strong>Singapore</strong> Resident Females, 2004 (Continued)Number ofsurvivors atexact age xNumber ofdeaths betweenexact age x andage x+1Number ofperson-yearslived betweenexact age x andage x+1Totalperson-yearslived afterexact age xq x l x d x L x T x e xProbability ofdying betweenexact age x andage x+1Expectationof life atexact age x80 0.05012 64,409 3,228 62,795 608,036 9.481 0.05534 61,181 3,386 59,488 545,240 8.982 0.06085 57,796 3,517 56,037 485,752 8.483 0.06699 54,279 3,636 52,461 429,715 7.984 0.07374 50,642 3,735 48,775 377,254 7.485 0.08104 46,908 3,801 45,007 328,479 7.086 0.08897 43,107 3,835 41,189 283,472 6.687 0.09757 39,271 3,832 37,355 242,283 6.288 0.10690 35,440 3,789 33,545 204,927 5.889 0.11700 31,651 3,703 29,799 171,382 5.490 0.12790 27,948 3,575 26,161 141,583 5.191 0.13967 24,373 3,404 22,671 115,422 4.792 0.15234 20,969 3,194 19,372 92,751 4.493 0.16595 17,775 2,950 16,300 73,379 4.194 0.18057 14,825 2,677 13,487 57,079 3.995 0.19621 12,148 2,384 10,956 43,593 3.696 0.21294 9,764 2,079 8,725 32,636 3.397 0.23077 7,685 1,774 6,798 23,912 3.198 0.24975 5,912 1,476 5,173 17,113 2.999 0.26991 4,435 1,197 3,837 11,940 2.7100+ 1.00000 3,238 3,238 8,103 8,103 2.53-18
Annex 3Age x(years)Table 7 Complete Life Table for <strong>Singapore</strong> Resident Population, 2005Number ofsurvivors atexact age xNumber ofdeaths betweenexact age x andage x+1Number ofperson-yearslived betweenexact age x andage x+1Totalperson-yearslived afterexact age xq x l x d x L x T x e xProbability ofdying betweenexact age x andage x+1Expectationof life atexact age x0 0.00229 100,000 229 99,812 8,007,308 80.11 0.00016 99,771 16 99,763 7,907,496 79.32 0.00016 99,755 16 99,747 7,807,733 78.33 0.00015 99,739 15 99,732 7,707,986 77.34 0.00014 99,724 13 99,718 7,608,254 76.35 0.00012 99,711 12 99,705 7,508,537 75.36 0.00011 99,699 11 99,693 7,408,832 74.37 0.00010 99,688 10 99,683 7,309,138 73.38 0.00010 99,678 10 99,673 7,209,455 72.39 0.00011 99,667 11 99,662 7,109,783 71.310 0.00012 99,656 12 99,651 7,010,121 70.311 0.00012 99,645 12 99,639 6,910,470 69.412 0.00014 99,632 14 99,626 6,810,832 68.413 0.00015 99,619 15 99,611 6,711,206 67.414 0.00017 99,603 17 99,595 6,611,595 66.415 0.00019 99,586 19 99,576 6,512,000 65.416 0.00022 99,567 22 99,556 6,412,424 64.417 0.00024 99,545 24 99,533 6,312,868 63.418 0.00027 99,521 27 99,507 6,213,335 62.419 0.00031 99,494 31 99,478 6,113,828 61.420 0.00035 99,463 35 99,445 6,014,349 60.521 0.00039 99,427 39 99,408 5,914,905 59.522 0.00041 99,389 41 99,368 5,815,497 58.523 0.00041 99,348 41 99,327 5,716,129 57.524 0.00040 99,306 40 99,286 5,616,802 56.625 0.00039 99,266 38 99,247 5,517,515 55.626 0.00037 99,228 37 99,210 5,418,268 54.627 0.00037 99,191 37 99,173 5,319,059 53.628 0.00039 99,154 38 99,135 5,219,886 52.629 0.00041 99,116 41 99,095 5,120,751 51.730 0.00044 99,075 44 99,053 5,021,656 50.731 0.00047 99,031 47 99,007 4,922,603 49.732 0.00051 98,984 50 98,959 4,823,596 48.733 0.00054 98,934 54 98,907 4,724,637 47.834 0.00058 98,880 58 98,851 4,625,730 46.835 0.00062 98,822 61 98,792 4,526,879 45.836 0.00066 98,761 66 98,728 4,428,087 44.837 0.00073 98,695 72 98,660 4,329,359 43.938 0.00081 98,624 80 98,584 4,230,700 42.939 0.00092 98,544 90 98,499 4,132,116 41.93-19
Annex 3Table 7 Complete Life Table for <strong>Singapore</strong> Resident Population, 2005 (Continued)Age x(years)Number ofsurvivors atexact age xNumber ofdeaths betweenexact age x andage x+1Number ofperson-yearslived betweenexact age x andage x+1Totalperson-yearslived afterexact age xq x l x d x L x T x e xProbability ofdying betweenexact age x andage x+1Expectationof life atexact age x40 0.00103 98,453 101 98,403 4,033,617 41.041 0.00114 98,352 112 98,297 3,935,215 40.042 0.00125 98,241 123 98,179 3,836,918 39.143 0.00138 98,118 135 98,050 3,738,739 38.144 0.00151 97,983 148 97,909 3,640,688 37.245 0.00164 97,835 160 97,755 3,542,780 36.246 0.00178 97,675 173 97,588 3,445,025 35.347 0.00196 97,502 191 97,406 3,347,436 34.348 0.00219 97,311 214 97,204 3,250,030 33.449 0.00247 97,097 240 96,977 3,152,826 32.550 0.00275 96,858 267 96,724 3,055,848 31.551 0.00305 96,591 294 96,444 2,959,124 30.652 0.00338 96,296 325 96,134 2,862,681 29.753 0.00376 95,971 361 95,790 2,766,547 28.854 0.00418 95,610 400 95,410 2,670,756 27.955 0.00461 95,210 439 94,991 2,575,347 27.056 0.00505 94,771 479 94,532 2,480,356 26.257 0.00559 94,292 527 94,029 2,385,824 25.358 0.00625 93,765 586 93,472 2,291,795 24.459 0.00699 93,179 652 92,853 2,198,323 23.660 0.00775 92,527 717 92,169 2,105,470 22.861 0.00854 91,810 784 91,418 2,013,301 21.962 0.00945 91,026 860 90,596 1,921,883 21.163 0.01053 90,166 950 89,691 1,831,287 20.364 0.01173 89,217 1,046 88,694 1,741,596 19.565 0.01295 88,170 1,142 87,599 1,652,902 18.766 0.01422 87,029 1,237 86,410 1,565,303 18.067 0.01562 85,791 1,340 85,121 1,478,893 17.268 0.01722 84,451 1,455 83,724 1,393,771 16.569 0.01893 82,997 1,571 82,211 1,310,047 15.870 0.02065 81,426 1,681 80,585 1,227,836 15.171 0.02249 79,745 1,793 78,848 1,147,250 14.472 0.02475 77,951 1,930 76,987 1,068,402 13.773 0.02765 76,022 2,102 74,971 991,415 13.074 0.03091 73,920 2,285 72,777 916,444 12.475 0.03425 71,635 2,453 70,408 843,667 11.876 0.03771 69,182 2,609 67,877 773,259 11.277 0.04168 66,573 2,775 65,185 705,382 10.678 0.04647 63,798 2,964 62,315 640,197 10.079 0.05175 60,833 3,148 59,259 577,881 9.53-20
Annex 3Table 7 Complete Life Table for <strong>Singapore</strong> Resident Population, 2005 (Continued)Age x(years)Number ofsurvivors atexact age xNumber ofdeaths betweenexact age x andage x+1Number ofperson-yearslived betweenexact age x andage x+1Totalperson-yearslived afterexact age xq x l x d x L x T x e xProbability ofdying betweenexact age x andage x+1Expectationof life atexact age x80 0.05714 57,685 3,296 56,037 518,622 9.081 0.06255 54,389 3,402 52,688 462,585 8.582 0.06818 50,987 3,476 49,249 409,897 8.083 0.07430 47,511 3,530 45,746 360,648 7.684 0.08091 43,981 3,559 42,202 314,902 7.285 0.08810 40,422 3,561 38,642 272,701 6.786 0.09589 36,861 3,535 35,094 234,059 6.387 0.10434 33,327 3,477 31,588 198,965 6.088 0.11348 29,849 3,387 28,156 167,377 5.689 0.12337 26,462 3,265 24,830 139,221 5.390 0.13406 23,197 3,110 21,642 114,391 4.991 0.14561 20,088 2,925 18,625 92,749 4.692 0.15806 17,163 2,713 15,806 74,124 4.393 0.17148 14,450 2,478 13,211 58,317 4.094 0.18592 11,972 2,226 10,859 45,106 3.895 0.20145 9,746 1,963 8,764 34,247 3.596 0.21811 7,783 1,698 6,934 25,483 3.397 0.23597 6,085 1,436 5,367 18,549 3.098 0.25508 4,649 1,186 4,056 13,182 2.899 0.27549 3,463 954 2,986 9,125 2.6100+ 1.00000 2,509 2,509 6,139 6,139 2.43-21
Annex 3Age x(years)Table 8 Complete Life Table for <strong>Singapore</strong> Resident Males, 2005Number ofsurvivors atexact age xNumber ofdeaths betweenexact age x andage x+1Number ofperson-yearslived betweenexact age x andage x+1Totalperson-yearslived afterexact age xq x l x d x L x T x e xProbability ofdying betweenexact age x andage x+1Expectationof life atexact age x0 0.00253 100,000 253 99,792 7,759,262 77.61 0.00017 99,747 17 99,738 7,659,470 76.82 0.00016 99,730 16 99,722 7,559,731 75.83 0.00015 99,714 15 99,706 7,460,009 74.84 0.00014 99,699 14 99,692 7,360,303 73.85 0.00012 99,685 12 99,679 7,260,611 72.86 0.00011 99,673 11 99,668 7,160,932 71.87 0.00010 99,662 10 99,657 7,061,264 70.98 0.00010 99,652 10 99,647 6,961,607 69.99 0.00011 99,642 11 99,637 6,861,960 68.910 0.00012 99,631 12 99,625 6,762,323 67.911 0.00013 99,619 13 99,613 6,662,698 66.912 0.00015 99,606 15 99,599 6,563,086 65.913 0.00017 99,592 17 99,583 6,463,487 64.914 0.00020 99,575 20 99,565 6,363,904 63.915 0.00023 99,555 23 99,544 6,264,339 62.916 0.00026 99,532 26 99,519 6,164,795 61.917 0.00030 99,506 30 99,492 6,065,276 61.018 0.00035 99,477 35 99,459 5,965,784 60.019 0.00042 99,442 41 99,421 5,866,325 59.020 0.00048 99,400 48 99,376 5,766,904 58.021 0.00054 99,352 54 99,325 5,667,528 57.022 0.00058 99,298 58 99,269 5,568,202 56.123 0.00058 99,240 58 99,211 5,468,933 55.124 0.00056 99,182 56 99,155 5,369,722 54.125 0.00053 99,127 53 99,100 5,270,567 53.226 0.00051 99,074 50 99,049 5,171,467 52.227 0.00050 99,024 49 98,999 5,072,418 51.228 0.00051 98,975 51 98,949 4,973,418 50.229 0.00054 98,924 54 98,897 4,874,469 49.330 0.00058 98,870 57 98,841 4,775,573 48.331 0.00061 98,813 60 98,783 4,676,731 47.332 0.00065 98,753 64 98,721 4,577,949 46.433 0.00069 98,689 69 98,654 4,479,228 45.434 0.00075 98,620 74 98,583 4,380,574 44.435 0.00080 98,546 79 98,507 4,281,990 43.536 0.00086 98,468 84 98,426 4,183,483 42.537 0.00093 98,383 92 98,338 4,085,058 41.538 0.00104 98,292 102 98,241 3,986,720 40.639 0.00116 98,190 114 98,133 3,888,480 39.63-22
Annex 3Age x(years)Table 8 Complete Life Table for <strong>Singapore</strong> Resident Males, 2005 (Continued)Number ofsurvivors atexact age xNumber ofdeaths betweenexact age x andage x+1Number ofperson-yearslived betweenexact age x andage x+1Totalperson-yearslived afterexact age xq x l x d x L x T x e xProbability ofdying betweenexact age x andage x+1Expectationof life atexact age x40 0.00129 98,076 127 98,012 3,790,347 38.641 0.00142 97,949 139 97,879 3,692,335 37.742 0.00156 97,810 153 97,733 3,594,456 36.743 0.00171 97,657 167 97,573 3,496,722 35.844 0.00187 97,489 182 97,398 3,399,149 34.945 0.00203 97,307 197 97,208 3,301,751 33.946 0.00220 97,110 213 97,003 3,204,543 33.047 0.00242 96,896 235 96,779 3,107,540 32.148 0.00272 96,662 263 96,530 3,010,761 31.149 0.00307 96,399 296 96,251 2,914,231 30.250 0.00343 96,102 330 95,937 2,817,980 29.351 0.00381 95,773 365 95,590 2,722,042 28.452 0.00423 95,408 404 95,206 2,626,452 27.553 0.00473 95,004 450 94,779 2,531,247 26.654 0.00528 94,554 499 94,305 2,436,468 25.855 0.00583 94,055 548 93,781 2,342,163 24.956 0.00641 93,507 600 93,207 2,248,382 24.057 0.00711 92,907 661 92,577 2,155,174 23.258 0.00798 92,247 736 91,879 2,062,597 22.459 0.00894 91,511 818 91,102 1,970,718 21.560 0.00993 90,692 901 90,242 1,879,617 20.761 0.01097 89,792 985 89,299 1,789,375 19.962 0.01217 88,807 1,080 88,267 1,700,075 19.163 0.01362 87,726 1,195 87,129 1,611,809 18.464 0.01524 86,531 1,319 85,872 1,524,680 17.665 0.01690 85,213 1,440 84,493 1,438,808 16.966 0.01860 83,773 1,558 82,993 1,354,315 16.267 0.02046 82,214 1,682 81,373 1,271,322 15.568 0.02255 80,532 1,816 79,624 1,189,949 14.869 0.02475 78,716 1,949 77,742 1,110,325 14.170 0.02698 76,767 2,071 75,732 1,032,583 13.571 0.02934 74,696 2,191 73,601 956,851 12.872 0.03219 72,505 2,334 71,338 883,251 12.273 0.03578 70,171 2,511 68,916 811,913 11.674 0.03979 67,660 2,692 66,314 742,997 11.075 0.04390 64,968 2,852 63,542 676,683 10.476 0.04814 62,116 2,990 60,621 613,141 9.977 0.05289 59,126 3,127 57,562 552,520 9.378 0.05848 55,998 3,275 54,361 494,959 8.879 0.06457 52,724 3,404 51,022 440,597 8.43-23
Annex 3Age x(years)Table 8 Complete Life Table for <strong>Singapore</strong> Resident Males, 2005 (Continued)Number ofsurvivors atexact age xNumber ofdeaths betweenexact age x andage x+1Number ofperson-yearslived betweenexact age x andage x+1Totalperson-yearslived afterexact age xq x l x d x L x T x e xProbability ofdying betweenexact age x andage x+1Expectationof life atexact age x80 0.07075 49,320 3,489 47,575 389,576 7.981 0.07697 45,830 3,527 44,067 342,001 7.582 0.08352 42,303 3,533 40,536 297,934 7.083 0.09076 38,770 3,519 37,010 257,398 6.684 0.09869 35,251 3,479 33,511 220,388 6.385 0.10720 31,772 3,406 30,069 186,877 5.986 0.11639 28,366 3,301 26,715 156,808 5.587 0.12631 25,065 3,166 23,482 130,092 5.288 0.13702 21,899 3,001 20,398 106,611 4.989 0.14857 18,898 2,808 17,494 86,213 4.690 0.16100 16,090 2,591 14,795 68,718 4.391 0.17437 13,500 2,354 12,323 53,923 4.092 0.18874 11,146 2,104 10,094 41,601 3.793 0.20416 9,042 1,846 8,119 31,507 3.594 0.22068 7,196 1,588 6,402 23,388 3.395 0.23837 5,608 1,337 4,940 16,986 3.096 0.25726 4,271 1,099 3,722 12,046 2.897 0.27741 3,172 880 2,732 8,324 2.698 0.29886 2,292 685 1,950 5,592 2.499 0.32167 1,607 517 1,349 3,642 2.3100+ 1.00000 1,090 1,090 2,293 2,293 2.13-24
Annex 3Age x(years)Table 9 Complete Life Table for <strong>Singapore</strong> Resident Females, 2005Number ofsurvivors atexact age xNumber ofdeaths betweenexact age x andage x+1Number ofperson-yearslived betweenexact age x andage x+1Totalperson-yearslived afterexact age xq x l x d x L x T x e xProbability ofdying betweenexact age x andage x+1Expectationof life atexact age x0 0.00203 100,000 203 99,833 8,245,565 82.51 0.00016 99,797 16 99,789 8,145,732 81.62 0.00015 99,781 15 99,773 8,045,943 80.63 0.00014 99,766 14 99,759 7,946,169 79.64 0.00013 99,751 13 99,745 7,846,411 78.75 0.00012 99,738 12 99,732 7,746,666 77.76 0.00011 99,726 11 99,721 7,646,934 76.77 0.00010 99,715 10 99,710 7,547,213 75.78 0.00010 99,705 10 99,699 7,447,503 74.79 0.00011 99,694 11 99,689 7,347,804 73.710 0.00011 99,683 11 99,678 7,248,115 72.711 0.00012 99,672 12 99,666 7,148,437 71.712 0.00013 99,660 13 99,654 7,048,771 70.713 0.00014 99,647 14 99,641 6,949,118 69.714 0.00015 99,634 15 99,627 6,849,477 68.715 0.00016 99,619 16 99,611 6,749,850 67.816 0.00017 99,603 17 99,595 6,650,239 66.817 0.00018 99,586 18 99,577 6,550,644 65.818 0.00020 99,568 19 99,558 6,451,067 64.819 0.00021 99,549 21 99,538 6,351,509 63.820 0.00022 99,528 22 99,517 6,251,971 62.821 0.00023 99,506 23 99,494 6,152,454 61.822 0.00024 99,483 24 99,471 6,052,959 60.823 0.00024 99,459 24 99,447 5,953,488 59.924 0.00025 99,435 24 99,423 5,854,042 58.925 0.00024 99,410 24 99,398 5,754,619 57.926 0.00025 99,386 24 99,374 5,655,221 56.927 0.00025 99,361 25 99,349 5,555,847 55.928 0.00027 99,336 27 99,323 5,456,498 54.929 0.00030 99,309 29 99,294 5,357,176 53.930 0.00032 99,280 32 99,264 5,257,881 53.031 0.00035 99,248 35 99,230 5,158,617 52.032 0.00037 99,213 37 99,195 5,059,387 51.033 0.00040 99,176 40 99,156 4,960,192 50.034 0.00043 99,136 42 99,115 4,861,036 49.035 0.00045 99,094 45 99,072 4,761,921 48.136 0.00048 99,049 48 99,026 4,662,849 47.137 0.00052 99,002 52 98,976 4,563,824 46.138 0.00059 98,950 59 98,921 4,464,848 45.139 0.00067 98,892 67 98,858 4,365,927 44.13-25
Annex 3Age x(years)Table 9 Complete Life Table for <strong>Singapore</strong> Resident Females, 2005 (Continued)Number ofsurvivors atexact age xNumber ofdeaths betweenexact age x andage x+1Number ofperson-yearslived betweenexact age x andage x+1Totalperson-yearslived afterexact age xq x l x d x L x T x e xProbability ofdying betweenexact age x andage x+1Expectationof life atexact age x40 0.00076 98,825 75 98,787 4,267,069 43.241 0.00085 98,750 83 98,708 4,168,281 42.242 0.00094 98,666 92 98,620 4,069,573 41.243 0.00103 98,574 102 98,523 3,970,953 40.344 0.00114 98,472 112 98,416 3,872,429 39.345 0.00124 98,360 122 98,299 3,774,013 38.446 0.00135 98,239 132 98,173 3,675,714 37.447 0.00148 98,107 145 98,034 3,577,541 36.548 0.00166 97,961 162 97,880 3,479,507 35.549 0.00185 97,799 181 97,708 3,381,627 34.650 0.00206 97,618 201 97,517 3,283,919 33.651 0.00227 97,416 221 97,306 3,186,402 32.752 0.00251 97,195 244 97,073 3,089,096 31.853 0.00279 96,951 270 96,816 2,992,023 30.954 0.00308 96,681 298 96,532 2,895,207 29.955 0.00338 96,383 326 96,220 2,798,675 29.056 0.00370 96,057 355 95,880 2,702,455 28.157 0.00408 95,702 391 95,507 2,606,575 27.258 0.00456 95,311 435 95,094 2,511,069 26.359 0.00509 94,877 483 94,635 2,415,975 25.560 0.00565 94,393 533 94,127 2,321,340 24.661 0.00622 93,860 584 93,569 2,227,213 23.762 0.00686 93,277 640 92,957 2,133,644 22.963 0.00762 92,637 706 92,284 2,040,687 22.064 0.00844 91,931 776 91,543 1,948,403 21.265 0.00928 91,155 846 90,732 1,856,860 20.466 0.01017 90,309 918 89,850 1,766,129 19.667 0.01120 89,391 1,001 88,890 1,676,279 18.868 0.01244 88,390 1,099 87,840 1,587,389 18.069 0.01378 87,290 1,203 86,689 1,499,549 17.270 0.01515 86,087 1,304 85,435 1,412,860 16.471 0.01663 84,783 1,410 84,078 1,327,425 15.772 0.01852 83,373 1,544 82,601 1,243,348 14.973 0.02102 81,829 1,720 80,969 1,160,747 14.274 0.02387 80,109 1,912 79,153 1,079,778 13.575 0.02679 78,196 2,095 77,149 1,000,626 12.876 0.02985 76,101 2,272 74,965 923,477 12.177 0.03342 73,829 2,468 72,596 848,511 11.578 0.03782 71,362 2,699 70,012 775,916 10.979 0.04272 68,663 2,933 67,196 705,904 10.33-26
Annex 3Age x(years)Table 9 Complete Life Table for <strong>Singapore</strong> Resident Females, 2005 (Continued)Number ofsurvivors atexact age xNumber ofdeaths betweenexact age x andage x+1Number ofperson-yearslived betweenexact age x andage x+1Totalperson-yearslived afterexact age xq x l x d x L x T x e xProbability ofdying betweenexact age x andage x+1Expectationof life atexact age x80 0.04774 65,729 3,138 64,160 638,708 9.781 0.05277 62,592 3,303 60,940 574,547 9.282 0.05806 59,288 3,442 57,567 513,607 8.783 0.06388 55,846 3,568 54,062 456,040 8.284 0.07024 52,278 3,672 50,443 401,978 7.785 0.07715 48,607 3,750 46,732 351,535 7.286 0.08468 44,857 3,799 42,957 304,804 6.887 0.09288 41,058 3,813 39,151 261,846 6.488 0.10178 37,245 3,791 35,349 222,695 6.089 0.11144 33,454 3,728 31,590 187,346 5.690 0.12191 29,726 3,624 27,914 155,756 5.291 0.13324 26,102 3,478 24,363 127,842 4.992 0.14548 22,624 3,291 20,979 103,479 4.693 0.15868 19,333 3,068 17,799 82,501 4.394 0.17291 16,265 2,812 14,859 64,702 4.095 0.18820 13,453 2,532 12,187 49,843 3.796 0.20462 10,921 2,235 9,804 37,656 3.497 0.22220 8,686 1,930 7,721 27,852 3.298 0.24101 6,756 1,628 5,942 20,131 3.099 0.26107 5,128 1,339 4,459 14,189 2.8100+ 1.00000 3,789 3,789 9,730 9,730 2.63-27
Annex 3Table 10 Complete Life Table for <strong>Singapore</strong> Resident Population, 2006 (Preliminary)Age x(years)Number ofsurvivors atexact age xNumber ofdeaths betweenexact age x andage x+1Number ofperson-yearslived betweenexact age x andage x+1Totalperson-yearslived afterexact age xq x l x d x L x T x e xProbability ofdying betweenexact age x andage x+1Expectationof life atexact age x0 0.00239 100,000 239 99,804 8,043,234 80.41 0.00014 99,761 14 99,754 7,943,430 79.62 0.00014 99,747 14 99,740 7,843,675 78.63 0.00013 99,733 13 99,727 7,743,935 77.64 0.00013 99,720 13 99,714 7,644,208 76.75 0.00012 99,707 12 99,701 7,544,495 75.76 0.00011 99,696 11 99,690 7,444,793 74.77 0.00011 99,685 11 99,679 7,345,103 73.78 0.00011 99,674 11 99,669 7,245,424 72.79 0.00011 99,663 11 99,657 7,145,755 71.710 0.00012 99,652 12 99,646 7,046,098 70.711 0.00013 99,640 13 99,633 6,946,452 69.712 0.00014 99,627 14 99,620 6,846,819 68.713 0.00015 99,613 15 99,606 6,747,199 67.714 0.00016 99,598 16 99,590 6,647,593 66.715 0.00018 99,582 18 99,573 6,548,003 65.816 0.00020 99,564 19 99,554 6,448,430 64.817 0.00022 99,545 22 99,534 6,348,875 63.818 0.00025 99,523 25 99,511 6,249,341 62.819 0.00029 99,498 29 99,484 6,149,831 61.820 0.00033 99,470 33 99,453 6,050,347 60.821 0.00037 99,437 37 99,418 5,950,894 59.822 0.00039 99,400 39 99,380 5,851,475 58.923 0.00040 99,361 40 99,341 5,752,095 57.924 0.00040 99,321 39 99,301 5,652,754 56.925 0.00039 99,281 39 99,262 5,553,453 55.926 0.00038 99,243 38 99,224 5,454,191 55.027 0.00039 99,205 38 99,186 5,354,967 54.028 0.00040 99,167 40 99,147 5,255,781 53.029 0.00042 99,127 42 99,106 5,156,634 52.030 0.00045 99,085 45 99,062 5,057,528 51.031 0.00048 99,040 47 99,017 4,958,466 50.132 0.00051 98,993 50 98,968 4,859,449 49.133 0.00054 98,943 54 98,916 4,760,481 48.134 0.00058 98,889 58 98,860 4,661,565 47.135 0.00062 98,832 62 98,801 4,562,705 46.236 0.00067 98,770 66 98,737 4,463,904 45.237 0.00073 98,704 72 98,668 4,365,167 44.238 0.00081 98,633 80 98,593 4,266,498 43.339 0.00091 98,553 89 98,508 4,167,906 42.33-28
Annex 3Table 10 Complete Life Table for <strong>Singapore</strong> Resident Population, 2006 (Preliminary)(Continued)Age x(years)Number ofsurvivors atexact age xNumber ofdeaths betweenexact age x andage x+1Number ofperson-yearslived betweenexact age x andage x+1Totalperson-yearslived afterexact age xq x l x d x L x T x e xProbability ofdying betweenexact age x andage x+1Expectationof life atexact age x40 0.00101 98,463 99 98,414 4,069,398 41.341 0.00111 98,364 109 98,309 3,970,984 40.442 0.00122 98,255 120 98,195 3,872,674 39.443 0.00135 98,134 132 98,068 3,774,480 38.544 0.00148 98,002 145 97,930 3,676,412 37.545 0.00161 97,858 157 97,779 3,578,481 36.646 0.00174 97,701 170 97,615 3,480,702 35.647 0.00192 97,530 187 97,437 3,383,087 34.748 0.00215 97,343 209 97,238 3,285,650 33.849 0.00241 97,134 234 97,017 3,188,412 32.850 0.00268 96,899 260 96,769 3,091,396 31.951 0.00296 96,639 286 96,496 2,994,626 31.052 0.00327 96,353 316 96,195 2,898,130 30.153 0.00363 96,038 349 95,863 2,801,935 29.254 0.00402 95,689 384 95,496 2,706,072 28.355 0.00441 95,304 420 95,094 2,610,575 27.456 0.00482 94,884 457 94,656 2,515,481 26.557 0.00533 94,427 503 94,175 2,420,825 25.658 0.00598 93,924 562 93,643 2,326,650 24.859 0.00672 93,362 628 93,048 2,233,007 23.960 0.00749 92,734 695 92,387 2,139,959 23.161 0.00828 92,040 762 91,659 2,047,572 22.262 0.00913 91,278 834 90,861 1,955,913 21.463 0.01010 90,444 914 89,988 1,865,052 20.664 0.01113 89,531 997 89,033 1,775,064 19.865 0.01217 88,534 1,078 87,995 1,686,032 19.066 0.01327 87,457 1,161 86,876 1,598,036 18.367 0.01459 86,296 1,259 85,666 1,511,160 17.568 0.01620 85,037 1,378 84,348 1,425,494 16.869 0.01799 83,659 1,505 82,906 1,341,146 16.070 0.01982 82,154 1,628 81,340 1,258,239 15.371 0.02174 80,526 1,751 79,650 1,176,900 14.672 0.02403 78,775 1,893 77,829 1,097,249 13.973 0.02686 76,882 2,065 75,850 1,019,421 13.374 0.03001 74,817 2,245 73,695 943,571 12.675 0.03323 72,572 2,411 71,366 869,876 12.076 0.03656 70,161 2,565 68,878 798,510 11.477 0.04033 67,596 2,726 66,232 729,632 10.878 0.04481 64,869 2,907 63,416 663,399 10.279 0.04970 61,963 3,079 60,423 599,983 9.73-29
Annex 3Table 10 Complete Life Table for <strong>Singapore</strong> Resident Population, 2006 (Preliminary)(Continued)Age x(years)Number ofsurvivors atexact age xNumber ofdeaths betweenexact age x andage x+1Number ofperson-yearslived betweenexact age x andage x+1Totalperson-yearslived afterexact age xq x l x d x L x T x e xProbability ofdying betweenexact age x andage x+1Expectationof life atexact age x80 0.05467 58,883 3,219 57,274 539,560 9.281 0.05969 55,664 3,323 54,003 482,286 8.782 0.06507 52,342 3,406 50,639 428,283 8.283 0.07114 48,936 3,482 47,195 377,645 7.784 0.07792 45,455 3,542 43,684 330,449 7.385 0.08516 41,913 3,569 40,128 286,766 6.886 0.09302 38,344 3,567 36,560 246,637 6.487 0.10156 34,777 3,532 33,011 210,077 6.088 0.11081 31,245 3,462 29,514 177,066 5.789 0.12084 27,782 3,357 26,104 147,553 5.390 0.13168 24,425 3,216 22,817 121,449 5.091 0.14339 21,209 3,041 19,688 98,632 4.792 0.15604 18,168 2,835 16,750 78,943 4.393 0.16967 15,333 2,601 14,032 62,193 4.194 0.18433 12,731 2,347 11,558 48,161 3.895 0.20010 10,385 2,078 9,346 36,603 3.596 0.21701 8,307 1,803 7,405 27,257 3.397 0.23513 6,504 1,529 5,739 19,852 3.198 0.25450 4,975 1,266 4,342 14,112 2.899 0.27518 3,709 1,021 3,198 9,771 2.6100+ 1.00000 2,688 2,688 6,572 6,572 2.43-30
Annex 3Age x(years)Table 11 Complete Life Table for <strong>Singapore</strong> Resident Males, 2006 (Preliminary)Number ofsurvivors atexact age xNumber ofdeaths betweenexact age x andage x+1Number ofperson-yearslived betweenexact age x andage x+1Totalperson-yearslived afterexact age xq x l x d x L x T x e xProbability ofdying betweenexact age x andage x+1Expectationof life atexact age x0 0.00265 100,000 265 99,782 7,797,682 78.01 0.00015 99,735 15 99,727 7,697,899 77.22 0.00015 99,720 14 99,713 7,598,172 76.23 0.00014 99,705 14 99,698 7,498,460 75.24 0.00013 99,692 13 99,685 7,398,761 74.25 0.00012 99,679 12 99,673 7,299,076 73.26 0.00011 99,667 11 99,662 7,199,403 72.27 0.00010 99,657 10 99,651 7,099,741 71.28 0.00011 99,646 11 99,641 7,000,090 70.29 0.00012 99,635 12 99,630 6,900,449 69.310 0.00013 99,624 13 99,617 6,800,819 68.311 0.00014 99,611 14 99,603 6,701,202 67.312 0.00016 99,596 16 99,588 6,601,599 66.313 0.00018 99,580 18 99,572 6,502,010 65.314 0.00020 99,563 20 99,553 6,402,439 64.315 0.00022 99,543 22 99,531 6,302,886 63.316 0.00025 99,520 25 99,508 6,203,355 62.317 0.00028 99,495 28 99,481 6,103,847 61.318 0.00033 99,467 33 99,451 6,004,366 60.419 0.00039 99,434 39 99,415 5,904,915 59.420 0.00046 99,395 45 99,372 5,805,500 58.421 0.00052 99,350 51 99,324 5,706,128 57.422 0.00055 99,299 55 99,271 5,606,804 56.523 0.00056 99,244 56 99,216 5,507,533 55.524 0.00055 99,188 55 99,161 5,408,317 54.525 0.00053 99,133 53 99,107 5,309,157 53.626 0.00052 99,081 51 99,055 5,210,050 52.627 0.00052 99,029 51 99,004 5,110,995 51.628 0.00053 98,978 52 98,952 5,011,991 50.629 0.00055 98,926 54 98,899 4,913,039 49.730 0.00057 98,872 56 98,844 4,814,140 48.731 0.00059 98,816 58 98,787 4,715,296 47.732 0.00062 98,758 62 98,727 4,616,509 46.733 0.00067 98,696 67 98,663 4,517,782 45.834 0.00074 98,629 73 98,593 4,419,120 44.835 0.00080 98,557 79 98,517 4,320,527 43.836 0.00087 98,478 85 98,436 4,222,009 42.937 0.00095 98,393 93 98,346 4,123,574 41.938 0.00105 98,300 103 98,248 4,025,227 40.939 0.00116 98,197 114 98,140 3,926,979 40.03-31
Annex 3Age x(years)Table 11 Complete Life Table for <strong>Singapore</strong> Resident Males, 2006 (Preliminary)(Continued)Number ofsurvivors atexact age xNumber ofdeaths betweenexact age x andage x+1Number ofperson-yearslived betweenexact age x andage x+1Totalperson-yearslived afterexact age xq x l x d x L x T x e xProbability ofdying betweenexact age x andage x+1Expectationof life atexact age x40 0.00128 98,083 126 98,020 3,828,839 39.041 0.00140 97,957 137 97,889 3,730,819 38.142 0.00154 97,820 150 97,745 3,632,930 37.143 0.00169 97,670 165 97,587 3,535,186 36.244 0.00185 97,505 180 97,415 3,437,598 35.345 0.00201 97,325 195 97,227 3,340,184 34.346 0.00218 97,129 212 97,024 3,242,957 33.447 0.00240 96,918 233 96,801 3,145,933 32.548 0.00269 96,685 260 96,555 3,049,132 31.549 0.00302 96,425 291 96,280 2,952,577 30.650 0.00336 96,134 323 95,972 2,856,297 29.751 0.00372 95,811 356 95,633 2,760,325 28.852 0.00412 95,455 393 95,258 2,664,692 27.953 0.00459 95,061 437 94,843 2,569,434 27.054 0.00511 94,625 483 94,383 2,474,591 26.255 0.00563 94,141 530 93,876 2,380,208 25.356 0.00618 93,612 579 93,322 2,286,331 24.457 0.00685 93,033 637 92,714 2,193,009 23.658 0.00767 92,396 709 92,041 2,100,295 22.759 0.00860 91,687 788 91,293 2,008,254 21.960 0.00955 90,898 868 90,464 1,916,961 21.161 0.01053 90,031 948 89,556 1,826,497 20.362 0.01166 89,082 1,039 88,563 1,736,940 19.563 0.01301 88,043 1,146 87,471 1,648,378 18.764 0.01449 86,898 1,259 86,268 1,560,907 18.065 0.01600 85,639 1,371 84,953 1,474,638 17.266 0.01757 84,268 1,481 83,528 1,389,685 16.567 0.01933 82,787 1,600 81,987 1,306,157 15.868 0.02137 81,187 1,735 80,320 1,224,170 15.169 0.02357 79,452 1,872 78,516 1,143,850 14.470 0.02580 77,580 2,001 76,579 1,065,334 13.771 0.02814 75,579 2,127 74,515 988,755 13.172 0.03089 73,452 2,269 72,317 914,240 12.473 0.03425 71,183 2,438 69,964 841,923 11.874 0.03794 68,745 2,608 67,441 771,959 11.275 0.04170 66,136 2,758 64,758 704,519 10.776 0.04561 63,379 2,891 61,933 639,761 10.177 0.05016 60,488 3,034 58,971 577,828 9.678 0.05569 57,454 3,200 55,854 518,857 9.079 0.06181 54,254 3,354 52,578 463,003 8.53-32
Annex 3Age x(years)Table 11 Complete Life Table for <strong>Singapore</strong> Resident Males, 2006 (Preliminary)(Continued)Number ofsurvivors atexact age xNumber ofdeaths betweenexact age x andage x+1Number ofperson-yearslived betweenexact age x andage x+1Totalperson-yearslived afterexact age xq x l x d x L x T x e xProbability ofdying betweenexact age x andage x+1Expectationof life atexact age x80 0.06804 50,901 3,463 49,169 410,425 8.181 0.07424 47,438 3,522 45,677 361,256 7.682 0.08069 43,916 3,544 42,144 315,579 7.283 0.08775 40,372 3,543 38,601 273,435 6.884 0.09554 36,830 3,519 35,070 234,834 6.485 0.10391 33,311 3,461 31,580 199,763 6.086 0.11296 29,850 3,372 28,164 168,183 5.687 0.12276 26,478 3,250 24,853 140,019 5.388 0.13334 23,228 3,097 21,679 115,167 5.089 0.14476 20,130 2,914 18,673 93,487 4.690 0.15708 17,216 2,704 15,864 74,814 4.391 0.17036 14,512 2,472 13,276 58,950 4.192 0.18464 12,040 2,223 10,928 45,674 3.893 0.19999 9,817 1,963 8,835 34,746 3.594 0.21646 7,854 1,700 7,004 25,911 3.395 0.23411 6,154 1,441 5,433 18,907 3.196 0.25300 4,713 1,192 4,117 13,474 2.997 0.27317 3,521 962 3,040 9,357 2.798 0.29469 2,559 754 2,182 6,317 2.599 0.31758 1,805 573 1,518 4,135 2.3100+ 1.00000 1,232 1,232 2,617 2,617 2.13-33
Annex 3Table 12 Complete Life Table for <strong>Singapore</strong> Resident Females, 2006 (Preliminary)Age x(years)Number ofsurvivors atexact age xNumber ofdeaths betweenexact age x andage x+1Number ofperson-yearslived betweenexact age x andage x+1Totalperson-yearslived afterexact age xq x l x d x L x T x e xProbability ofdying betweenexact age x andage x+1Expectationof life atexact age x0 0.00210 100,000 210 99,828 8,276,021 82.81 0.00014 99,790 14 99,783 8,176,193 81.92 0.00013 99,776 13 99,770 8,076,410 80.93 0.00013 99,763 13 99,756 7,976,641 80.04 0.00012 99,750 12 99,744 7,876,885 79.05 0.00012 99,737 12 99,731 7,777,141 78.06 0.00011 99,725 11 99,720 7,677,410 77.07 0.00011 99,714 11 99,709 7,577,690 76.08 0.00011 99,703 11 99,698 7,477,981 75.09 0.00011 99,692 11 99,687 7,378,284 74.010 0.00011 99,681 11 99,676 7,278,597 73.011 0.00011 99,670 11 99,665 7,178,921 72.012 0.00011 99,659 11 99,653 7,079,257 71.013 0.00012 99,648 12 99,642 6,979,603 70.014 0.00012 99,636 12 99,630 6,879,961 69.115 0.00013 99,624 13 99,617 6,780,331 68.116 0.00014 99,611 14 99,604 6,680,714 67.117 0.00015 99,597 15 99,589 6,581,110 66.118 0.00016 99,582 16 99,574 6,481,521 65.119 0.00018 99,566 18 99,557 6,381,947 64.120 0.00020 99,548 20 99,538 6,282,390 63.121 0.00022 99,528 22 99,517 6,182,852 62.122 0.00023 99,506 23 99,495 6,083,335 61.123 0.00024 99,483 24 99,471 5,983,840 60.124 0.00025 99,459 24 99,447 5,884,369 59.225 0.00025 99,435 25 99,422 5,784,922 58.226 0.00025 99,410 25 99,397 5,685,499 57.227 0.00027 99,385 26 99,371 5,586,102 56.228 0.00029 99,358 29 99,344 5,486,730 55.229 0.00031 99,330 31 99,314 5,387,387 54.230 0.00034 99,298 34 99,281 5,288,072 53.331 0.00037 99,264 37 99,246 5,188,791 52.332 0.00040 99,228 39 99,208 5,089,545 51.333 0.00042 99,188 42 99,168 4,990,337 50.334 0.00044 99,147 43 99,125 4,891,169 49.335 0.00046 99,103 45 99,081 4,792,044 48.436 0.00048 99,058 47 99,035 4,692,963 47.437 0.00052 99,011 51 98,985 4,593,929 46.438 0.00058 98,960 57 98,931 4,494,943 45.439 0.00066 98,903 65 98,870 4,396,012 44.43-34
Annex 3Table 12 Complete Life Table for <strong>Singapore</strong> Resident Females, 2006 (Preliminary)(Continued)Age x(years)Number ofsurvivors atexact age xNumber ofdeaths betweenexact age x andage x+1Number ofperson-yearslived betweenexact age x andage x+1Totalperson-yearslived afterexact age xq x l x d x L x T x e xProbability ofdying betweenexact age x andage x+1Expectationof life atexact age x40 0.00074 98,838 73 98,801 4,297,142 43.541 0.00082 98,765 81 98,724 4,198,341 42.542 0.00091 98,684 89 98,639 4,099,616 41.543 0.00100 98,594 99 98,545 4,000,977 40.644 0.00110 98,496 108 98,442 3,902,432 39.645 0.00120 98,388 118 98,329 3,803,990 38.746 0.00130 98,270 128 98,206 3,705,661 37.747 0.00143 98,142 140 98,072 3,607,455 36.848 0.00160 98,002 157 97,924 3,509,383 35.849 0.00179 97,845 175 97,758 3,411,459 34.950 0.00199 97,670 194 97,573 3,313,702 33.951 0.00220 97,476 214 97,369 3,216,129 33.052 0.00242 97,262 235 97,144 3,118,760 32.153 0.00266 97,027 258 96,897 3,021,616 31.154 0.00292 96,768 283 96,627 2,924,719 30.255 0.00318 96,485 307 96,332 2,828,092 29.356 0.00346 96,179 333 96,012 2,731,760 28.457 0.00382 95,846 366 95,663 2,635,747 27.558 0.00431 95,480 412 95,274 2,540,084 26.659 0.00488 95,068 464 94,836 2,444,810 25.760 0.00548 94,604 519 94,344 2,349,974 24.861 0.00609 94,085 573 93,799 2,255,630 24.062 0.00670 93,512 627 93,199 2,161,831 23.163 0.00735 92,886 682 92,544 2,068,632 22.364 0.00799 92,203 737 91,835 1,976,088 21.465 0.00863 91,466 789 91,072 1,884,253 20.666 0.00934 90,677 847 90,254 1,793,181 19.867 0.01029 89,830 924 89,368 1,702,928 19.068 0.01158 88,906 1,030 88,391 1,613,559 18.169 0.01308 87,876 1,149 87,302 1,525,168 17.470 0.01461 86,727 1,267 86,094 1,437,866 16.671 0.01624 85,460 1,388 84,766 1,351,773 15.872 0.01823 84,072 1,533 83,306 1,267,006 15.173 0.02077 82,540 1,714 81,683 1,183,700 14.374 0.02364 80,825 1,911 79,870 1,102,018 13.675 0.02660 78,915 2,099 77,865 1,022,148 13.076 0.02964 76,816 2,277 75,677 944,283 12.377 0.03303 74,539 2,462 73,308 868,605 11.778 0.03696 72,077 2,664 70,745 795,297 11.079 0.04119 69,413 2,859 67,983 724,552 10.43-35
Annex 3Table 12 Complete Life Table for <strong>Singapore</strong> Resident Females, 2006 (Preliminary)(Continued)Age x(years)Probability ofdying betweenexact age x andage x+1Number ofsurvivors atexact age xNumber ofdeaths betweenexact age x andage x+1Number ofperson-yearslived betweenexact age x andage x+1Totalperson-yearslived afterexact age xExpectationof life atexact age xq x l x d x L x T x e x80 0.04548 66,554 3,027 65,040 656,569 9.981 0.04986 63,527 3,167 61,943 591,529 9.382 0.05475 60,360 3,305 58,707 529,585 8.883 0.06060 57,055 3,458 55,326 470,878 8.384 0.06739 53,597 3,612 51,791 415,552 7.885 0.07454 49,985 3,726 48,122 363,761 7.386 0.08235 46,259 3,810 44,354 315,639 6.887 0.09087 42,449 3,857 40,521 271,285 6.488 0.10014 38,592 3,864 36,660 230,764 6.089 0.11020 34,728 3,827 32,814 194,104 5.690 0.12112 30,901 3,743 29,029 161,290 5.291 0.13294 27,158 3,610 25,353 132,261 4.992 0.14570 23,548 3,431 21,832 106,908 4.593 0.15945 20,117 3,208 18,513 85,076 4.294 0.17425 16,909 2,946 15,436 66,563 3.995 0.19013 13,963 2,655 12,635 51,127 3.796 0.20713 11,308 2,342 10,137 38,491 3.497 0.22529 8,966 2,020 7,956 28,355 3.298 0.24464 6,946 1,699 6,096 20,399 2.999 0.26520 5,247 1,391 4,551 14,302 2.7100+ 1.00000 3,855 3,855 9,752 9,752 2.53-36
SINGAPORE DEPARTMENT OF STATISTICSINFORMATION DISSEMINATION SERVICES<strong>Statistics</strong> <strong>Singapore</strong> WebsiteThe <strong>Statistics</strong> <strong>Singapore</strong> Website was launched by the <strong>Singapore</strong> Department of <strong>Statistics</strong> (DOS)in January 1995. Internet users can access the website by connecting to:http://www.singstat.gov.sgKey <strong>Singapore</strong> statistics are available via the following sections:♦♦♦♦<strong>Statistics</strong>which provide key data on <strong>Singapore</strong>’s economy and population.Newswhich cover the Performance of <strong>Singapore</strong> Economy, the Consumer Price Index, theWholesale Trade Index, Business Receipts Index for Service Industries, Retail Sales andCatering Trade Indices, Manufacturing Performance, <strong>Singapore</strong> External Trade, TourismSector Performance, Real Estate Information and Employment Situation.Publications - <strong>Paper</strong>s & Analyseswhich provide papers on economic and social topics.Themeswhich presents official statistics compiled by DOS and the Research and <strong>Statistics</strong> Unitsin the various ministries and statutory boards according to themes. Within each theme,relevant statistics and related press releases, publications and references are provided.Statistical resources are available via:♦ Publication Cataloguewhich lists the latest editions of publications released by the <strong>Singapore</strong> Department of<strong>Statistics</strong> at http://www.singstat.gov.sg/pubn/catalog.html. All softcopy DOS publicationsare available for free downloading.♦ Advance Release Calendarwhich covers key <strong>Singapore</strong> economic indicators.The website also provides a convenient gateway to international statistical websites under the“Statistical Resources” section:♦♦Guide to International <strong>Statistics</strong>which covers international databases, classifications and links, and statistical termsand definitions.IMF Dissemination Standards Bulletin Boardwhich provides metadata about <strong>Singapore</strong>’s key indicators in the real, fiscal, financial andexternal sectors, including dissemination practices and information about pre-releaseaccess of current indicators.SingStat ExpressSingStat Express is a personalised data delivery service which sends the latest press releases,notices of publication, newsletter, occasional and information papers to subscribers via email. SMS alertservice is also available to local users. Subscription details are available from the <strong>Statistics</strong> <strong>Singapore</strong>Website (http://www.singstat.gov.sg/express).
SINGAPORE DEPARTMENT OF STATISTICSINFORMATION DISSEMINATION SERVICES (continued)Really Simple SyndicationReally Simple Syndication (RSS) is an easy way to stay updated on the latest statistical newsreleased via the <strong>Statistics</strong> <strong>Singapore</strong> Website. The SingStat RSS feed delivers statistical news highlights andhyperlink to the source document whenever the updates are posted. More information are available athttp://www.singstat.gov.sg/svcs/rss.html.Key <strong>Singapore</strong> Data on Palm OS DevicesThe pdf version of "<strong>Singapore</strong> in Brief 2007" for Palm OS devices is available for downloadingfrom the <strong>Statistics</strong> <strong>Singapore</strong> Website.SingStat Time Series (STS) Online SystemThe SingStat Time Series (STS) Online System is an internet-accessible time series retrievalsystem. The STS includes some 6,000 historical data series on <strong>Singapore</strong> society and economy from severaldomains, including national accounts, balance of payments, investments, finance, labour, prices, businessexpectations, trade, manufacturing, tourism, demography, health and education.Besides the usual monthly, quarterly and annual data, STS includes also seasonally adjusted dataseries for key economic indicators providing for a better analysis and understanding of current economictrends. The STS also offers:• Web-based search engine that is easy to use;• “Bookmark” features that enable users to save and organise links in theirpersonalised portals.Subscription to STS is opened to local and overseas users. More information on STS are availablevia <strong>Statistics</strong> <strong>Singapore</strong> Website. For enquiries, please contact our Department at Tel : 6332-7119.E-surveyThe E-survey enables business organisations to complete and submit their survey forms throughthe internet. Using secured encryption protocols, the E-survey ensures that the information transmittedthrough the net is secured and protected. The system features online helps and validation checks to assistrespondents in completing their survey forms. With the E-survey, respondents do away with the tediouspaper work and manual tasks of mailing or faxing their survey returns to the Department.Statistical Enquiries and FeedbackIf you have any statistical enquiries or comment or suggestions on our statistical publicationsand electronic services, you are welcomed to :♦ E-mail us at info@singstat.gov.sg♦ Fax to us at (65) 6332-7689♦ Call us at 1800-3238118* (local callers)(65) 6332-7738 (overseas callers)* Calls from mobile telephone lines to 1800 local toll free number may be subject to mobileairtime charges as imposed by the relevant mobile service provider.