Hydro Plant Risk Assessment Guide
Hydro Plant Risk Assessment Guide
Hydro Plant Risk Assessment Guide
- No tags were found...

You also want an ePaper? Increase the reach of your titles
YUMPU automatically turns print PDFs into web optimized ePapers that Google loves.
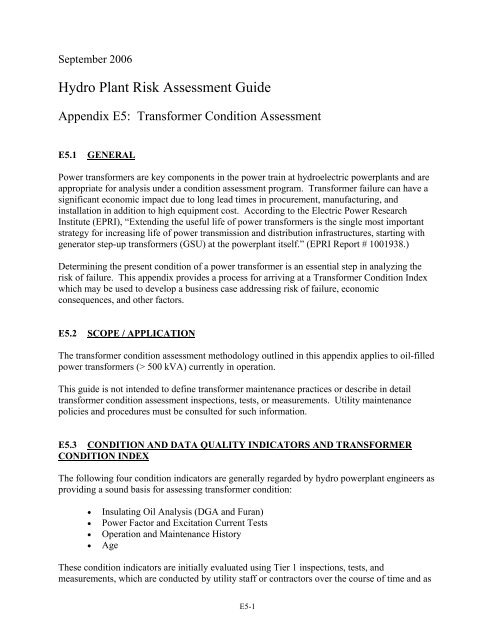
a part of routine maintenance activities. Numerical scores are assigned to each conditionindicator, which are then weighted and summed to determine the Transformer Condition Index.An additional stand-alone indicator is used to reflect the quality of the information available forscoring the Transformer Condition Index. In some cases, data may be missing, out-of-date, or ofquestionable integrity. Any of these situations could affect the accuracy of the associatedcondition indicator scores as well as the validity of the condition index. Given the potentialimpact of poor or missing data, the Data Quality Indicator is used as a means of evaluating andrecording confidence in the final Transformer Condition Index.Additional information regarding transformer condition may be necessary to improve theaccuracy and reliability of the Transformer Condition Index. Therefore, in addition to the Tier 1condition indicators, this <strong>Guide</strong> describes a “toolbox” of Tier 2 inspections, tests, andmeasurements that may be applied to the Transformer Condition Index, depending on thespecific issue or problem being addressed. Tier 2 tests are considered non-routine. However, ifTier 2 data is readily available, it may be used to supplement the Tier 1 assessment.Alternatively, Tier 2 tests may be deliberately performed to address Tier 1 findings. Results ofthe Tier 2 analysis may either increase or decrease the score of the Transformer Condition Index.The Data Quality Indicator score may also be revised during the Tier 2 assessment to reflect theavailability of additional information or test data.The Transformer Condition Index may indicate the need for immediate corrective actions and/orfollow-up Tier 2 testing. The Transformer Condition Index is also suitable for use as an input toa risk-based economic analysis model.Note: A severely negative result of ANY inspection, test, or measurement may be adequate initself to require immediate de-energization, or prevent re-energization, of the transformerregardless of the Transformer Condition Index score.E5.4 INSPECTIONS, TESTS, AND MEASUREMENTSThe hierarchy of inspections, tests, and measurements is illustrated in Figure 1 (TransformerCondition <strong>Assessment</strong> Methodology). Table 16 briefly describes the activities related toconducting the transformer condition assessment.Inspections, tests, and measurements should be conducted and analyzed by staff suitably trainedand experienced in transformer diagnostics. Qualified staff that is competent in these routineprocedures may conduct the basic tests and inspections. More complex inspections andmeasurements may require a transformer diagnostics “expert”.This guide also assumes that inspections, tests, and measurements are conducted on a frequencythat provides the accurate and current information needed by the assessment.Results of the transformer condition assessment may cause concerns that justify more frequentmonitoring. Utilities should consider the possibility of taking more frequent measurements (e.g.,oil samples) or installing on-line monitoring systems (e.g., gas-in-oil) that will continuouslytrack critical quantities. This will provide additional data for condition assessment and establishE5-2
a certain amount of reassurance as transformer alternatives are being explored. Inspection,testing, and measurement methods are specified in technical references specific to the electricutility.E5.5 SCORINGTransformer condition indicator scoring is somewhat subjective, relying on transformercondition experts. Relative terms such as “Results Normal” and “Degradation” refer to resultsthat are compared to industry accepted levels; or to baseline or previous (acceptable) levels onthis equipment; or to equipment of similar design, construction, or age operating in a similarenvironment.E5.6 WEIGHTING FACTORSWeighting factors used in the condition assessment methodology recognize that some conditionindicators affect the Transformer Condition Index to a greater or lesser degree than otherindicators. These weighting factors were arrived at by consensus among transformer design andmaintenance personnel with extensive experience.E5.7 MITIGATING FACTORSEvery transformer is unique and, therefore, the methodology described in this appendix cannotquantify all factors that affect individual transformer condition. It is important that theTransformer Condition Index arrived at be scrutinized by engineering experts. Mitigating factorsspecific to the utility may determine the final Transformer Condition Index and the final decisionon transformer replacement or rehabilitation.E5.8 DOCUMENTATIONSubstantiating documentation is essential to support findings of the assessment, particularlywhere a Tier 1 condition indicator score is less than 3 (i.e., less than normal) or where a Tier 2test results in subtractions from the Transformer Condition Index. Test results and reports,photographs, O & M records, or other documentation should accompany the TransformerCondition <strong>Assessment</strong> Summary Form.E5.9 CONDITION ASSESSMENT METHODOLOGYThe condition assessment methodology consists of analyzing each condition indicatorindividually to arrive at a condition indicator score. The scores are then weighted and summedto determine the Transformer Condition Index. The Transformer Condition Index is applied tothe Transformer Condition-Based Alternatives, Table 15, to determine the recommended courseof action.E5-3
Reasonable efforts should be made to perform Tier 1 inspections, tests, and measurements.However, when data is unavailable to properly score a condition indicator, it may be assumedthat the score is “Good” or numerically equal to some mid-range number such as 2. Thisstrategy must be used judiciously to prevent erroneous results and conclusions. In recognition ofthe potential impact of poor or missing data, a separate Data Quality Indicator is rated as a meansof evaluating and recording confidence in the final Generator Condition Index.E5.10 TIER 1 – INSPECTIONS, TESTS, AND MEASUREMENTSTier 1 inspections, tests, and measurements are routinely accomplished as part of normaloperation and maintenance, or are readily discernible by examination of existing data. Tier 1 testresults are quantified below as condition indicators that are weighted and summed to arrive at aTransformer Condition Index. Tier 1 inspections, tests, and measurements may indicateabnormal conditions that can be resolved with standard corrective maintenance solutions. Tier 1test results may also indicate the need for additional investigation, categorized as Tier 2 tests.Transformer Condition Indicator 1 – Insulating Oil AnalysisDissolved gas analysis is the most important factor in determining the condition of a transformer.Being performed more frequently than other tests, it may be the first indication of a problem.Insulating oil analysis can identify internal arcing, bad electrical contacts, hot spots, partialdischarge, or overheating of conductors, oil, tank, or cellulose. The “health” of the oil reflectsthe health of the transformer itself. Dissolved gas analysis (DGA) consists of drawingtransformer insulating oil samples from the transformer tank and sending the samples to acommercial laboratory for analysis. The most important indicators are the individual and totaldissolved combustible gas (TDCG) generation rates, based on IEC and IEEE standards.Although gas generation rates are not the only indicator, they are reasonable for use indetermining the condition indicator score.Furanic analysis may indicate a problem with the paper insulation which could affect transformerlongevity. A baseline furanic analysis should be made initially and repeated if the transformer isoverheated, overloaded, aged, or after changing or processing the oil.Physical tests such as interfacial tension (IFT), acidity, moisture content, and dielectric strengthusually indicate oil conditions that can be remedied through various reclamation processes.Therefore, they are not indicative of overall transformer condition that would lead toreplacement. Such tests do not affect the Insulating Oil Condition Indicator score.Results of the insulating oil analysis are applied to Table 1 to arrive at an appropriate ConditionIndicator Score.E5-4
Table 1 – Insulating Oil Analysis ScoringResults (See Notes 1 & 2){Total Dissolved Combustible Gas (TDCG) generation rate < 30ppm (parts per million)/month AND all individual combustiblegas generation < 10 ppm/month. Exceptions: CO generation 50 ppm/month. Exceptions:CO generation ≥ 350 ppm/month AND C 2 H 2 generation rate
applying them to the table. Non-thermally upgraded paper emits approximately 3 times moreFurans before a problem is indicated.Transformer Condition Indicator 2 – Power Factor and Excitation Current TestsPower factor insulation testing is important to determining the condition of the transformerbecause it can detect winding and bushing insulation integrity. Power factor and excitationcurrent tests are conducted in the field on de-energized, isolated, and properly groundedtransformers. Excitation current tests measure the single-phase voltage, current, and phase anglebetween them, typically on the high-voltage side with the terminals of the other winding leftfloating (with the exception of a grounded neutral). The measurements are performed at ratedfrequency and usually at test voltages up to 10 kV. The test detects shorted turns, poor tapchanger contacts, and core problems.Results of the power factor and excitation current tests are analyzed and applied to Table 2 toarrive at an appropriate Condition Indicator Score.Table 2 – Power Factor and Excitation Current Test ScoringTest Results*Power factor results normal. (Good – G)ANDNormal excitation current values and patterns compared to otherphases and prior tests.Power factor results show minor degradation. (Deteriorated – D)ORMinor deviation in excitation current values and patterns comparedto other phases and prior tests. **Power factor results show significant deterioration. (Investigate – I)ORSignificant deviation in current values and patterns compared toother phases and prior tests. **Power factor results show severe degradation. (Bad – B)ORSevere deviation in current values and patterns compared to otherphases and prior tests. **Condition Indicator Score3210(May indicate seriousproblem requiringimmediate evaluation,additional testing,consultation with experts,and remediation prior to reenergization.)* Doble insulation rating shown in parentheses.** Be sure to account for residual magnetism and tap changer position.E5-6
Transformer Condition Indicator 3 – Operation and Maintenance HistoryOperation and maintenance (O & M) history may indicate overall transformer condition. O & Mhistory factors that may apply are:• Sustained overloading;• Unusual operating temperatures indicated by gauges and continuous monitoring;• Abnormal temperatures indicated by infrared scanning;• Nearby lightning strikes or through faults;• Abnormally high corona detected;• Abnormally high external temperatures detected;• Problems with auxiliary systems (fans, radiators, cooling water piping, pumps,motors, controls, nitrogen replenishment system, and indicating and protectiondevices);• Deteriorated control and protection wiring and devices;• Increase in corrective maintenance or difficulty in acquiring spare parts;• Anomalies determined by physical inspection* (e.g., incorrectly positioned valves,plugged radiators, stuck temperature indicators and level gages, noisy oil pumps orfans, oil leaks, connections to bushings);* External inspection or internal inspection not requiring untanking.• Previous failures on this equipment;• Failures or problems on equipment of similar design, construction, or age operating ina similar environment.Qualified personnel should make a subjective determination of scoring that encompasses asmany operation and maintenance factors as possible under this Indicator. Results of the O & Mhistory are analyzed and applied to Table 3 to arrive at an appropriate Condition Indicator Score.Table 3 – Operation and Maintenance History ScoringHistory ResultsCondition Indicator ScoreOperation and Maintenance are normal.3Some abnormal operating conditions experienced and/oradditional maintenance above normal occurring. 2Significant operation outside normal and/or significantadditional maintenance is required; or forced outage occurs; or1outages are regularly extended due to maintenance problems; orsimilar units are problematic.Repeated forced outages; maintenance not cost effective; ormajor oil leaks and/or severe mechanical problems; or similarunits have failed.0E5-7
Transformer Condition Indicator 4 – AgeTransformer age is an important factor to consider when identifying candidates for transformerreplacement. Age is one indicator of remaining life and upgrade potential to current state-of-theartmaterials. During the life of the transformer, the mechanical and insulating properties ofmaterials which are used for structural support and electrical insulation, especially wood andpaper, deteriorate. Although actual service life varies widely depending on the manufacturer’sdesign, quality of assembly, materials used, operating history, current operating conditions, andmaintenance history, the average expected life for an individual transformer in a large populationof transformers is statistically about 40 years.Apply the transformer age to Table 4 to arrive at the Condition Indicator Score.AgeTable 4 – Age ScoringCondition Indicator Score< 30 years 3≥ 30 and < 45 years 2≥ 45 years 1E5.11 TIER 1 – TRANSFORMER CONDITION INDEX CALCULATIONSEnter the condition indicator scores from the tables above into the Transformer Condition<strong>Assessment</strong> Summary form at the end of this document. Multiply each condition indicator scoreby the Weighting Factor, and sum the Total Scores to arrive at the Tier 1 Transformer ConditionIndex.E5.12 TIER 1 – TRANSFORMER DATA QUALITY INDICATORThe Transformer Data Quality Indicator reflects the quality of the inspection, test andmeasurement results used to evaluate the transformer condition under Tier 1. The more currentand complete the inspections, tests, and measurements, the higher the rating for this indicator.The normal testing frequency is defined as the organization’s recommended frequency forperforming the specific test or inspection.Qualified personnel should make a subjective determination of scoring that encompasses asmany factors as possible under this indicator. Results are analyzed and applied to Table 5 toarrive at a Transformer Data Quality Indicator Score.E5-8
Table 5 –Transformer Data Quality ScoringResultsAll Tier 1 inspections, tests and measurements werecompleted within the normal testing frequency and the resultsare reliable.One or more of the Tier 1 inspections, tests and measurementswere completed ≥ 6 and < 24 months past the normal testingfrequency and the results are reliable.One or more of the Tier 1 inspections, tests and measurementswere completed ≥ 24 and < 36 months past the normal testingfrequency, or some of the results are not available or are ofquestionable integrity.One or more of the Tier 1 inspections, tests and measurementswere completed ≥ 36 months past the normal frequency, or noresults are available or many are of questionable integrity.Data Quality Indicator Score10740Enter the Transformer Data Quality Indicator Score from Table 5 into the Transformer Condition<strong>Assessment</strong> Summary form at the end of this document.E5.12 TIER 2 – INSPECTIONS, TESTS, AND MEASUREMENTSTier 2 inspections, tests, and measurements generally require specialized equipment or training,may be intrusive, or may require an extended outage to perform. A Tier 2 assessment is notconsidered routine. Tier 2 inspections are intended to affect the Transformer Condition Indexnumber established using Tier 1 but also may confirm or refute the need for more extensivemaintenance, rehabilitation, or transformer replacement.Note that there are many tests that can give information about the various aspects of transformercondition. The choice of tests should be made based on known information gathered byinspection history, other test results, company standards, and Tier 1 assessment. Many Tier 2tests are used to detect or confirm a similar defect in the condition of the transformer. In theevent that several Tier 2 tests are performed that assess the same condition issue, the test with thelargest adjustment should be used in recalculating the Condition Index. Since Tier 2 tests arebeing performed by, and/or coordinated with, knowledgeable technical staff, the decision onwhich test is most significant and how these tests overlap in application is left to the experts.The important factor is to avoid adjusting the Condition Index downward twice or more simplybecause two or more tests are completed for the same suspected condition.For Tier 2 evaluations, apply only the applicable adjustment factors per the instructions aboveand recalculate the Transformer Condition Index using the Transformer Condition <strong>Assessment</strong>Survey Form at the end of this document. An adjustment to the Data Quality Indicator scoremay be appropriate if additional information or test results were obtained during the Tier 2assessment.E5-9
Test T2.1: Turns Ratio TestThe transformer turns ratio (TTR) test detects shorts or severe tracking between turns of thesame coil, which indicates insulation failure between the turns. These tests are performed withthe transformer de-energized and may show the necessity for an internal inspection or removalfrom service.Results are analyzed and applied to Table 6 to arrive at a Transformer Condition Indexadjustment.Table 6 – Turns Ratio Test ScoringTest Results< 0.20 percent difference from nameplatevoltage ratio (V 1 /V 2 ) and compared toprevious readings.≥ 0.20 and < 0.50 percent differencecompared to nameplate voltage ratio(V 1 /V 2 ).≥ 0.50 percent difference compared tonameplate voltage ratio (V 1 /V 2 ).Adjustment toTransformer Condition IndexNo ChangeSubtract 1.0Subtract 5.0(May indicate serious problem requiring immediateevaluation, additional testing, consultation withexperts, and remediation prior to re-energization.)Test T2.2: Short Circuit Impedance TestSometimes called Percent Impedance or Leakage Reactance, these tests are conducted in thefield and compared to nameplate information, previous tests, and similar units to detectdeformation of the core or windings caused by shipping damage, through faults, or ground faults.Some difference may be expected between nameplate and field test results because factory testsare conducted at full load current, normally not possible in the field. Field connections and testleads and jumpers also play a significant role in test results and it is impossible to exactlyduplicate the factory test setup. Therefore, the I 2 R power losses may be different and causedifferent test results. By comparing percent-reactance to nameplate impedance, the differencescaused by leads and connections can be eliminated. Because reactance is only the inductivecomponent of the impedance, I 2 R power losses are omitted in the test results.Results are analyzed and applied to Table 7 to arrive at a Transformer Condition Index scoreadjustment.E5-10
Table 7 – Short Circuit Impedance Test ScoringTest ResultsAdjustment toTransformer Condition Index< 1 percent difference from nameplate impedance. No Change≥ 1 and < 3 percent difference from nameplateimpedance. (Minor degradation.)≥ 3 and < 5 percent difference from nameplateimpedance. (Significant degradation.)≥ 5 percent difference from nameplate impedance.(Severe degradation.)Test T2.3: Core-to-Ground Resistance (Megger) TestSubtract 0.5Subtract 1.0Subtract 5.0(May indicate serious problem requiringimmediate evaluation, additional testing,consultation with experts, and remediationprior to re-energization.)The transformer core is intentionally grounded through one connection. The core-to-groundresistance test can detect if this connection is loose. It can also detect whether there are otherundesired and inadvertent, grounds. If the intentional core ground is intact, the resultantresistance should be very low. To check for unintentional core grounds, remove the intentionalground and megger between the core and the grounded transformer tank. This test shouldproduce very high resistance, indicating that an unintentional ground is not present. This test isto supplement dissolved gas analysis that shows generation of hot metal gases (i.e., methane,ethane, and ethylene) and to indicate if a spurious, unintentional core ground is the problem.Experience can help locate the source of the problem.Results are analyzed and applied to Table 8 to arrive at a Transformer Condition Indexadjustment.Table 8 – Core-to-Ground Resistance Test ScoringTest Results*≥ 1,000 megaohms. (Results normal.)Adjustment toTransformer Condition IndexNo Change≥ 500 and < 1000 megaohms. Subtract 0.5≥ 200 and < 500 megaohms. Subtract 1.0< 200 megaohms.* With intentional ground disconnected.Subtract 5.0(May indicate serious problem requiring immediateevaluation, additional testing, consultation withexperts, and remediation prior to re-energization.)E5-11
Test T2.4: Winding Direct-Current Resistance MeasurementCareful measurement of winding resistance can detect broken conductor strands, looseconnections, and bad contacts in the tap changer (DETC or LTC). Results from thesemeasurements may indicate the need for an internal inspection. This information supplementsdissolved gas analysis (DGA) and is useful when DGA shows generation of heat gases (i.e.,ethane, ethylene, methane). These tests are typically performed with a micro-ohmmeter and orWheatstone bridge. Test results are compared between phases or with factory tests. Whencomparing to factory tests, a temperature correction must be employed (IEEE P62). This testshould be performed only after the rest of the routine electrical tests because it may magnetizethe core, affecting results of the other tests.Results are analyzed and applied to Table 9 to arrive at a Transformer Condition Indexadjustment.Table 9 – Winding Direct-Current Resistance Measurement ScoringMeasurement Results< 5 percent difference between phases orfrom factory tests.≥ 5 and < 7 percent difference between phasesor from factory tests.≥ 7 and < 10 percent difference betweenphases or from factory tests.≥ 10 percent between phases or from factorytests.Adjustment toTransformer Condition IndexNo ChangeSubtract 0.5Subtract 1.0Subtract 5.0(May indicate serious problem requiringimmediate evaluation, additional testing,consultation with experts, and remediation priorto re-energization.)Test T2.5: Ultrasonic and Sonic Fault Detection MeasurementsThese assessment tests (sometimes called Acoustic Testing) are helpful in locating internalfaults. Partial discharges (corona) and low energy arcing / sparking emit energy in the range of50 megahertz (ultrasonic), well above audible sound. To make these measurements, sensors areplaced on the outside of a transformer tank to detect these ultrasonic emissions which are thenconverted electronically to oscilloscope traces or audible frequencies and recorded. Bytriangulation, a general location of a fault (corona or arcing/sparking) may be determined so thatan internal inspection can be focused in that location. These devices also can detect loose shieldsthat build up static and discharge it to the grounded tank; poor connections on bushings; badcontacts on a tap changer that are arcing / sparking; core ground problems that cause sparking /arcing; and areas of weak insulation that generate corona. Sonic testing can detect increased coreand coil noise (looseness) and vibration, failing bearings in oil pumps and fans, and nitrogenleaks in nitrogen blanketed transformers.E5-12
Information gained from these measurements supplements dissolved gas analysis, and providesadditional supporting information for de-energized tests such as core ground and windingresistance tests. In addition, these tests help pinpoint areas to look for problems during internalinspections.Performing baseline tests may provide comparisons for later tests. Experience can help locatethe source of the problem.Results are analyzed and applied to Table 10 to arrive at a Transformer Condition Indexadjustment.Table 10 – Ultrasonic and Sonic Measurement ScoringResults normal.Measurement ResultsAdjustment toTransformer Condition IndexNo ChangeLow level fault indication. Subtract 0.5Moderate level fault indication. Subtract 1.0Severe fault level indication. Subtract 2.0Test T2.6: Vibration AnalysisVibration can result from loose transformer core and coil segments, shield problems, loose parts,or bad bearings on oil cooling pumps or fans. Vibration analyzers are used to detect and measurethe vibration. Information gained from these tests supplements ultrasonic and sonic (acoustic)fault detection tests and dissolved gas analysis. Information from these tests may indicatemaintenance is needed on pumps or fans mounted external to the tank. It may also show whenan internal transformer inspection is necessary. If wedging has been displaced due to paperdeterioration or through faults, vibration will increase markedly. This will also show if core andcoil vibration has increased compared to baseline information. Experience can help locate thesource of the problem.Results are analyzed and applied to Table 11 to arrive at a Transformer Condition Indexadjustment.E5-13
Table 11 – Vibration Analysis ScoringResults normal.Analysis ResultsAdjustment toTransformer Condition IndexNo ChangeLow vibration. Subtract 0.5Moderate vibration. Subtract 1.0Severe vibration. Subtract 2.0Test T2.7: Frequency Response AnalysisFrequency Response Analysis (FRA) or Sweep Frequency Response Analysis (SFRA) candetermine if windings of a transformer have moved or shifted. It can be done as a factory testprior to shipment and repeated after the transformer is received on site to determine if windingshave been damaged or shifted during shipping. This test is also helpful if a protective relay hastripped or a through fault, short circuit, or ground fault has occurredA sweep frequency is generally placed on each of the high voltage windings and the signal isdetected on the low-voltage windings. This provides a picture of the frequency transfer functionof the windings. If the windings have been displaced or shifted, test results will differ markedlyfrom prior tests. Test results are kept in transformer history files so they can be compared tolater tests. Results are determined by comparison to baseline or previous measurements orcomparison to units of similar design and construction.Results are analyzed and applied to Table 12 to arrive at a Transformer Condition Indexadjustment.Table 12 – Frequency Response Analysis ScoringTest ResultsNo deviation compared to prior tests.Adjustment toTransformer Condition IndexNo ChangeMinor deviation compared to prior tests. Subtract 2.0Moderate deviation compared to prior tests. Subtract 3.0Significant deviation compared to prior tests. Subtract 4.0Severe deviation compared to prior tests.Subtract 5.0(May indicate serious problem requiringimmediate evaluation, additional testing,consultation with experts, and remediationprior to re-energization.)E5-14
Test T2.8: Internal InspectionIn some cases, it is necessary to open the tank, partially or fully drain the oil, and perform aninternal inspection to determine transformer condition. These inspections must be performed byexperienced staff with proper training. Sludging, loose wedges, loose coils, poor electricalconnections on bushing bottoms, burned contacts on tap changers, localized overheatingsignified by carbon buildup, displaced wedging or insulation, and debris and other foreignmaterial are general areas of concern. Photographs and mapping problem locations are goodmeans of documenting findings.Note: Before entering and while inside the transformer, OSHA, state, local, and utility safetypractices must be followed (e.g., “permitted confined space” entry practices).Results are analyzed and applied to Table 13 to arrive at a Transformer Condition Indexadjustment.Table 13 – Internal Inspection ScoringConditions normal.Inspection ResultsAdjustment toTransformer Condition IndexNo ChangeMinimal degradation. Subtract 0.5Moderate degradation. Subtract 1.5Severe degradation.Subtract 5.0(May indicate serious problem requiringimmediate evaluation, additional testing,consultation with experts, and remediationprior to re-energization.)Test T2.9: Degree of PolymerizationWinding insulation (cellulose) deterioration can be quantified by analysis of the Degree ofPolymerization (DP) of the insulating material. This test gives an indication of the remainingstructural strength of the paper insulation and is an excellent indication of the remaining life ofthe paper and the transformer itself. This requires analyzing a sample of the paper insulation in alaboratory to determine the deterioration of the molecular bonds of the paper.Results are analyzed and applied to Table 14 to arrive at a Transformer Condition Indexadjustment.E5-15
Table 14 – Degree of Polymerization Test ScoringTest Results≥ 900 and no polymerization decrease. (Resultsnormal.)≥ 600 and < 900. (Minimal polymerizationdecrease.)≥ 200 and < 600. (Moderate polymerizationdecrease.)< 200. (Severe polymerization decrease.Insulation has no mechanical strength; hasreached end of life.)Adjustment toTransformer Condition IndexNo ChangeSubtract 0.5Subtract 1.5Subtract 5.0(May indicate serious problem requiringimmediate evaluation, additional testing,consultation with experts, and remediationprior to re-energization.)Test T2.10: Other Specialized Diagnostic TestsAdditional tests may be applied to evaluate specific transformer problems. Some of thesediagnostic tests may be considered to be of an investigative research nature. When conclusiveresults from other diagnostic tests are available, they may be used to make an appropriateadjustment to the Transformer Condition Index.E5.13 TIER 2 – TRANSFORMER CONDITION INDEX CALCULATIONSEnter the Tier 2 adjustments from the tables above into the Transformer Condition <strong>Assessment</strong>Summary Form at the end of this appendix. Subtract the sum of these adjustments from the Tier1 Transformer Condition Index to arrive at the total Transformer Condition Index. Anadjustment to the Data Quality Indicator score may be appropriate if additional information ortest results were obtained during the Tier 2 assessment.E5.14 TIER 2 – TRANSFORMER CONDITION-BASED ALTERNATIVESThe Transformer Condition Index – either modified by Tier 2 tests or not – may be sufficient fordecision-making regarding transformer alternatives. The Index is also suitable for use in a riskand-economicanalysis model. Where it is desired to consider alternatives based solely ontransformer condition, the Transformer Condition Index may be directly applied to theTransformer Condition-Based Alternatives table on the Summary Form.E5-16
Table 15 – Transformer Condition-Based AlternativesTransformer Condition Index≥ 7.0 and ≤ 10 (Good)≥ 3.0 and < 7 (Fair)≥ 0 and < 3.0 (Poor)Suggested Course of ActionContinue O & M without restriction. Repeat conditionassessment as needed.Continue operation but reevaluate O & M practices.Consider using appropriate Tier 2 tests. Repeatcondition assessment process as needed.Immediate evaluation including additional Tier 2testing. Consultation with experts. Adjust O & M asprudent. Begin replacement/rehabilitation process.E5-17
Tier 1 Inspections, Tests, andMeasurementsOil , Power Factor & Excitation, Routine O&M, AgeNOProblem?YES** Severe problems may warrantimmediate de-enegizationFigure 1.Transformer Condition<strong>Assessment</strong>Methodologytranscond 8/6/02NORepair, Rehab,RetestProblemTransformerTripped orMalfunctionedResults of Inspections,Tests, and Measurementsare Quantified as ConditionIndicators Used to Arrive ata Transformer ConditionFactor.Tier 2 Tests BelowYESShortedWindingCore / WindingDeformationBad IntentionalGround Connection &Unintentional GroundTC Contacts, BrokenStrands, LooseConnectionsInternal PartialMechanicalDischarge, Arcing,ProblemsSparkingNitrogenLeaksCore Shield Problems,Loose PartsShiftedWindingsInsulationConditionTurnsRatio TestShort CircuitImpedance(LeakageReactance)Core toGroundResistanceTestWinding DCResistanceMeasurementsUltrasonic &SonicContactFaultDetectionUltrasonicNon-ContactFaultDetectionVibrationAnalysisFrequencyResponseDegree ofPolymerizationReturn to RoutineInspection & TestingNOInternalInspectionOil SludgingDisplaced Windings or WedgingLoose WindingsBad ConnectionsConservator LeaksDebrisReplaceTransformerYESProblemRepair,Rehab,RetestE5-18
On-Line Tests:Dissolved Gas AnalysisTable 16 – Transformer Condition <strong>Assessment</strong>Test Detects ToolOil Physical and Chemical TestsExternal Physical InspectionExternal Temperatures(Main tank and load tap changer)Infrared ScanUltrasonic (Acoustic) Contact FaultDetectionSonic Fault DetectionInternal arcing; bad electrical contacts; hot spots; partial discharge; andoverheating of conductors, oil, tank, and cellulose insulation.Moisture, degraded interfacial tension (IFT), acidity, furans, dielectricstrength, and power factor.Oil leaks, broken parts, worn paint, defective support structure, stuckindicators, noisy operation, loose connections, cooling problems withfans, pumps, etc.Temperature monitoring with changes in load and ambient temperature.Hot spots indicating localized heating, circulating currents, blockedcooling, tap changer problems, and loose connections.Internal partial discharge, arcing, sparking, loose shields, poor bushingconnections, bad tap changer contacts, core ground problems, and weakinsulation that is causing corona.Nitrogen leaks, vacuum leaks, core and coil vibration, corona atbushings, and mechanical & bearing problems in pumps and coolingfans.E5-19Requires laboratory analysis.Requires laboratory analysis.Experienced staff and binoculars.Portable temperature data loggers and software.Thermographic camera and analysis software.Ultrasonic detectors and analysis software.Ultrasonic probe and meter.Vibration Analysis Internal core, coil, and shield problems; loose parts and bad bearings. Vibration data logger.Off-Line Tests:Doble Tests (bushing capacitance,insulation power factor, tip up,excitation current)Loss of winding insulation integrity, loss of bushing insulation integrity,and winding moisture.Doble test equipment.Turns Ratio Shorted windings. Doble test equipment or turns ratio tester.Short Circuit Impedance Deformation of the core or winding. Doble or equivalent test equipment.Core-to-Ground Resistance(External test may be possible depending ontransformer construction)Winding DC ResistanceMeasurementsBad connection on intentional core ground; and existence ofunintentional grounds.Broken strands, loose connections, bad tap changer contacts.Megger.Wheatstone Bridge (1 ohm and greater),Kelvin Bridge micro-ohmmeter (less than 1 ohm).Frequency Response Analysis Shifted windings. Doble or equivalent sweep frequency analyzer,Internal InspectionOil sludging, displaced winding or wedging, loose windings, badconnections, localized heating, debris and foreign objects.Experienced staff, micro-ohmmeter.Degree of Polymerization Insulation condition (life expectancy). Laboratory analysis of paper sample.
TRANSFORMERTIER 1 CONDITION ASSESSMENT SUMMARYDate: __________________________ Location: _______________________________________Transformer Identifier: ________________ Manufacturer: _________________ Yr. Mfd.: ______No. of Phases: ________________ MVA: _____________ Voltage: _______________________Tier 1 Transformer Condition Summary(For instructions on indicator scoring, please refer to condition assessment guide)No. Condition Indicator Score × Weighting Factor = Total Score1234Oil Analysis(Score must be 0, 1, 2, or 3)Power Factor and ExcitationCurrent Tests(Score must be 0, 1, 2, or 3)Operation and MaintenanceHistory(Score must be 0, 1, 2, or 3)Age(Score must be 1, 2, or 3)Tier 1 Transformer Condition Index(Sum of individual Total Scores)(Condition Index should be between 0 and 10)Tier 1 Data Quality Indicator(Value must be 0, 4, 7, or 10)1.1430.9520.7620.476Evaluator: __________________________ Technical Review: __________________________Management Review: _________________ Copies to: _________________________________(Attach supporting documentation.)E5-20
Transformer Condition-Based AlternativesTransformer Condition Index≥ 7.0 and ≤ 10 (Good)≥ 3.0 and < 7 (Fair)≥ 0 and < 3.0 (Poor)Suggested Course of ActionContinue O & M without restriction. Repeatcondition assessment as needed.Continue operation but reevaluate O & M practices.Consider using appropriate Tier 2 tests. Repeatcondition assessment process as needed.Immediate evaluation including additional Tier 2testing. Consultation with experts. Adjust O & M asprudent. Begin replacement/rehabilitation process.Note: A Transformer Condition Index of zero strongly indicates that the transformer should not be reenergizeduntil repair raises the condition index or the transformer is replaced.E5-21
TRANSFORMERTIER 2 CONDITION ASSESSMENT SUMMARYDate: __________________________ Location: _______________________________________Transformer Identifier: ________________ Manufacturer: _________________ Yr. Mfd.: ______No. of Phases: ________________ MVA: _____________ Voltage: _______________________Tier 2 Transformer Condition SummaryT2.1 Turns Ratio TestTier 2 TestAdjustment toTier 1 Condition IndexT2.2 Short Circuit Impedance TestT2.3 Core-to-Ground Resistance (Megger) TestT2.4 Winding DC Resistance MeasurementT2.5 Ultrasonic and Sonic Fault Detection MeasurementsT2.6 Vibration AnalysisT2.7 Frequency Response AnalysisT2.8 Internal InspectionT2.9 Degree of PolymerizationT2.10 Other Specialized Diagnostic TestsTier 2 Adjustments to Transformer Condition Index(Sum of individual adjustments)Tier 2 Data Quality Indicator(Value must be 0, 4, 7, or 10)To calculate the Net Transformer Condition Index (Value should be between 0 and 10), subtract the Tier 2Adjustments from the Tier 1 Transformer Condition Index:Tier 1 Transformer Condition Index__________minus Tier 2 Transformer Adjustments __________ = ________________Net Transformer Condition IndexE5-22
Evaluator: __________________________ Technical Review: __________________________Management Review: _________________ Copies to: _________________________________(Attach supporting documentation.)E5-23