

hp-security-research-cyber-risk-report-pdf-2-w-1408
hp-security-research-cyber-risk-report-pdf-2-w-1408
hp-security-research-cyber-risk-report-pdf-2-w-1408

You also want an ePaper? Increase the reach of your titles
YUMPU automatically turns print PDFs into web optimized ePapers that Google loves.
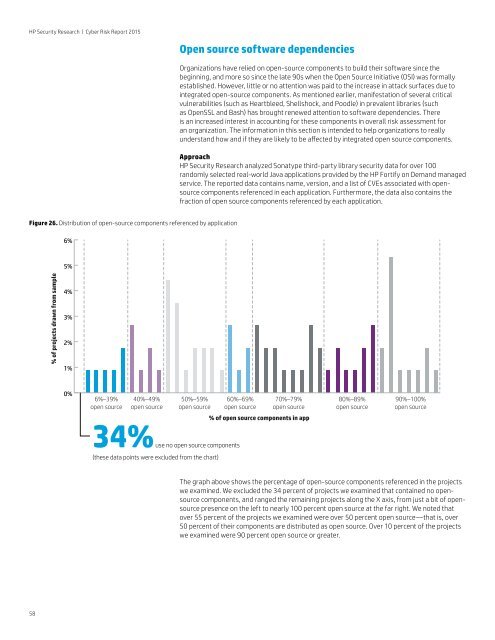
HP Security Research | Cyber Risk Report 2015Open source software dependenciesOrganizations have relied on open-source components to build their software since thebeginning, and more so since the late 90s when the Open Source Initiative (OSI) was formallyestablished. However, little or no attention was paid to the increase in attack surfaces due tointegrated open-source components. As mentioned earlier, manifestation of several criticalvulnerabilities (such as Heartbleed, Shellshock, and Poodle) in prevalent libraries (suchas OpenSSL and Bash) has brought renewed attention to software dependencies. Thereis an increased interest in accounting for these components in overall <strong>risk</strong> assessment foran organization. The information in this section is intended to help organizations to reallyunderstand how and if they are likely to be affected by integrated open source components.ApproachHP Security Research analyzed Sonatype third-party library <strong>security</strong> data for over 100randomly selected real-world Java applications provided by the HP Fortify on Demand managedservice. The <strong>report</strong>ed data contains name, version, and a list of CVEs associated with opensourcecomponents referenced in each application. Furthermore, the data also contains thefraction of open source components referenced by each application.Figure 26. Distribution of open-source components referenced by application6%5%% of projects drawn from sample4%3%2%1%0%6%–39%open source40%–49%open source50%–59%open source60%–69%open source70%–79%open source80%–89%open source90%–100%open source% of open source components in app34% use no open source components(these data points were excluded from the chart)The graph above shows the percentage of open-source components referenced in the projectswe examined. We excluded the 34 percent of projects we examined that contained no opensourcecomponents, and ranged the remaining projects along the X axis, from just a bit of opensourcepresence on the left to nearly 100 percent open source at the far right. We noted thatover 55 percent of the projects we examined were over 50 percent open source—that is, over50 percent of their components are distributed as open source. Over 10 percent of the projectswe examined were 90 percent open source or greater.58