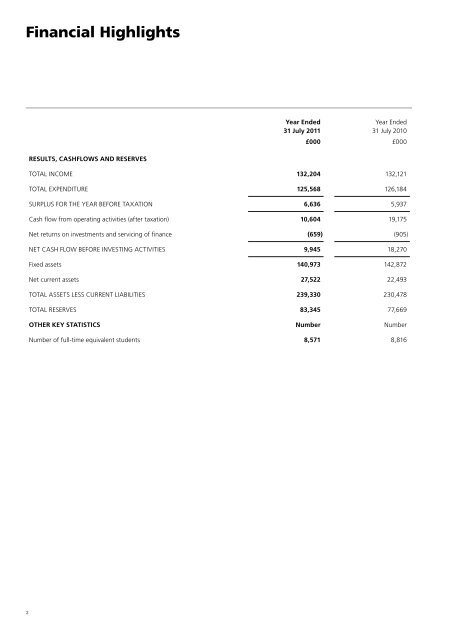
<strong>Financial</strong> HighlightsYear Ended31 July <strong>2011</strong>Year Ended31 July 2010£000 £000RESULTS, CASHFLOWS AND RESERVESTOTAL INCOME 132,204 132,121TOTAL EXPENDITURE 125,568 126,184SURPLUS FOR THE YEAR BEFORE TAXATION 6,636 5,937Cash flow from operating activities (after taxation) 10,604 19,175Net returns on investments and servicing <strong>of</strong> finance (659) (905)NET CASH FLOW BEFORE INVESTING ACTIVITIES 9,945 18,270Fixed assets 140,973 142,872Net current assets 27,522 22,493TOTAL ASSETS LESS CURRENT LIABILITIES 239,330 230,478TOTAL RESERVES 83,345 77,669OTHER KEY STATISTICS Number NumberNumber <strong>of</strong> full-time equivalent students 8,571 8,8162
Operating and <strong>Financial</strong> ReviewThis Operating and <strong>Financial</strong> Review has been prepared inaccordance with the requirements <strong>of</strong> the Higher EducationStatement <strong>of</strong> Recommended Practice: Accounting for Further andHigher Education (“SORP”) issued in July 2007, and follows bestpractice as set out in the Reporting Statement “Operating and<strong>Financial</strong> Review” issued by the Accounting Standards Board inJanuary 2006.Operating ReviewThe College is committed to the goal <strong>of</strong> being in the top tier <strong>of</strong>UK universities, renowned for world class research and excellentstudent experience. Two ‘Super’ KPIs are used by the College toevaluate this:1). The RAE outcome – relative sector position in the fundingcouncil’s Research Assessment Exercise (RAE).Figure 1: <strong>Royal</strong> <strong>Holloway</strong> RAE pr<strong>of</strong>ile and nationalcomparison in 20082). Annual National Student Survey (NSS) outcome.The College was ranked joint 35th out <strong>of</strong> 153 UK institutions with ascore <strong>of</strong> 87% based on the response to the NSS survey question <strong>of</strong>overall satisfaction in <strong>2011</strong>. This compares to joint 36th and 86%in 2010. Scores <strong>of</strong> 90% or over were achieved in 7 departments in<strong>2011</strong>. The College increased or maintained its score in 6 out <strong>of</strong> the7 categories <strong>of</strong> survey questions compared with 2010. Althoughthe overall improvement is pleasing (and noting that someinitiatives that have been undertaken will impact on survey resultsin future years) increasing the rate <strong>of</strong> progress is a top priority.Overall student numbers have increased from 7,318 FTEs in 2006-07 to 8,571 FTEs in 2010-11. In 2010-11 postgraduate student FTEswere 20% <strong>of</strong> the total, including research postgraduates at 8%.(figure 2).Figure 2: Student FTEs by category <strong>of</strong> undergraduate andpostgraduate teaching and research6010,000% <strong>of</strong> submission50403020108,0006,0004,0002,00004* 3* 2* 1* URAE grade<strong>Royal</strong> <strong>Holloway</strong>National staff-adjusted mean02006/07 2007/08 2008/09 2009/10 2010/11UG PGT PGRFigure 3: Student FTEs by domicile90% <strong>of</strong> the College’s research was judged as grades 2* to 4*in the RAE 2008, with 60% judged to be world-leading orinternationally excellent (grades 3* to 4*) placing the College 18thin the sector national ranking for this second measure. The Collegemade 21 departmental submissions to units <strong>of</strong> assessment. 10departments across all 3 faculties were ranked in the top 10 in thecountry when measured by proportion <strong>of</strong> 3* and 4* activity, withMusic coming top nationally for its unit.The Research Excellence Framework (REF) is the successor to theRAE and submissions are due in 2013. Research publications willcontinue to be <strong>of</strong> fundamental importance. Reviews have beencarried out in each academic department with support fromexternal experts to evaluate their progress in achieving outputs atthe required level, and in some cases additional appointments havebeen made to strengthen their position.10,0008,0006,0004,0002,00002006/07 2007/08 2008/09 2009/10 2010/11Home and EU OverseasIn 2010-11 student FTEs decreased to 8,571 FTEs from 8,816 FTEsin 2009-10. Home and EU student numbers were stable, whileoverseas student numbers fell from 1,844 FTEs in 2009-10 to 1,598FTEs in 2010-11 (figure 3). Managing the intake <strong>of</strong> overseas studentnumbers at postgraduate level has proved to be difficult and thishas resulted in some fluctuations in the last three years. A higher3