landslide management using geospatial technology (lmgt)
landslide management using geospatial technology (lmgt)
landslide management using geospatial technology (lmgt)
- No tags were found...

You also want an ePaper? Increase the reach of your titles
YUMPU automatically turns print PDFs into web optimized ePapers that Google loves.
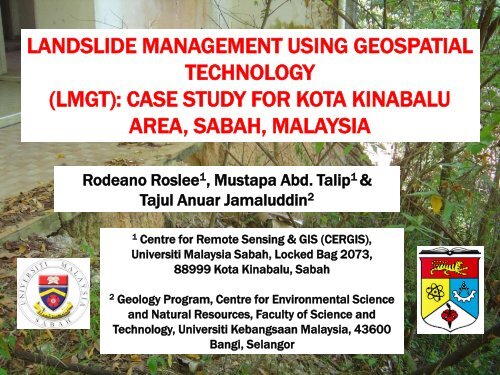
LANDSLIDE MANAGEMENT USING GEOSPATIALTECHNOLOGY(LMGT): CASE STUDY FOR KOTA KINABALUAREA, SABAH, MALAYSIARodeano Roslee 1 , Mustapa Abd. Talip 1 &Tajul Anuar Jamaluddin 21Centre for Remote Sensing & GIS (CERGIS),Universiti Malaysia Sabah, Locked Bag 2073,88999 Kota Kinabalu, Sabah2Geology Program, Centre for Environmental Scienceand Natural Resources, Faculty of Science andTechnology, Universiti Kebangsaan Malaysia, 43600Bangi, Selangor
OUTLINE Introduction Materials and Methods Results and Discussions Conclusions Acknowledgement
INTRODUCTION Landslide – Geohazards processcaused fatalities and property loss Occur in natural slopes and artificialslopes (cut and embankment). The frequency of <strong>landslide</strong> occurrencesgrowing each year:‣ Development increase on hilly/highlandareas.‣ Lack of experience and technicalweakness in slope engineering.‣ Lack of awareness and negligence.‣ Climate change.‣ Lack of monitoring & enforcement for thepolicies/guidelines/acts available.Highland Tower Landslide, Ampang(11th Dec 1993) (48 fatalities)
(Cont’d)Although <strong>landslide</strong> usually associated withhilly area, mountainous or hillside areas, butit can still happen in flat area.In flat areas, <strong>landslide</strong> may occur on cuts andembankment slopes (construction ofhighways and buildings), river bank, <strong>landslide</strong>spread type, collapse/subsidence/sinkholeand various types associated with quarryingand mining exposure.Rawang Perdana, 2001(Tajul Anuar Jamaluddin, 2009)
DEVELOPMENT ISSUES AND LANDSLIDE IN MALAYSIA1. Akta Pemuliharaan Tanah, 1960, Akta 385.2. Kanun Tanah Negara, 1965 (Akta 56/1995).3. Akta Jalan, Parit Dan Bangunan 1974, Akta 133.4. Akta Kualiti Alam Sekeliling, 1974, Akta 127.5. Akta Perancangan Bandar Dan Desa, Akta 172, (1976) dan Pindaan AktaPerancangan Bandar dan Desa, Akta A933(1995).6. Undang-Undang Kecil Bangunan Seragam, 1984.7. Penilaian Kesan Alam Sekitar, EIA (Jabatan Alam Sekitar Malaysia), 2003.8. Garis Panduan Pemeliharaan Topografi Semulajadi Di Kawasan BerbukitDalam Perancangan Dan Pembangunan Fizikal Oleh JPBD9. Garis Panduan/Sistem Pengurusan Cerun (Jabatan Kerja Raya) (SlopeMaintenance System (SMS), Malaysian Engineered Hillslope ManagementSystem (MEHMS), Combined Hydrological and Stability Model (CHASM),Slope Priority Ranking System (SPRS), Sistem Pengurusan MaklumatCerun (SIMS) & Slope Management and Risk Tracking System (SMART).
(Cont’d)10. Garis Panduan/Pemetaan Geologi Terain, Jabatan Mineraldan Geosains.11. Garis Panduan Unit Perancang Ekonomi (UPE).12. Mitigating the risk of <strong>landslide</strong> on hill-site developent (TheInstitution of Engineers).13. Garis Panduan Dewan Bandaraya Kota Kinabalu (DBKK).14. Penilaian Kesan Alam Sekitar (EIA) bagi pembinaan LerengBukit (Jabatan Perlindungan Alam Sekitar Negeri Sabah,Malaysia.
(Cont’d)Reality….?
(Cont’d)(Tajul Anuar Jamaluddin, 2009)
(Cont’d)IN SABAH….. ?
(Cont’d)
(Cont’d)Karambunai ResortKg. Lok Bunuq, Sepanggar(06/01/2001 & 12/10/2006)
(Cont’d)
Landslide records in MalaysiaBil Tarikh Lokasi Fatiliti/ Kerugian1. 17 Dis 1919 Bukit Tunggal, Perak 12 mati2. 18 Okt 1973 Gunung Cheroh, Perak 40 mati3. 1980 Batu Caves 13 mati4 10 April1992 Jalan Sultan Ismail, KLSebahagian jalanditutup5.Kuari di Pulak Salak Batu,27 Dis 1992Sandakan1 mati6.Koleksi surat khabar5 Feb 1993 Sekolah Menengah Maxwell, KLlama musnah7.Kampung Sri Serendah, 10 buah keluarga13 Mei 1993Serendahdipindahkan8. 15 Mei 1993 Pancor, Seremban 4 buah kereta musnah9.8 Sept 1993 Landasan keretapi Sungai BulohPerkhidmatan keretapitergendala10. 25 Okt 1993 Jalan Kuala Lipis-Gua Musang 1 terbunuh 1 cedera11. 16 Nov 1993 Taman Lipis II Kenderaan tertimbus12. 22 Nov 1993 Hong Seng Estate, Pulau Pinang 1 buah rumah musnah13. 28 Nov 1993 KM 63 Lebuhraya KL - Karak 2 mati14. 30 Nov 1993 Jalan Bandar Baru Salak – Nilai 2 mati15.1 buah van nyaris30 Nov 1993 Taman Golden Dragon, Kampartertimbus16.Blok 1 Highland Towers,11 Dis 199348 matiAmpang17. 15 Dis 1993 Kuala Lipis 9 kereta tertimbus18. 22 Mac 1994 Pine Resort, Bukit Fraser Apartment rosak19.Perumahan Puchong2 Mei 19943 matiPerdana(bekas lombong)20. 30 Mei 1994 Lombong Bijih timah di Kampar 2 mati21. 17 Nov 1994 Km 81 Jalan Gerik-Jeli 2 mati26.27.28.29.30.31.32.33.34.35.36.37.38.39.40.41.42.43.8 Dis 1994 Cameron Highland30 Jun 1995Genting Sempah, jalanke Genting Highlands9 Okt 1995 Masjid Tanah, Melaka16 Okt 1995 Changkat Tunku1 Nov 19956 Jan 199630 Ogos 199610 Okt 199618 Okt 1996Jalan Tapah-CameronHighlandsGua Gempurung,Lebuhraya Utara-SelatanAliran debris PosDipang, Kampar, Perak.Km 49 Jln Ipoh, KualaTerla, Cameron HighlandTanah Rata CameronHighland Pahang18 Okt 1996 Gelang Patah Johor13 Feb 199712 Mac 1997Km 4.5 Jln Tuaran,SabahRumah Panjang KTM,Kg Kerinchi11 Mei 1997 Jalan Pantai Dalam, KL9 Okt 199725 Dis 1997Jalan Tok Ungku,SerembanKm14 Lebuhraya HuluLangat-Ampang27 Ogos 1998 Puchong Jaya28 Nov 1998Bukit Awana, PulauPinang24 Dis 1998 Taman Kejora 1, Kulim7 mati, 3 buahrumah musnah20 mati, 22 cederaBahagian sisi kedaimusnahBahagian belakangrumah musnahJalan ditutup1 mati, 1 loritertimbus44 mati, 9 hilang &kampung musnah4 mati, 2 cedera16 keluargadipindahkan1 maut, 6 keluargadipindahkanSebahagian jalantertimbus1 cedera1 mati 4 cedera, 19keluargadipindahkan1 mati3 mati1 buah keretatertimbus15 kenderaantertimbus20 orangdipindahkan
(Cont’d)44.45.46.47.15 Mei 1999 Bukit Antarabangsa7 Jan 20009 Jan 2000Kampung Raja, Batu 48and Batu 49,TringkapTanah Rata – Brinchang,Cameron Highland10 ribu pendudukterkandasGangguan5 mati7 Feb 2000 Sandakan, Sabah 17 cedera48.Kampung Sri Damai,25 Feb 2000Taman Kencana, Ampang49. 28 OgosSubang Jaya200050.28 Dis 2000 Taman Rasa Jaya51.52.21 Sept2001Kg. Sungai Chinchin, Bt.8, Jln Gombak, Selangor1 matiPerkhidmatankomuter tergendala5 buah rumahmusnah1 maut, beberapabuah rumah dankenderaan rosak7 Jan 2001 Sepanggar Bay, Sabah 3 mati53. 13 April2001Tmn Rawang Perdana,RawangRumah-rumahrosak54. 22 Sept Sg Chinchin, Km 13, Jln2001Gombak1 mati55.28 Dis 2001 Gunung Pulai, Johor 4 mati56.57.58.59.28 Jan 200220 Nov 200226 Nov 200312 Oct. 2004Simunjan, Kuching,SarawakTaman Hillview, AmpangJayaRuntuhan batuan di BukitLanjan (North KlangValley Expressway)Debris flow at GuaTempurung (PLUSHighway)16 mati, beberapabuah rumahmusnah8 mati, 5 cederaLebuhrayaterpaksa ditutupuntuk tempoh > 6bulan.Kerosakan padajambatan60. 5 Nov. 2004 Taman Harmonis, Gombak 1 maut, 1 rumah rosak61.Kg Pasir, Hulu Kelang, 4 maut, 3 blok rumah31 Mei 2006Selngorpanjang rosak62.Jalan Persekutuan 606 1 maut dan beberapa buah26 Jun 2006Sepanggar, Sabahrumah musnah63.Penduduk 3 blok rumahSection 10, Wangsa Maju,9 Okt 2006panjang terpaksaKuala Lumpurdipindahkan64.Jln Tg. Tualang-Sg. Durian, Jalan ditutup secara berkalaOkt. 2006Perakuntuk kerja membaikpulih65.Kuarters Kerajaan, Presinct22 Mac 20079, Putrajaya25 kenderaan rosak66.Kolej Ibrahim Yaakub,Sept. 2007UKM Bangi1 blok asrama dikosongkanSources: Shu et al. 1981, Chow 1981, Chow 1984, Chan, 1998, TajulAnuar Jamaluddin et al. 2003, http//:www.emedia.com.my, News StraitsTimes 2007, Institut Penyelidikan Tanah Runtuh Negara (NASREC)UiTM (2007), Cawangan Kejuruteraan Cerun JKR, (2007) & TajulAnuar Jamaluddin 2009.
LANDSLIDE MORPHOLOGYVarnes (1978)
(Cont’d)
LANDSLIDE CAUSING FACTORSNatural Factors:Geology‣ Rock types, mineral content, texture, grain size etc. Geomorphologiy‣ Slope locations and geomorphological process. Weathering‣ Physical & chemical change. Geological structures and discontinuities‣ Geomechanic identifications. Precipitation/Water runoff/Groundwater table‣ Water and/or snow as triggering factors. Aktiviti Seismos (gegaran gempabumi)‣ Earthquakes as triggering factors.
(Cont’d)Non-Natural Factors: Design/engineeringweakness (e.g. slopebuilt too steep, too high). Deforestation, hilldenudation, loadingabove slope, too steepat foot slope, etc.).
(Cont’d)Non-Natural Factors: Incompatibility landuse (construction onslope too steep, activeslope, weak bedrock,etc.) Lack of maintenance(clogged drains,drainage systemsmalfunction, erosion,etc.).
(Cont’d)Non-Natural Factors: The vibration ofheavy vehicles, workpiling or blastingrocks in nearbyquarry, etc. Lack of supervisionduringtheconstruction ofstabilizationstructures/slopeprotection.
MATERIALS AND METHODS
LANDSLIDE MANAGEMENT USING GEOSPATIAL TECHNOLOGY (LMGT) What are the probable dangers/problems? [DangerIdentification]What would be the magnitude of dangers/problems?[Hazard Assessment]What are the possible consequences and/or elements atrisk? [Consequence/Elements at Risk Identification]What might be the degree of damage in elements atrisk? [Vulnerability Assessment] What is the probability of damage? [RiskQuantification/Estimation] What is the significance of estimated risk? [RiskEvaluation]What should be done? [Risk Management]
(Cont’d)LRM Cycles (Taubenb¨ock et al., 2007)
(Cont’d)Relationship in LRM (Alexander, 2002)
(Cont’d)
CONCEPTSRisk = Hazard x Elements at risk x VulnerabilityVulnerability: The degree of loss to a given element or set ofelements within the area affected by a hazard. It is expressed on ascale of 0 (no loss) to 1 (total loss).Elements at risk: Population, buildings and engineering works,infrastructure, environmental features and economic activities in thearea affected by a hazard.Hazard: Probability that a particular danger (threat) occurs within agiven period of time.
Rating value for <strong>landslide</strong> hazard analysis (LHA)NoLandslide HazardIdentifications1 Geology2 Soil TypesFactors Parameter Lithology‣ Quaternary Alluvium (Clay, silt, sand & peat)‣ Arenaceous and argillaceous rocks, coal and calcareous beds‣ Argillaceous rocks; some arenaceous and calcareous beds‣ Argillaceous rocks; some arenaceous and calcareous rocks, and associatedchert, lava and pyroclastics‣ Mainly metamorphic rocks of amphibolite, gneiss and schist and associatedgranite, granodiorite and tonalite (Crystalline Basement)‣ Gabbro, dolorite, diorite and their fine-grained equivalents‣ Serpentinite, peridotite, dunite and pyroxenite‣ Granodiorite, diorite and granite Fault (distance)‣ < 10 m‣ 11 m – 50 m‣ 51 m – 99 m‣ > 100 m‣ Thionic fluvisols, dystric histosol and thionic gleysol‣ Dystric & eutric regosols, humic, dystric & eustric gleysols and gleyic podzol‣ Eutric fluvisol, gleyic, dystric & eutric cambisols, humic, dystric and eutricgleysols‣ Gleyic acrisols, gleyic luvisols, humic, dystrik and eutric gleysols‣ Humic, dystrik & eutric gleysols and dystric histosols‣ Dystric histosols and humic gleysol‣ Orthic, ferric & gleyic acrisols and gleyic podzol‣ Orthic, ferric and gleyic acrisols‣ Orthic acrisols and dystric cambisol‣ Orthic acrisols, chromic, dystric cambisol and lithosolRating Value15.013.011.010.08.07.06.05.05.03.51.50.510.09.08.07.06.05.04.03.02.01.0
(Cont’d)NoLandslide HazardIdentifications3 Slope Gradient4Hydrology andGeohydrology5 Types of land useFactors ParameterRatingValue‣ 60 o15.0‣ 0 o – 5 o 5.0‣ 31 o – 60 o12.5‣ 16 o – 30 o10.0‣ 6 o – 15 o7.5 Precipitation (monthly ave.)‣ > 300 mm‣ 201 mm – 300 mm‣ 101 mm – 200 mm‣ 41 mm – 100 mm‣ 0 mm – 40 mm Water runoff (distance)‣ < 5 m‣ 6 m – 10 m‣ 11 m – 15 m‣ 16 m – 20 m‣ > 20 m‣ Commercial sector‣ Residential sector‣ High education institutions & school‣ Industrial sector‣ Public infrastructure sector‣ Agriculture, forestry and others10.08.06.04.02.010.08.06.04.02.015.013.011.09.07.05.0
(Cont’d)No6Landslide HazardIdentifica-tionsEngineeringcharacteristics ofsoils and rocksFactors Parameter Soil Shear Strength () (kN/m 2 )‣ < 20‣ 20 – 40‣ 40 – 75‣ 75 – 150‣ 150 – 300‣ > 300 Standard penetration test (SPT) (N) Cohesive soil‣ 0 – 2‣ 2 – 4‣ 4 – 8‣ 8 – 15‣ 15 – 30‣ > 30or, Non-cohesive soil‣ 0 – 4‣ 4 – 10‣ 10 – 30‣ 30 – 50‣ > 50RatingValue5.04.03.02.01.00.55.04.03.02.01.00.55.04.03.02.01.0
(Cont’d)No6LandslideHazardIdentifica-tionsEngineeringcharacteristicsof soils androcksFactors Parameter Rock Shear Stress () (kN/m 2 )‣ < 25‣ 25 – 50‣ 50 – 100‣ 100 – 250‣ > 250 Rock quality designation (RQD) (%)‣ < 25‣ 25 – 50‣ 50 – 75‣ 75 – 90‣ 90 – 100RatingValue5.04.03.02.01.05.04.03.02.01.0
RESULTS AND DISCUSSIONS
Landslide Hazard Analysis (LHA) Landslide hazard Analysis (LHA) is the fundamentalinformation for any hazard assessment or every finalassessment in <strong>landslide</strong> studies. In this study, LHA were categories into seven parameters:1) Geology,2) Geodynamic features3) Slope conditions4) Hydrology/geohydrology5) Types of landuse, and6) Engineering characteristics of soils and rocks.
(Cont’d)Geological mapLandslide distributions map‣ 0 o – 20 o ” (49 %)‣ 21 o – 40 o (5 % )‣ 41 o – 60 o (33%)‣ 61 o – 80 o (12%)‣> 80 o (1%)Digital elevation model (DEM)Slope gradient map
(Cont’d)Hydrology mapGeohydrology map‣ Residential sector(15%)‣ Commercial sector(10%)‣ Industrial sector(8%)‣ Higher educationinstitutions & schoolssector (7%)‣ Public infrastructuresector (5%)Land use mapSoil types map
(Cont’d)Analysis results of rock samplesOutcrop Locations RS1 RS2 RS3 RS4 RS5 RS6 RS7CoordinatesLithology6°1'16.60"U/116°6'45.64"TInterbeddedsandstoneshale5°56'23.85"U/116°3'27.37"TInterbeddedsandstone-shale5°58'18.41"U/116°4'37.13"TInterbeddedsandstone-shale5°59'13.81"U/116°4'37.04"TInterbeddedsandstoneshale5°58'31.61"U/116°4'10.30"TInterbeddedsandstoneshale6°6'59.46"U/116°9'53.46"TInterbeddedsandstoneshale5°56'50.70"U/116°5'44.11"TInterbeddedsandstone-shaleWeathering grade II to V IV to V III to V III to IV III to IV III to IV III to IVRock Quality Designation (RQD) (%) 9 – 87 13 – 34 6 – 63 38 – 77 12 – 65 15 – 35 12 – 28Point load strength index, I s(50) 0.42 – 4.80 1.04 – 5.20 3.12 – 11.45 8.33 – 13.53 0.22 – 1.76 0.81 – 3.67 0.62 – 2.39Uniaxial compressive strengthcorrelation, UCS = 24 I S (50) (mPa)10.19 – 115.20 24.99 – 124.90 74.94 – 274.79199.85 –324.755.28 – 42.24 19.44 – 88.08 14.88 – 57.36Outcrop Locations RS8 RS9 RS10 RS11 RS12 RS13 RS14CoordinatesLithology5°55'10.06"U/116°6'51.31"TInterbeddedsandstoneshale5°55'2.07"U/116°5'41.20"TInterbeddedsandstone-shale5°58'11.14"U/116°5'29.89"TInterbeddedsandstone-shale5°55'56.11"U/116°7'1.67"TInterbeddedsandstoneshale6°2'40.14"U/116°9'26.51"TInterbeddedsandstoneshale6°0'16.50" U/116°7'51.67"TInterbeddedsandstoneshale6°6'7.09"U/116°10'29.69"TInterbeddedsandstone-shaleWeathering grade III to IV IV to V III to IV III to IV III to IV III to V II to IVRock Quality Designation (RQD) (%) 18 – 38 10 – 25 12 – 43 17 – 31 18 – 45 5 – 25 16 – 86Point load strength index, I s(50) 0.08 – 1.12 0.04 – 0.16 0.76 – 4.40 0.12 – 0.44 0.04 – 0.32 1.04 – 5.20 0.10 – 0.73Uniaxial compressive strengthcorrelation, UCS = 24 I S (50) (mPa)1.92 – 26.88 0.96 – 3.84 18.24 – 105.60 2.88 – 10.56 0.96 – 7.68 24.99 – 124.90 2.40 – 17.52Outcrop Locations RS15 RS16 RS17 RS18 RS19 RS20CoordinatesLithology5°55'10.27"U/116°3'39.42"TInterbeddedsandstoneshale6°7'15.00"U/116°12'30.38"TInterbeddedsandstone-shale6°0'56.04"U/116° 7'36.55"TInterbeddedsandstone-shale6°0'27.16"U/116° 8'54.60"TInterbeddedsandstoneshale6°0'26.38"U/116°7'49.42"TInterbeddedsandstoneshale5°58'26.97"U/116°4'55.00"TInterbeddedsandstoneshaleWeathering grade III to V III to IV IV to V III to IV III to V II to IVRock Quality Designation (RQD) (%) 8 – 50 12 – 35 10 – 20 22 – 55 15 – 40 12 – 37Point load strength index, Is(50) 0.14 – 0.52 0.38 – 7.68 0.55 – 2.89 1.35 – 2.71 0.48 – 1.25 1.04 – 10.41Uniaxial compressive strengthcorrelation, UCS = 24 IS (50) (mPa)3.36 – 12.48 9.12 – 184.32 13.20 – 69.36 32.48 – 64.95 11.52 – 30.00 24.98 – 249.81
(Cont’d)Analysis results of soil samplesOutcrop Locations SS1 SS2 SS3 SS4 SS5 SS6 SS7 SS8Coordinates6°1'16.60"U/116°6'45.64"T5°56'23.85"U/116°3'27.37"T5°58'18.41"U/116°4'37.13"T5°59'13.81"U/116°4'37.04"T5°58'31.61"U/116°4'10.30"T6°6'59.46"U/116°9'53.46"T5°56'50.70"U/116°5'44.11"T5°55'10.06"U/116°6'51.31"TSoil Association (s) Weston Dalit Kinabatangan Sapi Lokan Tuaran Klias Tanjung AruClassification (BS5930) SM CL CH CL CL SM SC SMWeathering grade V to VI V to VI V to VI V to VI V to VI V to VI V to VI V to VIStandard Penetration Test (N) 36 – 50 11 – 50 3 – 50 9 – 15 5 – 14 1 - 15 9 – 29 9 – 23Clay (0.002 mm) 7 – 18 50 10 – 16 29 – 67 41 – 55 5 - 15 10 – 22 20 – 24Silt (0.002 - 0.0063 mm) 10 – 20 31 6 – 10 10 – 30 20 – 30 10 – 24 17 – 25 20 – 22Sand (0.0063 – 2.000 mm) 18 – 62 13 33 – 50 3 – 60 14 – 35 60 – 80 44 – 72 47 – 90Gravel (2.000 – 63.000 mm) 1 – 60 6 24 – 64 0 – 7 1 – 4 1 – 15 1 – 24 1 – 13Liquid Limit (LL) (%) - 48 33 – 50 29 – 47 42 – 44 - - -Plastic Limit (PL) (%) - 23 16 – 26 17 – 26 20 – 24 - - -Plasticity Index (PI) (%) - 25 17 – 24 12 – 21 20 – 22 - - -Cohesion, C (kN/m 2 ) 12.43 14.25 3.92 – 9.81 6.82 – 21.62 13.71 18.31 – 33.98 12.30 10.4 – 10.6Friction angle ( o ) 15.86 20.60 21.20 – 28.47 2.47 – 3.43 17.90 1.80 – 3.89 26.70 3.39 – 15.30Undrained Shear Strength (S)(kN/m 2 )97.66 89.43 81.49 – 118.27 15.45 – 33.61 78.31 27.74 – 54.38 163.18 28.17 – 92.67Outcrop Locations SS9 SS10 SS11 SS12 SS13 SS14 SS15 SS16Coordinates5°55'2.07"U/116°5'41.20"T5°58'11.14"U/116°5'29.89"T5°55'56.11"U/116°7'1.67"T6°2'40.14"U/116°9'26.51"T6°0'16.50" U/116°7'51.67"T6°6'7.09"U/116°10'29.69"T5°55'10.27"U/116°3'39.42"T6°7'15.00"U/116°12'30.38"TSoil Association (s) Lokan Brantian Brantian Klias Kinabatangan Crocker Tanjung Aru WestonClassification (BS5930) CL SM SM SC CH CH SM SMWeathering grade V to VI V to VI V to VI V to VI V to VI V to VI V to VI V to VIStandard Penetration Test (N) 5 – 42 7 – 13 2 – 16 9 – 15 3 – 33 18 – 49 6 – 30 2 – 23Clay (0.002 mm) 41 – 45 18 – 20 11 – 17 13 – 15 27 – 64 33 – 49 1 – 15 2 – 28Silt (0.002 - 0.0063 mm) 20 – 26 24 – 28 10 – 20 20 – 22 20 – 30 30 – 38 1 – 26 2 – 20Sand (0.0063 – 2.000 mm) 3 – 39 46 – 50 51 – 79 57 – 63 6 – 51 4 – 41 56 – 94 14 – 20Gravel (2.000 – 63.000 mm) 1 – 3 2 – 12 1 – 17 4 – 7 1 – 3 0 – 6 0 – 10 1 – 7Liquid Limit (LL) (%) 33 – 49 - - - 54 - 56 28 – 65 - -Plastic Limit (PL) (%) 15 – 20 - - - 21 - 27 16 – 31 - -Plasticity Index (PI) (%) 18 – 29 - - - 29 – 33 12 – 34 - -Cohesion, C (kN/m 2 ) 9 – 13.1 12.00 9.40 5.81 – 9.57 13.42 – 15.72 9.96 – 19.27 4.95 – 15.99 1.67 – 9.36Friction angle ( o ) 5.2 – 11.1 13.46 14.52 7.46 – 24.26 4.51 – 6.01 3.13 – 16.80 8.31 – 17.85 4.27 – 7.64Undrained Shear Strength (S)(kN/m 2 )27.20 – 52.34 83.80 87.1045.09 –144.7729.20 – 36.78 20.89 – 79.6548.77 –112.6024.07 – 49.60
(Cont’d)Analysis results of soil samplesOutcrop Locations SS17 SS18 SS19 SS20Coordinates6°0'56.04"U/ 6°0'27.16"U/ 6°0'26.38"U/ 5°58'26.97"U/116° 7'36.55"T 116° 8'54.60"T 116°7'49.42"T 116°4'55.00"TSoil Association (s) Dalit Sapi Tuaran CrockerClassification (BS5930) CL CL SM CLWeathering grade V to VI V to VI V to VI V to VIStandard Penetration Test (N) 2 – 20 16 – 50 3 – 16 3 – 39Clay (0.002 mm) 34 – 40 27 – 60 6 – 12 49 – 52Silt (0.002 - 0.0063 mm) 20 – 34 20 – 30 6 – 10 20 – 40Sand (0.0063 – 2.000 mm) 26 – 45 9 – 43 76 – 86 8 – 30Gravel (2.000 – 63.000 mm) 0 – 1 1 – 15 1 – 4 0 – 1Liquid Limit (LL) (%) 28 – 33 34 – 46 - 27 – 36Plastic Limit (PL) (%) 15 – 17 14 – 18 - 15 – 21Plasticity Index (PI) (%) 13 – 16 20 – 28 - 12 – 15Cohesion, C (kN/m 2 ) 13.95 – 14.58 42.89 – 44.86 4.70 – 8.46 3.46 – 11.95Friction angle ( o ) 3.81 – 4.15 4.44 – 4.78 2.22 – 6.86 3.01 – 7.54Undrained Shear Strength (S)(kN/m 2 )27.27 – 29.09 58.42 – 61.58 20.09 – 40.79 13.98 – 38.42
(Cont’d)‣ Very Low Hazard(10 %)‣ Low Hazard (16%)‣ ModerateHazard(14% )‣ High Hazard (48%)‣ Very High Hazard(12%)Landslide hazard analysis results
(Cont’d)Population Map (PM) Kota Kinabalu City area estimated having highestpopulations of 457,661 persons, followed byPenampang area of 170,357 persons, and the Tuaranarea of 104,659 persons. Population rate increments in study area wereestimated about 30 % to 50 % for each 10 year (Year1980: 195,097, year 1991: 360,111, year 2000:563,597 & year 2008: 732,677) (Jabatan PerangkaanMalaysia, 2008). This situation indicates that the elements at risk(people, vehicles, infrastructure and property) willcontinue to rise.Property Value Map (PVM) A total of four (4) main land use is taken intoaccount in this paper namely the residential sector,commercial sector, industrial sector, and agricultural,forestry and others sectors.Based on the results of LMGT analysis carried out,commercial property sector recorded the highestvalue of (751,125,100,000) (00,000'), followed bythe residential sector (42,260,953,000) (00,000'),industrial sector (603,765,000) (00,000') andagricultural, forestry and others sectors(211,577,000) (00,000').
(Cont’d)‣ Very Low Risk zone(14%)‣ Low Risk zone(10%)‣ Moderate Riskzone (52%)‣ High Risk zone(22%)‣ Very High Riskzone (2%)Landslide risk analysis results
(Cont’d)Family of F-N curves by Proske (2006)
(Cont’d)Risk criteria for natural hillsides by GEO (1998)
(Cont’d)Definitions of "acceptance criteria" for <strong>landslide</strong>sNo. Risk QualifierDefinition1 Acceptable Level society desires to achieve2 TolerableLevel society accepts to live with tosecure certain benefits3 Individual Imposed on an individual4 Societal Imposed to society as a whole5 VoluntaryRisk voluntarily faced to gainbenefits6 Involuntary Risk imposed by a body7 Specific Risk for a specific element8 Total Sum of specific risks
CONCLUSIONS1. In terms of <strong>landslide</strong> hazards, the resulted LHM of Kota Kinabalu areasuggests that 10% of the area can be categorised as Very Low Hazard, 16%as Low Hazard, 14% as Moderate Hazard, 48% as High Hazard and 12% asVery High Hazard. Whereas, in terms of <strong>landslide</strong> risks, the LRM indicatesthat 14% of the area is in Very Low Risk zone, 10% in Low Risk zone, 52%in Medium Risk zone, 22% in High Risk zone and 2% in Very High Riskzone. Areas with low degree of <strong>landslide</strong>s hazard does not mean have thelow risk to experience <strong>landslide</strong>s, and vice-versa.2. The benefit of a LMGT is to provide insight and options for decision-makingin practical problems. The benefits includes: It encourages a rational, systematic approach for assessing the safety of slopes, and aframework to put uncertainties and engineering judgment into a system and allowscomparison of hazards and risks for different slopes. It focuses attention or what happens if the slope fails and liabilities and responsibilities ofthe parties involved and provides an open and transparent process on the nature and keycontributors of risk and uncertainty for discussion with the regulators, owners, stakeholders,etc. (Fell et al., 2005). It increases awareness of the need to consider uncertainties, and insight on what can gowrong and their potential consequences.
(Cont’d)3. Due to its generalized data input, the resulting LMGT cannot be used bylocal administration for detailed engineering structural design, but it is ofgreat value for either local and federal departments government ordevelopers to locate areas prone to <strong>landslide</strong> hazard or high risk areas, toorganize more detailed analysis in the identified “hot spot” (hazardousareas) and can manage the impact of <strong>landslide</strong> disaster that may affectthe regional economy (loss and damage to property), or welfare of thecommunity (deaths and homeless) (risky areas).
ACKNOWLEDGEMENT‣ Centre for National Infrastructures of GeospatialData (MAcGDI)‣ Ministry of Natural Resources and Environment‣ Universiti Malaysia Sabah (UMS) – CERGIS‣ Universiti Kebangsaan Malaysia (UKM) - SEDPRI