

habitat suitability index models and instream flow suitability curves
habitat suitability index models and instream flow suitability curves
habitat suitability index models and instream flow suitability curves

You also want an ePaper? Increase the reach of your titles
YUMPU automatically turns print PDFs into web optimized ePapers that Google loves.
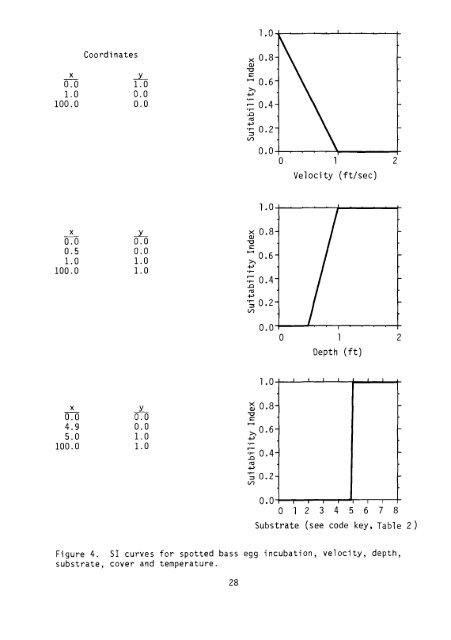
Coordinatesx 1-0.0 1.01.0 0.0100.0 0.01. a+--~----"""""---~---Ix0.8Q)-0I::..... 0.6~;= 0.4'r-..0rcl-+J.; 0.2V')012Velocity (ft/sec)x0.00.51.0100.010.00.01.01.01.a-1---...........----lo-----1-x 0.8Q)-0I::..... 0.6~'r-:;:: 0.4..0rcl-+J's 0.2V')a.a-+--~I...,..--.-___r_-.........--.----.-__I_a 1Depth (ft)2x0.04.95.0100.010.00.01.01.0~ 0.8--0I::.....>, 0.6--+J'r-~ 0.4-rcl-+J.; 0.2-V')a.a-+-..,........,..-.,.-~r_....____,__-+012345678Substrate (see code key, Table 2)Figure 4. SI <strong>curves</strong> for spotted bass egg incubation, velocity, depth,substrate, cover <strong>and</strong> temperature.28


