good practices in slovene public administration 2009 - Ministrstvo za ...
good practices in slovene public administration 2009 - Ministrstvo za ...
good practices in slovene public administration 2009 - Ministrstvo za ...

You also want an ePaper? Increase the reach of your titles
YUMPU automatically turns print PDFs into web optimized ePapers that Google loves.
GOOD PRACTICES INSLOVENE PUBLIC ADMINISTRATION <strong>2009</strong>Conference Proceed<strong>in</strong>gs
REPUBLIC OF SLOVENIAMINISTRY OF PUBLIC ADMINISTRATIONCONFERENCEGOOD PRACTICES INSLOVENE PUBLIC ADMINISTRATION<strong>2009</strong>CONFERENCE PROCEEDINGS21 st October <strong>2009</strong>
ISBN 961-6651-10-39 7 8 9 6 1 6 6 5 1 1 03CIP - Kataložni <strong>za</strong>pis o publikacijiNarodna <strong>in</strong> univerzitetna knjižnica, Ljubljana35(497.4)(082)(0.034.2)KONFERENCA Dobre prakse v slovenski javni upravi (<strong>2009</strong> ; Brdopri Kranju) Zbornik referatov [Elektronski vir] / Konferenca Dobreprakse v slovenski javni upravi <strong>2009</strong>, Brdo pri Kranju, 21. oktober <strong>2009</strong> ;uredila Gordana Žurga ; prevajanje Sektor <strong>za</strong> prevajanje pri Generalnemsekretariatu Vlade Republike Slovenije = Conference proceed<strong>in</strong>gs /Conference Good Practices <strong>in</strong> Slovene Public Adm<strong>in</strong>istration <strong>2009</strong>,Brdo pri Kranju, 21st October <strong>2009</strong> ; editor Gordana Žurga ; translationTranslation and Interpretation Division of the Secretariat-General ofthe Government of the Re<strong>public</strong> of Slovenia. - Ljubljana : M<strong>in</strong>istrstvo <strong>za</strong>javno upravo Republike Slovenije, <strong>2009</strong>ISBN 978-961-6651-10-31. Dobre prakse v slovenski javni upravi 2. Žurga, Gordana248740608Published by: M<strong>in</strong>istry of Public Adm<strong>in</strong>istration of the Re<strong>public</strong> of SloveniaConference Programme Committee: Irma Pavl<strong>in</strong>ič Krebs, President, Dr Ivan Eržen, Miran Falež, Aleš Hauc,Prof Dr Lučka Kajfež Bogataj, Štefka Korade Purg, Dr Gordana Žurga, Deputy PresidentEditor: Dr Gordana ŽurgaLanguage Edit<strong>in</strong>g and Translation: Translation and Interpretation Division of the Secretariat-General ofthe Government of the Re<strong>public</strong> of SloveniaEdition: 300 izvodov
C O N T E N T SPageDr Gordana ŽurgaQUALITY AS A VALUE IN SLOVENE PUBLIC ADMINISTRATION . . . . . . . . . . . . . . . . . . . . . . . . 5Dom<strong>in</strong>ique LapierreAN OVERVIEW OF THE FRENCH ADMINISTRATIVE REFORM . . . . . . . . . . . . . . . . . . . . . . . . . 19Mirko PlojDEVELOPMENT AND USE OF THE MOBILITY APPLICATIONIN THE MARIBOR POLICE DIRECTORATE . . . . . . . . . . . . . . . . . . . . . . . . . . . . . . . . . . . . . . . . . . . . . 25Ana JakšičAPPLICATION FOR ASSESSING DAMAGE TO CROPS AND DAMAGE TOPROPERTY – AJDA . . . . . . . . . . . . . . . . . . . . . . . . . . . . . . . . . . . . . . . . . . . . . . . . . . . . . . . . . . . . . . . . . . . . 39Jože Preskar, Zdenka Bajuk, Nevenka OrehekCHANGE MANAGEMENT IN THE NOVO MESTO ADMINISTRATIVE UNIT . . . . . . . . . . . . . 57Mart<strong>in</strong>a Kačičnik Jančar MSc, Matej Petkovšek, Mirjam Galičič Ph D, Matej Simčič,Tilen Smolnikar MSc, Roberto DeganNATURE CONSERVATION ATLAS . . . . . . . . . . . . . . . . . . . . . . . . . . . . . . . . . . . . . . . . . . . . . . . . . . . . . 77Rajko HadjarCOMPUTER-ASSISTED TAX INSPECTION AND STANDARD AUDIT FILES . . . . . . . . . . . . . . . 91Darija Mohorič MSc, Majda Meško MSc, Aleksandra Stamničar Veronik, Helena SagajACHIEVING EFFICIENCY THROUGH RISK MANAGEMENT . . . . . . . . . . . . . . . . . . . . . . . . . . . 111Katja ŠnuderlINTERACTIVE STATISTICAL ATLAS OF SLOVENIA . . . . . . . . . . . . . . . . . . . . . . . . . . . . . . . . . . . . 129Damjan Vrečko, Jožica Tamše MScADMINISTRATIVE UNIT CELJE: COOPERATION WITH THE MEDIA FOR AMORE EFFICIENT AND USER-FRIENDLY PUBLIC ADMINISTRATION . . . . . . . . . . . . . . . . . . 137Mojca Žitnik, MScREDUCING THE RESPONSE BURDEN OF REPORTING UNITS THROUGHHARMONISATION OF ENVIRONMENTAL DATA COLLECTION . . . . . . . . . . . . . . . . . . . . . . . 145
QUALITY AS A VALUE IN SLOVENE PUBLICADMINISTRATIONDr Gordana ŽURGAM<strong>in</strong>istry of Public Adm<strong>in</strong>istrationgordana.zurga@gov.si1 INTRODUCTIONIntensive development <strong>in</strong> the area of quality <strong>in</strong> <strong>public</strong> adm<strong>in</strong>istration of theRe<strong>public</strong> of Slovenia has been evident s<strong>in</strong>ce the year 1999. In March 1999 theQuality Committee was established at the M<strong>in</strong>istry of the Interior which was,at that time <strong>in</strong> charge for the system of <strong>public</strong> adm<strong>in</strong>istration. Purpose of theQuality Committee was def<strong>in</strong>ed as efficient, citizen-friendly, transparent and responsiblestate adm<strong>in</strong>istration. In the year 2002, quality becomes one of the pillarsof the Slovenian <strong>public</strong> adm<strong>in</strong>istration’s reform; customer orientation, responsibilityof <strong>public</strong> adm<strong>in</strong>istration <strong>in</strong>stitutions for the results and for efficiency,and the role of <strong>public</strong> management were put <strong>in</strong> focus of the government’soperations. New impetus to the further quality development was achieved byestablish<strong>in</strong>g the M<strong>in</strong>istry of Public Adm<strong>in</strong>istration <strong>in</strong> December 2004. Dur<strong>in</strong>gthe years of <strong>in</strong>tensive work <strong>in</strong> the area of quality, activities and projects werebroadened to the area of excellence as well, and scope of act<strong>in</strong>g was widenedfrom the state adm<strong>in</strong>istration to the <strong>public</strong> adm<strong>in</strong>istration and even to the <strong>public</strong>sector.Important guidance to activities <strong>in</strong> the area of quality and bus<strong>in</strong>ess excellence<strong>in</strong> <strong>public</strong> adm<strong>in</strong>istration <strong>in</strong> the Re<strong>public</strong> of Slovenia was given by the NationalQuality Programme of the Re<strong>public</strong> of Slovenia from 1993. In the year 1996, theQuality Policy of State Adm<strong>in</strong>istration Statement was adopted by the Government,and <strong>in</strong> the year 2003 Quality Policy of Public Adm<strong>in</strong>istration Statementfollowed. Further development strategy of the Slovenian <strong>public</strong> sector 2003-2005 was adopted <strong>in</strong> the year 2003 and <strong>in</strong>cluded quality management andcustomer orientation as important parts. S<strong>in</strong>ce 2005, quality of <strong>public</strong> adm<strong>in</strong>istrationis <strong>in</strong>corporated <strong>in</strong> two important documents: Slovenian DevelopmentStrategy and the Reform Programme for achiev<strong>in</strong>g the Lisbon strategy Goals (C– Third developmental priority: Efficient and less costly state). In the year <strong>2009</strong>,we would like to strenghten the strategic dimension of quality and bus<strong>in</strong>essexcellence therefore the process of the Further development strategy of qualityand bus<strong>in</strong>ess excellence <strong>in</strong> <strong>public</strong> adm<strong>in</strong>istration of the Re<strong>public</strong> of Sloveniawas started.
QUALITY AS A VALUE IN SLOVENE PUBLIC ADMINISTRATION2 EXCELLENCE AS A GOAL, QUALITY AS A VALUEDevelopment made so far <strong>in</strong> the area of quality and bus<strong>in</strong>ess excellence provesthat the excellence of Slovenian <strong>public</strong> adm<strong>in</strong>istration is be<strong>in</strong>g affirmed as agoal, and quality as one of its central values.Quality is a value especially when it is <strong>in</strong>corporated <strong>in</strong> all operations of an organi<strong>za</strong>tionand its employees who <strong>in</strong>ternalized the pr<strong>in</strong>ciples of quality andexcellence and the organi<strong>za</strong>tion itself is <strong>in</strong> the circle of cont<strong>in</strong>uous learn<strong>in</strong>g andimprovements. It takes time to carry quality <strong>in</strong>to real effect, as well as cont<strong>in</strong>uity<strong>in</strong> actions <strong>in</strong>clud<strong>in</strong>g constancy of purpose and credibility of leaders, andprogress<strong>in</strong>g step-by-step.Also the research – comparative analysis of quality management <strong>in</strong> <strong>public</strong> adm<strong>in</strong>istrations<strong>in</strong> the EU member states 1 , conducted <strong>in</strong> the year 2008, has shownthat characteristics and results of quality management <strong>in</strong> <strong>public</strong> adm<strong>in</strong>istrationsare dependent on the tradition countries have <strong>in</strong> this area.Figure 1 illustrates characteristics of quality management (QM) <strong>in</strong> <strong>public</strong> adm<strong>in</strong>istrationsof the EU <strong>in</strong> relation to tradition whereas Figure 2 shows whenthe member states started quality <strong>in</strong>itiatives <strong>in</strong> their <strong>public</strong> adm<strong>in</strong>istrations.Shorter QM Tradition LongerQuality is <strong>in</strong>corporated <strong>in</strong> all strategic documents and <strong>in</strong>itiativesQuality as a core valueImprovements and added value as a concept – a paper certificate itself does not matterUse of quality models, standards and tools voluntarily and upon the decision of a PublicAdm<strong>in</strong>istration organisation – what matters is the results achievedQuality as a (long-term) goalQuality, perceived as a ”magic” word, may sound hostileEmphasis on formalities – a certificate as a motivat<strong>in</strong>g factorUse of quality models, standards and tools strongly imposed,or even prescribed by lawFigure 1: Characteristics of quality management <strong>in</strong> <strong>public</strong> adm<strong>in</strong>istrations<strong>in</strong> relation to tradition1Quality Management <strong>in</strong> Public Adm<strong>in</strong>istrations of the EU Member States; Comparative Analysis.6
DR GORDANA ŽURGAImportant learn<strong>in</strong>gs related to development of quality management <strong>in</strong> <strong>public</strong>adm<strong>in</strong>istrations are, above all:— Susta<strong>in</strong>able quality development requires all-round co-operation;— Emphasiz<strong>in</strong>g a formal model / tool only or even its legally b<strong>in</strong>d<strong>in</strong>g usage cannot be susta<strong>in</strong>ed <strong>in</strong> a long-run;— Launch<strong>in</strong>g a quality policy requires adequate support to its implementation;— Pr<strong>in</strong>ciples of quality should be <strong>in</strong>corporated <strong>in</strong> all governmental programmes;— To improve competitiveness of national economy, approach to quality managementat the national level is required.YearsEU Member States1980s1990s2000sEarlyLateDenmark, France, Spa<strong>in</strong>, UKBelgium, Cyprus, Italy, the Netherlands, Poland, Portugal, SwedenAustria, Czech Re<strong>public</strong>, F<strong>in</strong>land, Germany, Greece, Hungary, Ireland, Latvia,Malta, SloveniaBulgaria, Estonia, Lithuania, Luxembourg, Slovak Re<strong>public</strong>, RomaniaFigure 2: Review of quality management tradition <strong>in</strong> the EU member statesAt the same time as the comparative analysis of quality management <strong>in</strong> the EU<strong>public</strong> adm<strong>in</strong>istrations <strong>in</strong> the year 2008, a research was conducted which wasaimed <strong>in</strong> identify<strong>in</strong>g how moderni<strong>za</strong>tion and <strong>public</strong> adm<strong>in</strong>istration reformscontribute to realisation of the Lisbon strategy goals 2 . Despite the fact that thetwo studies were not formally connected it was proved that the EU MemberStates with longer tradition of quality management <strong>in</strong> their <strong>public</strong> adm<strong>in</strong>istrationscontributed more advanced national cases with higher added value to thereali<strong>za</strong>tion of the goals of the Lisbon Strategy.3 FURTHER QUALITY AND BUSINESS EXCELLENCE DE-VELOPMENT STRATEGY IN PUBLIC ADMINISTRATIONOF THE REPUBLIC OF SLOVENIA3.1 STRATEGY PREPARATION PROCESSThe whole process for preparation of the further quality and bus<strong>in</strong>ess excellencedevelopment strategy <strong>in</strong> Slovenian <strong>public</strong> adm<strong>in</strong>istration was started <strong>in</strong>June <strong>2009</strong>, at the M<strong>in</strong>istry of Public Adm<strong>in</strong>istration. All <strong>public</strong> adm<strong>in</strong>istration <strong>in</strong>-2Evaluation of Public Adm<strong>in</strong>istrations’ Added Value to the Lisbon Strategy Goals.7
QUALITY AS A VALUE IN SLOVENE PUBLIC ADMINISTRATIONstitutions, <strong>public</strong> sector organi<strong>za</strong>tions, quality and bus<strong>in</strong>ess excellence associationsand whole <strong>in</strong>terested <strong>public</strong> were <strong>in</strong>vited to contribute their suggestionsand proposals for the <strong>in</strong>itial strategic document. Public call was also publishedat the website of the M<strong>in</strong>istry and was open until 10 th September, <strong>2009</strong>.All the suggestions and proposals received were considered and adequately<strong>in</strong>cluded <strong>in</strong> the draft document by the Quality Committee which was the ownerof the strategy preparation process. For the cont<strong>in</strong>uation of the process, also<strong>public</strong> consultation of the strategic document was planned and afterwards <strong>in</strong>corporationof the quality and bus<strong>in</strong>ess excellence strategy <strong>in</strong> the documentFurther <strong>public</strong> sector development strategy with an emphasize on efficiencyand effectiveness of <strong>public</strong> services 3 .3.2 STRATEGIC DIRECTIONSM<strong>in</strong>istry <strong>in</strong> charge of <strong>public</strong> adm<strong>in</strong>istration has communicated the strategic directions<strong>in</strong> the area of quality and bus<strong>in</strong>ess excellence simultaneously, especiallythrough national quality conferences entitled as Good Practices <strong>in</strong> SlovenePublic Adm<strong>in</strong>istration or through quality tools and projects promoted by them<strong>in</strong>istry. In all years of <strong>in</strong>tensive work<strong>in</strong>g <strong>in</strong> the field neither the M<strong>in</strong>istry ofPublic Adm<strong>in</strong>istration not the Quality Committee did not dictate the approachto build<strong>in</strong>g a quality management system <strong>in</strong> <strong>public</strong> adm<strong>in</strong>istration organisations– this was always a decision of <strong>in</strong>dividual <strong>public</strong> adm<strong>in</strong>istration organisationsas they were also responsible for achiev<strong>in</strong>g the results. This rema<strong>in</strong>s ma<strong>in</strong>direction also for the future.The M<strong>in</strong>istry of Public Adm<strong>in</strong>istration has – as m<strong>in</strong>istry <strong>in</strong> charge – the lead<strong>in</strong>grole <strong>in</strong> further development of quality and bus<strong>in</strong>ess excellence <strong>in</strong> Slovenian<strong>public</strong> adm<strong>in</strong>istration. Strategic directions for further development and work<strong>in</strong> this field are:Integrative and coord<strong>in</strong>ative role of the M<strong>in</strong>istry of Public Adm<strong>in</strong>istration— Widen<strong>in</strong>g the scope of activities (state adm<strong>in</strong>istration à <strong>public</strong> adm<strong>in</strong>istrationà <strong>public</strong> sector);— Expand<strong>in</strong>g the Quality Committee <strong>in</strong> a manner to reflect the changed scope ofactivities;— Gradual sectoral broaden<strong>in</strong>g;3EVA <strong>2009</strong>-3111-0005 (ID URED5058), Normative work programme of the Government for theyear <strong>2009</strong>, chapter III. Democracy and active citizenship / 11. Public services, moderni<strong>za</strong>tionfor better <strong>public</strong> services – M<strong>in</strong>istry of Public Adm<strong>in</strong>istration.8
DR GORDANA ŽURGA— Establish<strong>in</strong>g strategic <strong>in</strong>ter-sectoral work<strong>in</strong>g group / strategic council forquality to be <strong>in</strong> charge for <strong>in</strong>troduction and implementation of quality <strong>in</strong> thewhole system.Promotion and further spread<strong>in</strong>g of the quality and bus<strong>in</strong>ess excellence pr<strong>in</strong>ciples— Tra<strong>in</strong><strong>in</strong>g for strengthen<strong>in</strong>g the adm<strong>in</strong>istrative capacity and <strong>in</strong>creas<strong>in</strong>g competencesof <strong>public</strong> employees for quality management;— Includ<strong>in</strong>g topics on quality <strong>in</strong> tra<strong>in</strong><strong>in</strong>g programmes for top management (tostrengthen exist<strong>in</strong>g tra<strong>in</strong><strong>in</strong>g module Quality Management <strong>in</strong> Public Adm<strong>in</strong>istration)and for middle management <strong>in</strong> the adm<strong>in</strong>istration;— Quality conferences.Promotion of <strong>in</strong>dividual quality management tools— Moderniz<strong>in</strong>g the usage of exist<strong>in</strong>g quality tools;— Common Assessment Framework – CAF;— CAF External Feedback Procedure;— Customers Satisfaction Management;— Employees Satisfaction Management;— Consultancy and methodological support.Organi<strong>za</strong>tional structure to support implementation of strategic directions— Establish<strong>in</strong>g the appropriate organi<strong>za</strong>tional structure to support implementationof strategic directions;— Incorporation of quality programme <strong>in</strong>to the exist<strong>in</strong>g programme classification.International projects— European <strong>public</strong> adm<strong>in</strong>istrations network EUPAN / Innovative Public ServicesGroup IPSG;— Co-operation <strong>in</strong> projects f<strong>in</strong>anced by different <strong>in</strong>ternational organi<strong>za</strong>tionswhere Slovenia could participate as a donor country of its <strong>good</strong> <strong>practices</strong>;— Active <strong>in</strong>volvement <strong>in</strong> relevant quality conferences and events;— Participation <strong>in</strong> different recognition schemes, where Slovenia competes withits <strong>good</strong> practice cases.3.3 WORKING AREASSuggestions and proposals received on the bases of the <strong>public</strong> call from June<strong>2009</strong>, analyses performed as well as discussion at the Quality Committee have9
QUALITY AS A VALUE IN SLOVENE PUBLIC ADMINISTRATIONalready resulted <strong>in</strong> def<strong>in</strong>ition of some work<strong>in</strong>g areas to be potentially <strong>in</strong>cluded<strong>in</strong>to the strategic document.Progressive expansion of quality to the whole <strong>public</strong> sectorComposition of the Quality Committee at the M<strong>in</strong>istry of <strong>public</strong> adm<strong>in</strong>istrationreflects the structure of state adm<strong>in</strong>istration, and especially of adm<strong>in</strong>istrativeunits. When widen<strong>in</strong>g the scope of the activities, the exist<strong>in</strong>g structure willhave to be widened accord<strong>in</strong>gly. Initial orientation of the Quality Committeetowards adm<strong>in</strong>istrative units was appropriate as through adm<strong>in</strong>istrative unitscitizens exercise the most of their contacts with the state and its adm<strong>in</strong>istration.Now the quality is well <strong>in</strong>corporated <strong>in</strong>to daily operations of adm<strong>in</strong>istrativeunits, and different organisational units are established at the system level. Asthe area of quality <strong>in</strong> <strong>public</strong> adm<strong>in</strong>istrations is expand<strong>in</strong>g, the new role of theQuality Committee was def<strong>in</strong>ed at the occasion of its re-composition <strong>in</strong> the year2008. This new role is now more strategic and connective as operational, scopeof its activities is broadened from the segment of adm<strong>in</strong>istrative unites to thewhole state adm<strong>in</strong>istration, <strong>public</strong> adm<strong>in</strong>istration and even <strong>public</strong> sector. TheQuality Committee <strong>in</strong> a new composition will act especially as catalyst of newprojects and <strong>in</strong>itiatives to foster promotion of quality <strong>in</strong> the whole adm<strong>in</strong>istrativesystem, sectoral widen<strong>in</strong>g of its operation will simultaneously be reflected<strong>in</strong> its structure.Gradual widen<strong>in</strong>g of the scope <strong>in</strong> the area of quality and bus<strong>in</strong>ess excellencerequires adequate support at the governmental level, as well. Sett<strong>in</strong>g up of astrategic <strong>in</strong>ter-sectoral work<strong>in</strong>g group or strategic Council for quality is foreseento take lead and care <strong>in</strong> implementation of quality <strong>in</strong> the whole adm<strong>in</strong>istrativesystem <strong>in</strong> the Re<strong>public</strong> of Slovenia as well as for co-ord<strong>in</strong>ation of projectsand activities.Customer orientation / Customer satisfaction managementTotal customer relations management is of a key importance to provid<strong>in</strong>g quality<strong>public</strong> services. Receiv<strong>in</strong>g feedback <strong>in</strong>formation from adm<strong>in</strong>istration’s customersthrough measur<strong>in</strong>g their satisfaction <strong>in</strong>cludes annual as well as monthlymeasurements (upon the Decree on adm<strong>in</strong>istrative operations), and also otherways for (regular) monitor<strong>in</strong>g of their satisfaction. Different sectors <strong>in</strong>troducealso their own monitor<strong>in</strong>g of customers’ satisfaction, e.g. measur<strong>in</strong>g <strong>public</strong>health users’ satisfaction (upon the Decree on operations with users <strong>in</strong> <strong>public</strong>health care system), etc.It is necessary that the exist<strong>in</strong>g ways and approaches to test<strong>in</strong>g customers satisfactionwould be analysed and modernized to assure relevance as well as sensibilityof the tools used. Accord<strong>in</strong>g to the sectoral broaden<strong>in</strong>g of the scope of10
DR GORDANA ŽURGAoperations gradual <strong>in</strong>volvement and <strong>in</strong>corporation of sectors <strong>in</strong>to the activitiesof monitor<strong>in</strong>g, process<strong>in</strong>g and analys<strong>in</strong>g the customers’ feedback <strong>in</strong>formationis foreseen.Public employee orientationImportant quality pr<strong>in</strong>ciple – although too often neglected – is also orientationtowards <strong>public</strong> employees. In a long-run, only satisfied employees can have satisfiedcustomers therefore more attention has to be drawn to them. Follow<strong>in</strong>gareas should be emphasized:— Tra<strong>in</strong><strong>in</strong>g for improv<strong>in</strong>g competences for quality and bus<strong>in</strong>ess excellence,— Involv<strong>in</strong>g relevant quality- and excellence-related topics <strong>in</strong>to tra<strong>in</strong><strong>in</strong>g programmesfor top and middle adm<strong>in</strong>istrative management;— Development and implementation of the directions for <strong>public</strong> employeesfriendly adm<strong>in</strong>istration.Strengthen<strong>in</strong>g adm<strong>in</strong>istrative capacity for quality improvements on the basesof Common Assessment Framework – CAFUpgrad<strong>in</strong>g the exist<strong>in</strong>g usage of the Common Assessment Framework – CAF byestablish<strong>in</strong>g the system for provid<strong>in</strong>g external feedback to the CAF users, lead<strong>in</strong>g<strong>in</strong>to obta<strong>in</strong><strong>in</strong>g the ‘Effective CAF User’ label:— In the year 2010, establish<strong>in</strong>g the system together with the pool of externalfeedback providers (feedback actors – FAs) and orientation towards exist<strong>in</strong>gCAF users;— Gradual broaden<strong>in</strong>g and <strong>in</strong>tensify<strong>in</strong>g the tra<strong>in</strong><strong>in</strong>g for usage of the CAF and forprovid<strong>in</strong>g external feedback to the CAF users; annual <strong>in</strong>volvement of 30 – 50<strong>public</strong> organi<strong>za</strong>tions or <strong>in</strong> accordance to f<strong>in</strong>ancial sources available;— Exchange of knowledge and <strong>good</strong> <strong>practices</strong>, for promot<strong>in</strong>g total quality management<strong>in</strong> <strong>public</strong> adm<strong>in</strong>istration and <strong>public</strong> sector organi<strong>za</strong>tions <strong>in</strong> connectionto annual quality conferences of the M<strong>in</strong>istry of <strong>public</strong> adm<strong>in</strong>istration.Quality conferences <strong>in</strong> the Re<strong>public</strong> of SloveniaS<strong>in</strong>ce 2001, m<strong>in</strong>istry of <strong>public</strong> adm<strong>in</strong>istration organizes annual quality conferencesbe<strong>in</strong>g affirmed under a title Good Practices <strong>in</strong> Slovene Public Adm<strong>in</strong>istration.In this context, the year 2010 will be jubilee – 10 years of quality conferences<strong>in</strong> <strong>public</strong> adm<strong>in</strong>istration <strong>in</strong> Slovenia what can be taken as an opportunityfor re-def<strong>in</strong>ition of the conference format tak<strong>in</strong>g <strong>in</strong>to account gradual sectoralwiden<strong>in</strong>g of operations.11
QUALITY AS A VALUE IN SLOVENE PUBLIC ADMINISTRATIONWeb centre for quality <strong>in</strong> <strong>public</strong> sectorWhen <strong>in</strong>tensify<strong>in</strong>g further activities <strong>in</strong> the area of quality and bus<strong>in</strong>ess excellenceand its gradual widen<strong>in</strong>g it is reasonable to establish a k<strong>in</strong>d of a web centrefor quality <strong>in</strong> <strong>public</strong> sector – as a unified entry po<strong>in</strong>t for review<strong>in</strong>g activities,projects and results <strong>in</strong> <strong>in</strong>dividual areas.Gradual implementation of the web centre for quality is foreseen, <strong>in</strong>clud<strong>in</strong>g alsoma<strong>in</strong>tenance and upgrades of variety of exist<strong>in</strong>g web pages until the web centreis fully implemented. After its implementation, procedures for ma<strong>in</strong>tenance, gradualupgrad<strong>in</strong>g as well as for sectoral broaden<strong>in</strong>g will have to be established.All areas, activities and/or projects described above represent only a part of potential/ possible areas and projects to be <strong>in</strong>cluded <strong>in</strong> the further developmentstrategy <strong>in</strong> the area of quality and bus<strong>in</strong>ess excellence <strong>in</strong> Slovene <strong>public</strong> adm<strong>in</strong>istration;additional projects and <strong>in</strong>itiatives are expected to be identified with<strong>in</strong>the strategy consultation process. Which projects and activities will eventuallybe <strong>in</strong>cluded <strong>in</strong> the strategic document, depends not only upon the <strong>in</strong>terest andneeds expressed but upon the sources available as well – especially f<strong>in</strong>ancialand human resources.3.4 PRESUMPTIONS AND LIMITATIONSIn the cont<strong>in</strong>uation, ma<strong>in</strong> presumptions and limitations to the further developmentstrategy <strong>in</strong> the area of quality and bus<strong>in</strong>ess excellence are presented; theyare illustrated <strong>in</strong> a form of SWOT analysis.Table 1: Presumptions and limitationsStrengths (S)– Strong need, <strong>in</strong>terest and political will forfurther improvement of quality and bus<strong>in</strong>essexcellence <strong>in</strong> Slovenian adm<strong>in</strong>istrative system;– 10-years tradition <strong>in</strong> the area of qualitymanagement <strong>in</strong> Slovenian adm<strong>in</strong>istration;– Active <strong>in</strong>volvement <strong>in</strong> the development of‘European’ quality toolsOpportunities (O)– Involvement <strong>in</strong> <strong>in</strong>ternational projects whichhave their own f<strong>in</strong>ancial sources;– Co-operation of <strong>in</strong>terested parties andstakeholders who are follow<strong>in</strong>g the commondevelopmental goal(s)Weaknesses (W)– Exist<strong>in</strong>g programme classification which doesnot reflect quality as a strategic direction;– Human resources available;– F<strong>in</strong>ancial sourcesThreats (T)– Interruption of the cont<strong>in</strong>uity due toimplications of the f<strong>in</strong>ancial and economic crisis;– Entrance of un-professionalism due to f<strong>in</strong>ancial<strong>in</strong>ability to ma<strong>in</strong>ta<strong>in</strong> the appropriate level ofgovernmental support to the area of quality andbus<strong>in</strong>ess excellence12
DR GORDANA ŽURGAClear determ<strong>in</strong>ation of realistic presumptions as well as awareness of limitationsare of a key importance when plann<strong>in</strong>g and afterwards implement<strong>in</strong>g further activities<strong>in</strong> the area of quality and bus<strong>in</strong>ess excellence. It is reasonable to base thestrategy on strengths and opportunities, and at the same time <strong>in</strong>clude also wayshow to gradually overcome weaknesses and adequately consider the threats.4 STRENGTHENING THE ADMINISTRATIVE CAPACITYFOR QUALITY MANAGEMENTOne of important areas for cont<strong>in</strong>uation <strong>in</strong> the field of quality and bus<strong>in</strong>essexcellence (as described <strong>in</strong> the chapter 3.3) is upgrade of the Common AssessmentFramework CAF, namely implementation of a system for provid<strong>in</strong>g externalfeedback to the CAF Users lead<strong>in</strong>g <strong>in</strong>to acquir<strong>in</strong>g a label ‘Effective CAFUser’.The CAF tool was developed as early as 2000 – at that time, a pilot version waspresented, the first supplemented version followed <strong>in</strong> 2002 and the next <strong>in</strong>2006 4 . With regard to us<strong>in</strong>g the CAF, the objective is to achieve 2010 registeredusers of CAF by 2010. S<strong>in</strong>ce <strong>in</strong>tensive use of the CAF tool requires its further development(an example is CAF <strong>in</strong> education) and with the purpose to providemore demand<strong>in</strong>g CAF users with additional possibilities with respect to theachieved organisational maturity level, a new “module” is now be<strong>in</strong>g <strong>in</strong> conclud<strong>in</strong>gdevelopmental phase: a procedure for provid<strong>in</strong>g external feedback toCAF users, with the work<strong>in</strong>g title PEF – Procedure for External Feedback, andaffirm<strong>in</strong>g now as CAF External Feedback.A decision on develop<strong>in</strong>g this module was taken by the Directors-General forPublic Adm<strong>in</strong>istrations <strong>in</strong> the EU at the 50 th work<strong>in</strong>g meet<strong>in</strong>g <strong>in</strong> May 2008 atBrdo 5 , to announce the development of PEF at the 5QC conference <strong>in</strong> Paris, tocomplete it <strong>in</strong> detail and operationalise it by the 4 th European CAF Users Event,which was planned to take place <strong>in</strong> autumn <strong>2009</strong> <strong>in</strong> Romania with the officiallaunch of PEF. The 4 th CAF Event has been rescheduled for September 2010however development of the CAF External Feedback is <strong>in</strong> conclud<strong>in</strong>g phase– it is foreseen it would be confirmed at the 53 rd work<strong>in</strong>g meet<strong>in</strong>g <strong>in</strong> December<strong>2009</strong> <strong>in</strong> Stockholm.4A Slovenian translation of the CAF 2006 version was published <strong>in</strong> January 2007.5More: G. Žurga: Quality Management <strong>in</strong> the Public Adm<strong>in</strong>istrations of the EU Member States– Ma<strong>in</strong> F<strong>in</strong>d<strong>in</strong>gs and Further Development Trends, Proceed<strong>in</strong>gs of the Good Practices <strong>in</strong> SlovenePublic Adm<strong>in</strong>istration 2008 conference, pages: 9 – 18.13
QUALITY AS A VALUE IN SLOVENE PUBLIC ADMINISTRATION4.1 THE CAF EXTERNAL FEEDBACK PROCEDUREThe CAF external feedback is based on the three pillars:— The process of self-assessmentFocus is on the process of self-assessment and not on the self-assessments results,mean<strong>in</strong>g that <strong>in</strong> the scope of review and provid<strong>in</strong>g the external feedback aresteps 1 to 6 of the 10-steps process of improv<strong>in</strong>g an organi<strong>za</strong>tion by us<strong>in</strong>g CAF 6 :StepDescription1 Decide how to organize and plan the self-assessment2 Communicate the self-assessment project3 Create a self-assessment group or groups4 Organize tra<strong>in</strong><strong>in</strong>g5 Perform the self-assessment6 Prepare a report describ<strong>in</strong>g the results of self-assessmentThe evaluation scale has five levels:LevelThe activities have been carried out …1 <strong>in</strong> a very limited way.2 <strong>in</strong> a limited way.3 <strong>in</strong> an acceptable way.4 <strong>in</strong> a satisfy<strong>in</strong>g way.5 <strong>in</strong> an outstand<strong>in</strong>g way.— The process of improvement actionsThe second pillar of the CAF external feedback process is focused on the improvementprocess <strong>in</strong> an organi<strong>za</strong>tion, precisely on the steps 7, 8 and 9 of the10-steps process of improv<strong>in</strong>g an organi<strong>za</strong>tion by us<strong>in</strong>g CAF 7 , which are:StepDescription7 Draft an improvement plan, based on the accepted self-assessment report8 Communicate the improvement plan9 Implement the improvement plan6See the tabel Ten steps to improve organi<strong>za</strong>tions with CAF, page 45 of the brochure CAF 2006.7See the tabel Ten steps to improve organi<strong>za</strong>tions with CAF, page 45 of the brochure CAF 2006.14
DR GORDANA ŽURGAThere is a separate questionnaire for evaluat<strong>in</strong>g the steps 7 – 9 however us<strong>in</strong>g thesame 5-levels scale as for evaluation of the first 6 steps. In the focus of the revieware not results of improvement actions but the process of improvement actions.— The TQM maturity of the organi<strong>za</strong>tionThe third pillar focuses on the eight pr<strong>in</strong>ciples of excellence and on a shift <strong>in</strong> focustowards these pr<strong>in</strong>ciples after apply<strong>in</strong>g the CAF model <strong>in</strong> an organi<strong>za</strong>tion. Questionnairefor assess<strong>in</strong>g the maturity is based on these pr<strong>in</strong>ciples of excellence:— Results orientation,— Citizen / Costumer focus,— Leadership & constancy of purpose,— Management of processes & facts,— Involvement of people,— Cont<strong>in</strong>uous improvement & <strong>in</strong>novation— Mutually beneficial partnerships,— Corporate social responsibility.Assess<strong>in</strong>g the maturity is not oriented towards the results of improvement processbut is deal<strong>in</strong>g with a question whether the self-assessment stimulated implementationand development of the culture of excellence <strong>in</strong> an organi<strong>za</strong>tion.The evaluation scale has four levels:LevelDescription0 Initiation level has not been achievedI (Initiation)Initiation levelR (Reali<strong>za</strong>tion)Reali<strong>za</strong>tion levelM (Maturity)Maturity levelIn the questionnaire, each level is def<strong>in</strong>ed with a description for each of thepr<strong>in</strong>ciples of excellence.4.2 THE PHASES OF THE CAF EXTERNAL FEEDBACK PROCEDUREUpgrade of the CAF, the CAF external feedback procedure for provid<strong>in</strong>g externalfeedback to the CAF users has been developed with<strong>in</strong> a special work groupof the Innovative Public Services Group (IPSG) of the European Public Adm<strong>in</strong>istrationNetwork (EUPAN); Slovenia was among countries actively engaged <strong>in</strong>the development 8 .8Countries and organi<strong>za</strong>tions actively <strong>in</strong>volved <strong>in</strong> the development: Belgium, Denmark, Italy, Slovenia,European Institute of Public Adm<strong>in</strong>istration EIPA, and European Foundation for QualityManagement EFQM.15
QUALITY AS A VALUE IN SLOVENE PUBLIC ADMINISTRATIONIndividual EU Member State is responsible for implementation of the CAF ExternalFeedback procedure <strong>in</strong> their respective countries, <strong>in</strong> accordance to commonEuropean methodology and requirements which enable to follow commonstandards as well as consider the national context at the same time.The whole CAF external feedback procedure is composed out of three majorphases described <strong>in</strong> the cont<strong>in</strong>uation.1) Application of an organi<strong>za</strong>tion – the CAF user – to obta<strong>in</strong> the external feedback1.1 Applicant organi<strong>za</strong>tion – the CAF user – sends an application for obta<strong>in</strong><strong>in</strong>g external feedback.Organi<strong>za</strong>tion has to fulfil two requirements:– Application has to be passed between 6 and 12 months after the CAF self-assessmentperformed and the self-assessment report delivered, and– It has to be registered as the CAF user, <strong>in</strong> the EIPA database.1.2 M<strong>in</strong>istry of Public Adm<strong>in</strong>istration (MPA) as the national organizer of the CAF external feedbackprocedure <strong>in</strong>vites applicant organi<strong>za</strong>tion to provide:– A short presentation of the organi<strong>za</strong>tion / <strong>in</strong>stitution,– A brief description of the CAF self-assessment process,– The last self-assessment report presented to the management, and– The action plan for improvements.1.3 The applicant organi<strong>za</strong>tion sends the <strong>in</strong>formation required to the MPA1.4 MPA acknowledges the applicant organi<strong>za</strong>tion of launch<strong>in</strong>g the CAF external feedbackprocedure.2) Provid<strong>in</strong>g the feedback2.1 MPA designates two or more experts act<strong>in</strong>g as CAF Feedback Actors (CAF FAs) to provide thefeedback to the applicant organi<strong>za</strong>tion – they may be peers or external experts.2.2 MPA <strong>in</strong>forms the applicant organi<strong>za</strong>tion about the CAF FAs designated and sends the threequestionnaires, to be completed and returned to the MPA.2.3 CAF FAs analyze the three completed questionnaires.2.4 Preparation of the site visit: CAF FAs communicate with the applicant organi<strong>za</strong>tion regard<strong>in</strong>g thesite visit.2.5 Site visit, at the applicant organi<strong>za</strong>tion, <strong>in</strong> maximum duration of two days.2.6 CAF FAs prepare the report (with<strong>in</strong> one month’s time frame) and send it to the MPA togetherwith their recommendation about obta<strong>in</strong><strong>in</strong>g the ‘Effective CAF User’ label.16
DR GORDANA ŽURGA3) Decision / designation of the ‘Effective CAF User’ label3.1 MPA makes the f<strong>in</strong>al decision about obta<strong>in</strong><strong>in</strong>g the ‘Effective CAF User’ label.3.2 MPA sends the feedback report together with the decision about obta<strong>in</strong><strong>in</strong>g the ‘Effective CAFUser’ label to the applicant organi<strong>za</strong>tion.3.3 In case of positive decision, the applicant organi<strong>za</strong>tion receives a diploma - ‘Effective CAF User’label.3.4 MPA <strong>in</strong>forms the EIPA CAF Resource Centre about the ‘Effective CAF User’ label’s holder; EIPApublishes the <strong>in</strong>formation <strong>in</strong> the CAF users’ database.The ‘Effective CAF User’ label expires after two years, and may be renewed.If an applicant did not receive the ‘Effective CAF User’ label, it may apply aga<strong>in</strong>after conduct<strong>in</strong>g the next self-assessment based on CAF.5 CONCLUSIONSAfter the ten years of deliberate work, activities and projects <strong>in</strong> the area of qualityand bus<strong>in</strong>ess excellence <strong>in</strong> <strong>public</strong> adm<strong>in</strong>istration it has been proved thatthe excellence of Slovenian <strong>public</strong> adm<strong>in</strong>istration is be<strong>in</strong>g affirmed as a goal,and quality as one of its central values. In this context, the M<strong>in</strong>istry of PublicAdm<strong>in</strong>istration acts <strong>in</strong> a way that <strong>in</strong>troduces and cont<strong>in</strong>uously upgrades thesolutions with the most impact on <strong>public</strong> adm<strong>in</strong>istration’s <strong>in</strong>stitutions as well ason customers of the adm<strong>in</strong>istration and the general <strong>public</strong>.The development achieved demands now expand<strong>in</strong>g the scope and upgrad<strong>in</strong>gthe present way of plann<strong>in</strong>g and execut<strong>in</strong>g the activities and projects <strong>in</strong> thearea of quality and excellence, as well as an appropriate organi<strong>za</strong>tional support.Follow<strong>in</strong>g the premise that organi<strong>za</strong>tion has to be <strong>in</strong> a function of goals,the new appropriate organi<strong>za</strong>tional and coord<strong>in</strong>ative support has to be established– Strategic council of the Government for Quality is seen as an appropriatestructure to be established at the same time as the further developmentstrategy of quality and excellence of Slovene <strong>public</strong> adm<strong>in</strong>istration would beadopted by the Government.It is necessary, that at the time when the further development strategy is be<strong>in</strong>gprepared also the resources needed for the implementation and their sourcesare def<strong>in</strong>ed. Only that way it can be assured that the adopted strategic documentwould not be only a nicely written and structured document but liv<strong>in</strong>gand vivid document which would enable implementation of the directions andprojects planned, and would by this contribute to even higher quality of <strong>public</strong>services <strong>in</strong> the Re<strong>public</strong> of Slovenia.17
QUALITY AS A VALUE IN SLOVENE PUBLIC ADMINISTRATIONBIBLIOGRAPHY1. Common Assessment Framework, CAF 2006. M<strong>in</strong>istry of Public Adm<strong>in</strong>istration, January2007. Publication also published on the address: http://www.mju.gov.si/fileadm<strong>in</strong>/mju.gov.si/pageuploads/mju_dokumenti/pdf/CAF_2006__SLO_.pdf.2. Normativni program dela vlade <strong>za</strong> leto <strong>2009</strong> / Normative work programme of theGovernment for the year <strong>2009</strong>, http://www.vlada.si/si/delo_vlade/program_dela_vlade/.3. Proceed<strong>in</strong>g of the conferences: Na poti k poslovni odličnosti slovenske javne uprave/ On the Path towards Bus<strong>in</strong>ess Excellence (2001), Od ideje o kakovosti dodobrih praks v javni upravi / From Idea of Quality to Good Practices <strong>in</strong> Public Adm<strong>in</strong>istration(2002), and conferences Dobre prakse v slovenski javni upravi / GoodPractices <strong>in</strong> Slovene Public Adm<strong>in</strong>istration, 2003 – 2008; http://www.mju.gov.si/si/delovna_podrocja/kakovost_v_javni_upravi/konference_dobre_prakse/.4. Program dela M<strong>in</strong>istrstva <strong>za</strong> javno upravo v letu <strong>2009</strong> / Work programme of the M<strong>in</strong>istryof Public adm<strong>in</strong>istration for the year <strong>2009</strong>, http://www.mju.gov.si/fileadm<strong>in</strong>/mju.gov.si/pageuploads/mju_dokumenti/doc/Gradivo_NK_-_POPRAVEK_2.doc.5. Reform Programme for Achiev<strong>in</strong>g the Lisbon Strategy Goals, October 2005, http://www.umar.gov.si/fileadm<strong>in</strong>/user_upload/projects/04_alizb-strategija.pdf.6. Tra<strong>in</strong><strong>in</strong>g programme for middle management <strong>in</strong> the adm<strong>in</strong>istration, M<strong>in</strong>istry ofPublic Adm<strong>in</strong>istration of the Re<strong>public</strong> of Slovenia, http://www.mju.gov.si/si/usposabljanje_<strong>in</strong>_strokovni_izpiti/sem<strong>in</strong>arji/(<strong>in</strong> Slovene language).7. Tra<strong>in</strong><strong>in</strong>g programme for top <strong>public</strong> employees »Leadership and Management <strong>in</strong>the Adm<strong>in</strong>istration«, M<strong>in</strong>istry of Public Adm<strong>in</strong>istration of the Re<strong>public</strong> of Slovenia,http://www.mju.gov.si/si/usposabljanje_<strong>in</strong>_strokovni_izpiti/vodenje_<strong>in</strong>_upravljanje_v_upravi/(<strong>in</strong> Slovene language).8. Uredba o poslovanju z uporabniki v javnem zdravstvu / Decree on operations withusers <strong>in</strong> <strong>public</strong> health care system. Uradni list Republike Slovenije / Official Gazetteof the Re<strong>public</strong> of Slovenia, št. / No. 98/2008.9. Uredba o upravnem poslovanju / Decree on adm<strong>in</strong>istrative operations. Uradni listRepublike Slovenije / Official Gazette of the Re<strong>public</strong> of Slovenia, št. / No. 20/2005.10. Žurga, Gordana (<strong>2009</strong>): Management kakovosti v javnih upravah v Evropski uniji/ Quality Management <strong>in</strong> Public Adm<strong>in</strong>istrations <strong>in</strong> the European Union. Zbornik28. mednarodne konference o razvoju organi<strong>za</strong>cijskih znanosti / 28 th InternationalConference on Organi<strong>za</strong>tional Sciences Development, Conference Proceed<strong>in</strong>gs,Fakulteta <strong>za</strong> organi<strong>za</strong>cijske vede / Faculty of Organi<strong>za</strong>tional Sciences, March <strong>2009</strong>.11. Žurga, Gordana (Editor), (2008a): Quality Management <strong>in</strong> Public Adm<strong>in</strong>istrations ofthe EU Member States; Comparative Analysis, M<strong>in</strong>istry of Public Adm<strong>in</strong>istration ofthe Re<strong>public</strong> of Slovenia, Ljubljana, October 2008.12. Žurga, Gordana (Editor), (2008b): Evaluation of Public Adm<strong>in</strong>istrations’ Added Valueto the Lisbon Strategy Goals, M<strong>in</strong>istry of Public Adm<strong>in</strong>istration of the Re<strong>public</strong> ofSlovenia, Ljubljana, October 2008.13. Žurga, Gordana, (2008c): Quality Management <strong>in</strong> the Public Adm<strong>in</strong>istrations of theEU Member States – Ma<strong>in</strong> F<strong>in</strong>d<strong>in</strong>gs and Further Development Trends. Good Practices<strong>in</strong> Slovene Public Adm<strong>in</strong>istration 2008, Conference Proceed<strong>in</strong>gs. Pages: 9 – 18.18
AN OVERVIEW OF THE FRENCHADMINISTRATIVE REFORMDom<strong>in</strong>ique LAPIERREFrench Embassy <strong>in</strong> Ljubljana, Sloveniadom<strong>in</strong>ique.lapierre@missioneco.orgABSTRACTThe French adm<strong>in</strong>istration is presently immerged <strong>in</strong> a process of structuralreform, the title of which is “Révision générale des politiques publiques”. Thisonly translates the simple fact that beyond secur<strong>in</strong>g quality and cont<strong>in</strong>uityof <strong>public</strong> service, <strong>public</strong> adm<strong>in</strong>istrations also have to abide to the pr<strong>in</strong>cipleof “adaptability”. That means presently to adapt to the economic crisis andspend less while secur<strong>in</strong>g the same level of quality and cont<strong>in</strong>uity of <strong>public</strong>service.For State adm<strong>in</strong>istrations, each M<strong>in</strong>istry has to work out a “Strategy for reform”compil<strong>in</strong>g the results of the audit<strong>in</strong>g processes carried out <strong>in</strong> each budgetoperational units. This strategy is adopted at <strong>in</strong>term<strong>in</strong>isterial level and atask force is created for its enforcement cover<strong>in</strong>g several years, with projectmanagers. This contribution expla<strong>in</strong>s the whereabouts of this reform andproduces two showcases from with<strong>in</strong> the M<strong>in</strong>istry of Economy, Industry andEmployment.1 INTRODUCTIONFrance has a very strong tradition <strong>in</strong> Public Service and employs more than 4millions people <strong>in</strong> <strong>public</strong> service, these be<strong>in</strong>g <strong>in</strong> the State <strong>public</strong> service, <strong>in</strong> theautonomous Territorial Entities <strong>public</strong> service, <strong>in</strong> autonomous <strong>public</strong> agenciesdevoted to <strong>public</strong> services or <strong>in</strong> the health <strong>public</strong> service. The French <strong>public</strong>service is guided by three fundamental rules of personal and collective behaviour:“quality of service”, “cont<strong>in</strong>uity of service” and “adaptability of service”.Of course the conditions required to fulfil this guidance are “clear-cut competences”,“adequate budget means” and “flexibility of employment”.— clearcut competences: the government decides on adm<strong>in</strong>istrative reforms <strong>in</strong>each M<strong>in</strong>istry accord<strong>in</strong>g to the law, no overlapp<strong>in</strong>g and conflict of competencesare allowed, no redundant department has to be ma<strong>in</strong>ta<strong>in</strong>ed, any impedimenthas to be overcome for the employability of <strong>public</strong> officers, outsourc<strong>in</strong>g maybe used if proved to be more efficient,
AN OVERVIEW OF THE FRENCH ADMINISTRATIVE REFORM— adequate budget means: budget programm<strong>in</strong>g is implemented already forsome years <strong>in</strong> France, provid<strong>in</strong>g proper f<strong>in</strong>anc<strong>in</strong>g for the tasks and quantitativetargets fixed <strong>in</strong> advance at m<strong>in</strong>isterial level,— flexibility of employment: the French <strong>public</strong> service employs both civilservants and people under contracts with <strong>public</strong> entities (these be<strong>in</strong>g on fixedterm contract or on openended term contract). The French parliament hasrecently adopted a law for the “mobility and carrier management of <strong>public</strong>employees”, <strong>in</strong> order to promote their professional mobility and to organizenecessary changes of statuses, if a department is considered as overstaffed or<strong>in</strong> need of restructur<strong>in</strong>gUnder the present economic situation there is a really strong pressure forstreaml<strong>in</strong><strong>in</strong>g the budgets of <strong>public</strong> service. The economic crisis demands an<strong>in</strong>crease <strong>in</strong> <strong>public</strong> spend<strong>in</strong>g imp<strong>in</strong>ged on economic leverage and social protection,while tax resources are less productive. The issue is to f<strong>in</strong>d the ways andmeans to keep <strong>in</strong> l<strong>in</strong>e or even to reduce the excessive budget deficit, and tomake it a common understand<strong>in</strong>g.Therefore program budget<strong>in</strong>g has become a prerequisite of the new frameworkfor a susta<strong>in</strong>able fiscal policy. This means def<strong>in</strong><strong>in</strong>g operational units with<strong>in</strong>M<strong>in</strong>istries, audit<strong>in</strong>g their functions and costs, plann<strong>in</strong>g their human resourcesmanagement, and look<strong>in</strong>g for potential reduction <strong>in</strong> adm<strong>in</strong>istrative work andspend<strong>in</strong>g.In fact, Slovenia and France follow presently very similar socioeconomic pathsand share the same <strong>in</strong>terests:Macroeconomic ratios(% GDP) SLOVENIA FRANCEGeneral government expenditure 2007 43,3% 43,7%Taxes & contributions 2007 38,0% 41,2%Social protection expenditure 2006 16,9% 22,3%General <strong>public</strong> service expenditure 2006 6,1% 6,9%Education expenditure 2006 6,3% 6,0%2 THE BASICS: WHICH PRINCIPLES FOR THE ADMINIS-TRATIVE REFORM?The basics are very simple but seldom accepted as rationality by everyone,s<strong>in</strong>ce they <strong>in</strong>cur adaptability of employees. They may be labelled as Secur<strong>in</strong>g20
DOMINIQUE LAPIERREQuality, Cont<strong>in</strong>uity and Adaptability of <strong>public</strong> service, while reduc<strong>in</strong>g the burdenand spend<strong>in</strong>g less,This <strong>in</strong> turn implies an audit<strong>in</strong>g process:— Def<strong>in</strong><strong>in</strong>g operational units <strong>in</strong> each M<strong>in</strong>istry <strong>in</strong> cooperation with employees,— Carry<strong>in</strong>g out an <strong>in</strong>dependent external/<strong>in</strong>ternal audit <strong>in</strong> each operational unit,— Secur<strong>in</strong>g transparency and strong <strong>in</strong>volvement of employees, participation ofemployees <strong>in</strong> the audit<strong>in</strong>g process, communication of the audit<strong>in</strong>g results,— The basic questions be<strong>in</strong>g with<strong>in</strong> each operational unit : what are we do<strong>in</strong>g atwork?— what are the collective needs and expectations from us <strong>in</strong> the <strong>public</strong> atlarge? – what improvement may be <strong>in</strong>troduced to reduce our work? – whichreorgani<strong>za</strong>tion of our department is required for the changes? who shall payfor our <strong>public</strong> service? – how to fulfil it <strong>in</strong> a cheaper way? – what is the bestway to get to this result?Each M<strong>in</strong>istry has to work out a “Strategy for reform” compil<strong>in</strong>g the results ofthis audit<strong>in</strong>g process. A newly established “Council for modernisation of <strong>public</strong>bodies” (an <strong>in</strong>term<strong>in</strong>isterial body placed by the Prime M<strong>in</strong>ister’s Office), meet<strong>in</strong>gregularly, exam<strong>in</strong>es closely these Strategies for reform of the different m<strong>in</strong>istriesand adopt them.It checks that each “Strategy for reform” is well based on the “quality, cont<strong>in</strong>uityand adaptability of <strong>public</strong> service” pr<strong>in</strong>ciples, that it <strong>in</strong>cludes a contract forquantitative results cover<strong>in</strong>g several years, a contract with the budget departmentfor reduc<strong>in</strong>g the <strong>public</strong> spend<strong>in</strong>g over these several years, and a contractfor promot<strong>in</strong>g the mobility of employees over these several years. Therefore, a“standard toolbox” has been def<strong>in</strong>ed, with quantitative <strong>in</strong>dices.Each “Strategy for reform” also has to have a calendar for implementation anda forecast for progressive improvements of quality, cont<strong>in</strong>uity and adaptability,<strong>in</strong> each operational unit.Needed structural reforms may be envisaged, with abolition of departments <strong>in</strong>extreme cases, even if it implies mobility of employees and early retirements.3 THE DRIVES: WHAT ARE THE KEYS FOR THE SUCCESS?— Political commitment: do not take it for granted that Your M<strong>in</strong>ister pledgesto fulfil its prescribed predictive management of human resources and taskswhen manag<strong>in</strong>g its operational units. You will have to secure his support. A21
AN OVERVIEW OF THE FRENCH ADMINISTRATIVE REFORM“task force for adm<strong>in</strong>istrative reform” is created therefore <strong>in</strong> each m<strong>in</strong>istry,with a project manager.— Grassroot ideas: start from social dialogue, op<strong>in</strong>ion polls, head of departmentmotivation, <strong>in</strong>sist<strong>in</strong>g on the long term perspective: “where and how to adaptto changes, to act <strong>in</strong> a common enterprise ?”— Legitimacy: <strong>in</strong>sure exchanges and rewards of best <strong>practices</strong>, engage a communicationcampaign to legitimate for the employees the necessity of changeswith<strong>in</strong> adm<strong>in</strong>istrations, claim the support for the susta<strong>in</strong>ability of <strong>public</strong>spend<strong>in</strong>g, and display the satisfaction of customers,— Demonstrate with benchmark<strong>in</strong>g the improvements of the new structure:more responsive, more communicative, better adaptability to emerg<strong>in</strong>g constra<strong>in</strong>ts…— Develop specific formations to motivate employees to change their behaviour,— Interconnect mobility with <strong>in</strong>centives for changes, assure prospective occupationsfor the employees who have to leave their standard occupation,— Adapt to time period, <strong>in</strong>form <strong>in</strong> advance but choose the right momentum to<strong>in</strong>form,— But always keep <strong>in</strong> m<strong>in</strong>d the f<strong>in</strong>al objective “reduc<strong>in</strong>g work and expenditure,<strong>in</strong> spite of the adm<strong>in</strong>istrative constra<strong>in</strong>ts you will have to face dur<strong>in</strong>g the process”,— Last but not least, assure a long last<strong>in</strong>g support from Your authority.4 TWO TEST CASES: THE GENERAL DIRECTORATE FORCUSTOMS & THE GENERAL DIRECTORATE OF ECONOMICAFFAIRS OF THE FRENCH MINISTRY OF ECONOMY,INDUSTRY AND EMPLOYMENTTwo different challenges:— General Directorate for Customs:o Adapt to the entry <strong>in</strong>to the Internal Market for 1993,o Abolition of systematic border controls along <strong>in</strong>ternal EU borderso Redeployment all over the French territoryo Loss of competences for VAT collection for <strong>in</strong>traeuropean trade operationso Simplification of custom clearance procedureso New competences for collection of excise dutieso New priorities put on fight<strong>in</strong>g drug traffick<strong>in</strong>g and money launder<strong>in</strong>go Not to forget counterfeit<strong>in</strong>g and <strong>in</strong>dustrial property abuses22
DOMINIQUE LAPIERRE— General Directorate of Economic Affairs:o Merg<strong>in</strong>g of the External Economic Relation Department with the TreasuryDepartment and the Economic Forecast Department,o Screen<strong>in</strong>g Representations abroad, accord<strong>in</strong>g to the geographical priorities,o Cooperat<strong>in</strong>g with the network of the French Chambers of commerceo Creat<strong>in</strong>g a “hub for <strong>in</strong>formation on market developments”o Adapt<strong>in</strong>g the new procedures for exporters with UBIFRANCE, COFACE,OSEO…)o Focuss<strong>in</strong>g on the new priority of support<strong>in</strong>g SME’so Develop<strong>in</strong>g the commercial presence <strong>in</strong> the BRICApply<strong>in</strong>g the same method:— General Directorate for Customs, from 1988 onward, General Directorate ofEconomic Affairs from 2002 onwardo Internal audit analys<strong>in</strong>g each new l<strong>in</strong>e of occupation related to thechallenges and its requirementso Def<strong>in</strong><strong>in</strong>g the needs <strong>in</strong> employment for each new l<strong>in</strong>e of occupation andpromot<strong>in</strong>g mobilityo Contract<strong>in</strong>g with the General directorate for budget, for a yearly reductionof overall costs,o Assur<strong>in</strong>g proper formation and <strong>in</strong>centives for changes <strong>in</strong> occupation ofemployeesThe results— General Directorate for Customs = redeployment of 3000 employees allover the French territory and closure of 230 offices + creation of ecustomclearance procedures + extension of random border controls along bordersand <strong>in</strong>ternal communication routes + creation of 30 regional custom offices <strong>in</strong>the ma<strong>in</strong> French Embassies. 3000 employees have been split <strong>in</strong>to two differentstatus : <strong>in</strong>vestigation officers on one side with judicial competences, customsprocedure officers on the other side with adm<strong>in</strong>istrative competences— General Directorate of Economic Affairs = redeployment of 350 employees+ creation of 30 regional offices <strong>in</strong> ma<strong>in</strong> Embassies while <strong>in</strong>creas<strong>in</strong>g staff<strong>in</strong>g<strong>in</strong> new geographic priority countries + merg<strong>in</strong>g commercial offices withUBIFRANCE offices <strong>in</strong> France + division <strong>in</strong>to two parts of the economicsections <strong>in</strong> Embassies: 64 economic sections exclusively <strong>in</strong> charge of traderelations merge with UBIFRANCE, while the others rema<strong>in</strong> with the foreignservice of the M<strong>in</strong>istry. 1200 employees are split <strong>in</strong>to two different statuses:foreign trade officers depend<strong>in</strong>g from UBIFRANCE on one side, economicdiplomacy officers depend<strong>in</strong>g from the M<strong>in</strong>istry on the other side.23
DEVELOPMENT AND USE OF THE MOBILITYAPPLICATION IN THE MARIBOR POLICEDIRECTORATEMirko PLOJM<strong>in</strong>istry of Defence, Police Directorate Maribormirko.ploj@policija.siINTRODUCTIONIn all areas of polic<strong>in</strong>g and work processes, the Maribor Police Directoratemakes use of its advantages, explores possibilities for improvement and <strong>in</strong>corporatesand draws on <strong>good</strong> practice.In 2003, its began <strong>in</strong>troduc<strong>in</strong>g bus<strong>in</strong>ess excellence based on the Common AssessmentFramework – CAF model, and then cont<strong>in</strong>ued by the model of the EuropeanFoundation for Quality Management – EFQM. The two models of bus<strong>in</strong>essexcellence gave the police directorate a chance of a modern and thoroughself-assessment of its work, as well as identification of the results of its activity.Furthermore, they also enabled benchmark<strong>in</strong>g and learn<strong>in</strong>g from other organisations,along with rais<strong>in</strong>g awareness of the importance of bus<strong>in</strong>ess excellenceand apply<strong>in</strong>g <strong>good</strong> practice to police work. The two bus<strong>in</strong>ess excellence models(CAF, EFQM) aim at rationalis<strong>in</strong>g and optimis<strong>in</strong>g all work<strong>in</strong>g processes.Us<strong>in</strong>g the aforementioned bus<strong>in</strong>ess excellence models, the situation at the policedirectorate was analysed and problems were identified. At the same time,we found solutions to certa<strong>in</strong> adm<strong>in</strong>istrative barriers or found possibilities ofimprovement. The police directorate has been constantly draw<strong>in</strong>g comparisonwith and learn<strong>in</strong>g from similar police directorates or organisations. Our activitiesaim at spread<strong>in</strong>g awareness of the importance of <strong>in</strong>creas<strong>in</strong>g our performance– provid<strong>in</strong>g a high quality security service. Throughout all our work, wehave been <strong>in</strong>clud<strong>in</strong>g as many collaborators as possible, guided by the beliefthat virtually anyth<strong>in</strong>g can be achieved through cooperation. Human resourcemanagement is a priority for us. The <strong>in</strong>dividual – our fellow worker – is whatmatters most. Their knowledge, experience, work, motivation, responsibilityand sense of belong<strong>in</strong>g are our true capital, which must be managed properly.The work<strong>in</strong>g hours of our fellow workers are the potential which can and mustbe managed by the leaders.The police’s ma<strong>in</strong> mission is to ensure, <strong>in</strong> cooperation with <strong>in</strong>dividuals and thecommunity, the security of people and their property. In the event of a security
DEVELOPMENT AND USE OF THE MOBILITY APPLICATION IN THE MARIBOR POLICE DIRECTORATE<strong>in</strong>cident or a call from with<strong>in</strong> the community, our reaction must be swift andeffective. Our goal is to susta<strong>in</strong> a high quality of the police service.The Maribor Police Directorate strives for <strong>in</strong>ternal progress and improvementof its work, <strong>in</strong> order to provide a high quality security service to the people<strong>in</strong> its territory. Our work is focused on the community, which is expected toprovide not only partnership cooperation but also criticism and suggestionsregard<strong>in</strong>g our activities. The management and staff at the police directorateare committed to build<strong>in</strong>g up our bus<strong>in</strong>ess excellence <strong>in</strong> relation to users ofour services.Everybody has the possibility and opportunity to have an impact on the changesand the future. This, however, requires us to take certa<strong>in</strong> actions, have ideas,provide <strong>in</strong>centives and suggestions. We are constantly on a cycle of plann<strong>in</strong>g,perform<strong>in</strong>g tasks, verify<strong>in</strong>g, tak<strong>in</strong>g action, thus <strong>in</strong>troduc<strong>in</strong>g changes and affect<strong>in</strong>gour future.Our collaborators are encouraged to embrace changes and <strong>good</strong> practice <strong>in</strong> oureveryday work. In the last five years, we have regularly participated at the Policebest practice competition and have consistently achieved top rank<strong>in</strong>gs andawards. Awards for best practice have been won <strong>in</strong> the follow<strong>in</strong>g categories:Coord<strong>in</strong>at<strong>in</strong>g the Work of Police Station Commanders <strong>in</strong> the City of Maribor,Investigat<strong>in</strong>g Offences aga<strong>in</strong>st the Environment, Provisional Reorganisation ofOn-call Duty, Indicators for Work Efficiency Assessment, Application Supply ofGoods – Onl<strong>in</strong>e Shop and Application Mobility.Examples of <strong>good</strong> practice are be<strong>in</strong>g successfully spread to other police directorates,with computer applications attract<strong>in</strong>g the greatest <strong>in</strong>terest. In addition,some of our <strong>good</strong> practice cases have even been <strong>in</strong>cluded <strong>in</strong> the Police’s actionplan for 2008 and <strong>2009</strong>.Such <strong>good</strong> practice aims to reduce adm<strong>in</strong>istrative barriers to the work process– send<strong>in</strong>g out available police officers to the scene of a security event of<strong>in</strong>tervention – and therefore provid<strong>in</strong>g urgent, effective and <strong>good</strong> support tothe operative work of police officers. The application Mobility fulfils this objective<strong>in</strong> every way. It is crucial for users, <strong>in</strong> fact, that an <strong>in</strong>formation systemor a particular application helps their work to be carried out safely, quickly,smoothly and effectively. Externally the success of the police’s work is measuredby the level of satisfaction among those who use the police’s securityservices.26
MIRKO PLOJOPERATION AND COMMUNICATION ACTIVITY PRESENTA-TIONAt the regional level <strong>in</strong> Slovenia, the security of people and their property is <strong>in</strong>the hands of 11 police directorates. Each of these has an <strong>in</strong>ternal organisationunit called the Operation and Communication Centre (here<strong>in</strong>after OCC).The OCC at the national level receives <strong>in</strong>formation and gathers data on activities,events and phenomena relevant to the police’s work and the day-to-dayassessment of the security situation <strong>in</strong> the Re<strong>public</strong> of Slovenia. It monitors,directs, coord<strong>in</strong>ates and assesses the measures taken by the 11 regional operationand communication centres at police directorates, related to serious offences,traffic accidents, natural and other disasters as well as other importantactions, events and phenomena. By do<strong>in</strong>g so, it also provides <strong>in</strong>centives, suggestions,guidel<strong>in</strong>es or <strong>in</strong>structions, gives expert assistance and orders possibletasks and measures.The OCC at the General Police Directorate also provides an anonymous telephonenumber 080 1200 for anyone who wishes to communicate useful <strong>in</strong>formationto the police but wants to rema<strong>in</strong> anonymous.The Maribor Police Directorate is the second largest police directorate <strong>in</strong> Slovenia.Its territory has a population of 322,754, i.e. 16 percent of the country’spopulation. The security conditions throughout the territory under the MariborPolice Directorate are controlled by 17 police stations and 11 police offices.Police work cont<strong>in</strong>ues non-stop for 24 hours a day. In 2008, the police directorate’sOCC had 38,335 <strong>in</strong>terventions, deploy<strong>in</strong>g 43,111 police patrols, whichamounts to 19 percent of all deployments of police patrols to a designated securityevent <strong>in</strong> the country.The number of people request<strong>in</strong>g police assistance has been grow<strong>in</strong>g eachyear, <strong>in</strong> most cases because of traffic accidents, property damage or violationsof <strong>public</strong> order. A 2008 poll on <strong>public</strong> confidence <strong>in</strong> the police reveals a decrease<strong>in</strong> the number of those say<strong>in</strong>g that the police came to the scene of asecurity event quickly enough, and a rise <strong>in</strong> those say<strong>in</strong>g the police were notfast enough <strong>in</strong> com<strong>in</strong>g to the scene. While the <strong>public</strong> perception of the police’sresponse has deteriorated, accord<strong>in</strong>g to our data the average response time ofpolice patrols <strong>in</strong> Slovenia has improved.The OCC of police directorates are connected to the police’s <strong>in</strong>tervention number113 used by citizens <strong>in</strong> urgent (<strong>in</strong>tervention) cases. One of the ma<strong>in</strong> OCCtasks is to guide <strong>in</strong>terventions and assist police units sent to the scene of the27
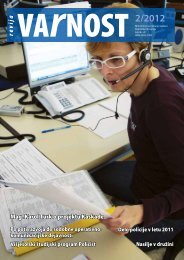
DEVELOPMENT AND USE OF THE MOBILITY APPLICATION IN THE MARIBOR POLICE DIRECTORATE<strong>in</strong>tervention event, which is triggered <strong>in</strong> most cases by a call from a citizen tothe police’s <strong>in</strong>tervention number 113.In every police directorate’s territory, for security events to be effectively controlled,they need a certa<strong>in</strong> m<strong>in</strong>imum number of police officers and patrols thatmust be provided by a police unit on a given day of the week. Police units haveto make daily reports to the police directorate’s OCC on the number and typeof police patrols present <strong>in</strong> a certa<strong>in</strong> area.They must also communicate the time of availability of the patrols and theequipment at their disposal. The available patrols are used by the OCC and deployedto various security events.The role of the police directorate’s OCC is to:— receive <strong>in</strong>formation on security phenomena and events;— receive calls from people <strong>in</strong> need of police assistance;— send police patrols to the scene of security events, monitor, direct, order andcoord<strong>in</strong>ate the <strong>in</strong>itial urgent measures taken by police officers <strong>in</strong> the eventof offences, traffic accidents, violations of <strong>public</strong> order, natural and otherdisasters and other security-related events.For the police to be effective and successful, it is therefore essential to have asufficient number of police officers or patrols out <strong>in</strong> the field at all times (dayand night) that are able, <strong>in</strong> the shortest possible time, to act effectively andsuccessfully, or to respond to the orders given by the staff of the OCC of theMaribor Police Directorate.WORKING PROCESS PRIOR TO THE USE OF THE MOBILITY APPLICA-TION— Work<strong>in</strong>g process at police units prior to the use of the Mobility Application:Police units sent <strong>in</strong>formation on their available patrols daily to the OCC via thepolice’s e-mail (Lotus Notes program). In practice, however, the <strong>in</strong>formationprovided was sometimes <strong>in</strong>correct, which h<strong>in</strong>dered the process of send<strong>in</strong>g patrolsto a security event. Any change <strong>in</strong> patrol mobility was notified by the officeron call to the head of the OCC team on duty at the time. Based on a pr<strong>in</strong>teddocument of a particular unit, the latter made the appropriate changes. Thehead of the OCC team on duty was therefore often left to deal with resett<strong>in</strong>gdata on police patrol availability.28
MIRKO PLOJPolice unit work<strong>in</strong>g process flowchart:Police unit workflow(previously)Police unit workflow(currently)The user signs <strong>in</strong> to Lotus Notes -police’s email boxThe user signs <strong>in</strong> the MOBILITYapplicationF<strong>in</strong>ds the mobility document sentpreviouslyFeeds the database with patrols(entry form)Copies the document content <strong>in</strong>to anew one and modifies the contentRecords the document <strong>in</strong>to police’s<strong>in</strong>formation systemSends mobility via police’semail to the OCCReports mobility changes(by telephone or document)Figure 1: Police unit workflow diagram— Work<strong>in</strong>g process at the Maribor Police Directorate’s OCC prior to the use ofthe Mobility Application:The OCC operator received documents on police patrol mobility from allunits via the police’s email (Lotus Notes program). He or she pr<strong>in</strong>ted themout <strong>in</strong> two copies, and sorted mobility documents <strong>in</strong> a certa<strong>in</strong> order. Morn<strong>in</strong>gpatrols were highlighted <strong>in</strong> green, for example, afternoon patrols <strong>in</strong> yellowand night patrols <strong>in</strong> orange. When a patrol was needed at a security event <strong>in</strong>a specific area, the OCC operator first selected the mobility paper of a unitout of the pr<strong>in</strong>ted material and then a particular patrol (morn<strong>in</strong>g, afternoonor night). Once a patrol was selected on the document, it was dispatched to adesignated security event, Such a process was lengthy, slow and burdensomefor the operator.29
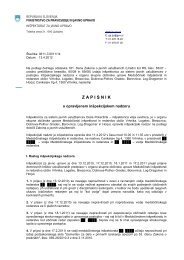
DEVELOPMENT AND USE OF THE MOBILITY APPLICATION IN THE MARIBOR POLICE DIRECTORATEOCC work<strong>in</strong>g process flowchart:Workflow at OCC(previously)Workflow at OCC(currently)OCC operator receives mobility<strong>in</strong>fo from all police unitsOCC operator clicks on an area orrelation <strong>in</strong> the applicationMakes two pr<strong>in</strong>ted copies of alldocuments of unitsSelects an available patrol and sendsit out to the security eventSorts out mobility documents<strong>in</strong> a certa<strong>in</strong> orderHighlights patrols on eachdocument <strong>in</strong> different colours;morn<strong>in</strong>g/afternoon/nightIn case of an <strong>in</strong>tervention, selects aunit’s document to f<strong>in</strong>d an availablepatrol and sends it outManually notes all changesas they occurFigure 2: OCC workflow diagramAPPROACH TO A SOLUTIONThe participants of the work<strong>in</strong>g process of send<strong>in</strong>g out available police officersto the scene of an <strong>in</strong>tervention security event became aware of the need to simplifyand shorten the time required to f<strong>in</strong>d available police unit patrols <strong>in</strong> thefield. This problem was highlighted at a restricted expert committee of the directorof the Maribor Police Directorate, which then <strong>in</strong>cluded <strong>in</strong> the 2008 actionplan of the police directorate the task of develop<strong>in</strong>g an application capable ofremov<strong>in</strong>g the adm<strong>in</strong>istrative barrier and facilitat<strong>in</strong>g the work of participants <strong>in</strong>the process.The Operational Support Service, Information and Telecommunications Officewas given responsibility for the task. In addition, a work<strong>in</strong>g group was set up,which found the right technical solution by develop<strong>in</strong>g the Mobility Application.The work<strong>in</strong>g group consisted of Information and Telecommunications Sectionstaff, act<strong>in</strong>g as the technical service, a representative from the Operation andCommunication Centre of the Maribor Police Directorate and representativesof police units of the police stations <strong>in</strong> Ptuj and Podlehnik.The time schedule of the work<strong>in</strong>g group was divided <strong>in</strong>to several phases:— technical development of the application,30
MIRKO PLOJ— technical test<strong>in</strong>g of the application,— production of the application’s user guide,— test use of the application at certa<strong>in</strong> units (police stations <strong>in</strong> Ptuj andPodlehnik),— rectification of irregularities and <strong>in</strong>clusion of better solutions suggested,— application start-up for all units of the Maribor Police Directorate.The application was developed gradually <strong>in</strong> cooperation with the end users.The aim was to enable the OCC operator to have constantly available on screenthe patrols available <strong>in</strong> a certa<strong>in</strong> area that could be dispatched to a securityevent.The development of the application focused on functionality, cost-effectiveness,usefulness and possible expansion to other police directorates. The dataentered <strong>in</strong>to the application’s base were to be constantly kept up to date, easilyaccessible and collected <strong>in</strong> one place.SOLUTION DESCRIPTIONThe Mobility Application functions on the basis of the Apachi web server <strong>in</strong> thePHP software environment and the MySQL database. All theses componentsare set and work on the server – workstation, which is located <strong>in</strong> the OperationalSupport Service, Information and Telecommunications Office, where thedatabase is archived on a daily basis.Access to the Mobility Application for users <strong>in</strong> the Maribor Police Directorate isenabled by connection to the police directorate’s Intranet.Access-wise, the Mobility Application has three levels:— the “unit” level of police stations and <strong>in</strong>ternal organisation units, which enablesenter<strong>in</strong>g, modify<strong>in</strong>g and review<strong>in</strong>g data entered for that unit,— the “OCC” level of the OCC of the Maribor Police Directorate, which allows ascan through available patrols of all units and entries made by units by date,— the “adm<strong>in</strong>istrative access” level of the Operational Support Service,Information and Telecommunications Office, which enables updat<strong>in</strong>g the listand add<strong>in</strong>g new users.Once the application and the user’s guide were completed, all units were sentthe f<strong>in</strong>al version of the guide so that users could learn how the applicationfunctions. In the <strong>in</strong>itial stage of be<strong>in</strong>g brought <strong>in</strong>to use, units suggested modifications,which were considered and <strong>in</strong>corporated <strong>in</strong>to the application. The us-31
DEVELOPMENT AND USE OF THE MOBILITY APPLICATION IN THE MARIBOR POLICE DIRECTORATEers’ response was more than positive. They became aware of the application’spractical value, shorten<strong>in</strong>g the work<strong>in</strong>g process and <strong>in</strong>creas<strong>in</strong>g transparencyand traceability.The Mobility Application was developed for the needs of the Maribor PoliceDirectorate and is tailored to fit the needs and system of work of our police directorate.However, the application can be adapted to other police directorateswithout major problems.ADVANTAGES OF THE WORKING PROCESS AFTER INTRODUCING THEMOBILITY APPLICATION— Work<strong>in</strong>g process at police units after the <strong>in</strong>troduction of the MobilityApplication:The police officer on call at the police unit has access to the application via theMobility connection on the Intranet of Maribor Police Directorate. A sign-<strong>in</strong>w<strong>in</strong>dow pops up, which is used to enter the application. Once signed <strong>in</strong>, the officerfills <strong>in</strong> the empty entry form with data on the patrol and saves it. For everypatrol, he or she sets a call sign, date, time of duty, type of duty, number of officers<strong>in</strong> the patrol, area of work, road relation, special tasks and equipment.If data on a patrol changes, the officer on call selects the patrol already enteredand modifies the specific <strong>in</strong>formation. The change is <strong>in</strong>stantly noted by theOCC operator.— Work<strong>in</strong>g process at the Maribor Police Directorate’s OCC after the<strong>in</strong>troduction of the Mobility Application:Once signed <strong>in</strong>to the Mobility Application, the OCC operator can choosefrom different areas and relations on the screen. By click<strong>in</strong>g an <strong>in</strong>dividualicon (e.g. Ptuj), all patrols available to be sent to a designated security eventat the given time <strong>in</strong> the area of Ptuj police station are displayed. This gives theofficer simple and quick access to the data needed for carry<strong>in</strong>g out his or hertask efficiently.Example of access<strong>in</strong>g the Mobility Application via the Intranet of the MariborPolice Directorate:32
MIRKO PLOJFigure 3: Access to the Mobility Application via the Intranet ofMaribor Police DirectorateA log<strong>in</strong> box appears <strong>in</strong> which the user enters his or her user name and password.Every unit has its own user name and password for sign<strong>in</strong>g <strong>in</strong>.Figure 4: Log<strong>in</strong> boxIf the user name and password are correct, the user can start us<strong>in</strong>g the application.Due to multiple access levels, police stations and the OCC have a differentscreen view after sign<strong>in</strong>g <strong>in</strong>. Police stations get an empty entry form for enter<strong>in</strong>gdata on patrol mobility.33
DEVELOPMENT AND USE OF THE MOBILITY APPLICATION IN THE MARIBOR POLICE DIRECTORATEFigure 5: Patrol mobility entry formOn successful log<strong>in</strong>, the OCC operator gets a list of area icons. After select<strong>in</strong>gan area, available police patrols are displayed, which can be used at a particulartime <strong>in</strong> an area previously designated.Figure 6: List of patrols available at a given time <strong>in</strong> a certa<strong>in</strong> area34
MIRKO PLOJESTIMATED TOTAL COST REDUCTIONThe sav<strong>in</strong>gs made by use of the Mobility Application are reflected <strong>in</strong> reducedlabour as well as material costs. They occur for police units and the OCC, particularly<strong>in</strong> terms of work<strong>in</strong>g hours and less material and technical resourcesused (paper, pr<strong>in</strong>ter toners etc.). Every work<strong>in</strong>g hour implies a cost becausethis time can be used for other purposes. Time sav<strong>in</strong>gs per unit are about halfan hour a day, i.e. roughly 15 hours a month or 180 hours a year per s<strong>in</strong>gle policeunit (180 hours is the basic monthly work per worker).The cost-effectiveness of the solution is also shown by a reduced OCC responsetime, with the operator need<strong>in</strong>g less time to f<strong>in</strong>d an available patrol and, therefore,also to dispatch it to a security event. A reduction <strong>in</strong> response time may <strong>in</strong>some cases make a great difference for a person and can even save lives.Apart from work<strong>in</strong>g hours be<strong>in</strong>g saved, there is also less burden on the communicationchannel’s available space. The process of send<strong>in</strong>g data on patrol mobilityfrom police units to the OCC is standardised and the format and contentof the form used to report on patrol mobility is unified. F<strong>in</strong>ally, the applicationreduces costs also <strong>in</strong> that it enables the operator to have a constant view of allavailable patrols <strong>in</strong> a given area and at given time, which can be dispatched tosecurity events,The Mobility Application is easy to use and transparent. Data on a patrol are updatedand therefore of high quality and precision. Access to the application issimple. Every entry made <strong>in</strong> the application is immediately seen by both the authorand the person check<strong>in</strong>g, us<strong>in</strong>g and controll<strong>in</strong>g the data entered. The newapplication has achieved its goal and quality due to the users who suggested itbe<strong>in</strong>g constantly <strong>in</strong>volved <strong>in</strong> its development and <strong>in</strong>troduction.The Maribor Police Directorate did not have any special and additional expenseswith the production, test<strong>in</strong>g and <strong>in</strong>troduction of the Mobility Application.The Mobility Application is the first application fully developed us<strong>in</strong>g theknowledge of the Maribor Police Directorate’s staff and the General Police Directorate’sInformation and Telecommunications Office.It was done dur<strong>in</strong>g the normal work<strong>in</strong>g hours of <strong>in</strong>formation specialists andprogrammers at the Maribor Police Directorate. Due to the simple use of theapplication, no special tra<strong>in</strong><strong>in</strong>g of users was needed; they only received a user’sguide, which was sufficient.In the future, the Mobility Application will have to be connected to the GlobalPosition<strong>in</strong>g System – GPS, which would add an optical image of the patrol’slocation to the current availability data.35
DEVELOPMENT AND USE OF THE MOBILITY APPLICATION IN THE MARIBOR POLICE DIRECTORATECONCLUSIONThe Maribor Police Directorate has been us<strong>in</strong>g the Mobility Application s<strong>in</strong>ce1 June 2008. Its development was guided by practicality and user-friendl<strong>in</strong>ess.It was created to answer the needs of the OCC of Maribor Police Directorateand police units. The former system of send<strong>in</strong>g <strong>in</strong>formation on patrol mobilityand relevant changes was time–consum<strong>in</strong>g and unclear- All the application’scomponents, the appearance of its sites, field colours and font size used <strong>in</strong> siteswere decided <strong>in</strong> cooperation with the users.The Mobility Application is a web application. Access is possible from all computersconnected to the Police’s network and equipped with the Internet Explorerbrowser.However, regardless of its computerisation, the work<strong>in</strong>g process objective hasstayed the same – dispatch<strong>in</strong>g available police officers to the scene of an <strong>in</strong>terventionsecurity event. It is there to support the operative work done by policeofficers <strong>in</strong> the field. The application has made the process or the manner <strong>in</strong>which the OCC operator f<strong>in</strong>ds an available patrol that he or she can dispatch toa security event much easier, shorter and more transparent. The new methodof work saves a great deal of time <strong>in</strong> f<strong>in</strong>d<strong>in</strong>g an available patrol and thus reducesthe response time of both the OCC and the police patrol.The Maribor Police Directorate is the lead<strong>in</strong>g police directorate <strong>in</strong> Slovenia <strong>in</strong>the field of <strong>in</strong>troduc<strong>in</strong>g and apply<strong>in</strong>g bus<strong>in</strong>ess excellence models. The <strong>in</strong>tegrationof a number of applications developed by the Maribor Police Directoratehas simplified the work of users. This all began with the development, <strong>in</strong>troductionand use of the Mobility Application and is cont<strong>in</strong>u<strong>in</strong>g with the creation ofnew applications. The Operational Support Service, Information and TelecommunicationsOffice, has staff that are able and will<strong>in</strong>g to carry out such tasks.Their knowledge must be used to contribute to the computerisation of work<strong>in</strong>gprocesses (<strong>in</strong> the police as a whole).The Mobility Application can serve as an example of <strong>good</strong> practice for the development,<strong>in</strong>troduction and use of other similar applications that are currentlybe<strong>in</strong>g developed, and will be used by the Police <strong>in</strong> the future. A vital role <strong>in</strong> thismust be played by the support of management, operative and expert services,the cooperation of end users and an expert team cable of fulfill<strong>in</strong>g the task set.Prior to such a project, an assessment must be made as to the practicality as faras costs are concerned.The development, <strong>in</strong>troduction and use of the Mobility Application have madeus aware of the time, effort, and will needed for an application to be put <strong>in</strong>to36
MIRKO PLOJpractice. Implement<strong>in</strong>g a new application therefore needs all the hurdles to beovercome <strong>in</strong> order to reach the desired goal.In the Maribor Police Directorate, we have been striv<strong>in</strong>g towards reduc<strong>in</strong>g thegap between the actual and the desired state of a work<strong>in</strong>g process. We mustensure the shortest response time possible needed for a police patrol to reachthe scene of a security event with the aim of protect<strong>in</strong>g and help<strong>in</strong>g people(victims, <strong>in</strong>jured people …).Maribor Police Directorate has the ambition to become even more effectiveand successful. It is <strong>in</strong> our <strong>in</strong>terest to provide high quality security to the peoplewho are the users of our security services. We would also like to be closer topeople and local communities. Our goal is to create a true partnership with all<strong>in</strong>terested <strong>public</strong> parties and our strategic partners. We want to ga<strong>in</strong> the trust ofthe customers of our security services and be able to meet their expectations.Our aim is to have as many satisfied customers as possible. The results of ourwork will therefore depend heavily on realis<strong>in</strong>g these ambitions. All this is achance for us to improve our work further.Excellence is merely another step <strong>in</strong> ensur<strong>in</strong>g a high quality work<strong>in</strong>g process <strong>in</strong>the Police and polic<strong>in</strong>g <strong>in</strong> general. The entire process must mean better workquality and must be reflected <strong>in</strong> us be<strong>in</strong>g more efficient and successful.Long-term quality leadership and management of human, material and technicalresources is the only guarantee that the Maribor Police Directorate willbe able <strong>in</strong> the future also to achieve excellence <strong>in</strong> other areas of work<strong>in</strong>g processes.37
APPLICATION FOR ASSESSING DAMAGE TO CROPSAND DAMAGE TO PROPERTY – AJDAAna JAKŠIČM<strong>in</strong>istry of Defence, Adm<strong>in</strong>istration of the Re<strong>public</strong> of Slovenia forCivil Protection and Disaster Reliefana.jaksic@urszr.si1 INTRODUCTIONNatural disasters, <strong>in</strong>creas<strong>in</strong>g <strong>in</strong> frequency and <strong>in</strong>tensity, cause great damage tocrops, property and <strong>in</strong>frastructure every year. Slovenia’s system of protectionaga<strong>in</strong>st natural and other disasters is unique <strong>in</strong> the European Union. The Adm<strong>in</strong>istrationof the Re<strong>public</strong> of Slovenia for Civil Protection and Disaster Relief(ACPDR), a body attached to the M<strong>in</strong>istry of Defence that performs adm<strong>in</strong>istrativeand professional tasks relat<strong>in</strong>g to protection aga<strong>in</strong>st natural and other disasters,has also been responsible for assess<strong>in</strong>g damage from natural and otherdisasters to crops and property s<strong>in</strong>ce 2003. In other EU Member States, assessmentand compensation for damage depends on the <strong>in</strong>surance company-<strong>in</strong>suranceholder relationship, i.e. they have no developed mechanism for theremoval of consequences of natural disasters susta<strong>in</strong>ed by their citizens.The Re<strong>public</strong> of Slovenia has had detailed assessment procedures <strong>in</strong> place onthe national, regional and municipal level s<strong>in</strong>ce 2004. The Decree on the damageevaluation methodology specifies a number of formulas; moreover, priceslist prices list are published annually on the ACPDR website.In 2003 and 2004, municipal committees, which conduct the bulk of assessmentactivities, faced a difficult task <strong>in</strong> complet<strong>in</strong>g the required forms consider<strong>in</strong>gthe large number of forms and comprehensiveness of prices list prices list Consider<strong>in</strong>gthe large number of compensation claims (<strong>in</strong>dividual municipalitieshad several hundred or even a thousand claimants for compensation), it wasvery difficult to complete the required forms and assess the damage <strong>in</strong> a relativelyshort period of time. All claimants for compensation and their claims hadto be entered <strong>in</strong> consolidated lists and errors, duplication of <strong>in</strong>formation, etc.sometimes occurred dur<strong>in</strong>g registration. The M<strong>in</strong>istry of Agriculture, Forestryand Food (MAFF) and the M<strong>in</strong>istry of the Environment and Spatial Plann<strong>in</strong>g(MESP), which are responsible for the preparation of the programme of removalof the consequences of natural disasters and payment of compensations,encountered significant difficulties <strong>in</strong> the process<strong>in</strong>g of this <strong>in</strong>formation.
APPLICATION FOR ASSESSING DAMAGE TO CROPS AND DAMAGE TO PROPERTY - AJDABased on that experience, ACPDR decided <strong>in</strong> 2005 to start develop<strong>in</strong>g an <strong>in</strong>formationsystem that would allow users on all levels the same regularly updated<strong>in</strong>formation. The new <strong>in</strong>formation system has the follow<strong>in</strong>g advantages:— all entered data as well as the programme itself are saved <strong>in</strong> one place – on theserver at the ACPDR site;— an established system of application users and their rights; this also allowsaccess to data to be recorded on the level of specific data and consequentlyensures compliance with the Personal Data Protection Act;— simplified upgrad<strong>in</strong>g of application and data archiv<strong>in</strong>g;— uniform process<strong>in</strong>g of the required forms;— fewer data-process<strong>in</strong>g errors due to the use of uniform code tables and priceslist ;— direct communication with the Agency of the Re<strong>public</strong> of Slovenia for AgriculturalMarkets and Rural Development (AAMRD) and Survey<strong>in</strong>g and Mapp<strong>in</strong>gAuthority of the Re<strong>public</strong> of Slovenia (SMARS), elim<strong>in</strong>at<strong>in</strong>g the need toobta<strong>in</strong> data ex officio and— a direct l<strong>in</strong>k established between the general government and local community.AJDA is a centralised web system that provides its users with a friendly, easy-touseand unified work<strong>in</strong>g environment by allow<strong>in</strong>g, at the same time, transferof verified data from official <strong>public</strong> records to various <strong>in</strong>stitutions, particularlyMAFF and MESP.AJDA has significantly contributed to improv<strong>in</strong>g the effectiveness and efficiencyof <strong>public</strong> adm<strong>in</strong>istration through considerably accelerated data <strong>in</strong>put andprocess<strong>in</strong>g, has provided verified and quality data and has reduced the time requiredfor the National Commission for the Assessment of Damage to preparematerial to be presented for discussion to the Government of the Re<strong>public</strong> ofSlovenia. The transfer of digital data to MESP and MAFF has also greatly contributedto a less costly <strong>public</strong> adm<strong>in</strong>istration by shorten<strong>in</strong>g the time necessary toprepare the damage-elim<strong>in</strong>ation programme by the m<strong>in</strong>istries.2 DAMAGE ASSESSMENT PROCEDUREACPDR has laid down detailed procedural rules for the assessment of damagecaused by natural disasters and def<strong>in</strong>ed responsibilities for <strong>in</strong>dividual levelsof government (general government, region, and municipality). Follow<strong>in</strong>g adisaster, the municipality concerned notifies the relevant ACPDR branch ofthe occurrence and extent of natural disaster (flood, storm, hail, draught, etc.)with<strong>in</strong> three days <strong>in</strong> writ<strong>in</strong>g. In addition to a description of the disaster, thenotification also <strong>in</strong>cludes a graphic presentation of the area hit by the disaster40
ANA JAKŠIČ(by mark<strong>in</strong>g it on the map and attach<strong>in</strong>g a photograph) as well as a prelim<strong>in</strong>aryassessment of damage to crops and property.Table 1: Number of municipalities by ACPDR regionsRegionNumber of municipalitiesPosavje Region 4Western Štajerska Region 33Coastal Region 3Gorenjska Region 18Ljubljana Region 32Eastern Štajerska Region 22Pomurje Region 27Northern Primorska Region 13Dolenjska Region 14Notranjska Region 10Podravje Region 19Koroška Region 12Zasavje Region 3TOTAL: 210The relevant ACPDR branch notifies ACPDR of the event and proposes adoptionof a decision to <strong>in</strong>itiate assessment of damage <strong>in</strong> the disaster-stricken areaswith<strong>in</strong> a s<strong>in</strong>gle or several municipalities. When the overall prelim<strong>in</strong>ary assessmentapproaches the limit for grant<strong>in</strong>g state aid, ACPDR issues a decision to<strong>in</strong>itiate damage assessment, accompanied by a statement of the grounds forthe decision and <strong>in</strong>structions, and sends it to the municipality concerned with acopy to the relevant ACPDR branch and responsible m<strong>in</strong>istries. The municipality<strong>in</strong>vites claimants for compensation <strong>in</strong> the manner commonly practised <strong>in</strong>the local area to report damage to the responsible municipal committee, whichthen assesses the damage by tak<strong>in</strong>g <strong>in</strong>to consideration the evidence submittedby the claimant for compensation. It assesses damage to crops and property <strong>in</strong>accordance with ACPDR <strong>in</strong>structions, enters the data <strong>in</strong> the AJDA application,pr<strong>in</strong>ts out and signs official forms and sends the data (orig<strong>in</strong>al requests, lists ofclaimants for compensation) to the relevant ACPDR branch.Damage to crops and property is assessed <strong>in</strong> accordance with the Protectionaga<strong>in</strong>st Natural and Other Disasters Act 1 , the Removal of Consequences of NaturalDisasters Act 2 and the Decree on the Damage Evaluation Methodology 3 .1Uradni list RS, nos. 64/94 and 28/06.2Uradni list RS, nos. 75/03, 90/07 and 102/07.3Uradni list RS, nos. 67/03, 79/04 and 81/06.41
APPLICATION FOR ASSESSING DAMAGE TO CROPS AND DAMAGE TO PROPERTY - AJDAClaimants for compensation report the damage on prescribed forms: Form 1for assessment of damage to agricultural land, Form 2 for assessment of damageto crops, Form 3 for assessment of damage result<strong>in</strong>g from destruction ofbuild<strong>in</strong>gs, Form 4 for assessment of damage to build<strong>in</strong>gs, and Form 5 for damageto civil eng<strong>in</strong>eer<strong>in</strong>g facilities.The reported damage is verified by regional damage-assessment committeesand a national damage-assessment committee. Competent <strong>in</strong>spectors of the Inspectorateof the Re<strong>public</strong> of Slovenia for Agriculture, Forestry and Food andcompetent <strong>in</strong>spectors of the Inspectorate of the Re<strong>public</strong> of Slovenia for theEnvironment and Spatial Plann<strong>in</strong>g are also <strong>in</strong>vited to participate <strong>in</strong> on-site <strong>in</strong>spections.All committees are composed of agricultural and build<strong>in</strong>g professionals,representatives of the m<strong>in</strong>istries, etc.The national damage-assessment committee makes a f<strong>in</strong>al assessment of damageto crops and property and sends it to the Government of the Re<strong>public</strong> ofSlovenia.The Government of the Re<strong>public</strong> of Slovenia confirms the f<strong>in</strong>al assessment ofdamage to crops and property when the level of the damage exceeds 0.03 percent of national budget revenues and <strong>in</strong>structs MAFF and MESP to draw up aprogramme for repair<strong>in</strong>g the damage.MAFF prepares a programme for elim<strong>in</strong>at<strong>in</strong>g the consequences of damage tocrops, to be confirmed by the Government of the Re<strong>public</strong> of Slovenia. On thebasis of the damage assessment, the programme for elim<strong>in</strong>at<strong>in</strong>g damage to crops,and the decisions of the Government of the Re<strong>public</strong> of Slovenia to allocate fundsfrom the national budget, the Agency of the Re<strong>public</strong> of Slovenia for AgriculturalMarkets and Rural Development (AAMRD) issues decisions regard<strong>in</strong>g the allocationof funds for the removal of the consequences of damage to agriculture.MESP prepares a programme for elim<strong>in</strong>at<strong>in</strong>g the consequences of damage toproperty to be confirmed by the Government of the Re<strong>public</strong> of Slovenia. Onthe basis of the assessment of the damage, the programme for elim<strong>in</strong>at<strong>in</strong>g theconsequences of damage to property and the decisions of the Governmentof the Re<strong>public</strong> of Slovenia to allocate funds from the national budget, MESPissues decisions regard<strong>in</strong>g the allocation of funds for elim<strong>in</strong>at<strong>in</strong>g the consequencesof damage to property.3 REASONS FOR INTRODUCING THE AJDA APPLICATIONDrought was officially declared <strong>in</strong> Slovenia <strong>in</strong> 2003 (the reason for adopt<strong>in</strong>gthe act and decree), and the southwestern part of the country was hit by earth-42
ANA JAKŠIČquake <strong>in</strong> 2004. Thunderstorms with hail and floods followed <strong>in</strong> 2004 and 2005.The type of thunderstorm and the number of affected municipalities and claimantsfor compensation are shown <strong>in</strong> Tables 2 and 3.Table 2: Damage to propertyThunderstorm Number of municipalities Number of formsEarthquake 17 July 2004 5 1,872Hail 9 August 2004 4 1,276Floods 9 and 10 October 2004 5 154Floods 31 October 2004 9 348Floods and hail 22 July 2005 8 759Floods 21 August 2005 44 1,711Table 3: Damage to cropsThunderstorm Number of municipalities Number of formsHail 2004 37 1,716Frost and hail 2005 64 6,082An analysis of the situation follow<strong>in</strong>g an exam<strong>in</strong>ation of all forms and proceduresafter the thunderstorms <strong>in</strong> 2004 and 2005 showed a great many cases ofirrational use of time and money. The analysis revealed the follow<strong>in</strong>g weaknessesof activities carried out <strong>in</strong> those years:— data provided on the forms were <strong>in</strong>complete and illegible;— claimants for compensation reported damage to crops grow<strong>in</strong>g on the sameplot and to the same crops simultaneously <strong>in</strong> several municipalities;— claimants for compensation reported damage to crops that they did not growat all;— claimants for compensation reported damage to crops grown on a larger areaand with a higher percentage of damage than actually susta<strong>in</strong>ed;— claimants for compensation reported damage to areas of build<strong>in</strong>gs, roofs andfacades that were larger than actually susta<strong>in</strong>ed;— claimants for compensation reported damage to facilities situated at addressesthat did not exist;— municipalities reported damage to facilities and roads that were not damagedat all;— large quantities of debris on the road were reported;— construction works were reported that were not actually carried out;— damage calculations were often <strong>in</strong>correct;— copy<strong>in</strong>g and unnecessary duplication of documents;43
APPLICATION FOR ASSESSING DAMAGE TO CROPS AND DAMAGE TO PROPERTY - AJDA— relevant m<strong>in</strong>istries experienced long deadl<strong>in</strong>es for data process<strong>in</strong>g;— errors occurred <strong>in</strong> copy<strong>in</strong>g data from the submitted forms;— a large number of compla<strong>in</strong>ts were made by claimants for compensation withregard to the payment of compensations for damaged crops.It should be emphasised that ACPDR had no opportunity to verify the data reportedby claimants for compensation. As a solution to this problem, a centralisedweb software application for enter<strong>in</strong>g and review<strong>in</strong>g requests was designed– the AJDA system. In design<strong>in</strong>g AJDA, we complied with the LisbonStrategy. We set the follow<strong>in</strong>g key objectives to meet our aims:— facilitat<strong>in</strong>g the work of municipal committees by creat<strong>in</strong>g a friendlier andmore uniform work<strong>in</strong>g environment;— facilitat<strong>in</strong>g a s<strong>in</strong>gle entry of data;— provid<strong>in</strong>g all user levels with the same and regularly updated <strong>in</strong>formation;— systematically def<strong>in</strong><strong>in</strong>g the rights of enter<strong>in</strong>g and review<strong>in</strong>g data for differentuser levels;— l<strong>in</strong>k<strong>in</strong>g databases <strong>in</strong> state adm<strong>in</strong>istration and thus ensur<strong>in</strong>g the authenticity ofsuch data, as well as faster process<strong>in</strong>g of data conta<strong>in</strong>ed <strong>in</strong> the register of agriculturalhold<strong>in</strong>gs, register of territorial units, cadastre of build<strong>in</strong>gs and landcadastre;— ensur<strong>in</strong>g high-quality process<strong>in</strong>g of data used <strong>in</strong> damage calculation, <strong>in</strong>putdata control, pr<strong>in</strong>touts of all forms and consolidated lists of damage on thelevel of municipalities, regions and general government, sorted by claimantfor compensation, address of claimant or damaged facility, damaged crop,damaged build<strong>in</strong>g and type of construction work as evidenced by the priceslist , and review<strong>in</strong>g damage assessment by municipality and by region;— reduc<strong>in</strong>g the volume of document copy<strong>in</strong>g and archiv<strong>in</strong>g;— elim<strong>in</strong>at<strong>in</strong>g lengthy procedures <strong>in</strong> search<strong>in</strong>g for and elim<strong>in</strong>at<strong>in</strong>g errors;— sett<strong>in</strong>g up electronic transfer of data to MAFF and MESP for further process<strong>in</strong>gand thus provid<strong>in</strong>g for faster preparation of damage elim<strong>in</strong>ation programmes,s<strong>in</strong>ce there is no need to re<strong>in</strong>put data;— reduc<strong>in</strong>g the time limit and improv<strong>in</strong>g the quality of programmes for elim<strong>in</strong>at<strong>in</strong>gconsequences of natural disasters, s<strong>in</strong>ce the data is acquired from officialrecords and verified;— enabl<strong>in</strong>g the use of the gathered <strong>in</strong>formation by several <strong>in</strong>stitutions: MAFF,MESP, the Tax Adm<strong>in</strong>istration of the Re<strong>public</strong> of Slovenia, the Statistical Officeof the Re<strong>public</strong> of Slovenia, the Chamber of Agriculture and Forestry, theAssociation of Municipalities and Towns of Slovenia, the Environmental DevelopmentFund of the Re<strong>public</strong> of Slovenia (Eco Fund) and the Institute forthe Protection of Cultural Heritage of Slovenia;— contribut<strong>in</strong>g to a friendlier, more efficient and less costly <strong>public</strong> adm<strong>in</strong>istration.44
ANA JAKŠIČIn 2006, the Agriculture Act (Official Gazette of the Re<strong>public</strong> of Slovenia – Uradnilist RS, no. 18/2006) <strong>in</strong>troduced the Graphical Agricultural Unit of a FarmHold<strong>in</strong>g (GERK), which is be<strong>in</strong>g <strong>in</strong>cluded <strong>in</strong> all databases of the m<strong>in</strong>istry andused for the purpose of implement<strong>in</strong>g agricultural policy through the amendmentof the Agricultural Act. ACPDR has, <strong>in</strong> agreement with MAFF, AAMRD andthe Tax Adm<strong>in</strong>istration, adapted Form 2 accord<strong>in</strong>gly. This resulted <strong>in</strong> shorterprocedures and significant sav<strong>in</strong>gs. MAFF even simplified the procedure forclaimants for compensation, so that Form 2 is accepted as a request for paymentof compensation for damage caused by natural disaster, provided that theGovernment of the Re<strong>public</strong> of Slovenia decides to use funds for elim<strong>in</strong>at<strong>in</strong>gthe consequences of damage <strong>in</strong> agriculture for the disaster that is the subject ofthe damage assessment.4 AJDA DEVELOPMENT AND UPGRADING4.1 AJDA 2006The bulk of adm<strong>in</strong>istrative work is performed by municipalities. AJDA’s developmenthas been based on the provision of assistance to municipalities bymeans of a user-friendly application.In 2006, we proceeded with develop<strong>in</strong>g AJDA, which was orig<strong>in</strong>ally conceivedas a conventional crop-damage assessment web application. Our <strong>in</strong>tention wasto elim<strong>in</strong>ate the identified deficiencies by upgrad<strong>in</strong>g the application. The upgradetook <strong>in</strong>to consideration the strategic orientations of the M<strong>in</strong>istry of PublicAdm<strong>in</strong>istration, user proposals and the established l<strong>in</strong>kage with <strong>public</strong> legalrecords. AJDA was directly connected to the Register of Agricultural Hold<strong>in</strong>gs(RAH), kept by MAFF, with a view to identify<strong>in</strong>g ownership and avoid<strong>in</strong>g duplicationof data. RAH provides <strong>in</strong>formation about claimants for compensation(KGM-MID, given name, family name, unique personal identification number,address, municipality of residence and GERKs (GERK no., area of <strong>in</strong>dividualGERKs).In this way, control has been established over KGM-MIDs and GERKs.AJDA users log <strong>in</strong>to the local application (smart client), which is transferredand/or updated from the web address http://ajda.sos112.si. ACPDR approvesuser registration, opens <strong>in</strong>dividual loss events and enables data entry to themunicipalities and regions that have received ACPDR’s decision to <strong>in</strong>itiate assessmentof damage.45
APPLICATION FOR ASSESSING DAMAGE TO CROPS AND DAMAGE TO PROPERTY - AJDADescription of the procedure:Users log <strong>in</strong> by means of a password that grants them various rights, accord<strong>in</strong>gto user level. AJDA basically comprises three levels of users:— The first level of users <strong>in</strong>cludes the municipal committees that <strong>in</strong>put the dataprovided by claimants for compensation and form pr<strong>in</strong>touts. After the expirationof the time limit for <strong>in</strong>put of data, the forms are automatically transferredto the regional commission level. Municipal committees are not authorised tomodify the data and are only allowed access.— The second level <strong>in</strong>cludes regional damage-assessment committees, whichhave the authorisation to correct data relat<strong>in</strong>g to the assessment of damageand data review<strong>in</strong>g and process<strong>in</strong>g for their own regions, to pr<strong>in</strong>touts ofconsolidated lists (by municipality, crop culture, type of disaster, loss event,type of damaged facility, etc.). After the expiration of the time limit for data<strong>in</strong>put, the forms are transferred to the national committee level. Regionalcommittees are not authorised to modify the data and are only allowedaccess.— The third level represents the national committee for assessment of damage.At this level, data from all forms are exam<strong>in</strong>ed and processed for the entirecountry: the committee may open any form and check, for example, the recordedquantities of gravel on the road aga<strong>in</strong>st the real situation, exam<strong>in</strong>edata <strong>in</strong>puts on regional and municipal levels, and pr<strong>in</strong>t out consolidated lists(by region, municipality, crop culture, type of disaster, loss event, etc.).A description of a partial execution of the procedure is provided below:— Municipal committees use Form 2 to assess the damage to crops reported byclaimants for compensation.— Municipal committees start to <strong>in</strong>put Form 2 <strong>in</strong>formation <strong>in</strong> AJDA. The datamay be <strong>in</strong>put simultaneously by up to 100 municipalities.— On enter<strong>in</strong>g the KMG-MID of claimants for compensation <strong>in</strong> AJDA, thefollow<strong>in</strong>g data are transferred from RAH: name and surname, tax ID no.— All GERKs of claimants for compensation and the crops comprised (142crops) are pr<strong>in</strong>ted out.— The municipal committee enters the data about damaged crops, the percentageof damage and the area of damaged crops.— AJDA shows the damage for each crop separately.— AJDA pr<strong>in</strong>ts out the names of members of the municipal committee.— Form 2 is pr<strong>in</strong>ted out from AJDA.— The form modifies the levels by date.46
ANA JAKŠIČ— The forms are kept by the municipality <strong>in</strong> electronic or paper form, depend<strong>in</strong>gon the structure of its organisation. ACPDR archives the data <strong>in</strong> electronicform only.— The data are transferred to AAMRD <strong>in</strong> digital form.Thunderstorms, hailstorms and drought affected crops <strong>in</strong> as many as 161 municipalities<strong>in</strong> 2006. The damage was estimated at EUR 59,546,289.90 <strong>in</strong>volv<strong>in</strong>g22,118 claimants for compensation. The data were first processed by computeron the basis of registers, which were then handed over to AAMRD <strong>in</strong> writtenand digital form. There was no further need to enter data separately, which hadbeen the earlier practice at AAMRD. This also shortened the time necessary forpreparation of a damage-elim<strong>in</strong>ation programme. Municipalities, region andgeneral government thus had immediate access to <strong>in</strong>dicative <strong>in</strong>formation onthe extent of damage on a community level.4.2 AJDA 2007AJDA was basically designed for enter<strong>in</strong>g 8,000 forms. However, the numberof forms entered <strong>in</strong> the system <strong>in</strong> 2006 was almost three times this number. Inupgrad<strong>in</strong>g AJDA, we also took <strong>in</strong>to account suggestions by the Association ofMunicipalities and Towns of Slovenia. A new client-server application was setup, particularly due to the poor and slow access of municipalities to the Internet.The upgrade of AJDA <strong>in</strong> 2007 comprised, <strong>in</strong> particular, two new solutions:— prior to enter<strong>in</strong>g the data for Form 2 on a community level, ACPDR entersdata about damaged crops and the maximum percentage of damage <strong>in</strong> AJDAon the basis of reports submitted by regional committees. This prevents entryof undamaged crops and unrealistic damage percentage data;— municipalities may pr<strong>in</strong>t out all forms at the same time.4.3 AJDA 2008In order to enable assessment of damage by a s<strong>in</strong>gle application, we upgradedAJDA by an <strong>in</strong>tegral module for assess<strong>in</strong>g damage to property <strong>in</strong> 2008. With aview to reduc<strong>in</strong>g the possibility of errors, we l<strong>in</strong>ked the module to the follow<strong>in</strong>gelements of the database of the Survey<strong>in</strong>g and Mapp<strong>in</strong>g Authority of theRe<strong>public</strong> of Slovenia (SMARS):— the Register of Spatial Units (streets, addresses, house numbers, post offices);— the Land Cadastre (lots, lot parts);— the Build<strong>in</strong>g Cadastre (<strong>in</strong>formation about build<strong>in</strong>gs).47
APPLICATION FOR ASSESSING DAMAGE TO CROPS AND DAMAGE TO PROPERTY - AJDAEntry of data is also enabled on a municipal level for Forms 1, 3, 4 and 5. Thedatabase also <strong>in</strong>cludes prices list for:— average construction price by type of build<strong>in</strong>g;— orig<strong>in</strong>al average prices for the assessment of partial damage on build<strong>in</strong>gs;— groups of works for assessment of damage to transport <strong>in</strong>frastructure;— orig<strong>in</strong>al average prices for the construction of distribution l<strong>in</strong>es;— average prices by group of works <strong>in</strong> electricity power network.SMARSFigure 1: Connection diagram of AJDA with databases and users5 APPLICABILITY OF AJDA FOR USERS AND COMPETENTINSTITUTIONSGeneralA. Prior to <strong>in</strong>troduction of AJDA— Data was entered manually both at MAFF and MESP.— Claimants for compensation reported damage for each thunderstorm separatelyand ACPDR had no access to the records of damage previously damage.— Claimants for compensation with recognised 100% damage (total loss ofcrops) could also obta<strong>in</strong> a subsidy <strong>in</strong> addition to compensation, and couldsell the same crops (e.g. hops) with the Slovene Quality Certificate.48
ANA JAKŠIČB. After the <strong>in</strong>troduction of AJDA— The output database is transferred electronically to MAFF and MESP accord<strong>in</strong>gto a protocol agreed <strong>in</strong> advance.— On open<strong>in</strong>g a new request for the current year, AJDA displays the <strong>in</strong>formationabout the claimant’s earlier requests if any.— Due to the connection with other registers, claimants cannot receive fundsfrom several sources for the same crop. This was the underly<strong>in</strong>g concept ofAJDA s<strong>in</strong>ce the European Commission allows only a one-off state aid to bepaid to claimants.Assessment of damage to crops prior to and after <strong>in</strong>troduction of AJDAA. Prior to <strong>in</strong>troduction of AJDA— It was left to the claimant for compensation to choose the crop, the crop yieldand the percentage of damage to be reported. Claimants for compensationreported maximum damage for all crops, and municipal committees did notverify the reported <strong>in</strong>formation dur<strong>in</strong>g the assessment and later, prior to harvest,and entered the <strong>in</strong>formation as given <strong>in</strong> AJDA.— Prior to enter<strong>in</strong>g the <strong>in</strong>formation <strong>in</strong> AJDA, claimants for compensation filled<strong>in</strong> the claimant <strong>in</strong>formation <strong>in</strong> Form 2 themselves; this <strong>in</strong>formation mostlyproved to be <strong>in</strong>complete, illegible and <strong>in</strong>accurate. Municipal committees enteredthis <strong>in</strong>formation <strong>in</strong> consolidated lists and sent these lists to the competentACPDR branch together with Form 2, and the ACPDR branch consolidatedthe <strong>in</strong>formation received on a regional level and submitted it to ACPDR.Simultaneous report<strong>in</strong>g of damage to the same crop <strong>in</strong> several municipalitieswas made impossible.— The list of members of damage-assessment committees was kept manually.B. After the <strong>in</strong>troduction of AJDA— The <strong>in</strong>troduction of a loss-event based list of damaged crops and the sett<strong>in</strong>gof a maximum damage limit have prevented undamaged crops and an unrealisticassessments of the extent of damage from <strong>in</strong>clusion.— All claimant data and all damaged crop areas are now displayed on the basisof KGM-MID.— Information about municipal committee members is entered <strong>in</strong> AJDA, allow<strong>in</strong>git to be pr<strong>in</strong>ted out on the forms and permitt<strong>in</strong>g an overview of tra<strong>in</strong><strong>in</strong>gand issued IDs.The process of acceptance and process<strong>in</strong>g of Form 2 also provides for a pr<strong>in</strong>toutof compensation claimant data on official forms and a pr<strong>in</strong>tout of variousconsolidated lists (by claimant, crop, disaster type, and municipality).49
APPLICATION FOR ASSESSING DAMAGE TO CROPS AND DAMAGE TO PROPERTY - AJDAAssessment of damage to property prior to and after <strong>in</strong>troduction ofAJDAAssess<strong>in</strong>g damage to property is more complex s<strong>in</strong>ce it requires the use of severalforms (Forms 1, 3, 4 and 5) and prices list . The prices list for the orig<strong>in</strong>alaverage prices for the assessment of partial damage on build<strong>in</strong>gs for Form 4alone cover several hundred pages or 1,000 items.A. Prior to <strong>in</strong>troduction of AJDAClaimants for compensation filled <strong>in</strong> the claimant <strong>in</strong>formation <strong>in</strong> Forms 1, 3, 4and 5 themselves; this <strong>in</strong>formation mostly proved to be <strong>in</strong>complete, illegibleand <strong>in</strong>accurate. In particular, damage calculations were <strong>in</strong>correct s<strong>in</strong>ce activitydescriptions and prices other than those laid down by the compulsory priceslist had been used. Municipal committees entered the <strong>in</strong>formation about damageassessment conta<strong>in</strong>ed <strong>in</strong> <strong>in</strong>dividual forms <strong>in</strong> consolidated lists and sentthese lists to the competent ACPDR branch together with Forms 1, 3, 4 and 5.The ACPDR branch consolidated the <strong>in</strong>formation received on a regional leveland submitted it to ACPDR.B. After the <strong>in</strong>troduction of AJDAThe connection with the Register of Spatial Units allows AJDA to display correctaddresses of claimants for compensation. Municipal committees have beenlimited to recognis<strong>in</strong>g equal costs for the same type of damage. This and theuniform prices list have enabled accurate damage calculations.AJDA also displays the names of the members of municipal and regional committees.The system of accept<strong>in</strong>g and process<strong>in</strong>g the forms provides the follow<strong>in</strong>g features:— pr<strong>in</strong>tout of a compensation claimant’s data on an official form, <strong>in</strong>clud<strong>in</strong>g thecompensation claimant’s correct address and accurate assessment of damage,— pr<strong>in</strong>tout of consolidated lists (by compensation claimant, by form, by addressof compensation claimant, by type of build<strong>in</strong>g, and by type of constructionwork).Various pr<strong>in</strong>touts for various usersA wide range of pr<strong>in</strong>touts, as shown partly by Figure 2, is available only at themunicipal committee level. An overview of the damage shown <strong>in</strong> a particular50
ANA JAKŠIČform may also be classified by address of compensation claimant, by address ofthe build<strong>in</strong>g and by request reference number.Figure 2: Examples of possible municipal-level pr<strong>in</strong>touts.On 13 and 14 July, and 8, 15 and 16 August 2008, thunderstorms with heavy ra<strong>in</strong>and hail caused extensive damage to property, particularly to roofs of build<strong>in</strong>gs.As many as 27,716 forms were entered <strong>in</strong> AJDA, of which 22,586 for the15/16 August 2008 thunderstorm alone. A number of municipalities enteredover 1,000 forms and one municipality more than 5,000. Without AJDA’s support,this large quantity of forms could not have been processed with<strong>in</strong> therequired time limits. An overview and control of these forms would also havebeen <strong>in</strong>effective without AJDA. Table 4 presents a pr<strong>in</strong>tout on a regional level.51
APPLICATION FOR ASSESSING DAMAGE TO CROPS AND DAMAGE TO PROPERTY - AJDATable 4: Regions that suffered damage on 15 and 16 August 2008Name of region1 Dolenjska Region2 Ljubljana Region3 Podravje Region4 Pomurje Region5 Posavje Region67Eastern ŠtajerskaRegionWestern ŠtajerskaRegionTOTALTotal Form 1 Form 3 Form 4 Form 5No. of claims No. of claims No. of claims No. of claims No. of claimsDamage Damage Damage Damage Damage145 0 0 45 100215,283.15 0.00 0.00 38,458.96 176.824.1924 9 0 0 15213,729.13 21,647.29 0.00 0.00 192,081.8413,705 0 0 13,517 18839,023,733.98 0.00 0.00 38,428,703.28 595,030.703,745 0 0 3,638 1076,894,979.46 0.00 0.00 6,675,613.81 219,365.65508 84 0 298 1252,536,357.61 833,561.00 0.00 1,189,333.40 513,463.211,506 0 2 1,308 1962,912,438.38 0.00 70,725.03 2,606,182.36 235,530.992,954 183 45 2,595 1315,791,376.76 1,109,878.60 367,823.68 3,395,343.05 918,331.4322,586 276 47 21,401 86257,587,898.44 1,965,086.89 438,548.71 52,333,634.86 2,850,628.01AJDA processes the <strong>in</strong>put data and provides statistics on, for example, damagedroof cover<strong>in</strong>gs <strong>in</strong> a particular region (Table 5). This <strong>in</strong>formation was of greatassistance to the Slovenian National Build<strong>in</strong>g and Civil Eng<strong>in</strong>eer<strong>in</strong>g Institute <strong>in</strong>prepar<strong>in</strong>g their assignment “Damage due to thunderstorms <strong>in</strong> 2008 – analysisof the situation follow<strong>in</strong>g the latest thunderstorms and proposed short-termand long-term measures”.Table 5: Type of damaged roof cover<strong>in</strong>g <strong>in</strong> Pomurje RegionPomurje Region Number DamageBD01 – Roof cover<strong>in</strong>g / Ridges and hips 283 24,821.28BD02 – Roof cover<strong>in</strong>g / Cover<strong>in</strong>g – tile cover<strong>in</strong>g 344 203,877.59BD03 – Roof cover<strong>in</strong>g / Cover<strong>in</strong>g – cement roof cover<strong>in</strong>g 51 17,608.90BD04 – Roof cover<strong>in</strong>g / Cover<strong>in</strong>g – “Salonit” and “Eternit”roof cover<strong>in</strong>g295 188,276.32BD05 – Roof cover<strong>in</strong>g / Cover<strong>in</strong>g – T<strong>in</strong> roof cover<strong>in</strong>g 23 64,888.71BD06 – Roof cover<strong>in</strong>g / Cover<strong>in</strong>g – Other materials 73 180,063.28BD07 – Roof cover<strong>in</strong>g / Snow guards 3 1,080.81TOTAL 1,072 680,616.89Electronic transfer of data to MAFF and MESPThe output database is transferred electronically by MAFF and MESP <strong>in</strong> accordancewith the Government’s decision follow<strong>in</strong>g approval of the f<strong>in</strong>al assessmentof damage to crops or property.52
ANA JAKŠIČPrior to <strong>in</strong>troduc<strong>in</strong>g AJDA, data was entered manually both at MAFF andMESP.Storage of dataWork<strong>in</strong>g data is accessible to users for a particular year under review. On open<strong>in</strong>ga new request for a particular claimant for compensation, AJDA displays the<strong>in</strong>formation about the claimant’s earlier requests, if any.Transparency of dataOw<strong>in</strong>g to the control of data provided by other <strong>in</strong>stitutions, no other state aidwas granted to claimants for compensation that suffered 100% damage fromhail i.e. total loss of crops, and at the same time sold, say, hops with a SloveneQuality Certificate and even received a subsidy for this purpose. Claimants forcompensation who suffered damage to crops of less than 30% were also deniedstate aid, although some large fruit producers received as much as EUR1,000,000 <strong>in</strong> aid <strong>in</strong> the past. The European Commission permits a one-off aidpayment to claimants hit by disaster.Innovation and sav<strong>in</strong>gsAJDA provides a uniform solution for all municipalities, uniform process<strong>in</strong>g ofrequired forms, a reduction of data process<strong>in</strong>g errors, makes obta<strong>in</strong><strong>in</strong>g data exofficio redundant, provides better communication between the general governmentand local communities, a friendlier and uniform work<strong>in</strong>g environment toits users, a centralised system of monitor<strong>in</strong>g requests by municipality and procedure,and the same and regular updat<strong>in</strong>g of <strong>in</strong>formation for all user levels.AJDA is user friendly and offers a range of types of process<strong>in</strong>g and pr<strong>in</strong>touts of<strong>in</strong>put data. This has reduced costs on the general government level s<strong>in</strong>ce thereis no need to for MAFF and MESP to duplicate data <strong>in</strong>put. Data is transferredby MAFF and MESP electronically. The costs of develop<strong>in</strong>g AJDA were repaidas early as the first year of its production – the use of the application made the<strong>in</strong>put of requests by AAMRD redundant s<strong>in</strong>ce all data had been provided <strong>in</strong> theform of an XML file. Moreover, <strong>in</strong>put of data by MESP was no longer necessary,and there was no need to hire students to do this job. The cost of postage wasreduced by 30–40%. Sav<strong>in</strong>gs are also reflected <strong>in</strong> the reduced costs of productionof the application for data <strong>in</strong>put by AAMRD and MESP, s<strong>in</strong>ce this data isalready acquired by ACPDR. This enables a faster preparation of programmesfor elim<strong>in</strong>at<strong>in</strong>g consequences of natural disasters and, at the same time, contributesto accelerat<strong>in</strong>g the disbursement of state aid to claimants.AJDA also supports enhanced transparency of damage assessment.53
APPLICATION FOR ASSESSING DAMAGE TO CROPS AND DAMAGE TO PROPERTY - AJDACooperation and build<strong>in</strong>g of partnershipsAlongside the legislative provisions, suggestions by MAFF, MESP and the Associationof Municipalities and Towns of Slovenia have been taken <strong>in</strong>to consideration<strong>in</strong> AJDA’s development. The database was built <strong>in</strong> cooperation withMAFF and SMARS.AJDA connects databases across state adm<strong>in</strong>istration, <strong>in</strong>clud<strong>in</strong>g databases fromthe Register of Agricultural Hold<strong>in</strong>gs, the Survey<strong>in</strong>g and Mapp<strong>in</strong>g Authority ofthe Re<strong>public</strong> of Slovenia (Register of Spatial Units, Build<strong>in</strong>g Cadastre, etc.).AJDA has significantly contributed to improv<strong>in</strong>g the effectiveness and efficiencyof <strong>public</strong> adm<strong>in</strong>istration and ensur<strong>in</strong>g the cooperation of several bodies,s<strong>in</strong>ce other <strong>in</strong>stitutions have also benefited from various application data:MAFF, MESP, the Tax Adm<strong>in</strong>istration of the Re<strong>public</strong> of Slovenia, the StatisticalOffice of the Re<strong>public</strong> of Slovenia, the Chamber of Agriculture and Forestry, theAssociation of Municipalities and Towns of Slovenia, the Environmental DevelopmentFund of the Re<strong>public</strong> of Slovenia (Eco Fund) and the Institute for theProtection of Cultural Heritage of Slovenia.6 SUMMARYAJDA’s development began <strong>in</strong> 2006. It was orig<strong>in</strong>ally designed as a tool forassess<strong>in</strong>g damage to crops only. The upgrade of AJDA <strong>in</strong> 2008 also allowedthe assessment of damage to property. Municipalities can enter the damagereported by claimants for compensation: assessment of damage to agriculturalland on Form 1, assessment of damage to crops on Form 2, assessment of damageresult<strong>in</strong>g from destruction of build<strong>in</strong>gs on Form 3, assessment of damageto build<strong>in</strong>gs on Form 4 and damage to civil eng<strong>in</strong>eer<strong>in</strong>g facilities on Form 5.Damage is calculated us<strong>in</strong>g approved prices list . AJDA has the follow<strong>in</strong>g advantages:— AJDA is very simple to use;— AJDA has significantly reduced the number of errors <strong>in</strong> calculat<strong>in</strong>g damage;— AJDA allows various pr<strong>in</strong>touts on the level of municipalities, regions and generalgovernment;— Data already entered need not be re-entered by MAFF and MESP;— Time and money is saved because of a shorter procedure;— Data may be used by several <strong>in</strong>stitutions at the same time;— Data verification is guaranteed, which facilitates traceability of <strong>in</strong>put data;— Further upgrades and easy archiv<strong>in</strong>g of data are possible;— Unauthorised receipt of state aid is prevented.54
ANA JAKŠIČSOURCES AND BIBLIOGRAPHY1. Decree on Damage Assessment Methodology.2. Procedural Rules for Assessment of Damage Caused by Natural and Other Disasters2008, ACPDR, A. Jakšič.3. Protection Aga<strong>in</strong>st Natural and Other Disasters Act.4. Removal of Consequences of Natural Disasters Act.5. Rules of Procedure for Regional Committees for Assessment of Damage Caused byNatural and Other Disasters 2008, ACPDR, A. Jakšič.6. Tender documents 1/2005 ACPDR.7. Tender documents 1/2007 ACPDR.8. Tender documents 1/2008 ACPDR.55
CHANGE MANAGEMENT IN THE NOVO MESTOADMINISTRATIVE UNITJože PRESKAR, Zdenka BAJUK, Nevenka OREHEKAdm<strong>in</strong>istrative unit Novo mestoue.novomesto@gov.si1 INTRODUCTIONThe Novo mesto Adm<strong>in</strong>istrative Unit (NMAU) is one of fifty-eight (58) adm<strong>in</strong>istrativeunits <strong>in</strong> the Re<strong>public</strong> of Slovenia. Accord<strong>in</strong>g to the methodology ofthe M<strong>in</strong>istry of Public Adm<strong>in</strong>istration, it is classified as one of a group of largeadm<strong>in</strong>istrative units with more than 50,000 <strong>in</strong>habitants. It operates <strong>in</strong> the areaof eight communities: the municipality of Novo mesto and communities of DolenjskeToplice, Mirna Peč, Straža, Šentjernej, Škocjan, Šmarješke Toplice andŽužemberk, <strong>in</strong> which there are a total of 64,000 <strong>in</strong>habitants <strong>in</strong> 329 settlements.With<strong>in</strong> NMAU there are 87 employees organised <strong>in</strong> four organisation units:the Internal Adm<strong>in</strong>istrative Affairs Section (IAAS); the Environment and SpatialPlann<strong>in</strong>g Section (ESPS); the Social Activity, Economy and Agriculture Section(SAEAS) and the Jo<strong>in</strong>t Affairs Service (JAS). In 2001, a quality management systemwas established accord<strong>in</strong>g to the ISO 9001:2000 standard, <strong>in</strong> 2003, self-assessmentunder the CAF model was performed, and <strong>in</strong> 2006 and 2007 NMAUparticipated <strong>in</strong> the PRSPO quality-assessment project. NMAU ranked among thef<strong>in</strong>alists and was awarded first a bronze diploma and then a silver.In accordance with Slovenian <strong>public</strong> adm<strong>in</strong>istration policy and strategy, stateadm<strong>in</strong>istration must be well organised. The organisation of work must be flexibleand capable of quick response to developments <strong>in</strong> the environment, s<strong>in</strong>ceservice-users expect efficient and high-quality services. Creat<strong>in</strong>g <strong>in</strong>dicators andmeasur<strong>in</strong>g efficiency has already become an established part of adm<strong>in</strong>istration<strong>in</strong> the private sector, whilst they are also becom<strong>in</strong>g <strong>in</strong>creas<strong>in</strong>gly established<strong>in</strong> the <strong>public</strong> sector and state adm<strong>in</strong>istration <strong>in</strong> connection with the <strong>in</strong>troductionof quality criteria such as effectiveness, economy and productivity. We certa<strong>in</strong>lycannot and should not directly transfer the concepts of efficiency measurementfrom the private to the <strong>public</strong> sector, s<strong>in</strong>ce there is a big difference<strong>in</strong> performance <strong>in</strong>dicators. In state adm<strong>in</strong>istration, legality, equality before thelaw, access to services on an equal basis, justice, protection of rights of parties,protection of the <strong>public</strong> <strong>in</strong>terest, etc. are of crucial importance and thus the criteriamust be harmonised also with these, less measurable parameters.In state adm<strong>in</strong>istration, there is much knowledge <strong>in</strong> the field of law and adm<strong>in</strong>istration,but not enough knowledge <strong>in</strong> other fields such as project man-
CHANGE MANAGEMENT IN THE NOVO MESTO ADMINISTRATIVE UNITagement, communication and conflict management, work organisation, plann<strong>in</strong>g,<strong>in</strong>formation technology, etc. that must essentially have an impact on the<strong>in</strong>troduction and management of changes and quality of work, efficiency andeffectiveness.NMAU participated <strong>in</strong> the project entitled Renovation of Operation of Adm<strong>in</strong>istrativeUnits, which standardised adm<strong>in</strong>istrative processes and still plays an activerole <strong>in</strong> the work<strong>in</strong>g group on adm<strong>in</strong>istrative unit efficiency. Participation <strong>in</strong>the projects mentioned and bus<strong>in</strong>ess excellence obliges us to regularly followthe quality system and review bus<strong>in</strong>ess excellence, efficiency and effectivenessand to <strong>in</strong>troduce new improvements. In its operation, NMAU implements theprovisions of the Rules on Quality and the Bus<strong>in</strong>ess Plan and other implement<strong>in</strong>gacts. Measurement of efficiency and productivity calls for quality data onthe results achieved and the resources used <strong>in</strong> planned tasks. At the nationallevel, not all comparable <strong>in</strong>dicators on the operation of adm<strong>in</strong>istrative units areavailable, and consequently, it is not possible to compare effects and achievementsamong adm<strong>in</strong>istrative units <strong>in</strong> the Re<strong>public</strong> of Slovenia for a longer periodof time. In this area, improvements have been identified <strong>in</strong> recent years.The SPIS 1.45 application has conta<strong>in</strong>ed a list of adm<strong>in</strong>istrative units (AU) andother adm<strong>in</strong>istrative tasks (OAT) with norms s<strong>in</strong>ce 2004. SPIS 1.45 shows theadm<strong>in</strong>istrative statistics for <strong>in</strong>dividual adm<strong>in</strong>istrative proceed<strong>in</strong>gs, for each activityand for the entire adm<strong>in</strong>istrative unit on a monthly basis and for the entireyear. This is an important contribution to determ<strong>in</strong><strong>in</strong>g efficiency. The secondand very important part of <strong>in</strong>formation to determ<strong>in</strong>e efficiency was preparedby NMAU itself. Under the records of the use of work<strong>in</strong>g time (absence andpresence records-APR), we established a record of hours used only for adm<strong>in</strong>istrativeprocedure management. These are called effective hours. We preparedtables us<strong>in</strong>g Excel to calculate planned hours and efficiency for <strong>in</strong>dividual workareas at the level of the workplace and at the level of <strong>in</strong>ternal organisationalunit. In addition to other quality <strong>in</strong>dicators, these calculations of efficiency arean excellent tool or a basis for evaluat<strong>in</strong>g work performance of employees(monthly performance, annual assessment), plann<strong>in</strong>g tasks, organis<strong>in</strong>g workand distribut<strong>in</strong>g staff.The determ<strong>in</strong>ation of efficiency <strong>in</strong> NMAU dates back to 2004 and a presentationat the 11 th professional consultation on modern aspects of operational andorganisational analysis, which was organised by the Union of Economists ofSlovenia, Bus<strong>in</strong>ess Analysis Section, <strong>in</strong> 2005 <strong>in</strong> Portorož.This contribution shows how changes are governed and managed with thehelp of monthly monitor<strong>in</strong>g of efficiency and performance <strong>in</strong> NMAU and whatthe effects have been. The <strong>in</strong>formation is taken from <strong>in</strong>ternal documents <strong>in</strong>NMAU.58
JOŽE PRESKAR, ZDENKA BAJUK, NEVENKA OREHEK2 MANAGED CHANGES IN ADMINISTRATIVE UNIT NOVOMESTOFor the preparation of a monthly bus<strong>in</strong>ess plan and objectives, a precise analysisof environmental expectations, available staff, competences and capacityas well as available f<strong>in</strong>ancial and material resources is necessary. Measurableand realisable objectives must be <strong>in</strong> l<strong>in</strong>e with all resources. A key question ishow to plan and realise and monitor objectives when cont<strong>in</strong>uous changes <strong>in</strong> awider society and <strong>in</strong> the state adm<strong>in</strong>istration are enacted. How effectively andefficiently are changes managed?2.1 APPROACH TO A SOLUTION AND SHORT DESCRIPTION OF DEVEL-OPMENTIn NMAU, a method of targeted management (plann<strong>in</strong>g and monitor<strong>in</strong>g annualgoals) was <strong>in</strong>troduced <strong>in</strong> 2001 and has been improved and adjusted to change.Changes <strong>in</strong> regulations, the <strong>in</strong>creas<strong>in</strong>gly high requirements and expectationsof users of our services and changes with<strong>in</strong> the adm<strong>in</strong>istrative unit over theseyears as described below have certa<strong>in</strong>ly had a strong impact on NMAU.Large annual fluctuations of the number and structure of applications asshown <strong>in</strong> Table 4 force us to prepare and adjust the organisation of workpractically every year dur<strong>in</strong>g the preparation of the annual plan. Long-termpractice showed that <strong>in</strong>ternal organisations and job classifications cannot bechanged solely on the basis of compar<strong>in</strong>g certa<strong>in</strong> statistical data. Comparisonof the number of settled cases and the number employed or the number of resolvedcases per employee for a certa<strong>in</strong> work area with<strong>in</strong> a certa<strong>in</strong> period hasnot provided data of sufficient quality. For the purpose of qualitative plann<strong>in</strong>g,the solution of adm<strong>in</strong>istrative matters and other adm<strong>in</strong>istrative tasks andplann<strong>in</strong>g of objectives (at workplaces, by type of activities, <strong>in</strong> organisationalunits and at the level of adm<strong>in</strong>istrative units) and the preparation of qualityannual plans, an <strong>in</strong>-depth analytical approach is <strong>in</strong>dispensable. NMAU has developeda system of quality, us<strong>in</strong>g calculations of efficiency at three levels: atthe level of employees, at the level of work area and at the level of <strong>in</strong>ternalorganisational units. NMAU began to develop and use the method immediatelyafter the <strong>public</strong>ation of the list of adm<strong>in</strong>istrative procedures (AP) andother adm<strong>in</strong>istrative tasks (OAT) <strong>in</strong>clud<strong>in</strong>g the norms, <strong>in</strong> the SPIS 1.45 Codetables. Cont<strong>in</strong>uous improvements have been made over several years of use,the most recent this year.59
CHANGE MANAGEMENT IN THE NOVO MESTO ADMINISTRATIVE UNIT2.2 IMPLEMENTATION OF THE SOLUTION IN PRACTICE2.2.1 Efficiency calculationThe efficiency of employees, a group or an organisation unit is calculated andmonitored on a monthly basis and annually on specially prepared forms. Amodel (approach) is designed <strong>in</strong> such a way that employees calculate efficiencyfor themselves and heads of <strong>in</strong>ternal organisation units for <strong>in</strong>ternal organisationunits. By transferr<strong>in</strong>g statistical data on resolved cases to tables, the calculationis practically completed and consequently does not result <strong>in</strong> a greater lossof time. The calculation of efficiency is based on:1. precise analysis and knowledge of staff potential (number and structure ofemployees, their competences, distribution, authorisations, etc.) and recordsof the hours performed by employees. Data on staff is regularly updated <strong>in</strong> theMFERAC program and <strong>in</strong> adm<strong>in</strong>istrative unit staff records. Data on work<strong>in</strong>ghours and absences is recorded daily <strong>in</strong> the program for verify<strong>in</strong>g absence andpresence (PAP) <strong>in</strong> NMAU, which is structured by type of absence and <strong>in</strong>tentionto use the work<strong>in</strong>g time. Records and the program facilitate exam<strong>in</strong>ation ofall levels (employees, <strong>in</strong>ternal organisation units, adm<strong>in</strong>istrative units) anddifferent time periods (day, month, and year).2. list of adm<strong>in</strong>istrative procedures (AP) and other adm<strong>in</strong>istrative tasks (OAT)<strong>in</strong>clud<strong>in</strong>g norms that were published by the M<strong>in</strong>istry of Public Adm<strong>in</strong>istration<strong>in</strong> the SPIS 1.45 Code Tables.3. statistical data published on a monthly basis and for the entire year for typesof adm<strong>in</strong>istrative procedures, by activities and for the entire adm<strong>in</strong>istrativeunit. These statistics <strong>in</strong>clude important data (backlogs, time required forresolv<strong>in</strong>g cases, appeals etc.) that is urgent for monitor<strong>in</strong>g the performanceand achiev<strong>in</strong>g certa<strong>in</strong> objectives.The effect of an employee (U 1) is the sum of the standardised hours to solveadm<strong>in</strong>istrative cases and other adm<strong>in</strong>istrative tasks <strong>in</strong> a determ<strong>in</strong>ed time period(∑nu 1) divided by the actually used hours for resolv<strong>in</strong>g these cases, which wedesignated as effective hours (eu 1).U 1= ∑ nu 1: the effect (U 1) may differ. 1 ≤ U 1< 1The effect of the group of employees (U s) is the sum of standardised hours forthe resolved adm<strong>in</strong>istrative cases and other adm<strong>in</strong>istrative tasks with<strong>in</strong> a determ<strong>in</strong>edtime period (∑nu s) divided by the actually used hours to solve thesecases and effective hours (eu s).U s= ∑ nu s: eu sthe effect (U s) may differ: 1 ≤ U s< 160
JOŽE PRESKAR, ZDENKA BAJUK, NEVENKA OREHEKExamples of calculations are <strong>in</strong> NMAU documents.The capacity utilisation of a group (IZ s), department (IZ o) and adm<strong>in</strong>istrativeunit (IZ ue) depends on the capacity utilisation of employees (IZ 1) and is correlatedwith the efficiency as described <strong>in</strong> Table 1.Table 1: Capacity utilisation of employees with regard to achieved effectCapacity utilisation of employees (CU)CaseEffectCapacity of anemployee (IZ 1)Capacity of a group(IZ s)Capacity of a section(IZ o)Capacity of anadm<strong>in</strong>istrative unit (IZ ue)A U < 1 – not used– there are reservesfor sure– not used <strong>in</strong> group– <strong>in</strong> group as a whole,there are reserves– Case A,B or Cmay appear withemployees of agroup– not used <strong>in</strong> section– <strong>in</strong> section as awhole, there arereserves– Case A,B or Cmay appear withemployees of asection– not used <strong>in</strong> AU– <strong>in</strong> AU as a wholethere are reserves– Case A,B or C mayappear with sectionsand employeesB U = 1 – mostly used– reserves are possible– mostly used <strong>in</strong>group– reserves <strong>in</strong> groupare possible– Case A,B or Cmay appear withemployees of agroup– mostly used <strong>in</strong>section– reserves <strong>in</strong> sectionare possible– Case A,B or Cmay appear withemployees of asection– mostly used <strong>in</strong> AU– reserves <strong>in</strong> AU arepossible– Case A,B or C mayappear with sectionsand employeesC U > 1 – used– small reserves– used <strong>in</strong> group– reserves <strong>in</strong> groupare small– Case A,B or Cmay appear withemployees of agroup– used <strong>in</strong> section– reserves <strong>in</strong> sectionare small– Case A,B or Cmay appear withemployees of asection– used <strong>in</strong> AU– reserves <strong>in</strong> AU aresmall– Case A,B or C mayappear with sectionsand employeesCalculations of efficiency and analysis showed all the examples stated <strong>in</strong> Table1. The difference <strong>in</strong> capacity utilisation among employees, groups and <strong>in</strong>ternalorganisation units were enormous <strong>in</strong> some cases and consequently reorganisationwas started immediately after analyses were complete.2.2.2 Performance of employees and <strong>in</strong>ternal organisation unitsPerformance of employees is monitored, analysed and evaluated on a monthlybasis accord<strong>in</strong>g to the criteria for determ<strong>in</strong><strong>in</strong>g a part of salary for regular workperformance <strong>in</strong> NMAU, which <strong>in</strong>clude knowledge and professionalism, qualityand accuracy, attitude to work and means of work, scope and efficiencyand <strong>in</strong>novation. In monthly evaluation of work performance for determ<strong>in</strong><strong>in</strong>g apart of salary for regular work performance accord<strong>in</strong>g to the criteria laid down<strong>in</strong> Article 31 of the collective agreement for the <strong>public</strong> sector, the def<strong>in</strong>itions61
CHANGE MANAGEMENT IN THE NOVO MESTO ADMINISTRATIVE UNITof average and above-average work performance are taken <strong>in</strong>to considerationwhere average work performance means the expected work<strong>in</strong>g results, whichhave already been evaluated <strong>in</strong> the basic salary. The above-mentioned criteriaand def<strong>in</strong>itions of work performance are published on the Internet and havebeen used s<strong>in</strong>ce 1 December 2008. The performance of <strong>in</strong>ternal organisationalunits and adm<strong>in</strong>istrative units is analysed and evaluated on a monthly basis andon the basis of reports on implement<strong>in</strong>g the Bus<strong>in</strong>ess Plan. An <strong>in</strong>tegral part ofthe report is a tabular and graphical presentation of certa<strong>in</strong> important data bymonth for adm<strong>in</strong>istrative units and <strong>in</strong>ternal organisational units <strong>in</strong> addition toother goal-achievement <strong>in</strong>dicators.2.2.3 Implementation of organisational changesIn order to manage changes, all data, correctly analysed at the appropriate time,and used <strong>in</strong> comb<strong>in</strong>ation with the most important data on employees who createthese results, are relevant.The effectiveness and efficiency of an adm<strong>in</strong>istrative unit depend particularlyon the effectiveness and efficiency of each of the employees (their capacities,satisfaction and efficiency), as well as the competences of management <strong>in</strong> manag<strong>in</strong>gthem, lead<strong>in</strong>g them and organis<strong>in</strong>g their work.Organisational changes based on efficiency and effectiveness analyses graduallyimprove results. The difference <strong>in</strong> efficiency among co-workers and <strong>in</strong>ternalorganisational units is reduced. An equal workload for <strong>in</strong>dividuals <strong>in</strong> <strong>in</strong>ternalorganisational units is provided. This is carried out by means of calculation ofthe necessary number of officials to solve a specific number of adm<strong>in</strong>istrativecases and other adm<strong>in</strong>istrative tasks <strong>in</strong> the planned period.The number of officials (NO) for a work area and/or for <strong>in</strong>ternal organisationunits is calculated <strong>in</strong> such a way that the amount of norm hours for theplanned number of adm<strong>in</strong>istrative cases and other adm<strong>in</strong>istrative tasks (∑NU) is divided by an annual average number of work<strong>in</strong>g hours per employee<strong>in</strong>tended for resolv<strong>in</strong>g these cases, which are designated as effective hours(Aeh/employee).When tak<strong>in</strong>g <strong>in</strong>to consideration the annual number of 2,125 hours per an employeeand 80% average annual presence of employees, the average annualnumber of effective hours per an employee amounts toAeh/employee = 2125 x 0.80 = 1,700 hours/employee.NO = ∑ NU : Aeh/employee, and/or NO = ∑ NU : 1,70062
JOŽE PRESKAR, ZDENKA BAJUK, NEVENKA OREHEKThe calculation of the necessary number of officials is precise enough and reliablefor tak<strong>in</strong>g decisions on organisational changes, as has already been proven<strong>in</strong> our current practice and presented <strong>in</strong> cases.Case 1: In <strong>2009</strong>, it was planned that the Environment and Spatial Plann<strong>in</strong>g Section(ESPS) would solve 2,028 cases accord<strong>in</strong>g to specific assessment procedures,for which 34,465 norm hours and 674 other adm<strong>in</strong>istrative tasks wouldbe required, for which an additional 1,335 norm hours would be required giv<strong>in</strong>ga total of 35,800 norm hours. When prepar<strong>in</strong>g the plan <strong>in</strong> November 2008,the calculation <strong>in</strong>dicated that the ESPS must be re<strong>in</strong>forced <strong>in</strong> terms of staff. Foran average annual efficiency <strong>in</strong> the ESPS, U o= 1.0, we obta<strong>in</strong> the necessary numberof officials.Number of officials = 35,800: 1,700 = 21.05, rounded to 21 officials.Twelve officials worked <strong>in</strong> the ESPS at the time of the calculation. The calculation<strong>in</strong>dicated a deficit of n<strong>in</strong>e officials. Based on analysis <strong>in</strong> other <strong>in</strong>ternalorganisational units, we concluded that on 1 January <strong>2009</strong>, only four officialscould be transferred to the ESPS and these would have to be first tra<strong>in</strong>ed <strong>in</strong> conduct<strong>in</strong>gthe relevant adm<strong>in</strong>istrative procedures. Thus 16 officials are plannedfor <strong>2009</strong> <strong>in</strong> the ESPS. The share of resolved cases (Src) that can be achieved by16 officials dur<strong>in</strong>g regular work<strong>in</strong>g hours and <strong>in</strong> cases so that the average annualefficiency of a section Uo≥1 is calculated:Src = (∑Peu x Uo): NU, ∑Peu = 16 x 1,700 = 27,200 hours,∑Peu is a total of planned effective hours to resolve all adm<strong>in</strong>istrative casesWith Uo = 1.00: Src = (27.200 x 1,00): 35,800 x 100 = 75.98 – rounded 76%With Uo = 1.20: Src = (27.200 x 1.20): 35,800 x 100 = 91.17 – rounded 91%On the basis of past experience, it was determ<strong>in</strong>ed that the ESPS <strong>in</strong> <strong>2009</strong> wascapable of achiev<strong>in</strong>g Uo = 1.20 and solv<strong>in</strong>g 91% of cases. In the first six months,the efficiency <strong>in</strong> the ESPS has been greater than 1.00 (average 1.17), and thereforeit can be expected that the set objective (Uo = 1.20) will be achieved, oreven exceeded.Case 2: This comparative analysis <strong>in</strong>cludes adm<strong>in</strong>istrative procedures betweenthe ESPS and the SAEAS) <strong>in</strong> the period from 1 January to 31 August 2008, madebecause of the transfer of staff. This was sent to the Employment RelationshipAppellate Commission as an enclosure to an official’s appeal aga<strong>in</strong>st a decisionon the transfer to another work post. The commission rejected the appeal andthe arguments from the previous analysis prevailed. In Table 2, we collecteddata from the stated analysis and compared them with ESPS and SAEAS.63
CHANGE MANAGEMENT IN THE NOVO MESTO ADMINISTRATIVE UNITTable 2: Comparison of the number of cases under consideration and the necessaryhours for ESPS and SAEAS <strong>in</strong> the period from 1 January to 31 August 2007Ref.No.Organisation unitNumberof adm<strong>in</strong>istrative casesNumberof foreseen hours1. ESPS 1,030 22,7622. SAEAS 1,579 6,667ESPS/SAEAS relationship 0.65 3.41Table 2 shows that the comparison of the number of cases under considerationis not sufficient for tak<strong>in</strong>g decisions on the organisation of work but itis necessary to calculate the number of work<strong>in</strong>g hours with a view to solv<strong>in</strong>gthe received cases. In ESPS, fewer applications were received than <strong>in</strong> SAEAS;however, 3.41 times more time was needed for their solution than for the applicationsreceived <strong>in</strong> SAEAS <strong>in</strong> the same period. Such f<strong>in</strong>d<strong>in</strong>gs suggest a needfor organisational changes. Internal transfers of staff with appropriate educationand qualification need to be transferred from SAEAS to ESPS, as was alsocarried out <strong>in</strong> a specific case. Our decision on the transfer was thus grounded,legitimate and urgent.The analytical approach to governance and management that is demonstrated<strong>in</strong> the above cases enables at least three solutions:1. we adjust objectives to the planned scope of tasks and available resources;2. we adjust resources and organisation of work to the planned scope of tasksand3. we adjust the organisation of work and objectives to the planned scope oftasks and available resources.The planned scope of tasks for a specific period (month, several months or ayear) is def<strong>in</strong>ed <strong>in</strong> the annual Bus<strong>in</strong>ess Plan on the basis of statistical data fromthe past year and forecast changes <strong>in</strong> the environment. Sources and objectivesare determ<strong>in</strong>ed <strong>in</strong> the AU Bus<strong>in</strong>ess Plan, and that is why they are not stated <strong>in</strong>detail <strong>in</strong> this contribution.Management and adm<strong>in</strong>istration of changes are conducted accord<strong>in</strong>g to theDem<strong>in</strong>g Cycle: plan, do, check, act, while also observ<strong>in</strong>g the specific conditionsof state adm<strong>in</strong>istration. This is shown <strong>in</strong> Table 3.64
JOŽE PRESKAR, ZDENKA BAJUK, NEVENKA OREHEKTable 3: Management and adm<strong>in</strong>istration of changes <strong>in</strong> AUAnalysis of situationand plann<strong>in</strong>g(Plan)Introduction of changes(Do)Monitor<strong>in</strong>g effectsand changes(Check)Introductionof improvements(Act)Scope of tasks:– adm<strong>in</strong>istrativeprocedures– otheradm<strong>in</strong>istrativetasks– professionaltechnicaltasksAvailable resources:– staff– f<strong>in</strong>ances– technical meansObjectives:– planned– achievedUsers’ expectations:– k<strong>in</strong>dness– professionalism– speed of resolutionExpectationsof employees:– work loads,– motivation– co-operation.1. We do not change theorganisation of work, we adjustthe objectives to the exist<strong>in</strong>gorganisation and resources2. We adjust the organisationof work and supplement theresources to the plannedobjectives3. We adjust the organisationof work and objectives to theavailable resourcesOn the basis of monthly and annualreports, we monitor and analysethe situation of all <strong>in</strong>dicators andimplement the objectives, <strong>in</strong>particular:– number of appeals toadm<strong>in</strong>istrative decisions,– decisions at the second <strong>in</strong>stanceand Constitutional Court,– number of resolvedadm<strong>in</strong>istrative cases.– number of backlogs,– time for resolv<strong>in</strong>g cases,– costs of operation,– absence of employees,– efficiency of employees,– satisfaction of customers (qualitybarometer),– satisfaction of employees(meet<strong>in</strong>gs),– professional tra<strong>in</strong><strong>in</strong>g,– change <strong>in</strong>troduction programme.We also analyse the reasons foreventual deviations from the planand adopt an improvement actionImplementationof improvementaction plan no. 1Implementationof improvementaction plan no. 2Implementationof improvementaction plan no. 3The most frequent is the third solution, which is adjustment of the organisationof work and objectives to the available resources i.e. staff, f<strong>in</strong>ances and spatialand other technical conditions. Management of staff is closely connected tof<strong>in</strong>ancial resources. The costs of salaries represent 70% to 80% of all adm<strong>in</strong>istrativeunit costs; consequently, urgent attention should be paid to managementand adm<strong>in</strong>istration as well as <strong>in</strong>troduction of changes <strong>in</strong> this segment.Key resources such as staff and f<strong>in</strong>ances cannot be changed and adjusted withthe same dynamics as changes which occur <strong>in</strong> the environment, particularlydur<strong>in</strong>g the present crisis when the limitations <strong>in</strong> the area of employment anduse of budget funds are stricter. We respond to the requirements of the environmentwith greater efficiency, which can be achieved with <strong>in</strong>ternal organisationalsolutions such as:— rationalisation of work processes,— <strong>in</strong>ternal transfer of tasks,— change of <strong>in</strong>ternal organisation and job classification as well as transfer ofemployees or— a comb<strong>in</strong>ation of several of these solutions.65
CHANGE MANAGEMENT IN THE NOVO MESTO ADMINISTRATIVE UNITThis can be designated as organisational flexibility based on all co-workers.In the light of experience, we have to agree with many theoreticians that thegreatest attention should be paid to the treatment of people at all stages ofthe preparation and implementation of organisational changes, otherwise thesolution will not succeed. Changes do not usually happen because managementand employees wish them to, but because they are triggered by external<strong>in</strong>fluences, which are understood by some people as pressures. It is clear thatfor every action (change), there is a reaction. It is quite understandable that acerta<strong>in</strong> number of co-workers will oppose the <strong>in</strong>troduction of changes, andtherefore changes must be <strong>in</strong>troduced on the basis of argument (based on analyticaldata), gradually and <strong>in</strong> co-operation with co-workers.In the case of case NMAU, this is particularly the conduct of adm<strong>in</strong>istrativeprocedures i.e. professional work, and consequently we have to analyse thoroughlythe distribution of staff, their competences, workload, eventual obstaclesat work and use of work<strong>in</strong>g time. Based on these analyses, we preparenew, optimal organisational solutions, which must offer better results. Thechanges are <strong>in</strong>troduced dur<strong>in</strong>g the time that is most appropriate for employeesand users. Normally, this is the beg<strong>in</strong>n<strong>in</strong>g of the bus<strong>in</strong>ess year. Immediatelyafter the <strong>in</strong>troduced organisational change, management must monitorall processes and if necessary offer help to <strong>in</strong>dividuals. After six months, it isof vital importance to make a first analysis and impact assessment of changes,and after one year to f<strong>in</strong>ally assess the approach and the impacts of thechanges <strong>in</strong>troduced and to prepare possible improvements. The procedureof adjustment of the organisation of work and objectives is carried out <strong>in</strong>eight steps:1. monthly and annual monitor<strong>in</strong>g of efficiency and effectiveness of <strong>in</strong>dividualemployees and <strong>in</strong>ternal organisational unitsWe calculate the effects of <strong>in</strong>dividual employees or groups and/or <strong>in</strong>ternal organisationalunits that provide a basis for optimal daily delegation of tasks andpreparation of all plans by means of statistical data, standards and records ofwork<strong>in</strong>g time – effective hours for a certa<strong>in</strong> period.2. Analysis of the past monthly, semi-annual and annual periodsA thorough analysis must answer the follow<strong>in</strong>g questions: What are the tasksand how many tasks have been carried out? Which have not been carried outand why? Who implemented them and how? Have all the objectives beenreached? What is the gap between the planned and achieved objectives? Whatis the atmosphere among the co-workers? What is the user satisfaction? Wheredid overloads occur and where are the reserves noted? What organisationalchanges may contribute to better results?66
JOŽE PRESKAR, ZDENKA BAJUK, NEVENKA OREHEK3. Preparation of a plan for organisational changes and/or an annual plan aswell as determ<strong>in</strong><strong>in</strong>g objectives with regard to the planned scope of tasks andavailable resourcesThe plan is based <strong>in</strong> particular on the calculation of efficiency, f<strong>in</strong>d<strong>in</strong>gs fromanalyses from the previous period and available resources: employees, f<strong>in</strong>ancialresources, spatial possibilities and <strong>in</strong>formation technology. It must result <strong>in</strong>an optimal sett<strong>in</strong>g of objectives.4. Preparation of organisational change programmeThe organisational change programme <strong>in</strong>cludes identified performers of taskand deadl<strong>in</strong>es for preparation, consideration, adoption and <strong>in</strong>troduction of organisationalchanges.5. Co-ord<strong>in</strong>ation of the planned change programme with co-workersCo-ord<strong>in</strong>ation with co-workers is carried out gradually (<strong>in</strong> the draft phase and<strong>in</strong> the proposal phase) at work<strong>in</strong>g meet<strong>in</strong>gs and depends on the planned organisationalchange requirements. The trade union that has the possibility ofdeliver<strong>in</strong>g its op<strong>in</strong>ion and comments must be notified of the planned changes.6. Elaboration and adoption of organisational change programmesThe proposal is considered and harmonised at the meet<strong>in</strong>g of the head of theadm<strong>in</strong>istrative unit and adopted by the head of the adm<strong>in</strong>istrative unit. Communicationis sent to all employees and changes are published <strong>in</strong> the <strong>in</strong>tranet.7. Introduction of organisational changesThe management <strong>in</strong> co-operation with co-workers provides for the implementationof the programme of planned changes.8. Monitor<strong>in</strong>g the effects and approaches to <strong>in</strong>troduced changesThe effects and approaches to <strong>in</strong>troduced changes are monitored by co-workers,heads of <strong>in</strong>ternal organisation units, the head of the adm<strong>in</strong>istrative unit and <strong>in</strong>meet<strong>in</strong>gs through SPIS 1.45, monthly reports and meet<strong>in</strong>gs. Everybody can makecomments and propose improvements that are also gradually <strong>in</strong>troduced.In NMAU, the follow<strong>in</strong>g organisational changes were carried out us<strong>in</strong>g this approach:1. Two sections were merged.A merger of the General Adm<strong>in</strong>istration and Economy Section (GAES) with theAgriculture, Forestry and Food Section (AFFS) <strong>in</strong>to the SAEAS was carried out67
CHANGE MANAGEMENT IN THE NOVO MESTO ADMINISTRATIVE UNITdue to the changed scope and structure of tasks and the <strong>in</strong>appropriate managementof AFFS. A new manager was appo<strong>in</strong>ted for manag<strong>in</strong>g a new merged section.Preparation for adoption of a programme for change was carried out <strong>in</strong> thesecond half of 2005 and the changes were <strong>in</strong>troduced on 1 January 2006. Theeffects of the change have been positive, s<strong>in</strong>ce more is be<strong>in</strong>g done to a higherstandard with fewer employees <strong>in</strong> this section and with a lower number of performedeffective hours, as the achieved results <strong>in</strong> the annual reports show.2. Transfer of employees from one section to another.Due to the reduced scope and structure of tasks <strong>in</strong> the three work<strong>in</strong>g areasof SAEAS, four employees were gradually transferred from this section to theESPS, where the scope of tasks had cont<strong>in</strong>uously <strong>in</strong>creased. Transfers weremade gradually and <strong>in</strong> compliance with employee legislation. The first transferwas realised on 1 September 2007. The reasons for transfer are stated undercase 2. A transfer of two officials was made on 1 March 2008 and then the transferof one more official on 1 January <strong>2009</strong>. We adjusted the organisation to thestructures and the scope of tasks <strong>in</strong> other areas. In <strong>2009</strong>, three officials weretransferred to the ESPS, one from the Internal Adm<strong>in</strong>istrative Affairs Sectionand two from the Jo<strong>in</strong>t Affairs Service.The responses of co-workers to the proposed and <strong>in</strong>troduced changes wereexpected and differed significantly. S<strong>in</strong>ce all the stated changes br<strong>in</strong>g morepositive than negative effects, they were well accepted by the majority of coworkers.The most negative response was expressed among certa<strong>in</strong> transferredco-workers because changes such as: the change of the head of the section,transfer to another section, assumption of new, more demand<strong>in</strong>g tasks, etc.3. In two local offices, bus<strong>in</strong>ess time and work<strong>in</strong>g hours as well as organisationof work were harmonised.In 2008 and <strong>2009</strong>, bus<strong>in</strong>ess time and work<strong>in</strong>g hours were adjusted to the scopeof tasks which has decreased <strong>in</strong> recent years due to changed regulations <strong>in</strong> 11local offices. The use of work<strong>in</strong>g time at a local office <strong>in</strong>tended for servic<strong>in</strong>gcustomers was low, s<strong>in</strong>ce it amounted only to 27% <strong>in</strong> 2007 and 29% <strong>in</strong> 2008.The rest of the available time was <strong>in</strong>tended for carry<strong>in</strong>g out other adm<strong>in</strong>istrativetasks that can be performed at the local office, particularly for the extensivetransfer of data from central registers to the electronic central register. Whenthe transfer of data was <strong>in</strong> its f<strong>in</strong>al phase, we adjusted the bus<strong>in</strong>ess time andwork<strong>in</strong>g hours at the local office to meet the needs of residents. In 2008, bus<strong>in</strong>esstime and work<strong>in</strong>g hours were reduced at all local offices. This year threelocal offices were elim<strong>in</strong>ated.In all cases, dur<strong>in</strong>g the preparation of the organisational change programme, efficiencycalculations that <strong>in</strong>dicate the workload of <strong>in</strong>dividuals and <strong>in</strong>ternal or-68
JOŽE PRESKAR, ZDENKA BAJUK, NEVENKA OREHEKganisational units were significantly helpful. An example of the calculation of theworkload of two <strong>in</strong>ternal organisational units is shown <strong>in</strong> Table 2. This calculationwas used as evidence <strong>in</strong> an appellate procedure <strong>in</strong>itiated by a transferredofficial. The Staff Commission of the Government of the Re<strong>public</strong> of Sloveniarejected the appeal and confirmed the decision concern<strong>in</strong>g the transfer. When<strong>in</strong>troduc<strong>in</strong>g changes at a local office, the decisions were supported with analysesprovided to community mayors and the M<strong>in</strong>istry of Public Adm<strong>in</strong>istration.2.3 RESOURCES NECESSARY FOR APPLYING THE SOLUTIONIn order to apply the described solution, no additional personnel, f<strong>in</strong>ancial,technical and other resources are necessary. All the activities are carried outaccord<strong>in</strong>g to the quality management system with the NMAU’s own staff andknowledge with<strong>in</strong> the framework of annual budget funds. Reports, calculations,analyses and their considerations with co-workers are carried out accord<strong>in</strong>g tothe annual Bus<strong>in</strong>ess Plan.2.4 APPLICABILITY OF THE SOLUTION FOR OTHER PUBLIC ADMINIS-TRATION INSTITUTIONSAs all the adm<strong>in</strong>istrative units <strong>in</strong> the Re<strong>public</strong> of Slovenia are confronted withsimilar external impacts on operations and have available the same applications(SPIS 1.45, MFERAC), we assess that the described approach of establish<strong>in</strong>gefficiency as a basis for <strong>in</strong>troduc<strong>in</strong>g changes can also be used by other adm<strong>in</strong>istrativeunits.The solutions described could also be used <strong>in</strong> other bodies of <strong>public</strong> adm<strong>in</strong>istration,provided that they have a list and temporal norms of all tasks.3 MEETING THE CRITERIA FOR THE ASSESSMENT OF THEPROPOSED SOLUTION3.1 CONTRIBUTION TO THE IMPLEMENTATION OF THE LISBON STRAT-EGY OBJECTIVESThe presented practice of management and adm<strong>in</strong>istration of changes viaefficiency and effectiveness analysis contributes to a more efficient and consequentlyless costly and more user-friendly state adm<strong>in</strong>istration. It is worthnot<strong>in</strong>g that, after the presented approach, several demand<strong>in</strong>g organisationalchanges were made that contributed to the optimisation of operation that isreflected <strong>in</strong> the operational results presented below.69
CHANGE MANAGEMENT IN THE NOVO MESTO ADMINISTRATIVE UNIT3.2 INNOVATIONA project on efficiency of adm<strong>in</strong>istrative units has been under preparation forseveral years <strong>in</strong> state adm<strong>in</strong>istration, but activities have been halted. The listof tasks and prestandard-norms is available. The Quality Improvement Committeeat the M<strong>in</strong>istry of Public Adm<strong>in</strong>istration, <strong>in</strong> which the head of NMAUparticipates, became acqua<strong>in</strong>ted with the further activities and solutions <strong>in</strong> thisproject which would enable quicker process<strong>in</strong>g of data for analys<strong>in</strong>g the situationand tak<strong>in</strong>g decisions concern<strong>in</strong>g the management and governance of anadm<strong>in</strong>istrative unit.The presented orig<strong>in</strong>al solution is appropriate for different time periods, dealswith different organisational levels, and provides a quick, professional and economicalresponse to changes <strong>in</strong> the environment.3.3 OPERATION RESULTSDur<strong>in</strong>g the period from 2004 to 2008, the management of NMAU adm<strong>in</strong>isteredand presented organisational changes <strong>in</strong> the unit by monitor<strong>in</strong>g effectivenessand efficiency. The results achieved are shown <strong>in</strong> Table 4. As is evident fromthe table, better results have been achieved <strong>in</strong> spite of great changes <strong>in</strong> thenumber and structure of adm<strong>in</strong>istrative cases and other adm<strong>in</strong>istrative tasks. Inma<strong>in</strong>ta<strong>in</strong><strong>in</strong>g an equal share of resolved (<strong>in</strong>creas<strong>in</strong>gly demand<strong>in</strong>g) matters, anda significantly <strong>in</strong>creased number of other adm<strong>in</strong>istrative tasks resolved, the follow<strong>in</strong>ghas been noted: the number of appeals, the use of effective hours andadm<strong>in</strong>istrative costs for each resolved case have been reduced; the satisfactionof employees is slightly lower and the satisfaction of customers (by annual surveyand barometer) has <strong>in</strong>creased.3.3.1 Results among customersThe assessment of customer satisfaction (scale 1–5) accord<strong>in</strong>g to the annualresults of the survey is higher every year (Table 4, Graph 1). The evaluationsof quality assessment (scale 1–5) which have been published on the e-governmentwebsite s<strong>in</strong>ce May 2006 are <strong>in</strong>creas<strong>in</strong>g on average. Table 4 shows only theassessments for December. From the records of entries to the book of remarksand commendations and expressed commendations <strong>in</strong> person it is evident thatthe share of expressed commendations is <strong>in</strong> <strong>in</strong>crease and amounts to over 80%.It is evident from the statistical records (SPIS 1.45) that the time for solv<strong>in</strong>gcases has reduced and the number of backlogs dropped. The percentage ofcustomers who were considered first is on the rise and is evident from theanalysis of results of the annual customer survey.70
JOŽE PRESKAR, ZDENKA BAJUK, NEVENKA OREHEKAssessmentOcenaYearDosežena Assessment ocena of customer <strong>za</strong>dovoljstva satisfaction strankGraph 1: Presentation of achieved level of satisfaction of customers<strong>in</strong> the period 2001–20083.3.2 Results among employeesThe satisfaction of employees has slightly decreased dur<strong>in</strong>g the period of <strong>in</strong>troductionof organisational changes. In 2004, the estimate of satisfactionamounted to 3.92 (scale 1–5) compared with 3.60 <strong>in</strong> 2008, despite organisationalchanges, transfer of staff and extraord<strong>in</strong>ary conditions result<strong>in</strong>g from the<strong>in</strong>troduction of the new pay system. Special satisfaction <strong>in</strong> connection with theorganisational changes made was expressed by co-workers at meet<strong>in</strong>gs and <strong>in</strong>yearly <strong>in</strong>terviews. The employees understood the need for monitor<strong>in</strong>g of efficiencyand it became an <strong>in</strong>tegral part of monthly report<strong>in</strong>g. Regular monitor<strong>in</strong>gof efficiency has an impact on better use of work<strong>in</strong>g time and a better overviewof the efficiency of <strong>in</strong>dividuals.3.3.3 Results <strong>in</strong> societyMonitor<strong>in</strong>g efficiency is, as already stated, of great <strong>in</strong>terest to other adm<strong>in</strong>istrativeunits and other state bodies. The analysis of assessment of satisfaction ofservice suppliers and providers with NMAU services and the co-operation ofour adm<strong>in</strong>istrative unit with state and other bodies <strong>in</strong>dicates that the achievedaverage assessment of satisfaction is 4.8 (scale 1–5) show<strong>in</strong>g a high level ofsatisfaction. Positive stories and comments on the operation of NMAU are alsonoted <strong>in</strong> the media and <strong>in</strong> <strong>public</strong>.3.3.4 Key results— In spite of the essential structural change of cases under consideration andthe fact that <strong>in</strong> the past years, the number of specific assessment procedureswas <strong>in</strong>creas<strong>in</strong>g and the number of reduced procedures which are shown <strong>in</strong>EU annual reports is decreas<strong>in</strong>g, the share of resolved adm<strong>in</strong>istrative casesexceeds 97% , as shown <strong>in</strong> Table 4.71
CHANGE MANAGEMENT IN THE NOVO MESTO ADMINISTRATIVE UNIT— A reduced number and share of appeals was achieved, as shown <strong>in</strong> Table 4and <strong>in</strong> Figure 2.— The share of confirmed decisions of NMAU at the second stage has exceeded68%, as shown <strong>in</strong> Table 4.— The number of resolved adm<strong>in</strong>istrative matters and other adm<strong>in</strong>istrative taskshas <strong>in</strong>creased while the number of effective hours has decreased, as shown <strong>in</strong>Table 4 and Figure 3.— The costs per resolved adm<strong>in</strong>istrative case, as shown <strong>in</strong> Table 4 and Figure 4,decreased <strong>in</strong> 2006 compared with 2005 from EUR 109.84 to EUR 91.44 afterthe merger of the GAES with the AFFS <strong>in</strong> the SAEAS. In 2008, costs slightly<strong>in</strong>creased (to EUR 95.00) due to certa<strong>in</strong> extraord<strong>in</strong>ary conditions, such ashigher costs for salaries result<strong>in</strong>g from the <strong>in</strong>troduction of the new pay systemand the elim<strong>in</strong>ation of a part of pay disparities, alongside price <strong>in</strong>crease <strong>in</strong>materials, services and energy, which could not be prevented.— Adm<strong>in</strong>istrative costs (salaries, material costs and <strong>in</strong>vestments) were reducedby EUR 35.235 <strong>in</strong> 2006 compared with 2005 because of the reorganisation, asshown <strong>in</strong> Table 4. In the follow<strong>in</strong>g years, the adm<strong>in</strong>istrative costs followed the<strong>in</strong>flation rate and the change <strong>in</strong> the pay system.Number of appealsYearTotal number of all appeals dur<strong>in</strong>g the report<strong>in</strong>g periodGraph 2: Presentation of jo<strong>in</strong>t number of all appeals <strong>in</strong> the period 2004–200872
JOŽE PRESKAR, ZDENKA BAJUK, NEVENKA OREHEKTable 4: Results of NMAU operation <strong>in</strong> the period 2004–2008Ref.No.Description 2004 2005 2006 2007 2008numbershare<strong>in</strong> %numbershare<strong>in</strong> %numbershare<strong>in</strong> %numbershare<strong>in</strong> %numbershare<strong>in</strong> %1 2 3 4 5 6 7 8 9 10 11 121.total number of adm<strong>in</strong>istrative casesunder consideration32,827 100 21,452 100 25,401 100 28,002 100 26,767 1002.total number of resolved adm<strong>in</strong>istrativecases32,27298.31(2/1)20,96397.72(2/1)24,79897.63(2/1)27,42597.94(2/1)26,06697.38(2/1)3.the number of unresolvedadm<strong>in</strong>istrative cases5551.69(3/1)4892.28(3/1)6032.37(3/1)5772.06(3/1)7012.69(3/1)4.total number of all appeals dur<strong>in</strong>g thereport<strong>in</strong>g period1370.42(4/2)122 0.58(4/2)1170.47(4/2)940.34(4/2)860.33(4/2)5.total number of resolved cases at thesecond stage1350.40(5/2)1220.58(5/2)1270.51(5/2)1000.36(5/2)610.23(5/2)6.the number of confirmed decisions ofNMAU at the second stage9268.1(6/5)9577.9(6/5)8566.9(6/5)6464.00(6/5)4268.85(6/5)7.the number of resolved otheradm<strong>in</strong>istrative cases58,004 83,863 121,754 113,516 103,3808. used effective hours 152,732 147,089 141,146 140,266 134,7639.adm<strong>in</strong>istrative costs (salaries + materialcosts + <strong>in</strong>vestments and <strong>in</strong>vestmentma<strong>in</strong>tenance)2,206,916 2,302,645 2,267,410 2,328,342 2,476,64710.adm<strong>in</strong>istrative costs per resolvedadm<strong>in</strong>istrative case EUR/resolved case68.38 109.84 91.44 84.90 95.0011. satisfaction level of employees 3.92 3.82 3.82 3.60 3.6012.satisfaction level of customers afterannual survey(estimate 1–5)4.17 4.20 4.26 4.56 4.5913.satisfaction level of customers acc. tobarometer at the end of December/ / 4.43 4.66 4.7373
CHANGE MANAGEMENT IN THE NOVO MESTO ADMINISTRATIVE UNITNumber of cases and effective hoursYearNumber of resolvedadm<strong>in</strong>istrative casesTotal number of all appeals dur<strong>in</strong>g the report<strong>in</strong>g periodNumber of resolvedother adm<strong>in</strong>istrative casesUsed effective hoursGraph 3: Presentation of received and resolved cases and use of effective hours <strong>in</strong>NMAU <strong>in</strong> the period 2004–2008Number of resolved casesCost for each resolvedcase <strong>in</strong> EURYearThe number of resolved adm<strong>in</strong>istrative casesCosts per resolved adm<strong>in</strong>istrative case <strong>in</strong> EURThe number of resolved other adm<strong>in</strong>istrativecasesGraph 4: Number of resolved cases and costs per resolved NMAUadm<strong>in</strong>istration case <strong>in</strong> the period 2004–20083.4 CO-OPERATION AND BUILDING OF PARTNERSHIP RELATIONSHIPThe co-operation of NMAU <strong>in</strong> several different work<strong>in</strong>g groups contributedsignificantly to the solutions presented <strong>in</strong> the adm<strong>in</strong>istrative unit: <strong>in</strong> the projectgroup for computerisation of adm<strong>in</strong>istrative units, which operated <strong>in</strong> theperiod 1996–2000 at the Government Centre for Informatics; <strong>in</strong> the Quality ImprovementCommittee, which started operation <strong>in</strong> 1999 at the M<strong>in</strong>istry of the74
JOŽE PRESKAR, ZDENKA BAJUK, NEVENKA OREHEKInterior and currently operates at the M<strong>in</strong>istry of Public Adm<strong>in</strong>istration; <strong>in</strong> thework<strong>in</strong>g group for the preparation of the list of adm<strong>in</strong>istrative procedures andother adm<strong>in</strong>istrative tasks, which has operated at the M<strong>in</strong>istry of the Interiors<strong>in</strong>ce 2001 and still operates at the M<strong>in</strong>istry of Public Adm<strong>in</strong>istration; <strong>in</strong> thework<strong>in</strong>g group for determ<strong>in</strong><strong>in</strong>g the efficiency of adm<strong>in</strong>istrative units, whichstarted to work <strong>in</strong> 2003 at the M<strong>in</strong>istry of the Interior and still operates at theM<strong>in</strong>istry of Public Adm<strong>in</strong>istration; <strong>in</strong> the work<strong>in</strong>g group for determ<strong>in</strong><strong>in</strong>g theefficiency of <strong>in</strong>spectorates of the Re<strong>public</strong> of Slovenia, which operated dur<strong>in</strong>gthe period 2006–2008 and <strong>in</strong> which NMAU started active partnership workyears ago. Co-workers from all <strong>in</strong>ternal organisational units worked periodically<strong>in</strong> the above work<strong>in</strong>g groups (on description of processes, preparationof the list of tasks, determ<strong>in</strong>ation of time use, etc.) and this was very useful <strong>in</strong><strong>in</strong>troduc<strong>in</strong>g the aforementioned changes.Teamwork and the partnership relationship among co-workers were based onconstructive criticism and propositions, which contributed significantly to theimprovement and applicability of our solution. The NMAU also used the experiencega<strong>in</strong>ed <strong>in</strong> the group for determ<strong>in</strong><strong>in</strong>g the efficiency of <strong>in</strong>spectorates ofthe Re<strong>public</strong> of Slovenia.A number of other adm<strong>in</strong>istrative units showed <strong>in</strong>terest <strong>in</strong> the NMAU’s solutions(Ljubljana, Velenje, Ilirska Bistrica, Krško, Trebnje, Kranj, Koper, Metlika,Črnomelj).3.5 SUSTAINABLE QUALITYIn the presentation of the solution, the comprehensive and active co-operation ofemployees over a number of years was mentioned several times. The proactive<strong>in</strong>volvement of management has been transferred to the majority of co-workers.It can be stated with certa<strong>in</strong>ty that new solutions based on monitor<strong>in</strong>g efficiencymust not be abandoned and that quality and excellence <strong>in</strong> NMAU have a reliablefuture when supported by the majority of co-workers, as seen from the meet<strong>in</strong>gdiscussions, yearly <strong>in</strong>terviews with co-workers and employees’ survey results.4 CONCLUSIONAs elsewhere, a constant feature <strong>in</strong> the state adm<strong>in</strong>istration is changes. In recentyears <strong>in</strong> the work of adm<strong>in</strong>istrative units, frequent and large changes have beencaused by amended rules, changes <strong>in</strong> the environment, greater expectationsof users, etc. We can establish that external changes happened faster than expected;therefore, we had to f<strong>in</strong>d new flexible solutions for manag<strong>in</strong>g the <strong>in</strong>ternalorganisational changes, with a view to adjust<strong>in</strong>g to the changed externalrequirements.75
CHANGE MANAGEMENT IN THE NOVO MESTO ADMINISTRATIVE UNITThe contribution presents a method for manag<strong>in</strong>g changes <strong>in</strong> NMAU basedon the quality system, <strong>in</strong> particular on regular monthly monitor<strong>in</strong>g of the efficiencyand effectiveness at all levels, at the level of employees and at the levelof <strong>in</strong>ternal organisational units and adm<strong>in</strong>istrative units.Monthly calculation and monitor<strong>in</strong>g of efficiency is an important <strong>in</strong>tegral part ofthe management and adm<strong>in</strong>istration of the operation <strong>in</strong> NMAU, facilitat<strong>in</strong>g rapidand flexible adjustment to changes. It also provides a basis for plann<strong>in</strong>g and prepar<strong>in</strong>gthe annual Bus<strong>in</strong>ess Plan, determ<strong>in</strong><strong>in</strong>g measurable objectives, monitor<strong>in</strong>gbus<strong>in</strong>ess processes, determ<strong>in</strong><strong>in</strong>g <strong>in</strong>ternal organisations and job classification, thedistribution and delegation of tasks and the implementation of necessary changes<strong>in</strong> the operation and management of staff and other resources. It further providesa basis for tak<strong>in</strong>g decisions <strong>in</strong> connection with the <strong>in</strong>troduction of preventiveand curative measures and other activities to improve operation. It is a tool forconduct<strong>in</strong>g yearly <strong>in</strong>terviews, assess<strong>in</strong>g the performance of employees and tak<strong>in</strong>gdecisions on promot<strong>in</strong>g employees. On the basis of monitor<strong>in</strong>g data on theachieved efficiency, the employees themselves receive feedback on the achievedeffectiveness and opportunities to improve the results of their own work. Thework <strong>in</strong> NMAU has established that the management of changes cannot be of sufficientquality on the basis of data on the number of resolved cases per official orper employee, but a wider, thorough and analytical approach is required.In practice, it is shown that the reorganisations of <strong>in</strong>ternal operation carriedout <strong>in</strong> NMAU were timely and effective because of thorough monitor<strong>in</strong>g andanalys<strong>in</strong>g of the efficiency of co-workers and <strong>in</strong>ternal organisation units. Organisational,staff and other changes could be prepared and grounded on thebasis of data supported with efficiency calculations and implemented with theaforementioned management approach.The analytical approach presented is orig<strong>in</strong>al and is appropriate for manag<strong>in</strong>gchanges <strong>in</strong> adm<strong>in</strong>istrative units, <strong>in</strong> particular <strong>in</strong> crisis situations when there isa need to perform more and better with limited resources, without caus<strong>in</strong>g additionalcosts. The results achieved after the <strong>in</strong>troduction of changes have beendescribed. The change-management approach that has been proven <strong>in</strong> NMAUcould, with m<strong>in</strong>or adjustments, also be <strong>in</strong>troduced <strong>in</strong> other state bodies.SOURCES1. Aplikacija SPIS 1.45 (Application SPIS 1.45).2. Poslovna dokumentacija UE Novo mesto (Poslovnik kakovosti, Poslovni načrti,Poročila o delu UE <strong>in</strong> drugi <strong>in</strong>terni dokumenti) (Bus<strong>in</strong>ess documents of Novo mestoAU (Rules on Quality, Bus<strong>in</strong>ess Plan, Report on the Work of the AU and other <strong>in</strong>ternaldocuments))76
NATURE CONSERVATION ATLASMart<strong>in</strong>a KAČIČNIK JANČAR MSc, Matej PETKOVŠEK,Mirjam GALIČIČ PhD, Matej SIMČIČInstitute of the Re<strong>public</strong> of Slovenia for Nature ConservationTilen SMOLNIKAR MSc, Roberto DEGANLjubljana Urban Institute1 INTRODUCTIONWell organised nature conservation related data are of great importance <strong>in</strong>nature conservation and nature conservation activities. The development ofnature conservation <strong>in</strong> Slovenia caused a significant <strong>in</strong>crease <strong>in</strong> the amount ofsuch data. With new legislation adopted after 1999, the scope of the term “natureconservation” was extended beyond natural heritage to cover valuable naturalfeatures and biodiversity. In legal terms, new mechanisms for protect<strong>in</strong>gand manag<strong>in</strong>g areas important for nature conservation have been <strong>in</strong>troduced.In Slovenia, various <strong>in</strong>stitutions are engaged <strong>in</strong> nature conservation. Natureconservation policies, strategies and legislation are developed by the M<strong>in</strong>istryof the Environment and Spatial Plann<strong>in</strong>g. The Environmental Agency of theRe<strong>public</strong> of Slovenia (EARS) and adm<strong>in</strong>istrative units handle adm<strong>in</strong>istrativeprocedures. The Institute of the Re<strong>public</strong> of Slovenia for Nature Conservation(IRSNC) is a <strong>public</strong> expert organisation engaged <strong>in</strong> record<strong>in</strong>g and assess<strong>in</strong>gnature, monitor<strong>in</strong>g its status, direct<strong>in</strong>g the use of space and activities affect<strong>in</strong>gnature by prepar<strong>in</strong>g nature conservation guidel<strong>in</strong>es; it also carries out ma<strong>in</strong>tenanceand reconstruction works on valuable natural features and preparesexpert op<strong>in</strong>ions. Numerous expert and scientific organisations and other nongovernmentalorganisations participate <strong>in</strong> gather<strong>in</strong>g and evaluat<strong>in</strong>g data onbiodiversity and its status. All these <strong>in</strong>stitutions use exist<strong>in</strong>g nature conservationdata <strong>in</strong> their work and many also produce new data. The wide use of natureconservation data makes their ma<strong>in</strong>tenance and accessibility very important.The IRSNC has recognised the necessity of efficient management of nature conservationdata and the problems caused by disorderly databases; for that reason,a decision was taken to build an <strong>in</strong>formation system for manag<strong>in</strong>g natureconservation data with<strong>in</strong> the framework of the LIFE III – Nature project “Natura2000 <strong>in</strong> Slovenia – Management Models and Information System”, specify<strong>in</strong>gthat such a system was to be transparent and easily accessible to experts andthe general <strong>public</strong>.
NATURE CONSERVATION ATLAS2 MANAGEMENT OF NATURE CONSERVATION DATA BE-FORE THE INTRODUCTION OF AN INFORMATION SYS-TEMIn Slovenia, the management of nature conservation data has a rich history. Inrespect of natural heritage, so-called record sheets were <strong>in</strong>troduced as early asthe mid-20 th century. They conta<strong>in</strong>ed data on <strong>in</strong>dividual items of natural heritage,<strong>in</strong>clud<strong>in</strong>g a cartographic representation and a photo. In the 1980s and1990s, most of these record sheets were digitised. Data on <strong>in</strong>dividual itemshave always been kept separately. Attribute data have been transferred to differentMS Access databases, while cartographic data have been kept <strong>in</strong> the .shp(ESRI) format. Legislation concern<strong>in</strong>g nature conservation adopted at the endof the 1990s envisaged data collection and record keep<strong>in</strong>g on biodiversity components<strong>in</strong> addition to these data.Besides basic data on biodiversity and valuable natural features, the processof nature conservation also <strong>in</strong>cludes a large amount of other data. In the past,data on direct (protected areas, contractual conservation) and <strong>in</strong>direct (natureconservation guidel<strong>in</strong>es) nature conservation measures were collected <strong>in</strong> adispersed manner. Likewise, data on the monitor<strong>in</strong>g of the status of valuablenatural features and biodiversity and data on ma<strong>in</strong>tenance works carried out <strong>in</strong>nature were not kept <strong>in</strong> appropriate records. The <strong>in</strong>troduction of managementplans for protected areas and Natura 2000 sites is expected to generate an extensivenew dataset from the management field. The quantity of data l<strong>in</strong>ked tonature conservation has been <strong>in</strong>creas<strong>in</strong>g steadily over the past decade.The IRSNC databases used to be kept at regional level. EARS is responsible forkeep<strong>in</strong>g records of areas important for the conservation of biodiversity (Natura2000 sites, EIA), records of protected areas and records of valuable naturalfeatures; for that reason and prior to their transfer to ARSO, regional databaseswere merged together, which caused an additional workload and was a sourceof potential errors. EARS and IRSNC employees used and processed the samedata layers and worked with data copies, which they subsequently exchanged,generally by way of electronic data media (CDs and floppy disks beforehand).Data on <strong>in</strong>dividual nature conservation subjects were kept <strong>in</strong> separate databasesand were not of a uniform configuration and form. Separate keep<strong>in</strong>gof graphic and attribute data presented a significant difficulty. A great amountof work was duplicated, and the quality of data became questionable becausethere were data versions that differed between both organisations and <strong>in</strong>dividualregional units with<strong>in</strong> the IRSNC. Ma<strong>in</strong>tenance of data was time consum<strong>in</strong>gand <strong>in</strong>effective. Before the analysis of expert data was conducted, <strong>in</strong>dividualsections of databases had to be merged; when legal acts were amended, extensivedata review<strong>in</strong>g and updat<strong>in</strong>g were required, as well as mutual coord<strong>in</strong>a-78
MARTINA KAČIČNIK JANČAR MSC ET AL.tion. The exist<strong>in</strong>g methods of data collection, storage and distribution were nolonger adequate.3 NATURE CONSERVATION ATLAS: NEW ORGANISATIONOF NATURE CONSERVATION DATAAll the problems described above, notably the <strong>in</strong>creased quantity and diversityof nature conservation data, led to the idea of sett<strong>in</strong>g up a s<strong>in</strong>gle database. Theemployees of both organisations would have simultaneous access to the database,which was to <strong>in</strong>clude a variety of data <strong>in</strong> a uniform format; at the sametime, the <strong>public</strong> would also have easy access to the same database (tak<strong>in</strong>g accountof the provisions of the Aarhus Convention, national legislation and theINSPIRE 1 <strong>in</strong>itiative). This was expected to <strong>in</strong>directly improve the performanceof <strong>public</strong> servants and to facilitate and speed up the procedure for provid<strong>in</strong>g<strong>public</strong> <strong>in</strong>formation.With<strong>in</strong> the LIFE III – Nature project: “Natura 2000 <strong>in</strong> Slovenia – ManagementModels and Information System”, last<strong>in</strong>g a total of three years (from January2005 to December 2007), the IRSNC started to regulate and resolve issues concern<strong>in</strong>gthe efficient management of Natura 2000 2 sites. One of the project’sobjectives was to prepare a “Natura 2000” geographic <strong>in</strong>formation system, ornature conservation atlas. EARS was not the orig<strong>in</strong>al project partner and jo<strong>in</strong>edthe project later because of the l<strong>in</strong>ked work processes and data flows betweenthe IRSNC and EARS. The <strong>in</strong>formation system was developed by the LjubljanaUrban Institute (here<strong>in</strong>after: contractor).Basic premises of the <strong>in</strong>formation system design were:— <strong>good</strong> practice rules, not related to actual data, which have to be observed bya geographic <strong>in</strong>formation system (Šumrada, 2005a; Šumrada, 2005b; Toml<strong>in</strong>son,2003; Burrough, McDonnell, 1998);— experience ga<strong>in</strong>ed by manag<strong>in</strong>g exist<strong>in</strong>g databases;— requirements of future users of the <strong>in</strong>formation system.1INSPIRE is a European Commission <strong>in</strong>itiative. Its aim is to build European spatial data <strong>in</strong>frastructurewhich will provide users with a comprehensive <strong>in</strong>formation service concern<strong>in</strong>g spatialplann<strong>in</strong>g.2Natura 2000 is a European network of ecologically important areas def<strong>in</strong>ed pursuant to theBirds Directive and Habitats Directive. The entire system is dedicated to the preservation of habitatsof <strong>in</strong>ternational importance and animal and plant species. Natura 2000 sites <strong>in</strong> <strong>in</strong>dividualEU Member States are selected pursuant to uniform criteria and make up a jo<strong>in</strong>t network whichprovides a basis for the cross-border protection and conservation of natural heritage.79
NATURE CONSERVATION ATLASThe lead<strong>in</strong>g idea was to build a modern database <strong>in</strong> which all nature conservationdata produced, collected and distributed by the IRSNC and EARS would bestored. Data were to be arranged transparently, allow<strong>in</strong>g easy access for specialistservices and the <strong>public</strong>, as well as management, over the Internet andwere to allow for the required analyses. All data must have a standardised metadatadescription.A major aim <strong>in</strong> build<strong>in</strong>g the <strong>in</strong>formation system was to <strong>in</strong>clude functionalitieswhich would improve the l<strong>in</strong>k<strong>in</strong>g-up of data and, consequently, ensure moreefficient data use. These functionalities are:— the capacity to collect and ma<strong>in</strong>ta<strong>in</strong> comb<strong>in</strong>ed spatial data;— the capacity to l<strong>in</strong>k geo-referenced location and descriptive data;— the capacity to perform vector area and network analyses and raster modell<strong>in</strong>gthrough data layer overlap;— the capacity to display geo-referenced special data (Smolnikar, 2008).The architecture of the <strong>in</strong>formation system is designed to comply with the follow<strong>in</strong>grequirements: l<strong>in</strong>kability, flexibility, possibility of upgrad<strong>in</strong>g, stability,transparency, accessibility and <strong>in</strong>teroperability. The system can be l<strong>in</strong>ked withother exist<strong>in</strong>g applications and databases, and allows for add<strong>in</strong>g data from otherorganisations through web services or by copy<strong>in</strong>g data to the database. Itfeatures a modular design and allows future upgrad<strong>in</strong>g with additional datasets. The user <strong>in</strong>terfaces can be adjusted to the users and their tasks (Smolnikar,Kačičnik Jančar, 2008).The <strong>in</strong>formation system is managed centrally and works <strong>in</strong> the <strong>in</strong>tranet/<strong>in</strong>ternetenvironment. It is composed of a production and distribution environment, andan additional test environment ensures smooth function<strong>in</strong>g of new applications.The <strong>in</strong>formation system has a web-based graphical user <strong>in</strong>terface for review<strong>in</strong>gand manag<strong>in</strong>g data; its functionalities adjust to the needs of particular datasets.With<strong>in</strong> the framework of develop<strong>in</strong>g and sett<strong>in</strong>g up the <strong>in</strong>formation system,a user <strong>in</strong>terface (named Nukleus) was developed; it is available at www.naravovarstveni-atlas.si.Because of tradition and identification, it has preserved thename of the old version of the nature conservation atlas (EARS), while <strong>in</strong> termsof substance and functionality it has entirely replaced and far surpassed theprevious one. The <strong>in</strong>formation system succeeded <strong>in</strong> arrang<strong>in</strong>g a large quantityof data so as to store each <strong>in</strong>dividual piece of data only once and arrange andgroup all data <strong>in</strong>to logical datasets. Consider<strong>in</strong>g the task to be performed and/orsubject to be viewed, users can choose among the follow<strong>in</strong>g profiles 3 : Valuable3A particular profile shows <strong>in</strong> detail one of the sets of nature conservation data for Slovenia whilealso enabl<strong>in</strong>g access to other datasets. The profile is composed of different pre-determ<strong>in</strong>ed andprepared subject layers.80
MARTINA KAČIČNIK JANČAR MSC ET AL.Natural Features (NV), Natura 2000 sites (NATURA), Ecologically ImportantAreas (EPO), Protected Areas (ZO), Habitat Types (HT), Protection Measures(UV), Nature Conservation Guidel<strong>in</strong>es (NS) and Op<strong>in</strong>ions-Consents.Because of a large quantity of data and for better transparency, the NatureConservation Atlas displays data <strong>in</strong> four profiles which can be accessed by<strong>public</strong> and <strong>in</strong>ternal users (profiles differ <strong>in</strong> the level of detail and range offunctionalities):ProfilenameNATURAEPONVZOUsed by the <strong>public</strong> (<strong>public</strong> access)− geographical display of Natura 2000 sites− general data on <strong>in</strong>dividual sites− policies and regimes <strong>in</strong> Natura 2000 sites− data on qualification species and habitat types− photographs of most qualification species andhabitat types− geographical display of ecologically importantareas− general data on <strong>in</strong>dividual areas− policies and regimes (*.pdf)− geographical display of valuable natural features<strong>in</strong> Slovenia− data on valuable natural features from the Ruleson the designation and protection of valuablenatural features− policies and regimes (*.pdf)− geographical display of large and small protectedareas− general data on <strong>in</strong>dividual protected areas− regulations concern<strong>in</strong>g protection, <strong>in</strong>clud<strong>in</strong>gpolicies and regimes (*.pdf)Used by employees (<strong>in</strong>ternal access)− all <strong>in</strong>formation under Public access− additional data on species and habitat types− all <strong>in</strong>formation under Public access− <strong>in</strong>formation about species and habitat typesoutside particular areas− status of the area− all <strong>in</strong>formation under Public access− status of valuable natural features (<strong>in</strong>put and/ormanagement through the web)− management of all attributes through the web− data on resources provid<strong>in</strong>g a basis for thegraphics− data on newly proposed and modified valuablenatural features− all <strong>in</strong>formation under Public access− data on resources provid<strong>in</strong>g a basis for thegraphics81
NATURE CONSERVATION ATLASIn addition, <strong>in</strong>ternal users (IRSNC employees) also have access to four profileswhich enable them to carry out specialist work through the Internet:ProfilenameProfile contentUsed by employees(<strong>in</strong>ternal access)Specific featuresUV− geographical display of areas <strong>in</strong> whichother protection measures apply− general data on <strong>in</strong>dividual areas− textual section of <strong>in</strong>dividual protectionmeasures, i.e. contracts (*.pdf)− access to leasecontracts− l<strong>in</strong>k to other datasetsNS− geographical display of areas <strong>in</strong>respect of which nature-conservancyguidel<strong>in</strong>es have been drawn up− general data on <strong>in</strong>dividual areas− <strong>in</strong>formation about the <strong>in</strong>struments forwhich guidel<strong>in</strong>es have been drawn up(<strong>in</strong>clud<strong>in</strong>g *.pdf)− preparation of data fordraw<strong>in</strong>g up guidel<strong>in</strong>es− web <strong>in</strong>put of graphic andattribute section of guidel<strong>in</strong>es− web management of attributedata on <strong>in</strong>dividual guidel<strong>in</strong>es− data entry from ArcGISHTOp<strong>in</strong>ionsconsents− geographical display of habitat typeareas− geographical display of the Natura2000 sites, ecologically importantareas, valuable natural features andprotected areas− geographical displayof habitat type areas− quick search of<strong>in</strong>formation forthe preparation ofop<strong>in</strong>ions− updat<strong>in</strong>g of layer app. oncea year 4− allows only data review<strong>in</strong>g,not manag<strong>in</strong>g− cross-section<strong>in</strong>g of natureconservation content withother spatial data allowedWhen enter<strong>in</strong>g the Nature Conservation Atlas, users select a profile or contentand a three-fold display shows (Picture 1): map viewer (A), attribute section (B)and communication section (C).Picture 1: Appearance of the Nukleus graphical <strong>in</strong>terface4In Slovenia, the mapp<strong>in</strong>g of habitat types is carried out progressively, consequently updat<strong>in</strong>g isdone periodically.82
MARTINA KAČIČNIK JANČAR MSC ET AL.The map viewer offers a spatial display of selected content. Users can adjustthe content scope of displayed data by switch<strong>in</strong>g the auxiliary layers available<strong>in</strong> the communication section. By select<strong>in</strong>g a button on the right edge of theviewer, the user can access different additional <strong>in</strong>formation (on the project, onthe selected layers, measurement of distance/surface area, zoom <strong>in</strong>/out…) andhelp. The user can enlarge the map viewer to full screen size.The communication section enables the display of auxiliary layers, search<strong>in</strong>gby different criteria, display of <strong>in</strong>formation about selected layers, display oflegends and switch<strong>in</strong>g between active profiles.Picture 2: Communication section (presentation of content of <strong>in</strong>dividual tabs).In the attribute section, the user can access all records <strong>in</strong> the selected profile.For example, the attribute section of the NV profile (valuable natural features)shows all valuable natural features <strong>in</strong> alphabetical order and detailed <strong>in</strong>formationabout the selected valuable natural feature. The user can limit the set ofrecords by predef<strong>in</strong><strong>in</strong>g a range of criteria (i.e. category/type of area, regionalIRSNC unit, habitat type) or by enter<strong>in</strong>g the name/code of the area, <strong>in</strong> part or <strong>in</strong>full, <strong>in</strong> the search w<strong>in</strong>dow.83
NATURE CONSERVATION ATLASPicture 3: The attribute section comprises a panel of all records <strong>in</strong> the selected profileand detailed <strong>in</strong>formation about the selected record accessible through the tab headers.The Nature Conservation Atlas allows the pr<strong>in</strong>t<strong>in</strong>g of a map with legend <strong>in</strong>formationand selected attribute data and the generation of a picture <strong>in</strong> .JPEG format.Pr<strong>in</strong>t<strong>in</strong>g and digital generation of a picture is enabled by an additional module.The databases and software are <strong>in</strong>stalled on hardware at EARS; this producesmajor sav<strong>in</strong>gs <strong>in</strong> terms of purchas<strong>in</strong>g software licenses, ma<strong>in</strong>tenance and humanresources. The Nature Conservation Atlas is a complex user-friendly <strong>in</strong>formationsystem which is easy to navigate because of the Nukleus <strong>in</strong>terface.4 DATA IN THE NATURE CONSERVATION ATLAS: TARGETPUBLIC AND ORGANISATIONData <strong>in</strong> the Nature Conservation Atlas are <strong>in</strong>tended for IRSNC and EARS professionals,the expert <strong>public</strong>, adm<strong>in</strong>istrative entities (ma<strong>in</strong>ly municipalities andadm<strong>in</strong>istrative units) and the general <strong>public</strong>. Through the Atlas, the user hasfree access to <strong>public</strong> data on nature conservation and to a vast scope of otherspatial data, i.e. land cadastre and house numbers (source: Survey<strong>in</strong>g and Mapp<strong>in</strong>gAuthority of the Re<strong>public</strong> of Slovenia), actual agricultural land use (source:M<strong>in</strong>istry of Agriculture, Forestry and Food), data on water bodies (source: Institutefor Water of the Re<strong>public</strong> of Slovenia), etc. Users can utilise data forvarious <strong>in</strong>quiries and manipulation; they can pr<strong>in</strong>t the current view or save it asan image file. IRSNC employees use the <strong>in</strong>formation system to draw up natureconservation guidel<strong>in</strong>es, op<strong>in</strong>ions and other expert materials, and to manage,correct and amend data conta<strong>in</strong>ed <strong>in</strong> different layers.All the above features are possible because the data model has been built progressivelyand professionally. Before the project started, the follow<strong>in</strong>g objectiveswere set:84
MARTINA KAČIČNIK JANČAR MSC ET AL.— to prepare an overall analysis of data and work processes and to develop, onthis basis, a comprehensive data model for manag<strong>in</strong>g nature conservationdata;— to transfer all exist<strong>in</strong>g data to a new database;— to draw up procedures and rules for permanent updat<strong>in</strong>g of the database.The first and very important phase <strong>in</strong> build<strong>in</strong>g the <strong>in</strong>formation system was athorough analysis of the exist<strong>in</strong>g situation, <strong>in</strong>clud<strong>in</strong>g an analysis of exist<strong>in</strong>g databaseswith a precise def<strong>in</strong>ition of their <strong>in</strong>terconnections, an analysis of thecode tables and <strong>in</strong>-stock values, an analysis of processes between <strong>in</strong>dividualdatabases and an analysis of used data and the requirements of database users.The key factor <strong>in</strong> the implementation of this phase was excellent ongo<strong>in</strong>gcooperation between the IRSNC and the contractor; cont<strong>in</strong>uous availability ofboth parties was assured for the duration of the cooperation. Reverse eng<strong>in</strong>eer<strong>in</strong>g,where the new system derives from a pre-exist<strong>in</strong>g and function<strong>in</strong>g one,was used by the contractor <strong>in</strong> the analysis. IRSNC employees participated <strong>in</strong>test<strong>in</strong>g the <strong>in</strong>formation system; they also attended educational workshops toprepare them for <strong>in</strong>dependent work.In cooperation with the contractor, plann<strong>in</strong>g rules 5 were established before thenew data structure was designed:— data rema<strong>in</strong> arranged <strong>in</strong> seven exist<strong>in</strong>g datasets (NV, Natura, EPO, ZO, HT, UV,NS);— tables l<strong>in</strong>k<strong>in</strong>g several datasets and the common code tables are organised separately;the same applies to external databases;— tables and fields are structured and named accord<strong>in</strong>g to rules (with the exceptionof the Cntrys tables <strong>in</strong> the Natura dataset with a structure set by theEuropean Commission);— accord<strong>in</strong>g to their type, tables are classified <strong>in</strong> four categories: graphic, attribute,code and relational;— all graphic layers use a unique field identifier (ID); attribute data are recorded<strong>in</strong> various relational tables.Based on these rules, the exist<strong>in</strong>g data were transferred to a central database;their display <strong>in</strong> eight profiles is enabled by the Nukleus <strong>in</strong>terface through theInternet. One of the outstand<strong>in</strong>g qualities of the Nature Conservation Atlas is itseasily accessible nature conservation data (through the Internet).5Other more “technical” rules were also established but are not relevant to this text.85
NATURE CONSERVATION ATLAS5 NATURE CONSERVATION ATLAS APPLICABILITY ANDINNOVATIONThe <strong>in</strong>formation system was completed <strong>in</strong> December 2007 and was thoroughlytested by IRSNC and EARS employees <strong>in</strong> the first two months of 2008; s<strong>in</strong>ceMarch 2008, it has been available to the <strong>public</strong> (professionals, adm<strong>in</strong>istrationand general <strong>public</strong>) at www.naravovarstveni-atlas.si. Visitor numbers to thewebsite have <strong>in</strong>creased rapidly. At present (July <strong>2009</strong>), there are approximately3000 website visits and over 50,000 website <strong>in</strong>quiries and other actions permonth.In the data overview and databases analysis phase implemented prior to thedevelopment of the <strong>in</strong>formation system, data were uniformly arranged and thestructure of tables was standardised so that at present the data structure is adequateand prepared for potential <strong>in</strong>tegration with other systems; the structurealso allows for the <strong>in</strong>teroperability between <strong>in</strong>dividual datasets. The <strong>in</strong>formationsystem of modular architecture facilitates simple upgrad<strong>in</strong>g and/or add<strong>in</strong>gnew modules which might prove necessary to meet user needs.A very useful option for IRSNC employees is the possibility of direct <strong>in</strong>put ofthe status of valuable natural features recorded dur<strong>in</strong>g a field visit. Functionalityhas been developed which allows employees to pr<strong>in</strong>t out a specificationlist directly from the Nature Conservation Atlas before a field visit; the list providesthe basis for a successful and comprehensive review of a valuable naturalfeature. Thus, a s<strong>in</strong>gle form and a set of data collected by employees dur<strong>in</strong>gfield visits are ensured. When additional funds are obta<strong>in</strong>ed, computer <strong>in</strong>putof data directly from the field will be made available. This feature is alreadyfunction<strong>in</strong>g <strong>in</strong> a test environment and needs to be implemented <strong>in</strong> practice.In draw<strong>in</strong>g up nature conservation guidel<strong>in</strong>es for particular areas, employeesenter relevant geographic and attribute data from the Nature Conservation Atlas<strong>in</strong> the database. Thus, all employees of the Institute have one-stop-shop accessto graphic and content displays of areas <strong>in</strong> respect of which the guidel<strong>in</strong>eshave been prepared; this enables the exam<strong>in</strong>ation of work already done andprevents duplication of work. Another very useful tool that can also be usedby <strong>public</strong> users is a “cross-section” display<strong>in</strong>g any area with the entire relevantnature conservation content and other layers; with a few clicks on the plot, thistool enables the user to determ<strong>in</strong>e the exact nature conservation content. Allthese functions also assist employees <strong>in</strong> their preparations for field visits. Somecontent items are displayed as photographs; pr<strong>in</strong>touts of protection regimes,policies and acts concern<strong>in</strong>g protection can also be obta<strong>in</strong>ed.In contrast to the old method of manag<strong>in</strong>g nature conservation data, the newsystem provides:86
MARTINA KAČIČNIK JANČAR MSC ET AL.— a s<strong>in</strong>gle database of nature conservation data which replaces several databases;— a one-stop-shop for all nature conservation data (centrally managed);— simultaneous access to data by the IRSNC, EARS and the <strong>public</strong>;— a user-friendly environment (numerous tasks can be carried out over the Internet);— the updat<strong>in</strong>g of exist<strong>in</strong>g and <strong>in</strong>put of new nature conservation content via theInternet;— <strong>public</strong> preview and spatial unit status before planned activities;— transfer of data and forms from the Nature Conservation Atlas;— easy updat<strong>in</strong>g ow<strong>in</strong>g to its modular architecture;— one system for all types of users (<strong>public</strong> users, IRSNC employees, analysts).To facilitate the work of <strong>public</strong> users, website <strong>in</strong>structions for work<strong>in</strong>g with theNature Conservation Atlas are available. Internal users have detailed written<strong>in</strong>structions for work<strong>in</strong>g with all demand<strong>in</strong>g functionalities <strong>in</strong> the <strong>in</strong>ternal profilesavailable on the server; they can also communicate with the adm<strong>in</strong>istrator,who receives comments/proposals and helps elim<strong>in</strong>ate potential problems.The adm<strong>in</strong>istrator is available to provide help to all users, <strong>public</strong> and <strong>in</strong>ternal,via e-mail.6 CONCLUSIONSThe Nature Conservation Atlas <strong>in</strong>formation system was built to optimise workprocesses at the IRSNC and EARS <strong>in</strong>volv<strong>in</strong>g nature conservation data and toprovide the <strong>public</strong> with better access to such data. In build<strong>in</strong>g the <strong>in</strong>formationsystem, a thorough analysis of the current status of nature conservation databaseswas of key importance.The strengths of the <strong>in</strong>formation system can be seen at the level of data, as wellas at the level of hardware and software, work processes and human resources.The modular structure of the <strong>in</strong>formation system enables future upgrad<strong>in</strong>gwith new modules when the need arises. It will only be possible to assess theeffect of build<strong>in</strong>g and <strong>in</strong>troduc<strong>in</strong>g the <strong>in</strong>formation system after a longer periodof use.We have developed the solution <strong>in</strong> the way we envisioned it. We believe that the<strong>in</strong>formation system works well <strong>in</strong> practice and serves the purposes and aims setbefore the work began; nevertheless, improvements are always possible.Because of its complexity and scope, the design and implementation of an <strong>in</strong>formationsystem represents a demand<strong>in</strong>g task for any organisation <strong>in</strong> terms87
NATURE CONSERVATION ATLASof human and, <strong>in</strong> particular, material resources. It is therefore reasonable fororganisations to network on major projects such as sett<strong>in</strong>g up and ma<strong>in</strong>ta<strong>in</strong><strong>in</strong>gthe <strong>in</strong>formation system for manag<strong>in</strong>g a variety of spatial data. Additionalfund<strong>in</strong>g for sett<strong>in</strong>g up the <strong>in</strong>formation system was obta<strong>in</strong>ed from the Europeanproject “Natura 2000 <strong>in</strong> Slovenia – Management Models and InformationSystem”. In terms of cost, the build<strong>in</strong>g of such system was too expensive for as<strong>in</strong>gle small organisation such as the IRSNC. In view of the overall complexityof the <strong>in</strong>formation system, we must not overlook the fact that the system is notf<strong>in</strong>al; it allows for further upgrad<strong>in</strong>g and add<strong>in</strong>g of new content. For its unh<strong>in</strong>deredfunction<strong>in</strong>g, the <strong>in</strong>formation system must be supported by a qualifiedteam for its <strong>in</strong>itial <strong>in</strong>stallation and subsequent ma<strong>in</strong>tenance.We seek to <strong>in</strong>troduce the Nature Conservation Atlas to the widest circle of professionalsand the general <strong>public</strong>. To this end, we attend professional meet<strong>in</strong>gsand conferences dedicated to the management of spatial data, where oursolution was generally recognised as an example of <strong>good</strong> practice <strong>in</strong> terms oforganisation of data as well as potential upgrad<strong>in</strong>g and/or l<strong>in</strong>k<strong>in</strong>g with othersimilar systems.For an organisation such as the IRSNC and for the society at large, the NatureConservation Atlas is of great importance. Its functionalities signify a shift towardsthe <strong>in</strong>formation society and <strong>in</strong>creased efficiency of our organisation.The sett<strong>in</strong>g up of the <strong>in</strong>formation system demonstrates that as a <strong>public</strong> entitywe make every effort to provide quality and professional services <strong>in</strong> a transparentmanner.SOURCES AND BIBLIOGRAPHY1. Burrough, P. A., McDonnell, R. A. (1998): Pr<strong>in</strong>ciples of geographical <strong>in</strong>formation systems.Oxford University Press. Oxford. 333 p.2. Kaj je pomembno pri uvajanju IT rešitev, 1. <strong>in</strong> 2. del. http://www.askit.si/clanek_meseca_2_07.asp,http://www.askit.si/clanek_meseca_4_07.asp (16.07.<strong>2009</strong>)3. Nature conservation atlas. http://www.naravovarstveni-atlas.si4. Petkovšek, M., Kačičnik Jančar, M., Galičič, M. (2008): “Naravovarstveni atlas” – theSlovenian <strong>in</strong>formation system for nature conservation. Bridg<strong>in</strong>g the gap: Respond<strong>in</strong>gto environmental change: from words to deeds: 63-65.5. Smolnikar, T. (2008): Izgradnja geografskega sistema Natura 2000. Magistrsko delo.Univer<strong>za</strong> v Mariboru, Fakulteta <strong>za</strong> organi<strong>za</strong>cijske vede. Kranj. 80 p.6. Smolnikar, T., Kačičnik Jančar, M. (2008): Zasnova geografskega <strong>in</strong>formacijskegasistema <strong>za</strong> upravljanje z naravovarstvenimi podatki. Varstvo narave 21: 125-135.7. Šumrada, R. (2005a): Tehnologija GIS. Fakulteta <strong>za</strong> gradbeništvo <strong>in</strong> geodezijo. Ljubljana.330 p.88
MARTINA KAČIČNIK JANČAR MSC ET AL.8. Šumrada, R. (2005b): Strukture podatkov <strong>in</strong> prostorske analize. Fakulteta <strong>za</strong>gradbeništvo <strong>in</strong> geodezijo. Ljubljana. 284 p.9. Toml<strong>in</strong>son, R. F. (2003): Th<strong>in</strong>k<strong>in</strong>g about GIS: Geographic <strong>in</strong>formation system plann<strong>in</strong>gfor managers. ESRI Press. New York. 283 p.89
COMPUTER-ASSISTED TAX INSPECTION AND STANDARD AUDIT FILES2 CONCEPT OF COMPUTER-ASSISTED TAX INSPECTIONIn the case of <strong>in</strong>spection with ACL software, the tax <strong>in</strong>spector captures the taxableperson’s data for <strong>in</strong>spection <strong>in</strong> electronic form (files) and transfers the <strong>in</strong>formationto his or her personal computer for further process<strong>in</strong>g. Data process<strong>in</strong>gcan <strong>in</strong>volve any electronic data of taxable persons, most often the follow<strong>in</strong>g:general ledger, record of deductible VAT, record of VAT charged, data onelectronic cash registers, supply records, <strong>good</strong>s records, etc. Taxable personsusually submit data to the <strong>in</strong>spector on a storage device (CD, DVD, USB flashdrive), or the <strong>in</strong>spector can directly connect to the taxable person’s database byus<strong>in</strong>g his or her PC. Data capture is followed by conversion <strong>in</strong>to ACL files (def<strong>in</strong>itionof logical properties of the file, def<strong>in</strong>ition of fields, deletion of surplusdata, etc.) used for analysis and verification with the commands and tools <strong>in</strong>tegrated<strong>in</strong>to ACL (separation of records of the highest value, data addition, dataclassification, search for duplication and miss<strong>in</strong>g data <strong>in</strong> a series of records,logical reviews, mathematical analysis, statistical analysis, etc.) The review resultsmay be displayed on screen or stored <strong>in</strong> a file or pr<strong>in</strong>ted out on paper. Ifneeded, an <strong>in</strong>spection of the orig<strong>in</strong>al bookkeep<strong>in</strong>g documents or other bookkeep<strong>in</strong>gand tax records is performed on the basis of the review results. ACLalso enables a quick and simple comparison of the data given by the person<strong>in</strong>spected by DURS or other official data (e.g. comparison with data from theregister of taxable persons, with data from the Customs Adm<strong>in</strong>istration of theRe<strong>public</strong> of Slovenia (CURS), with VIES data) as well as cross-comparison withthe data of other taxable persons.Taxable person'saccount<strong>in</strong>g systemThe with a record fromthe general ledgerFile with a record fromVAT deductedFile with a record fromVAT chargedOther electronic data ofthe taxable personInspector's PCImport and def<strong>in</strong>itionof the taxable person'sfiles <strong>in</strong> ACLElectronic data fromDURS on the taxableperson or data fromother sourcesTaxable person'sdata analysis <strong>in</strong> ACLReview of bookkeep<strong>in</strong>gdocumentsFigure 1: Computer-assisted tax <strong>in</strong>spection flowchart92
RAJKO HADJARACL software therefore enables the capture of the orig<strong>in</strong>al electronic bookkeep<strong>in</strong>gdata of the taxable person, which are then turned <strong>in</strong>to the form needed forfurther process<strong>in</strong>g and analysis.EXAMPLE OF THE TAXABLE PERSON’S GENERAL LEDGER IN ELECTRONIC FORM(test data)EXAMPLE OF THE TAXABLE PERSON’S GENERAL LEDGER CAPTURED IN ACLEXAMPLE OF DATA ANALYSIS IN ACL (ADDITION OF GENERAL LEDGER ACCOUNTS)Figure 2: Example of capture, transformation and analysis of orig<strong>in</strong>al bookkeep<strong>in</strong>gdata of the taxable person <strong>in</strong> ACL2.1 TECHNICAL PROPERTIES OF ACL SOFTWAREACL software properties:— simple to use <strong>in</strong> W<strong>in</strong>dows;— also suitable for users with average computer skills;93
COMPUTER-ASSISTED TAX INSPECTION AND STANDARD AUDIT FILES— <strong>in</strong>tegrated data analysis functions (<strong>in</strong>tegrated tools for classification, grad<strong>in</strong>gby class, <strong>in</strong>spection of miss<strong>in</strong>g data and duplications <strong>in</strong> a series of records,<strong>in</strong>dexation and grad<strong>in</strong>g by key, separation of relevant data from mass data,data filter<strong>in</strong>g by different keys, statistical analysis, sampl<strong>in</strong>g, etc.)— unlimited size of databases exam<strong>in</strong>ed;— capture of different database types (simple and relational databases, tablesfrom MS Office, COBOL, AD 400, SAP, dBASE, XML, etc);— capture of databases from different sources (access to databases througha network, local disc, CD or tape drive or ODBC drivers directly from theserver);— direct access to SAP/R3 enterprise software (possible direct SAP <strong>in</strong>spection);— audit report and audit trail generation (tools for creat<strong>in</strong>g reports on screen,pr<strong>in</strong>t<strong>in</strong>g them out or stor<strong>in</strong>g them <strong>in</strong> a separate file, <strong>in</strong>clud<strong>in</strong>g graphicrepresentations of the review results);— <strong>in</strong>ability to modify the orig<strong>in</strong>al data processed (read only);— direct access to and import of databases <strong>in</strong> the form used by the database ownerfor its bus<strong>in</strong>ess (while prevent<strong>in</strong>g the database owner from manipulat<strong>in</strong>g thedata).2.2 ADVANTAGES OF USING ACL SOFTWAREIn ACL software, all the benefits must be taken <strong>in</strong>to consideration, for DURS aswell as for taxable persons: their value should be seen beyond the tax subsequentlycharged <strong>in</strong> the course of tax <strong>in</strong>spection:— more wholesome and effective <strong>in</strong>spection, faster and simpler work for<strong>in</strong>spectors, <strong>in</strong>creased automation of the work process;— <strong>in</strong>creased amount of documents <strong>in</strong>spected and exam<strong>in</strong>ation of risk documents(<strong>in</strong>stead of choos<strong>in</strong>g them randomly);— additional methods of <strong>in</strong>spection enabled by computer technology(classification of data by category, add<strong>in</strong>g up data, separation of items ofhighest value, exclusion of negative values, use of filters, search for duplicationand miss<strong>in</strong>g data <strong>in</strong> a series of records, statistical analysis, sampl<strong>in</strong>g, l<strong>in</strong>k<strong>in</strong>gdatabases of the taxable person with DURS databases, etc.);— faster and more accurate identification of irregularities;— reduced audit/<strong>in</strong>spection risk (reduc<strong>in</strong>g the “tax gap”);— reduced burden on the part of the taxable person (quick and simple submissionof electronic data to DURS);— better image of DURS among taxable persons (modern work methods,electronic data submission, etc.);— preventive effect on taxable persons (<strong>in</strong>tegrat<strong>in</strong>g tax protection mechanisms<strong>in</strong> the taxable person’s account<strong>in</strong>g system, encourag<strong>in</strong>g taxable persons to94
RAJKO HADJARuse <strong>in</strong>ternal control of electronic data <strong>in</strong> order to test the accuracy of their taxreturns, etc.);— follow<strong>in</strong>g the European Commission recommendations related to tax<strong>in</strong>spection.2.3 LEGAL BASIS FOR COMPUTER-ASSISTED TAX INSPECTIONThe legal basis for such tax <strong>in</strong>spection is Article 38 of the Tax Procedure Act (Ur.l. RS [Official Gazette of the Re<strong>public</strong> of Slovenia], Nos 117/06, 24/08-ZDDKIS,125/08 and 20/09 – Zdoh-2D; here<strong>in</strong>after: ZDavP-2): the latter stipulates thatpersons liable for tax that use electronic data process<strong>in</strong>g shall, at the request ofthe tax authority, provide a pr<strong>in</strong>tout from their electronic books of account andrecords <strong>in</strong> the form of structured standard computer files so as to enable simpleelectronic data process<strong>in</strong>g.2.4 PROBLEMS IN COMPUTER-ASSISTED TAX INSPECTIONIn Slovenia, as <strong>in</strong> other EU Member States, one of the major difficulties of computer-assistedtax <strong>in</strong>spection is the provision of taxable persons’ electronic recordsto the tax authority. The variety of taxable persons’ account<strong>in</strong>g software(different file formats, diverse file content, data scattered <strong>in</strong> several relationalfiles, etc.) results <strong>in</strong> a demand<strong>in</strong>g and lengthy process of captur<strong>in</strong>g a taxableperson’s data and then transferr<strong>in</strong>g and convert<strong>in</strong>g them onto the <strong>in</strong>spector’sPC. As for taxable persons, such <strong>in</strong>spection may also mean a significant workloadand a heavy f<strong>in</strong>ancial burden, because it requires them to provide theirelectronic records <strong>in</strong> the form and manner requested by the tax <strong>in</strong>spector. In aneffort to solve this problem, some EU Member States and the OECD <strong>in</strong>troducednational standard audit files (Tax or SAF-T).Accord<strong>in</strong>g to the European Commission, the OECD and tax adm<strong>in</strong>istrations ofEU Member States, the latter is a file conta<strong>in</strong><strong>in</strong>g data exportable from an orig<strong>in</strong>alaccount<strong>in</strong>g system of the taxable person, for a specific time period andeasily readable by virtue of its standardisation of layout and format that can beused by revenue authority staff for compliance check<strong>in</strong>g purposes. With sucha file, fiscal control therefore becomes faster and more efficient, <strong>in</strong>corporat<strong>in</strong>gnew fiscal control methods such as statistical methods, sampl<strong>in</strong>g, audit automation,etc., whereas for taxable persons the whole process is simpler, <strong>in</strong>volv<strong>in</strong>gmore transparency, less time, cost and burden. Accord<strong>in</strong>gly, the content andform of the file are fixed and the same for all taxable persons, regardless oftheir size, characteristics or activity. Taxable persons are aware <strong>in</strong> advance ofthe <strong>in</strong>formation requested by the tax adm<strong>in</strong>istration for control and have alreadyequipped their account<strong>in</strong>g software with the <strong>in</strong>terface for export<strong>in</strong>g such<strong>in</strong>formation <strong>in</strong> the content and form required.95
COMPUTER-ASSISTED TAX INSPECTION AND STANDARD AUDIT FILESIn 2007, Slovenia became the fourth EU Member State to <strong>in</strong>troduce the standardaudit file, after the Netherlands, Great Brita<strong>in</strong> and Germany. Later thatyear, Portugal followed, while Austria is plann<strong>in</strong>g to do the same <strong>in</strong> <strong>2009</strong>, withsome Member States us<strong>in</strong>g <strong>in</strong>formal standard requests for submission of data.As early as <strong>in</strong> 2005, the OECD adopted recommendations for implementationof the standard audit file (SAF-T).2.5 UPGRADING COMPUTER-ASSISTED INSPECTION AT DURS: INTRO-DUCING THE STANDARD AUDIT FILEDURS <strong>in</strong>corporated the “Slovene Standard Tax Audit File” <strong>in</strong>to tax <strong>in</strong>spectionprocedures with the Rules on the Content, Format, Method of Draw<strong>in</strong>g-up andTime Periods for Presentation of Readout of Data from Electronically GuidedBus<strong>in</strong>ess Books and Records of Taxable Person (Ul. l. RS, Nos 59/07; 126/07,here<strong>in</strong>after: Rules). In accordance with the Rules, applied s<strong>in</strong>ce 1 January 2008,taxable persons that process their data electronically shall at the request of thetax authority <strong>in</strong> the tax control procedure submit records <strong>in</strong> structured computerfiles <strong>in</strong> the content, form and manner specified <strong>in</strong> the Annex, which is an<strong>in</strong>tegral part of the Rules. They must submit the follow<strong>in</strong>g records from electronicbooks of account and records:— records from the general ledger (general ledger data)— record of VAT deducted (data on deductible VAT)— record of VAT charged (data on VAT charged)Based on the Rules, taxable persons must, dur<strong>in</strong>g the fiscal control procedure,also provide other records whose content and form are not specified by theRules (e.g. cash register data, data on account<strong>in</strong>g related to <strong>good</strong>s, current accountbooks, etc.). Taxable persons must submit the records with<strong>in</strong> three work<strong>in</strong>gdays, with the possibility of extend<strong>in</strong>g this period to a maximum of fivework<strong>in</strong>g days. Taxable persons that do not provide records of the content and<strong>in</strong> the form determ<strong>in</strong>ed by the Rules must at the tax authority’s request for submissionof records notify the latter of the records they can provide; such recordsare deemed to be suitable if they conta<strong>in</strong> at least the content prescribedby the Rules.The Annex to the Rules gives a detailed description of the form and format ofeach of the three files (records from the general ledger.txt, records from VATdeducted.txt, records from VAT charged.txt). The files requested are <strong>in</strong> textualformat, and have a fixed length and semicolons to separate <strong>in</strong>dividual fields.The data are submitted to the tax authority’s official on a standard storage device.The Annex to the Rules sets out <strong>in</strong> detail the follow<strong>in</strong>g for each file: file96
RAJKO HADJARstructure (field head<strong>in</strong>g, abbreviated field head<strong>in</strong>g, field beg<strong>in</strong>n<strong>in</strong>g, field end,length, type), file content, time period of the record, field content and otherdata.The general ledger file covers the calendar or f<strong>in</strong>ancial year, whereas the VATdeduction and VAT charged files are for the calendar year. If at the request ofthe tax authority the taxable person submits records from the general ledger<strong>in</strong> the current calendar or f<strong>in</strong>ancial year, such records must consist of data forthe previous three-month, six-month or n<strong>in</strong>e-month period. If at the requestof the tax authority the taxable person submits records of VAT deductions orVAT charged <strong>in</strong> the current calendar year, such records conta<strong>in</strong> the data of thetax periods of the calendar year for which tax returns have already been submittedto the tax authority. Under such provisions, the tax authority can obta<strong>in</strong>the files as soon as it detects possible irregularities (e.g. <strong>in</strong> tax return controls)and perform a tax <strong>in</strong>spection. The general ledger file is used to store the dataconta<strong>in</strong>ed <strong>in</strong> the general ledger as def<strong>in</strong>ed <strong>in</strong> the Slovene Account<strong>in</strong>g Standardsor the International Account<strong>in</strong>g Standards: records of the complete databasewith <strong>in</strong>dividual account<strong>in</strong>g events that affect assets and liabilities, revenues andexpenditures stated by <strong>in</strong>dividual breakdown accounts as well as records ofoff-balance-sheet items. The VAT deduction file comprises data on deductibleVAT, as shown <strong>in</strong> appropriate documents. The VAT charged file <strong>in</strong>cludes dataon VAT charged, as shown <strong>in</strong> appropriate documents.In compil<strong>in</strong>g the Rules or <strong>in</strong>troduc<strong>in</strong>g the Slovene standard audit file, DURSdrew on European Commission documents, the experience of other EU MemberStates, OECD documents, its own experience <strong>in</strong> ACL-assisted <strong>in</strong>spectionfrom 2000 to 2007, agreements made with the biggest Slovene account<strong>in</strong>g softwareproducers/traders, the specific nature of the ACL tool, the provisions ofZdavP-2, ZDS-1, SRS, ZGD-1. ZDDV-1 and the ancillary Rules, the s<strong>in</strong>gle procedurefor taxable persons used by DURS <strong>in</strong> the case of electronic data submission,and the DURS system of expert assistance for taxable persons dur<strong>in</strong>g thetransitional period from adoption until entry <strong>in</strong>to force of the Rules.The dispositions of the Rules and the standard audit file have had the follow<strong>in</strong>geffects:— For taxable persons, their obligations have not been expanded with the pass<strong>in</strong>gof the new Rules, consider<strong>in</strong>g that they already had to submit electronic data<strong>in</strong> the control procedure before the Rules were adopted. What did change isthat they are now be<strong>in</strong>g <strong>in</strong>formed beforehand of the content and form of thedata to be provided to the tax authority.— All the <strong>in</strong>formation prescribed by the Rules already exists <strong>in</strong> the electronicbooks of account and records of taxable persons, which means that they only97
COMPUTER-ASSISTED TAX INSPECTION AND STANDARD AUDIT FILEShave to arrange their account<strong>in</strong>g software so as to enable the extraction ofsuch <strong>in</strong>formation <strong>in</strong>to the prescribed files. They therefore had to equip theirsoftware with data extraction accord<strong>in</strong>g to the “press-one-button” pr<strong>in</strong>ciple(where data can by exported by the taxable person alone us<strong>in</strong>g a simplecommand from the program menu without the need for a computer expert)due to the short time span between the tax authority’s request and the filebe<strong>in</strong>g submitted (3 work<strong>in</strong>g days).— The prescribed file format is a textual format of fixed and precisely def<strong>in</strong>edlength, us<strong>in</strong>g a semicolon to separate columns, which is frequently used <strong>in</strong>Slovenia, with the majority of account<strong>in</strong>g software enabl<strong>in</strong>g data export tothis format. The file also determ<strong>in</strong>es a s<strong>in</strong>gle record<strong>in</strong>g of date and value, andalso specifies left or right alignment of records for each column. Such a formatand form of the file enable simple export and def<strong>in</strong>ition with ACL software.— The content of the columns of the deductible VAT and VAT charged filesis consistent with the provisions of ZDDV-1, the ancillary Rules and the taxreturn form.— The files are thematically <strong>in</strong>terconnected, which makes the VAT deductedand VAT charged files analytical records of the general ledger because theyconta<strong>in</strong> every <strong>in</strong>voice received and issued.— The prescribed files will be used for fiscal control of all types of taxes andconta<strong>in</strong> the basic <strong>in</strong>formation needed to check the accuracy of tax returns.S<strong>in</strong>ce the files cannot <strong>in</strong>clude all analytic tax data, <strong>in</strong> some fiscal controlprocedures taxable persons will have to provide additional electronic data(e.g. data from electronic cash registers, supply records, data from currentaccount books, on transactions via transaction accounts, etc.).— The Rules set out the content, form and format of the file; however, taxablepersons may also submit another file which must conta<strong>in</strong> at least the contentprescribed.— The required amount of data for each file is the m<strong>in</strong>imum required for tax<strong>in</strong>spection. All of the three files have an extra column added, which canbe formatted by the taxable person and filled with <strong>in</strong>formation specify<strong>in</strong>gbus<strong>in</strong>ess events from fiscal and other perspectives accord<strong>in</strong>g to the taxableperson <strong>in</strong> each case. This gives the files the possibility of multiple use, e.g. forthe taxable person’s bus<strong>in</strong>ess needs, <strong>in</strong>ternal audit, external audit, etc. They canalso be utilised by other supervisory <strong>in</strong>stitutions <strong>in</strong> the Re<strong>public</strong> of Slovenia,such as the Court of Audit, the Customs Adm<strong>in</strong>istration of the Re<strong>public</strong> ofSlovenia, the Securities Market Agency, the Insurance Supervision Agency,etc. By <strong>in</strong>troduc<strong>in</strong>g the file, DURS has been contribut<strong>in</strong>g to the developmentand improvement of the audit sector as a whole.— The Rules and the standard audit file will therefore help make fiscal controlmore efficient and simple.98
RAJKO HADJAR— As far as taxable persons are concerned, the Rules and the standard audit filemean fiscal control that is simpler, more transparent, quicker, cheaper andless burdensome.Below is an example of the prescribed content and form of the VAT deductedfile.Ref.No.ItemsfromItems toLengthFieldtypeField head<strong>in</strong>g and descriptionAbbreviatedfield head<strong>in</strong>g1 1 4 4 N Tax Period Obd16 272 287 16 N17 289 304 16 N18 306 321 16 NDeductible VAT at therate of 20% (right aligned -999999999999.99)Deductible VAT at the rateof 8.5% (right aligned -999999999999.99)4% flat-rate compensation (rightaligned -999999999999.99)VST 20% DDVVST 8,5% DDVPavnadomestiloFigure 3: Tabular presentation of the form and content of the files conta<strong>in</strong><strong>in</strong>grecords of VAT deductionsThe file is fully consistent with the value added tax return form; the sums of<strong>in</strong>dividual columns are therefore identical to the amounts of the tax returnitems.Figure 4: Part of the value added tax return formThe ACL software allows the capture of such a file of the taxable person andthen, us<strong>in</strong>g a simple command, add<strong>in</strong>g up all tax return items for the calendaryear and compar<strong>in</strong>g the sum of the file with the tax returns actually submitted.99
COMPUTER-ASSISTED TAX INSPECTION AND STANDARD AUDIT FILESFigure 5: Example of the sum of the deductible VAT for all VAT tax returns<strong>in</strong> 2008 <strong>in</strong> the ACL software2.6 INTRODUCING ACL-ASSISTED INSPECTION OF STANDARD AUDITFILESIn 2000, DURS obta<strong>in</strong>ed its first ACL licence and carried out the first ACL-assistedcontrol. Based on practical experience <strong>in</strong> the <strong>in</strong>itial ACL-assisted controls,the first ACL <strong>in</strong>spection methodology was developed. Along with the acquisitionof new ACL licences, DURS began with tra<strong>in</strong><strong>in</strong>g programmes for its<strong>in</strong>spectors, while <strong>in</strong> 2004 new legislation was passed so as to align computerassisted<strong>in</strong>spection with the guidel<strong>in</strong>es and recommendations of the EU. ACLassisted<strong>in</strong>spection eventually became the standard method of <strong>in</strong>spection. Asof <strong>2009</strong>, DURS has 130 ACL licences and the same number of <strong>in</strong>spectors whohave undergone tra<strong>in</strong><strong>in</strong>g <strong>in</strong> ACL software.In 2007, <strong>in</strong> order to improve the efficiency and speed of computer-assisted tax<strong>in</strong>spection with ACL, a decision was made to <strong>in</strong>troduce the standard audit fileat DURS. By 2007, DURS had ga<strong>in</strong>ed sufficient experience and knowledge <strong>in</strong>ACL-assisted control procedures, which made it well aware of the appropriatecontent and structure of such a file. At the same time, it knew that taxable personswould not have major problems or extra cost <strong>in</strong> provid<strong>in</strong>g it. The standardaudit file became part of the tax <strong>in</strong>spection procedure on 1 January 2008.Dur<strong>in</strong>g the <strong>in</strong>troduction phase of the standard audit file, the follow<strong>in</strong>g activitieswere carried out:— The amount of ACL licences acquired was enough to cover 30 percent of all tax<strong>in</strong>spectors, this be<strong>in</strong>g an <strong>in</strong>formal EU rule regard<strong>in</strong>g the m<strong>in</strong>imum technicalconditions required for the computer-assisted tax <strong>in</strong>spection systems ofMember States to be efficient.100
RAJKO HADJAR— In 2008, there were 10 <strong>in</strong>ternal tra<strong>in</strong><strong>in</strong>g workshops on the use of ACL software,<strong>in</strong> particular the standard audit file, which <strong>in</strong>volved over 150 <strong>in</strong>spectors.— In 2008, DURS produced two methodological manuals: PRIROČNIK ZAINŠPICIRANJE GLAVNE KNJIGE Z UPORABO PROGRAMA ACL (ver. 9.0)(<strong>in</strong>spection of general ledgers with ACL software) and PRIROČNIK ZAINŠPICIRANJE DAVKA NA DODANO VREDNOST Z UPORABO PROGRAMAACL (ver. 9.0) (<strong>in</strong>spection of value added tax with ACL software). The Annexesto the manuals also <strong>in</strong>cluded test files <strong>in</strong> a form consistent with the Rules. Themanuals are <strong>in</strong>tended for self-education of <strong>in</strong>spectors and are designed sothat the <strong>in</strong>spector performs tax <strong>in</strong>spection with test files by learn<strong>in</strong>g how touse ACL software and performs <strong>in</strong>spection with the standard files. They liststandard check<strong>in</strong>g procedures required <strong>in</strong> every control, which representsthe first step towards automatic <strong>in</strong>spection.— Inspectors had the possibility to rely on direct assistance or counsell<strong>in</strong>g <strong>in</strong>the use of ACL and the standard audit file, either by telephone or email, oreven with personal assistance <strong>in</strong> complicated cases (by a computer expert, ifneeded).— Inspectors constantly received electronic data from the DURS records whichthey completed or compared with the electronic data of taxable persons.— New <strong>in</strong>spection methods began to emerge, enabled by the standard audit file,e.g. audit automation with script files.In order to provide taxable persons with <strong>in</strong>formation on the <strong>in</strong>troduction ofthe standard audit file, the follow<strong>in</strong>g activities were carried out:— A meet<strong>in</strong>g was held <strong>in</strong>volv<strong>in</strong>g the biggest producers/traders of account<strong>in</strong>gsoftware <strong>in</strong> the Re<strong>public</strong> of Slovenia and experts.— Dur<strong>in</strong>g the process of <strong>in</strong>troduc<strong>in</strong>g the standard audit file and afterwards, all theproducers/traders of account<strong>in</strong>g software had the possibility of counsell<strong>in</strong>gby DURS (by telephone or email) and test<strong>in</strong>g their test files.— The DURS website updated taxable persons and experts beforehand on the<strong>in</strong>troduction of the standard audit file.— Several expert <strong>public</strong>ations published notices and articles by DURS on thenew standard audit file.— Some tax offices (e.g. the Special Tax Office) <strong>in</strong>formed their taxable personsof the standard audit file be<strong>in</strong>g <strong>in</strong>troduced by direct mail.All of these activities contributed considerably to the positive outcome of theproject as well as successful use of the standard audit file <strong>in</strong> practice: <strong>in</strong> 2008,for example, no major problems were reported, neither by taxable persons thathad to provide such files nor <strong>in</strong>spectors who used the latter for tax <strong>in</strong>spection.In 2008, DURS carried out 2066 <strong>in</strong>spection procedures with ACL software, 201of which were tax <strong>in</strong>spections, and 1865 data reviews <strong>in</strong> accordance with Article101
COMPUTER-ASSISTED TAX INSPECTION AND STANDARD AUDIT FILES39 of the ZdavP-2 (verification of the data needed for collect<strong>in</strong>g taxes). All theverifications were performed on standard audit files. In 2008, 100 ACL licenceswere used for the purpose of <strong>in</strong>spection procedures, whereas ACL softwarewas used for <strong>in</strong>spection procedures by more than 140 <strong>in</strong>spectors. A s<strong>in</strong>gle ACLlicence accounted for, on average, 20 <strong>in</strong>spection procedures.2.7 FUNCTIONALITY AND USE OF COMPUTER-ASSISTED INSPECTIONIN PRACTICEComputer-assisted tax <strong>in</strong>spection with ACL software on standard audit files enablesthe follow<strong>in</strong>g functionalities to be put <strong>in</strong>to practice:1. Standard verifications: verifications that can be performed <strong>in</strong> the case of everytaxable person, regardless of the entity’s size, activity or other characteristics.Standard verifications therefore enable a certa<strong>in</strong> degree of automation.Accord<strong>in</strong>g to the source of the data obta<strong>in</strong>ed, they can be divided <strong>in</strong>to twogroups:a) verifications of the taxable person’s data, andb) verifications of the taxable person’s data based on DURS data.2. Specific verifications: verifications carried out on the basis of any specificdata characteristics, and are not standardised or foreseen <strong>in</strong> advance.Below are examples of standard verifications <strong>in</strong> the case of the VAT deductionfile:a) SUMS OF THE VAT DEDUCTED FOR INDIVIDUAL TAX PERIODSWith the ACL software, it is possible to, by us<strong>in</strong>g the VAT deducted file, totalthe documents received on the basis of which the taxable person claimsdeductible VAT and thus verify the entity’s tax returns.b) VERIFYING THE DEDUCTION OF INPUT VAT FROM SUPPLIERS IN THECASE OF WHICH THE TAXABLE PERSON NORMALLY DOES NOT HAVETHE RIGHT OF DEDUCTION – SEPARATING POTENTIALLY “SUSPICIOUS”SUPPLIERSACL classifies all the taxable person’s suppliers and tries to elim<strong>in</strong>ate thosefrom which VAT has been deducted where the name of the supplier and othercircumstances provide reason to believe that such cases <strong>in</strong>volve <strong>good</strong>s andservices from which the taxable person (consider<strong>in</strong>g its activity and othercircumstances) does not have the right of VAT deduction. Such suppliers arefound and s<strong>in</strong>gled out with the help of filters <strong>in</strong>corporated <strong>in</strong> ACL.102
RAJKO HADJARc) SEPARATING RECORDS OF THE HIGHEST VALUEInvoices received <strong>in</strong> which VAT has been deducted are sorted with ACL bysize from the highest amount to the lowest, and those with the highest sumsare verified. A simple procedure therefore enables separat<strong>in</strong>g from an array ofrecords or <strong>in</strong>voices those of the greatest weight or tax risk, which is followedby their verification. This puts the focus on the essential items of the tax returnand contributes considerably to shorten<strong>in</strong>g the search for documents of thehighest value from the fiscal po<strong>in</strong>t of view.d) VERIFYING SIMULTANEOUS CHARGING AND DEDUCTING OF VATIn cases of self-assessment (e.g. acquisitions from other Member States), ACLhelps to verify whether, <strong>in</strong> any of the <strong>in</strong>voices used to claim a VAT deduction,VAT has been previously charged and or has been charged <strong>in</strong> the sameamount. ACL creates a relation between the VAT charged and the deductibleVAT, and f<strong>in</strong>ds the differences.e) VERIFYING MULTIPLE DEDUCTION OF INPUT VAT BASED ON THE SAMEINVOICEThe analysis tools <strong>in</strong>tegrated <strong>in</strong>to ACL enable verification of whether thedeductible VAT was deducted two or more times based on the same <strong>in</strong>voice,which clearly constitutes an anomaly.f) VERIFYING THE PERIOD OF CLAIMING DEDUCTIBLE VATACL is used to verify whether VAT was deducted <strong>in</strong> the right tax period or tocheck for other irregularities related to the date of the document, of receipt orof post<strong>in</strong>g the document.g) VERIFYING THE AMOUNT OF DEDUCTIBLE VAT ACCORDING TO THE TAXBASEACL is used to verify whether the amounts of deductible VAT at the 20 or8.5 percent rate are correct accord<strong>in</strong>g to the tax base. The cases of <strong>in</strong>correctamounts of VAT accord<strong>in</strong>g to the tax base can be s<strong>in</strong>gled out.h) VERIFYING VAT DEDUCTIONS AFTER RECEIVING INVOICES FROMSUPPLIERS NOT LIABLE FOR VATWith ACL, the taxable person’s data are completed with those of DURS (<strong>in</strong>electronic form as well): on the basis of both, an attempt is made to elim<strong>in</strong>atethe potentially “suspicious” suppliers or discover cases of VAT deduction<strong>in</strong> breach of ZDDV-1. The taxable person’s data on suppliers from which itdeducted VAT are completed with the data that DURS has on liability for VAT(start of registration, end of registration and number of employees per certa<strong>in</strong>103
COMPUTER-ASSISTED TAX INSPECTION AND STANDARD AUDIT FILESmonth). The filters are used to separate the received <strong>in</strong>voices from suppliersthat are not liable for VAT but showed it nonetheless, while the taxable persondeducted it as <strong>in</strong>put VAT, which aga<strong>in</strong> is a clear anomaly.i) SEARCHING POTENTIAL “MISSING TRADERS” OF THE TAXABLE PERSONUNDER INSPECTIONBased on DURS data comb<strong>in</strong>ed with the taxable person’s data, it is possibleto s<strong>in</strong>gle out those suppliers of the taxable person under <strong>in</strong>spection thataccord<strong>in</strong>g to certa<strong>in</strong> criteria can be seen as potentially “suspicious”, whichmeans they could act as suppliers known as “miss<strong>in</strong>g traders”:— newly registered persons liable for VAT (registered for <strong>in</strong>stance 30 or 60days prior to the issu<strong>in</strong>g of the <strong>in</strong>voice), hav<strong>in</strong>g issued to the taxable personunder <strong>in</strong>spection <strong>in</strong>voices <strong>in</strong> a high amount with VAT charged;— persons liable for VAT without any employees, hav<strong>in</strong>g issued to the taxableperson under <strong>in</strong>spection an <strong>in</strong>voice <strong>in</strong> a high amount with VAT charged;— the supplier has already been listed by DURS under “miss<strong>in</strong>g trader”bus<strong>in</strong>esses and has issued to the taxable person an <strong>in</strong>voice with VATcharged.Such criteria are used by all EU Member States as risk criteria for taxablepersons’ suppliers, to whom particular attention is paid <strong>in</strong> verification and<strong>in</strong>spection procedures.The examples outl<strong>in</strong>ed above are only a few of the cases of standard verificationwhich can be carried out on any taxable person, regardless of its size, activityor other characteristics. In order for such verifications to be efficient, i.e. automatic,they require standard audit files. In 2008, DURS performed 1865 dataverifications on standard audit files by us<strong>in</strong>g ACL, which ma<strong>in</strong>ly <strong>in</strong>cluded electronicVAT deduction records <strong>in</strong> order to discover whether the taxable personhad done bus<strong>in</strong>ess with “miss<strong>in</strong>g trader” suppliers or other suppliers of high fiscalrisk. The <strong>in</strong>spectors completed taxable persons’ electronic VAT deductionrecords with the <strong>in</strong>formation conta<strong>in</strong>ed <strong>in</strong> official DURS records (registrationof VAT, number of the supplier’s employees, etc.) and, with tools <strong>in</strong>tegrated<strong>in</strong>to ACL, quickly and simply s<strong>in</strong>gled out the largest <strong>in</strong>voices received <strong>in</strong> thetax period and the <strong>in</strong>voices received from suppliers potentially related to fiscalrisk. S<strong>in</strong>ce taxable persons have to provide such files for the tax periods of thecalendar year for which tax returns were already submitted to the tax authority,the latter can perform <strong>in</strong>spections with ACL even prior to refund<strong>in</strong>g the VATdeduction to the taxable person and therefore immediately detect any irregularitiesand not return VAT improperly deducted. ACL-assisted verifications enableexam<strong>in</strong>ation, us<strong>in</strong>g the above criteria, of all the data of taxable persons,104
RAJKO HADJAReven if their amount is substantial (from several hundreds to several millions),while the verifications themselves are extremely fast, transparent and detailed.2.8 RESULTS AND EFFECTS OF ACL-ASSISTED INSPECTIONThe ma<strong>in</strong> advantages of <strong>in</strong>troduc<strong>in</strong>g the standard audit file <strong>in</strong>to computer-assistedtax <strong>in</strong>spection are the follow<strong>in</strong>g:— the content and form of the file are set <strong>in</strong> advance and the same for all taxablepersons, regardless of their size, characteristics or activity, which meansless confusion for both the taxable person and DURS as to the type of filerequested: this <strong>in</strong> turn facilitates and simplifies the submission of account<strong>in</strong>gdata and tax records <strong>in</strong> the control procedure;— the standard file leads to simpler and quicker submission of data to the taxauthority, and quick and efficient verification on the part of the tax authority,which reduces the length of control and the burden on taxable persons,<strong>in</strong>creases the efficiency of tax <strong>in</strong>spectors and allows tax evasion to be revealedbefore any damage may occur (e.g. undue VAT refund);— the standard file also enables audit automation, which is the common term forvarious computer-assisted techniques aimed at automation of certa<strong>in</strong> capture,analysis and verification operations of taxable persons’ data, which shortensthe time of <strong>in</strong>spection, reduces errors <strong>in</strong> <strong>in</strong>spection and the fiscal risk of<strong>in</strong>spection, saves taxable persons’ time and money, etc.DURS has been carry<strong>in</strong>g out <strong>in</strong>spections with the help of ACL s<strong>in</strong>ce 2000, andhas <strong>in</strong> the last five years achieved the follow<strong>in</strong>g results <strong>in</strong> this area:2004 2005 2006 2007 2008Number of ACL licences 27 49 101 99 101Number of verifications performed withthe use of ACLNumber of data verifications carried outpursuant to Article 39 of ZdavP-2 with ACLNumber of <strong>in</strong>spectors hav<strong>in</strong>g performedverification92 90 282 243 201– – – – 186540 41 125 121 139The table shows a yearly <strong>in</strong>crease <strong>in</strong> the number of <strong>in</strong>spections with ACL as wellas <strong>in</strong> the number of <strong>in</strong>spectors perform<strong>in</strong>g verifications with ACL. The <strong>in</strong>troductionof the standard audit file <strong>in</strong> 2008 opened the way for fast data verificationswith ACL, due to all files be<strong>in</strong>g standardised and therefore the same forall taxable persons, regardless of their size and activities: as such, they can beobta<strong>in</strong>ed and verified by <strong>in</strong>spectors <strong>in</strong> a short period of time. In 2008, this led105
COMPUTER-ASSISTED TAX INSPECTION AND STANDARD AUDIT FILESto 1865 such verifications with ACL on standard audit files which had not beenperformed by DURS <strong>in</strong> previous years. Based on experience <strong>in</strong> tax <strong>in</strong>spection<strong>in</strong> 2008 and <strong>2009</strong>, and on the data concern<strong>in</strong>g standard software and account<strong>in</strong>gsoftware, it is estimated by DURS that 80 to 90 percent of taxable personsprovide the exact file required, us<strong>in</strong>g the “press-one-button” pr<strong>in</strong>ciple, whichallows the taxable person to export data via a simple command from the programmenu without the help of a computer expert: this proves that the file hasbeen successfully <strong>in</strong>troduced.Apart from verify<strong>in</strong>g standard audit files, between 2008 and <strong>2009</strong> ACL softwarewas also used for the follow<strong>in</strong>g verifications:— verifications of various data of taxable persons <strong>in</strong> electronic form (supplyrecords, current books of account, diverse analytical records, etc.);— verify<strong>in</strong>g the data from electronic cash registers;— acquisition and analysis of electronic data of banks and sav<strong>in</strong>gs <strong>in</strong>stitutions,related to transactions carried out by taxable persons under <strong>in</strong>spection ontransaction accounts, us<strong>in</strong>g the tools <strong>in</strong>corporated <strong>in</strong> ACL to analyse ands<strong>in</strong>gle out potentially risky money transactions.Integrat<strong>in</strong>g the standard audit file <strong>in</strong>to control procedures has lead to the follow<strong>in</strong>geffects:— <strong>in</strong>creased quality of <strong>in</strong>spection, reduced audit risk;— <strong>in</strong>troduction of new <strong>in</strong>spection methods (audit automation, add<strong>in</strong>g data fromofficial DURS records to the data of the taxable person, statistical analysis,sampl<strong>in</strong>g, etc.);— <strong>in</strong>creased speed of <strong>in</strong>spection, possibility of swift reaction to detected irregularities;— better efficiency of tax collection;— better efficiency, satisfaction and reduced burden on the part of <strong>in</strong>spectors;— reduced costs and burdens on taxable persons and their <strong>in</strong>creased satisfaction;— standard audit files are also used for <strong>in</strong>ternal and external audits;— the use of computer-assisted <strong>in</strong>spection and standard audit files means achiev<strong>in</strong>gimportant strategic objectives of DURS as far as control is concerned;— permanent quality of DURS’s work <strong>in</strong> the field of <strong>in</strong>spection (use of the latest<strong>in</strong>spection methods);— improved quality of the entire audit and <strong>in</strong>spection sector of the Re<strong>public</strong> ofSlovenia.106
RAJKO HADJAR3 SPECIAL ACHIEVEMENTS OF DURS IN THE FIELD OFCOMPUTER-ASSISTED TAX INSPECTIONIn <strong>in</strong>troduc<strong>in</strong>g computer-assisted tax <strong>in</strong>spection and the Slovene standard auditfile, the special achievements of DURS <strong>in</strong> the field should be noted:— DURS fully <strong>in</strong>dependently <strong>in</strong>corporated computer-assisted tax <strong>in</strong>spectionwith ACL software <strong>in</strong>to <strong>in</strong>spection procedures;— <strong>in</strong> 2000, DURS obta<strong>in</strong>ed its first ACL license and also performed the first<strong>in</strong>spection control <strong>in</strong> that year; it currently has more than 130 licenses, over 150<strong>in</strong>spectors tra<strong>in</strong>ed to use ACL software and a systemised methodology; DURStra<strong>in</strong>s <strong>in</strong>spectors by itself and provides support, and has also been alone <strong>in</strong>draw<strong>in</strong>g up the relevant legislation and harmonis<strong>in</strong>g it with the requirementsand recommendations of the European Commission;— <strong>in</strong> 2004, Slovenia was the only new EU Member State to use computer-assistedtax <strong>in</strong>spection;— apart from the purchase of ACL licences, DURS did not spend any additionalresources for <strong>in</strong>troduc<strong>in</strong>g computer-assisted <strong>in</strong>spection (<strong>in</strong> other new EUMember States, the costs of hir<strong>in</strong>g external advisors amounted to severalmillion euros);— DURS has been conduct<strong>in</strong>g its own ACL tra<strong>in</strong><strong>in</strong>g, with over 50 ACL workshoporganised by 2008, which <strong>in</strong>volved more that 250 <strong>in</strong>spectors (participat<strong>in</strong>gonce or several times);— until <strong>2009</strong>, the ACL licence versions were constantly updated so that DURScurrently works with the latest version, ACL 9, for which it has developed itsmethodology of use;— DURS set up by itself the methodology for computer-assisted tax <strong>in</strong>spection,focus<strong>in</strong>g on the standard audit file;— Slovenia is one of the first EU Member States to <strong>in</strong>troduce the standard auditfile;— DURS has been actively <strong>in</strong>volved <strong>in</strong> the European Commission’s projectFISCALIS E-AUDIT PROJECT GROUP, which aims at sett<strong>in</strong>g up commonstandards of computer-assisted <strong>in</strong>spection <strong>in</strong> Member States;— <strong>in</strong> computer-assisted <strong>in</strong>spection among EU Member States, SLOVENIA andDURS are recognised for their efficiency and creativity.4 SUMMARYIn carry<strong>in</strong>g out tax <strong>in</strong>spection of electronic books of account and records oftaxable persons, the Tax Adm<strong>in</strong>istration of the Re<strong>public</strong> of Slovenia (DURS)has also been us<strong>in</strong>g the method of computer-assisted tax <strong>in</strong>spection with ACLsoftware (Audit Command Language). In <strong>in</strong>spections with ACL software, the107
COMPUTER-ASSISTED TAX INSPECTION AND STANDARD AUDIT FILES<strong>in</strong>spector captures data from the taxable person (general ledger, records of deductibleVAT, records of VAT charged, data from electronic cash registers, supplyrecords, <strong>good</strong>s records, etc.) <strong>in</strong> electronic form and transfers them to his orher PC for further process<strong>in</strong>g. The data capture is followed by conversion <strong>in</strong>toACL files (def<strong>in</strong>ition of logical properties of the file, def<strong>in</strong>ition of fields, deletionof surplus data, etc.) which are used for analysis and verification with thecommands and tools <strong>in</strong>tegrated <strong>in</strong>to ACL (separation of records of the highestvalue, data addition, data classification, search for duplication and miss<strong>in</strong>g data<strong>in</strong> a series of records, logical reviews, mathematical analysis, statistical analysis,etc.); ACL also enables quick and simple comparison of the data of the personunder <strong>in</strong>spection with DURS or other official data. With computer-assisted tax<strong>in</strong>spection, fiscal control becomes faster and more efficient, <strong>in</strong>corporat<strong>in</strong>g newfiscal control methods such as statistical methods, sampl<strong>in</strong>g, audit automation,etc., whereas for taxable persons, the whole process is simpler, more transparent,faster, and less costly and burdensome.In 2008, DURS upgraded the method of computer-assisted <strong>in</strong>spection by <strong>in</strong>troduc<strong>in</strong>gthe Slovene standard audit file, i.e. a file which conta<strong>in</strong>s data exportablefrom an orig<strong>in</strong>al account<strong>in</strong>g system of the taxable person, for a specific timeperiod and easily readable by virtue of its standardisation of layout and formatthat can be used by DURS staff for compliance check<strong>in</strong>g purposes. This fileeven further facilitates computer-assisted tax <strong>in</strong>spection with the content andform of the file set <strong>in</strong> advance and the same for all taxable persons, regardlessof their size, characteristics or activity. It consists of the general ledger recordfile, the deductible VAT file and VAT charged file. The standard audit file hasbeen successfully put <strong>in</strong>to practice: <strong>in</strong> 2008, <strong>in</strong> fact, there were no major problemsrecorded by taxable persons that had to provide such files, nor by <strong>in</strong>spectorswho used the files for tax <strong>in</strong>spection. The smooth transition was a result ofsupply<strong>in</strong>g ample <strong>in</strong>formation to taxable persons and cooperat<strong>in</strong>g with the producers/tradersof account<strong>in</strong>g software, as well as <strong>in</strong>tense tra<strong>in</strong><strong>in</strong>g of <strong>in</strong>spectorsand provid<strong>in</strong>g them with technical and other support. In 2008, DURS carriedout 2066 <strong>in</strong>spection procedures with ACL software, 201 of which were tax <strong>in</strong>spections,and 1865 data verifications <strong>in</strong> accordance with Article 39 of ZdavP-2(verification of the data needed for collect<strong>in</strong>g taxes); all data verifications werecarried out on standard audit files, a novelty <strong>in</strong> <strong>in</strong>spection procedures comparedto the previous years when there were no such verifications.REFERENCES1. Audit Automation Guidance Paper, European Commission, 20052. E-Audit RoadMap, European Commission, July 20053. ERP Systems Guidance Paper, European Commission, November 2005108
RAJKO HADJAR4 Guidance for the Standard Audit File – Tax, OECD, May 20055. Guidance on Tax Compliance for Bus<strong>in</strong>ess and Account<strong>in</strong>g Software, OECD, May20056. Netherlands Standard Audit File XML Schema7. PAS 76 Account<strong>in</strong>g software – Value Added Tax <strong>in</strong> the UK8. SCAT DOCUMENT 29, European Commission, 2 July 20019. SCAC DOCUMENT NO 330 REV 1, European Commission, September 2002109
ACHIEVING EFFICIENCY THROUGH RISKMANAGEMENTDarija MOHORIČ, MSc, Majda MEŠKO, MSc,Aleksandra STAMNIČAR VERONIK, Helena SAGAJLjutomer Adm<strong>in</strong>istrative Unitue.ljutomer@gov.si1 PROCESS APPROACH FOR BETTER EFFICIENCYStandard ISO 8402 def<strong>in</strong>es a process as “an <strong>in</strong>tegrated set of activities that usesresources to transform <strong>in</strong>puts <strong>in</strong>to outputs” (ISO 8402). Marolt and Gomišček(2005:15) say that a process approach has been created as a response to newdemands of globalized markets, to improve certa<strong>in</strong> elements that enhance theefficiency and effectiveness of management, such as: <strong>in</strong>creased customer satisfaction,<strong>in</strong>clusion of staff <strong>in</strong> the process of improvements through teamwork,reduction of operational costs, <strong>in</strong>creas<strong>in</strong>g the staff expertise level, <strong>in</strong>creas<strong>in</strong>gthe general cultural level of staff, achiev<strong>in</strong>g optimum yield from resources used,<strong>in</strong>creased staff satisfaction, etc.VhodPROCES(»skupek medsebojnopove<strong>za</strong>nih ali v<strong>za</strong>jemnihaktivnosti«)VMESNI ALI KONČNIPROIZVOD(materialni izdelek,storitev, ...)IzhodFigure 1: Schematic presentation of the processSource: Spletni priročnik, 2004: 45In Ljutomer Adm<strong>in</strong>istrative Unit, too, we have analysed the processes with<strong>in</strong>the organisation and divided them <strong>in</strong>to two ma<strong>in</strong> groups:— key processes, and— support<strong>in</strong>g processes.Key processes add value to our services, enhance customer satisfaction and reflectthe mission statement of our organisation. They are the basis of our existence.The second set of processes, called support<strong>in</strong>g processes, do not add value
ACHIEVING EFFICIENCY THROUGH RISK MANAGEMENTto our services but are essential for the <strong>good</strong> operation of the organisation as awhole and allow for efficient and effective implementation of key processes. Theprocess approach is a way of improv<strong>in</strong>g the organisation’s quality managementsystem by identify<strong>in</strong>g and def<strong>in</strong><strong>in</strong>g key and support<strong>in</strong>g processes and by <strong>in</strong>tegrat<strong>in</strong>gthe needs of the customers <strong>in</strong>to the system (Strle Vidali, 2001:58).1.1 DEFINITION OF PROCESSESA process is def<strong>in</strong>ed by determ<strong>in</strong><strong>in</strong>g the follow<strong>in</strong>g elements: name, process guardian,<strong>in</strong>-house and external customers, and identify<strong>in</strong>g the customers’ needsand requirements The necessary <strong>in</strong>puts of the process and the outputs generatedas the result of the activities carried out are def<strong>in</strong>ed, as well as the timel<strong>in</strong>eof activities, and appropriate resources are ensured. It is also important todef<strong>in</strong>e the relationships of the process with other processes, to document theprocess and identify documents that def<strong>in</strong>e the process, set the criteria and themethods for efficient process management, and specify communication channelswith<strong>in</strong> the process.1.1.1 Identification of processes <strong>in</strong> Ljutomer Adm<strong>in</strong>istrative Unit and their <strong>in</strong>terrelationVodenjeNabavaF<strong>in</strong>anciranjeUpravnipostopekProcesses are def<strong>in</strong>ed and documented <strong>in</strong> the adm<strong>in</strong>istrative unit’s Quality Manual.Every process has a process guardian, responsible for ensur<strong>in</strong>g the effectivenessof the process and for establish<strong>in</strong>g relations between clients and pro-KomuniciranjeUpravljanjeodnosovs strankamiUpravljanjez<strong>za</strong>poslenimiFigure 2: Interactions and <strong>in</strong>terrelationsSource: Ljutomer Adm<strong>in</strong>istrative Unit’s Quality Manual112
DARIJA MOHORIČ MSC, MAJDA MEŠKO MSC, ALEKSANDRA STAMNIČAR VERONIK, HELENA SAGAJviders of services, irrespective of their position or department with<strong>in</strong> the unit.The process approach enables us to see the operation of the unit as a structuredsystem of <strong>in</strong>terrelated processes. Such an approach enables cont<strong>in</strong>ual monitor<strong>in</strong>gof <strong>in</strong>terrelations among process and, specifically, a management of processesthat generates results with<strong>in</strong> perimeters set <strong>in</strong> compliance with admissibilitycriteria. S<strong>in</strong>ce any process must be managed, it is possible to follow anyproblem to its very source, analyse its causes and prevent, through the use ofadequate corrective and preventive measures, its reoccurrence.1.1.2 Def<strong>in</strong>ition of processes and goals <strong>in</strong> a risk registerWhen def<strong>in</strong><strong>in</strong>g the goals of the adm<strong>in</strong>istrative unit and the relevant processesto create a risk register we referred to the unit’s Quality Manual <strong>in</strong> which boththe key process - the adm<strong>in</strong>istrative procedure - and support<strong>in</strong>g processes areidentified. Processes that are mutually complementary were merged and sevenprocesses that def<strong>in</strong>e the unit as a system were identified. For each process,goals on the basis of <strong>in</strong>ternal documents and our vision and mission statementswere identified.Table 1: Processes <strong>in</strong> the risk registerNO.PROCESSES1 Perform<strong>in</strong>g adm<strong>in</strong>istrative and related tasks2 Perform<strong>in</strong>g adm<strong>in</strong>istrative procedures3 Manag<strong>in</strong>g human resources4 Manag<strong>in</strong>g customers5 Manag<strong>in</strong>g f<strong>in</strong>ancial resources6 Manag<strong>in</strong>g material resources and the IT system7 LeadershipSource: Ljutomer Adm<strong>in</strong>istrative Unit Quality ManualGoals are achieved through the implementation of processes, procedures andactivities. The strategic goals of the Ljutomer Adm<strong>in</strong>istrative Unit are the follow<strong>in</strong>g:satisfied customers, satisfied staff, socially responsible and efficient work.The efficiency and effectiveness of the unit’s operation is assessed by means of<strong>in</strong>dicators, specific for each of the goals.1.2 QUALITY SYSTEMAn organisation that wishes to prove compliance with ISO 9001:2000 requirementsmust be able to provide evidence of the effectiveness of their qualitymanagement system. ISO 9000 requires that the organisation sets up and ma-113
ACHIEVING EFFICIENCY THROUGH RISK MANAGEMENT<strong>in</strong>ta<strong>in</strong>s process records of document and data management, <strong>in</strong>clud<strong>in</strong>g also allexternal documents. All elements of the ISO 9000 group of standards, as well asall requirements and provisions that an organisation has adopted <strong>in</strong> its qualitymanagement system, must be recorded systematically and orderly <strong>in</strong> the formof written rules, processes and <strong>in</strong>structions.2 DESCRIPTION OF THE PROPOSED SOLUTION – PRINCI-PLESS<strong>in</strong>ce 1999, when Ljutomer Adm<strong>in</strong>istrative Unit obta<strong>in</strong>ed the certificate of quality,the number of <strong>in</strong>ternal operational <strong>in</strong>structions (here<strong>in</strong>after IOI) has beenconstantly augmented. Currently, together with about 20 <strong>in</strong>ternal general <strong>in</strong>structionson the general operation of the unit, there are over 130 IOIs.Our goal was to elim<strong>in</strong>ate the majority of them. However, to be able to monitorand control the implementation of tasks, we replaced the IOIs by a common riskregister of 7 key processes that take place outside the unit. This new risk registerreplaced more than 130 different documents. As a result, the burden on staff hasbeen greatly dim<strong>in</strong>ished, and the unit’s management has been able to have a clearoverview of events that are likely to affect the achiev<strong>in</strong>g of the set goals.2.1 INNOVATIONA risk register is a key management tool and evidence that the managementis aware of its responsibility concern<strong>in</strong>g risk assessment and evaluation. Theaim of the register is to be a repository of all objectives, risks and controls,and to help identify and evaluate risks <strong>in</strong> management processes. In 2007, alladm<strong>in</strong>istrative units were required to set up f<strong>in</strong>ancial risk registers. LjutomerAdm<strong>in</strong>istrative Unit decided to make a step forward and to set up a risk registerfor seven processes that were identified as essential for the performance of ourprimary task – the adm<strong>in</strong>istrative procedure. When the risk register was launched<strong>in</strong> 2008, the Unit abolished 130 IOIs separately describ<strong>in</strong>g each activity. Inprepar<strong>in</strong>g and sett<strong>in</strong>g up the register we used the <strong>in</strong>ternal documents that hadbeen prepared for obta<strong>in</strong><strong>in</strong>g the quality certificate, which, over the years, havegrown out of proportion. In order to ensure the effectiveness of work processesand to achieve the set objectives, we identified <strong>in</strong> the risk register risksaccord<strong>in</strong>g to <strong>in</strong>dividual processes.Positive aspects:— achievement of goals is measured by objective criteria (measurable criteria),— enhanced ability to respond to <strong>in</strong>ternal and external changes and to controlthem,114
DARIJA MOHORIČ MSC, MAJDA MEŠKO MSC, ALEKSANDRA STAMNIČAR VERONIK, HELENA SAGAJ— more effective management of resources,— reduced likelihood of the occurrence of uncontrollable events,— greater probability that planned changes will be effectively carried out,— decision-mak<strong>in</strong>g is based on better <strong>in</strong>formation, there is less space for doubt,— major risk and changes <strong>in</strong> operation are given more attention,— the likelihood of achiev<strong>in</strong>g objectives is <strong>in</strong>creased.A risk register is a log of identified risks, listed by importance, place of occurrence,level and existence of <strong>in</strong>ternal control system by which risk may be controlledand managed <strong>in</strong> order to m<strong>in</strong>imise the possibility that objectives set <strong>in</strong>a particular field will not be achieved. A risk register is a s<strong>in</strong>gle document <strong>in</strong>which not only risks, but also risk controls and measures to manage risks arecomprehensively def<strong>in</strong>ed. An organisation can thus understand its comprehensiverisk profile, and achieve greater efficiency <strong>in</strong> risk management throughidentification of lead persons. It is a practical tool and shows that the managementis aware of its responsibility concern<strong>in</strong>g risk assessment and evaluation.<strong>in</strong> the broader context of achiev<strong>in</strong>g the Lisbon strategy objectives <strong>in</strong> terms ofwork organisation, implementation of tasks, assessment of the efficiency ofprocesses and seek<strong>in</strong>g improvements. Events identified <strong>in</strong> the register are thebasis for a circular process called risk management which, <strong>in</strong> turn, <strong>in</strong>creases theprobability that set objectives will actually be achieved.2.1.1 Abolition of IOIs and sett<strong>in</strong>g up a common risk registerS<strong>in</strong>ce the unit obta<strong>in</strong>ed the certificate of quality (1999), the number of <strong>in</strong>ternaloperational <strong>in</strong>structions has been constantly augmented. These documentswere <strong>in</strong>ternal <strong>in</strong>structions conta<strong>in</strong><strong>in</strong>g detailed descriptions of adm<strong>in</strong>istrativeprocedures. The first IOI was written when we were prepar<strong>in</strong>g to adopt theISO standard, but the number of IOIs has s<strong>in</strong>ce grown out of all proportions.They were, however, constantly ma<strong>in</strong>ta<strong>in</strong>ed, updated, revised etc. Togetherwith general <strong>in</strong>ternal <strong>in</strong>structions (GII) on the general operation of the unit,there were more than 130 IOIs. All members of staff were responsible for theirupdat<strong>in</strong>g and management.2.1.2 Other adm<strong>in</strong>istrative units had the same problemOf course, Ljutomer Adm<strong>in</strong>istrative Unit is not the only unit fight<strong>in</strong>g the problemof an excessive number of documents result<strong>in</strong>g from the adoption of theISO 9000 standard; other adm<strong>in</strong>istrative units are plagued by the same ailment,as <strong>in</strong>dicated by answers to a question we sent to the websites of all adm<strong>in</strong>istrativeunits <strong>in</strong> March 2008. We asked all adm<strong>in</strong>istrative units that have alreadyobta<strong>in</strong>ed the certificate of quality (the relevant data were obta<strong>in</strong>ed from theM<strong>in</strong>istry of Public Adm<strong>in</strong>istration website (13 March 2008). ). Most adm<strong>in</strong>istra-115
ACHIEVING EFFICIENCY THROUGH RISK MANAGEMENTtive units provided answers to the question of how many additional <strong>in</strong>ternaloperational and other <strong>in</strong>structions had been prepared s<strong>in</strong>ce the certificate wasobta<strong>in</strong>ed. In the table below are presented the answers of the five adm<strong>in</strong>istrativeunits with the highest number of IOIs.Table 2: Number of new IOIs <strong>in</strong> <strong>in</strong>dividual adm<strong>in</strong>istrative unitsADMINISTRATIVE UNIT No. of GIIs No of IOIsOrmož 5 318Maribor 29 317Ptuj 30 200Krško 15 152Ljutomer 37 136Source: Answers to the question of the number of new IOIs, March 2008.2.1.3 How we approached the problemThe management of the Ljutomer Adm<strong>in</strong>istrative Unit has been aware of theproblem of excessive number IOIs for some time and was seek<strong>in</strong>g a way to reducethem without compromis<strong>in</strong>g the efficiency and effectiveness of the unit’swork. It was also evident from the onset that the staff was not happy with theadditional work of prepar<strong>in</strong>g all those IOIs.A questionnaire was prepared with the purpose of obta<strong>in</strong><strong>in</strong>g <strong>in</strong>formation fromthe staff on the follow<strong>in</strong>g: when they used IOIs, how often they used them, howmuch time it took them to use IOIs, whether they use them <strong>in</strong> their everydaywork, whether they use them when they are seconded to another post, etc. Theaim of the research was to prove that IOIs were an unreasonable burden, andto use the results as a start<strong>in</strong>g po<strong>in</strong>t for modifications.2.2 RISK REGISTERThe first step <strong>in</strong> sett<strong>in</strong>g up a risk register was to identify the objectives <strong>in</strong>cluded<strong>in</strong> the register. The sources were certa<strong>in</strong> <strong>in</strong>dicators used <strong>in</strong> Ljutomer Adm<strong>in</strong>istrativeUnit to monitor the realisation of objectives. Other sources importantfor efficient risk management are reports on discont<strong>in</strong>uities <strong>in</strong> adm<strong>in</strong>istrativeprocedures, discont<strong>in</strong>uities <strong>in</strong> f<strong>in</strong>anc<strong>in</strong>g procedures, follow-up of decisions ofsecond-<strong>in</strong>stance bodies, results of <strong>in</strong>ternal and external audits, monthly barometerdata, results of staff satisfaction surveys, etc. The sources of <strong>in</strong>formationcan be an effective tool for identify<strong>in</strong>g risks, and also a <strong>good</strong> basis for measur<strong>in</strong>gthe effectiveness of risk management.116
DARIJA MOHORIČ MSC, MAJDA MEŠKO MSC, ALEKSANDRA STAMNIČAR VERONIK, HELENA SAGAJAn important element of risk management is the identification of the risk levelthat the adm<strong>in</strong>istrative unit is ready to accept before adopt<strong>in</strong>g measures to controlthe risk.2.2.1 Measurable criteriaWhen def<strong>in</strong><strong>in</strong>g measurable criteria, we focused on <strong>in</strong>dicators that help monitor<strong>in</strong>grealisation of the set objectives. We used as measurable criteria a range of<strong>in</strong>dicators, CAF and PRSPO (Slovenia’s award for bus<strong>in</strong>ess excellence) modelcriteria, adm<strong>in</strong>istrative statistics, the SPIS monitor<strong>in</strong>g application, half-yearlyand monthly reports, assessment analyses, etc.2.2.2 Identify<strong>in</strong>g riskWe identified risk <strong>in</strong> relation to two set objectives. We used an <strong>in</strong>tegrated approachand a clearly structured risk identification process. We identified processelements that are most vulnerable. We started with the strategic objectivesand cont<strong>in</strong>ued with operative objectives of the adm<strong>in</strong>istrative unit. Example:Manag<strong>in</strong>g human resources – recruitment. We knew that we had to focus oneach and every phase of the recruitment process. We established, for <strong>in</strong>stance,that risk may orig<strong>in</strong>ate <strong>in</strong> the lack and <strong>in</strong>adequacy of skills of the person responsiblefor recruitment (does he/she master his/her field of work, know relevantlegislation, is he/she unbiased, does he/she respect ethical pr<strong>in</strong>ciples , possessthe necessary personal <strong>in</strong>tegrity etc.). By means of measurable criteria (tra<strong>in</strong><strong>in</strong>gplan, tra<strong>in</strong><strong>in</strong>g reports and personal skills of the human resources manager), weestablished that the likelihood of serous consequences was m<strong>in</strong>imal. Hence, toachieve the lowest risk, the process had to be clearly def<strong>in</strong>ed. Neutrality and impartialitycan best be achieved if several people participate <strong>in</strong> the recruitmentprocess. It was further established that risk is further m<strong>in</strong>imised if members ofthe recruitment commission are different for each candidate. This greatly dim<strong>in</strong>ishesthe risk of partiality, and furthermore, all members of staff participate <strong>in</strong>the process of recruitment , not only the management.2.2.3 Assessment and level of riskRisk assessment is the establishment and analysis of risks that might prevent theunit from achiev<strong>in</strong>g its objectives, and is the basis of effective risk management.Risks were assessed at the meet<strong>in</strong>g of the senior staff. It was established thatguardians of an <strong>in</strong>dividual process must be <strong>in</strong>volved <strong>in</strong> the renovation of theregister and <strong>in</strong> the assessment exercise, as they are best acqua<strong>in</strong>ted with theirdoma<strong>in</strong>s and can use their experience. At the same time, they are best able toidentify possible threats. S<strong>in</strong>ce most adm<strong>in</strong>istrative units have already obta<strong>in</strong>edthe certificate of quality, each unit must have process guardians with clearly de-117
ACHIEVING EFFICIENCY THROUGH RISK MANAGEMENTf<strong>in</strong>ed competences and responsibilities. The process guardians are those whoare best able to assess risks and def<strong>in</strong>e the level of threat.2.2.4 Measures to control the riskIdentified risks, risk assessments and levels of threat that are acceptable for theunit are conta<strong>in</strong>ed <strong>in</strong> the risk register, which is the basis for further action. It isreasonable to def<strong>in</strong>e measures to control the risk as the threats emerge. LjutomerAdm<strong>in</strong>istrative Unit, for <strong>in</strong>stance, adopted a measure of <strong>in</strong>ternal controland supervision of the f<strong>in</strong>ancial operation of local offices. In do<strong>in</strong>g so, we took<strong>in</strong>to consideration the level of acceptable risk, which is risk that the unit wasstill will<strong>in</strong>g to accept. In view of the fact that the unit is a budget user and thatf<strong>in</strong>ancial controls are an essential element <strong>in</strong> the preparation of yearly reports,<strong>in</strong>ternal controls were set up ma<strong>in</strong>ly <strong>in</strong> areas connected with commitmentscharged to the budget, data accuracy, <strong>public</strong> procurement, award<strong>in</strong>g contracts,payments and reimbursements etc. It should be noted that <strong>in</strong> the process ofmak<strong>in</strong>g the risk register, necessary new controls were def<strong>in</strong>ed and <strong>in</strong>troduced.For example: <strong>in</strong> the process of purchases. In this process, control is focused onthe element of del<strong>in</strong>eation of responsibilities.2.2.5 Risk management <strong>in</strong>structionsThe follow<strong>in</strong>g had to be done <strong>in</strong> order to achieve efficient risk management:appo<strong>in</strong>t a responsible person, obta<strong>in</strong> the agreement of management and staffand def<strong>in</strong>e the risk management processes. These elements were def<strong>in</strong>ed andexpla<strong>in</strong>ed <strong>in</strong> the risk management manual.2.2.6 Abolition of IOIs and adoption of the risk registerS<strong>in</strong>ce 1999, when the first IOIs were prepared, IOIs have been cont<strong>in</strong>ually chang<strong>in</strong>g.In 2007, a new format of IOIs was adopted – a graphic presentation. However,on 17 November 2008, by the unanimous decision of the managementand staff, most IOIs were abolished. To enable traceability and facilitate transitionto the new risk register, a list of abolished IOIs was prepared. Three newdocuments were prepared, <strong>in</strong> the form of memos for <strong>in</strong>dividual adm<strong>in</strong>istrativeactions. These check lists are <strong>in</strong>serted <strong>in</strong> the file and help the person responsiblefor the file to follow all the necessary steps of the adm<strong>in</strong>istrative procedure.Other check lists were prepared for procedures <strong>in</strong> the fields of construction,aliens and nationality.2.2.7 Accessibility of the risk register and check listsThe risk register is a strategic document that is essential for achiev<strong>in</strong>g the objectivesof the organisation and must, therefore, be accessible to all staff. In Lju-118
DARIJA MOHORIČ MSC, MAJDA MEŠKO MSC, ALEKSANDRA STAMNIČAR VERONIK, HELENA SAGAJtomer Adm<strong>in</strong>istrative Unit, the risk register is published on the website bullet<strong>in</strong>board. It is accessible <strong>in</strong> two formats (PDF and doc), with l<strong>in</strong>ks to <strong>in</strong>dividualprocesses.Figure 3: Risk register on the websiteFigure 4: L<strong>in</strong>ks to processesSource: Ljutomer Adm<strong>in</strong>istrative Unit website bullet<strong>in</strong> board, 2008Check lists are published <strong>in</strong> the same way. Check lists are connected to <strong>in</strong>dividualdepartments. A click on the department opens the department’s page119
ACHIEVING EFFICIENCY THROUGH RISK MANAGEMENTwith a list of tasks performed by the department. Another click and the desired<strong>in</strong>formation is available. If the task requires a special adm<strong>in</strong>istrative procedure,there is a l<strong>in</strong>k directly from the check list to the general risk register – adm<strong>in</strong>istrativeprocedures.2.2.8 Risk register - a tool for better workEach process that was identified with<strong>in</strong> the adm<strong>in</strong>istrative unit was assigned aguardian, whose responsibility is to coord<strong>in</strong>ate work and spot new risk factors,and to manage the process by means of <strong>in</strong>ternal controls and shar<strong>in</strong>g responsibilities,so that the likelihood of failure to achieve the set objectives is m<strong>in</strong>imised.In what way this will be achieved is left to the discretion of the processguardians. Process guardians are, at the same time, persons who work with<strong>in</strong>the process, and are personally confronted with the risks.Additional controls and supervision have been <strong>in</strong>troduced <strong>in</strong> the adm<strong>in</strong>istrativeprocess. Some controls were already <strong>in</strong> place, and some new controls were<strong>in</strong>troduced. Great emphasis <strong>in</strong> Ljutomer Adm<strong>in</strong>istrative Unit is place on <strong>in</strong>ternalself-monitor<strong>in</strong>g. For <strong>in</strong>stance, we <strong>in</strong>troduced double check<strong>in</strong>g of adm<strong>in</strong>istrativedecisions. A first person prepares an adm<strong>in</strong>istrative document, a secondperson checks it, and the document is f<strong>in</strong>ally rechecked and signed bythe responsible person.For monitor<strong>in</strong>g the process, heads of departments prepare check lists, <strong>in</strong> whichproblems encountered on the critical path are entered. On the basis of thesecheck lists potential risks are identified and, hopefully, prevented. They arealso used as evidence that measures have been taken.3 RESULTS AND EFFECTS OF THE SOLUTIONIn seek<strong>in</strong>g a solution for reduc<strong>in</strong>g the number of IOIs, we wished primarily toreduce the number of quality management system documents and thus reducethe load on the staff, enhance transparency and comb<strong>in</strong>e, or at least harmonize,manuals referr<strong>in</strong>g to related processes, although we were aware that such areduction must <strong>in</strong> no way affect the effectiveness and efficiency of our work.Quite the opposite, the modified approach must yield better results for bothclients and staff.3.1 RISK REGISTER – ITS IMPACT ON CUSTOMER SATISFACTIONCustomers expect the service to be delivered <strong>in</strong> accordance with their expectations.In particular, they want their demands resolved <strong>in</strong> the shortest possibletime.120
DARIJA MOHORIČ MSC, MAJDA MEŠKO MSC, ALEKSANDRA STAMNIČAR VERONIK, HELENA SAGAJThe impact of the <strong>in</strong>troduction of the risk register is evaluated on the basis ofthe results of the monthly staff satisfaction survey, which permits comparisonof data “before” and “after” sett<strong>in</strong>g up the register. Data referr<strong>in</strong>g to the periodfrom 1 January <strong>2009</strong> to 31 May <strong>2009</strong> have been compared to those referr<strong>in</strong>g tothe period from 1 January 2008 to 30 June 2008.Graph 1: Customer evaluation of how speedily work is doneSource: monthly surveyGraph 1 shows average evaluations from monthly surveys before and after thesett<strong>in</strong>g up of the risk register and its impact on the speed of resolv<strong>in</strong>g cases.Results show an <strong>in</strong>crease <strong>in</strong> customer satisfaction from 4.53 <strong>in</strong> 2008 (before the<strong>in</strong>troduction of the risk register) to 4.75 <strong>in</strong> <strong>2009</strong>. This result is above the comparablenational average, which is 4.66 <strong>in</strong> the first five months of <strong>2009</strong>.The positive impact of the <strong>in</strong>troduction of the risk register is also evident alsofrom the average customer satisfaction evaluation of overall services providedby Ljutomer Adm<strong>in</strong>istrative Unit. Graph 2 shows average data on customer satisfactionbefore and after the <strong>in</strong>troduction of the risk register: 4.50 <strong>in</strong> 2008 aga<strong>in</strong>st4.79 <strong>in</strong> <strong>2009</strong>. This result is above the comparable national average which is4.69 <strong>in</strong> the first five months of <strong>2009</strong>.121
ACHIEVING EFFICIENCY THROUGH RISK MANAGEMENTGraph 2: Monthly evaluation of overall servicesSource: monthly survey3.2 RISK REGISTER – ITS IMPACT ON STAFF SATISFACTIONThe <strong>in</strong>troduction of the risk register had a positive impact on the staff, the abolishmentof IOIs had a direct effect The <strong>in</strong>troduction of the risk register had thedirect effect of alleviat<strong>in</strong>g the burden on staff, who no longer had to keep trackof large quantities of documents, as shown below.Graph 3 shows the time used by staff keep<strong>in</strong>g track of IOIs. More than threequarters (75.87 %) of the staff employed about 20 m<strong>in</strong>utes to keep track ofchanges or amendments of a particular IOI.Graph 3: Time employed by staff tokeep track of changes of IOIsGraf 4: Manag<strong>in</strong>g IOIs <strong>in</strong> relation to timeavailable for other tasksObvladovanje ONN vpliva na čas reševanja ostalih delovnih nalogSource: survey, March 2008122
DARIJA MOHORIČ MSC, MAJDA MEŠKO MSC, ALEKSANDRA STAMNIČAR VERONIK, HELENA SAGAJThe time used for keep<strong>in</strong>g track of IOIs was also reflected <strong>in</strong> the time for carry<strong>in</strong>gout other tasks. Graph 4 shows staff evaluation of how time used forkeep<strong>in</strong>g track of IOIs affects the time for carry<strong>in</strong>g out other tasks The resultsshow that 93.1 % of the staff fully or partially agreed that keep<strong>in</strong>g track of IOIsnegatively affects the time devoted to other tasks. Only 6.1 % of the staff feltthat keep<strong>in</strong>g track of IOIs had no bear<strong>in</strong>g on the time for fulfill<strong>in</strong>g other tasks,but felt that the <strong>in</strong>troduction of the risk register helped f<strong>in</strong>d<strong>in</strong>g <strong>in</strong>consistenciesdur<strong>in</strong>g <strong>in</strong>ternal audits. Between 2005 and 2008, the number of <strong>in</strong>consistenciesdiscovered <strong>in</strong> IOIs represented 22.2 % of all <strong>in</strong>consistencies discovered by <strong>in</strong>ternalaudit.3.3 RISK REGISTER – ITS IMPACT ON SOCIETYRisk management and abolition of IOIs has also an economic impact. The abolitionof IOIs resulted <strong>in</strong> a more rational use of material resources (less paper,for <strong>in</strong>stance). The risk register has been prepared <strong>in</strong> digital form and also supplementedand amended <strong>in</strong> that form. This also allows a more rational andeffective use of work<strong>in</strong>g hours.3.4 RISK REGISTER – ITS IMPACT ON KEY OUTPUTSEffective risk management has also had a positive effect on our output, i.e., onthe provision of our services. Judicial review of our decisions by the second<strong>in</strong>stance body shows that we provide quality services <strong>in</strong> compliance with thelaw. S<strong>in</strong>ce the <strong>in</strong>troduction of the risk register, the number of our decisions thatwere confirmed by the second <strong>in</strong>stance body follow<strong>in</strong>g a compla<strong>in</strong>t, <strong>in</strong>creased<strong>in</strong> the first half of <strong>2009</strong> as compared to the same period of 2008.The action of <strong>in</strong>troduc<strong>in</strong>g the risk register and abolish<strong>in</strong>g IOIs <strong>in</strong>volved all staffof the Ljutomer Adm<strong>in</strong>istrative Unit. Each employee, <strong>in</strong> collaboration with hisor her superior, had to assess whether a particular IOI was still effective anduseful for the fulfilment of his/her task, or whether it was already addressed bythe risk register and can be abolished. On the basis off such an assessment, only10 IOIs were reta<strong>in</strong>ed which were felt to be needed for the effective fulfilmentof relevant tasks. All staff are also <strong>in</strong>volved <strong>in</strong> the management of the register,propos<strong>in</strong>g improvements <strong>in</strong> order to make it even more effective.The <strong>in</strong>troduction of the risk register for all processes identified with<strong>in</strong> the LjutomerAdm<strong>in</strong>istrative Unit has had a positive affect on our work. We have achievedthe objective of abolish<strong>in</strong>g most IOIs, and, by adopt<strong>in</strong>g a risk register,have enhanced the quality and effectiveness of our services and our work. Theresults are not accidental; on the contrary, they are the fruit of a thoughtful decisionto <strong>in</strong>crease the effectiveness and efficiency on the basis of a risk register.123
ACHIEVING EFFICIENCY THROUGH RISK MANAGEMENT3.5 EFFECT OF IMPROVED PARTNERSHIP RELATIONSOn the basis of an analysis of the causes of discont<strong>in</strong>uities and errors <strong>in</strong> processes,monitored through the risk register, the unit has <strong>in</strong>stituted a dialogue withexternal partners, based on an exchange of op<strong>in</strong>ions and know-how. S<strong>in</strong>ce thisdialogue was <strong>in</strong>stituted, <strong>in</strong>dicators have shown that cases have been resolved <strong>in</strong>less time and that the satisfaction of all <strong>in</strong>volved is <strong>in</strong>creas<strong>in</strong>g.In order further to improve the unit’s efficiency and customers’ satisfaction, webegan to monitor the time necessary to receive data from other bodies fromdatabases that these bodies keep <strong>in</strong> compliance with Article 139 of the GeneralAdm<strong>in</strong>istrative Procedure Act At the end of each year, these data are analysedand the provid<strong>in</strong>g bodies are <strong>in</strong>formed thereof. Last year’s analysis already showeda major <strong>in</strong>crease <strong>in</strong> the responsiveness of our providers, while analysisof the first half of this year shows 100 % responsiveness, which means that allbodies have provided data with<strong>in</strong> the period specified by law.This year, the unit has started to monitor risks and delays that are due to <strong>in</strong>completedossiers for the delivery of build<strong>in</strong>g and operational permits <strong>in</strong> theDepartment of the Environment and Spatial Plann<strong>in</strong>g and General Affairs. A listof documents that are most frequently miss<strong>in</strong>g is published twice yearly on theunit’s website. We thus try to m<strong>in</strong>imize the risks produced by our partners andproviders that are likely to affect our risk management system. By do<strong>in</strong>g so, wespeed up the resolution of matters, reduce costs and help with the overall economyand effectiveness of our unit’s operation.3.6 CONTRIBUTION TO ACHIEVING LISBON STRATEGY OBJECTIVESEndeavours to enhance effectiveness and efficiency of the adm<strong>in</strong>istrative unittouch on all aspects of the management of the organisation, from the organisationof processes to the implementation of tasks, monitor<strong>in</strong>g process efficiencyand seek<strong>in</strong>g better solutions. In the context of meet<strong>in</strong>g the commitment of theEU and of Slovenia to reduce the adm<strong>in</strong>istrative burden by 25 %, the sett<strong>in</strong>g upof a risk register with<strong>in</strong> the quality management system and the elim<strong>in</strong>ation ofIOIs is the reali<strong>za</strong>tion of one of Lisbon objectives. Monitor<strong>in</strong>g process activitiesthrough the risk register has def<strong>in</strong>itely enhanced our efficiency. In this way,small <strong>in</strong>puts <strong>in</strong> the form of staff time may greatly <strong>in</strong>crease the likelihood of successfullyachiev<strong>in</strong>g the set objectives.4 SUSTAINABLE QUALITYModern management and the process approach enable a greater predictabilityof objectives by reduc<strong>in</strong>g, through control and risk management, uncerta<strong>in</strong>ties124
DARIJA MOHORIČ MSC, MAJDA MEŠKO MSC, ALEKSANDRA STAMNIČAR VERONIK, HELENA SAGAJon the critical path. A risk register is a tool that enables the management processes<strong>in</strong> such a way that risk is kept at an acceptable level. The <strong>in</strong>ternal controlsystem provides a series of procedures and methods for risk management thatare likely to affect:— the achievement of objectives,— the transparency of operation <strong>in</strong> compliance with laws and regulations,— cost-effective, efficient and effective use of material resources,— the protection of assets, and prevention of bad management and fraud,— timely, comprehensive and reliable report<strong>in</strong>g.5 SUMMARYThe analysis carried out <strong>in</strong> Ljutomer Adm<strong>in</strong>istrative Unit after the adoption ofthe ISO standard showed that the burden on the staff had <strong>in</strong>creased. The requirementto provide detailed descriptions of processes resulted <strong>in</strong> the completerewrit<strong>in</strong>g of such descriptions every time there was an amendment to relaventregulations. The time spent on the ma<strong>in</strong>tenance of these documents could havebeen spent on activities that enhance the quality of services (monitor<strong>in</strong>g legislation,participation <strong>in</strong> tra<strong>in</strong><strong>in</strong>g sem<strong>in</strong>ars, carry<strong>in</strong>g out professional tasks, prepar<strong>in</strong>gnotifications on the expiry of documents etc.). Such activities can havean <strong>in</strong>direct impact on the quality of services and contribute greatly to creat<strong>in</strong>ga user-friendly adm<strong>in</strong>istration.On the basis of these f<strong>in</strong>d<strong>in</strong>gs, the Ljutomer Adm<strong>in</strong>istrative Unit decided toabolish all IOIs and to set up a risk register. The sett<strong>in</strong>g up the risk register hasproven to be a major turn<strong>in</strong>g po<strong>in</strong>t and positive advance, <strong>in</strong> terms of both rationali<strong>za</strong>tionand enhanced effectiveness of the unit’s operation. The risk registerthus enabled the sett<strong>in</strong>g up of a systematic and regulated approach to assessment,and brought about the enhanced effectiveness of risk management, controland management processes. Risk management is the responsibility of theunit’s management, which must implement a suitable risk management policy.REFERENCES1. DSRD – Department of State and Regional Development: Risk Management Guidefor Small Bus<strong>in</strong>ess. B.k.: Global Risk Aliance URL: http://www.smallbiz.nsw.gov.,11.11.2008.2. Mohorčič Zobec Nataša: Notranje revidiranje obvladovanja tveganj v bankah, <strong>za</strong>ključnodelo Inštituta <strong>za</strong> pridobitev strokovnega naziva PREIZKUŠENI NOTRANJIREVIZOR, 2000.125
ACHIEVING EFFICIENCY THROUGH RISK MANAGEMENT3. Možič Cecilija, Lesjak Marija: Kako doseči, da register tveganj v organi<strong>za</strong>ciji ne bosam sebi namen, gradivo <strong>za</strong> sem<strong>in</strong>ar z delavnico, 24.9. 2008.4. Nemec, Tomislav (2000) Elementi mehke kakovosti v državni upravi, Upravna enotaLjutomer, dostopno na: http://www.upravneenote.gov.si/ljutomer/o_upravni_enoti/kakovost/prispevki_<strong>in</strong>_referati_ue_ljutomer_na_temo_kakovosti/,2. 4. 2008.5. Novis, Glasilo Združenja zdravstvenih <strong>za</strong>vodov Slovenije, 2007, št. 10, URL: http://www.zdrzz.si/files/Novis_10-2007.pdf, 14. 4. 2008, članek Irma Kovač.6. Pivka Marijan, Ekonomsko-poslovna fakulteta Maribor, 2000 – <strong>za</strong>piski.7. Spletni priročnik <strong>za</strong> kakovost poslovanja, URL: http://www.mojdenar.com, Potkonjak,Petar, 11. 11. 2008.8. Upravljanje s tveganji <strong>in</strong> analize tveganj, URL: http://www.unp.gov.si/slov/notranji_nad z o r / N o t r a n , 1.10.2008.9. Vloga UE Ljutomer <strong>za</strong> PRSPO, 2004.10. Zbornik referatov (2001) Posvet na poti k poslovni odličnosti javne uprave. Ljubljana:M<strong>in</strong>istrstvo <strong>za</strong> notranje <strong>za</strong>deve, prispevek Strle Vidali Marjetka, 12 <strong>in</strong> 58-59.11. Zbornik referatov (2004) Konferenca Dobre prakse v slovenski javni upravi. Ljubljana:M<strong>in</strong>istrstvo <strong>za</strong> notranje <strong>za</strong>deve, prispevek Volčnjak Jožica, 111-119.12. Zbornik referatov, Bernard<strong>in</strong> 8 <strong>in</strong> 9 november (2007) Kakovost - <strong>in</strong>ovativnost <strong>in</strong>odgovornost. Ljubljana: Slovensko združenje <strong>za</strong> kakovost, prispevek Košir Aleš, DomajnkoBoris, 101 – 103.126
DARIJA MOHORIČ MSC, MAJDA MEŠKO MSC, ALEKSANDRA STAMNIČAR VERONIK, HELENA SAGAJDokumentacija Upravne enote LjutomerAnnex 1: RISK REGISTERMANAGING FINANCIAL RESOURCESDate of entryidentificationof riskRefno.Processes and objectivesSources of<strong>in</strong>formation to identifythe riskMeasurablecriteriaDescriptionof riskRisk assessmentLikelihood1 2 3 4 5 6 7 8 7 x 8 = 9Impact..Riskrat<strong>in</strong>gApril 2008 5 MANAGING FINANCIAL RESOURCES5.1 Preparation of f<strong>in</strong>ancial planF<strong>in</strong>ancial plan is <strong>in</strong> l<strong>in</strong>e with thelegislation <strong>in</strong> force, with thecostanalysis of the preced<strong>in</strong>gyear, and with the yearly plan ofLjutomer AU.– f<strong>in</strong>ancial audit,– results of <strong>in</strong>ternalassessments,– results of externalassessments,– check-list to monitorthe process,– half-yearly (<strong>in</strong>terim)f<strong>in</strong>ancial report– set of <strong>in</strong>dicators:CAF and PRSPOmodel criteria– half-yearly report,– relation betweenplanned and realizedactions,– legislation <strong>in</strong> force– f<strong>in</strong>ancial plan isunsusta<strong>in</strong>able because ofbad plann<strong>in</strong>g– too many resources arebe<strong>in</strong>g transferred from onebudget account to another– budget deficit– failure to comply withlegislation2 2 4Measures to manage risks – existent controlsAdequacy ofexistentcontrolsAction required Responsible personImplementationdeadl<strong>in</strong>e10 11 12 13 14– appo<strong>in</strong>ted guardian of the process– appo<strong>in</strong>ted responsible person of the process of acquisition of supplies– enforcement of legislation <strong>in</strong> force and follow<strong>in</strong>g the methodology fordraft<strong>in</strong>g the budget and regulations– careful preparation of biannual f<strong>in</strong>ancial plan and appropriate plann<strong>in</strong>gof f<strong>in</strong>ancial resources (provision of funds)– analysis of spend<strong>in</strong>g trends <strong>in</strong> preced<strong>in</strong>g f<strong>in</strong>ancial years,– def<strong>in</strong><strong>in</strong>g the scope of budgetary commitments <strong>in</strong> relation to theadm<strong>in</strong>istrative process– half-yearly (<strong>in</strong>terim) report compris<strong>in</strong>g a comparison of actualexpenditure with the plan– monthly f<strong>in</strong>ancial plan– analysis of preced<strong>in</strong>g year’s expenditure. annual f<strong>in</strong>ancial statement1 – act<strong>in</strong>g <strong>in</strong> compliance with the legislation<strong>in</strong> force, with M<strong>in</strong>istry of F<strong>in</strong>ance<strong>in</strong>structions and guidel<strong>in</strong>es, cost-effectiveexpenditure <strong>in</strong> compliance with the law– f<strong>in</strong>ancial service– responsible personof the processof acquisition ofsupplies– responsible personof the f<strong>in</strong>anc<strong>in</strong>gprocess– <strong>in</strong> compliancewith M<strong>in</strong>istryof F<strong>in</strong>ance<strong>in</strong>structions– as and whenrequired127
INTERACTIVE STATISTICAL ATLAS OF SLOVENIAKatja ŠNUDERLStatistical Office of the Re<strong>public</strong> of Sloveniakatja.snuderl@gov.si1 INTRODUCTIONThe Interactive Statistical Atlas of Slovenia is a new tool on the website of theStatistical Office of the Re<strong>public</strong> of Slovenia (SORS). It facilitates an easy reviewof selected statistical <strong>in</strong>dicators on maps of municipalities and statisticalregions. Through this tool, SORS is expand<strong>in</strong>g its set of web services to differentprofiles of users and <strong>in</strong>vites them to discover the dist<strong>in</strong>ctions betweenSlovenian regions and municipalities by way of statistical data. The tool is <strong>in</strong>tendedfor users who are less skilled <strong>in</strong> us<strong>in</strong>g statistical data, as well as for moredemand<strong>in</strong>g users apply<strong>in</strong>g it, for example, as database support <strong>in</strong> strategic decision-mak<strong>in</strong>g<strong>in</strong>volv<strong>in</strong>g Slovenia’s regional development.By publish<strong>in</strong>g the Interactive Statistical Atlas of Slovenia, SORS is realis<strong>in</strong>g theobjectives of its statistical data dissem<strong>in</strong>ation strategy. In develop<strong>in</strong>g this tool,the needs of various user groups, the pr<strong>in</strong>ciples of cartographic display of dataand <strong>in</strong>ternational experience <strong>in</strong> the area of <strong>in</strong>teractive web tool developmentwere considered. This paper provides a detailed description of the basic premisesand project elements.2 NATIONAL STATISTICS AND DISSEMINATION OF STA-TISTICAL DATAThe mission of Slovenian national statistics is to provide users with statisticaldata. The regulatory framework cover<strong>in</strong>g national statistics (National StatisticsAct (Official Gazette of the Re<strong>public</strong> of Slovenia [Uradni list RS], Nos45/1995 and 9/2000)) provides that “users” shall mean <strong>public</strong> adm<strong>in</strong>istrationbodies and organisations, the corporate sector and the general <strong>public</strong>. Thedata must demonstrate quality and be published <strong>in</strong> <strong>good</strong> time. They shouldalso be comparable both as to time and place and <strong>in</strong>ternationally, and coverall areas of human existence and creation, which <strong>in</strong>cludes economic, demographicand social areas, as well as the areas of environment and natural resources.SORS performs statistical services at the national level, together withauthorised providers def<strong>in</strong>ed <strong>in</strong> the Medium-term Programme of StatisticalSurveys 2008–2012. One of the most important tasks def<strong>in</strong>ed at the end of
INTERACTIVE STATISTICAL ATLAS OF SLOVENIAthe statistical process is the task most perceived by users, i.e. dissem<strong>in</strong>ationof statistical data.The term “dissem<strong>in</strong>ation” means the activity of dissem<strong>in</strong>at<strong>in</strong>g or publish<strong>in</strong>g statisticaldata and methods. The strategic policies of the national statistics covered<strong>in</strong> the Medium-term Programme of Statistical Surveys 2008–2012 also <strong>in</strong>cludethe Strategy of Dissem<strong>in</strong>ation and Communication with Users.The objectives of the Strategy are:— user satisfaction,— <strong>in</strong>creased statistical literacy,— visibility and reputation of the SORS trademark, users’ trust and effective useof statistical data, and— effective preparation, promotion and communication of <strong>in</strong>formation.Internationally, the role of the official (national) statistics as a basis for <strong>in</strong>formeddecision-mak<strong>in</strong>g, be<strong>in</strong>g one of the fundamental elements of democracy,has been <strong>in</strong>creas<strong>in</strong>gly emphasised <strong>in</strong> recent years. Official statistics provide<strong>in</strong>ternationally comparable data obta<strong>in</strong>ed by scientific methods and commonpr<strong>in</strong>ciples of statistical data quality. In most countries, the set of statistical dataoffered by the official statistics is very comprehensive, while their use is quiteoften limited or poorly developed. There are various reasons for this situation:from poor acqua<strong>in</strong>tance of users with the set of accessible statistical data tothe demand<strong>in</strong>g search for adequate data and their proper understand<strong>in</strong>g and<strong>in</strong>terpretation. Therefore, several statistical offices <strong>in</strong>creas<strong>in</strong>gly emphasise theimportance of better accessibility and comprehensibility of statistical data.(Thygesen, 2008)In plann<strong>in</strong>g the development of the Interactive Statistical Atlas of Slovenia, theexperience of other <strong>in</strong>ternational organisations and foreign statistical officeswas considered. By organis<strong>in</strong>g the conferences entitled “Innovative Approachesto Turn<strong>in</strong>g Statistics <strong>in</strong>to Knowledge” (Rome 2007, Stockholm 2008, Wash<strong>in</strong>gton<strong>2009</strong>), the Organisation for Economic Cooperation and Development(OECD) encouraged an <strong>in</strong>tensive exchange of experience <strong>in</strong> the <strong>in</strong>ternationalenvironment. By publish<strong>in</strong>g the new tool, SORS is jo<strong>in</strong><strong>in</strong>g the newest guidel<strong>in</strong>escover<strong>in</strong>g the development of web services for statistical data users.3 STATISTICAL DATA USERS AND THE INTERNETWith the appearance of the Internet, the number and structure of statistical datausers have radically changed. In the period of pr<strong>in</strong>ted <strong>public</strong>ations, SORS hadtransparent databases of users (clients) at its disposal, and personal visits of us-130
KATJA ŠNUDERLers to the Office were noth<strong>in</strong>g rare. There were fewer users who, as a rule, werestatistically educated and their needs were easier to monitor. The outset of publish<strong>in</strong>gdata on websites saw a substantial <strong>in</strong>crease <strong>in</strong> their number; their skillsand needs became quite differentiated, while the possibilities of their identificationwere very limited.In develop<strong>in</strong>g websites, it is not possible to satisfy the needs of all users by apply<strong>in</strong>gthe same methods of present<strong>in</strong>g statistical data. Therefore, SORS’s productsvary <strong>in</strong> respect of various needs and possibilities of statistical data applicationdeterm<strong>in</strong>ed by the statistical and computer literacy of user groups. Usergroups can be def<strong>in</strong>ed <strong>in</strong> various ways. The <strong>in</strong>itial segmentations of users werebased on the area of activity of particular users (<strong>public</strong> <strong>in</strong>stitutions, schools,research community, media, etc.), while recently there has been an <strong>in</strong>creas<strong>in</strong>gtendency to generally classify them <strong>in</strong>to three groups: the so-called “tourists”(schools, media, general <strong>public</strong> – users with general <strong>in</strong>terest), “producers” (decision-makers,managers – users with bus<strong>in</strong>ess <strong>in</strong>terest) and “m<strong>in</strong>ers” (universities,experts, government <strong>in</strong>stitutions – users with research <strong>in</strong>terest). This usersegmentation <strong>in</strong> the area of statistics was first applied by Grossenbacher (2006).In spite of the fact that this segmentation allows different <strong>in</strong>terpretations, it neverthelessemphasises substantial differences as to the <strong>in</strong>terests, skills and needsof <strong>in</strong>dividual user groups.Because of its clear and simple communication capacity, <strong>in</strong>teractivity and dynamicpresentation of phenomena, the Interactive Statistical Atlas of Sloveniais a suitable tool for the widest circle of users. Although primarily <strong>in</strong>tendedfor the general <strong>public</strong>, it nevertheless offers more demand<strong>in</strong>g (bus<strong>in</strong>ess or research)users additional options provided by supplementary def<strong>in</strong>itions andl<strong>in</strong>ks to detailed or more updated <strong>in</strong>formation.4 CARTOGRAPHIC PRESENTATION OF STATISTICAL DATAFor different profiles of users, SORS is prepar<strong>in</strong>g various products, one of theconstants be<strong>in</strong>g data visualisation. The most common methods of data visualisationare charts and maps. The primary objective of data visualisation is tocommunicate <strong>in</strong>formation <strong>in</strong> a comprehensible and effective manner by wayof computer graphics. To emphasise the idea <strong>in</strong> an effective and aesthetic waymeans that, <strong>in</strong>stead of complex databases, key views are presented <strong>in</strong> an <strong>in</strong>tuitivemanner.Maps are the most efficient tools to visualize spatial patterns. When carefullydesigned and presented, they are more than just decorative features <strong>in</strong> astatistical presentation. They can help people identify and highlight distribu-131
INTERACTIVE STATISTICAL ATLAS OF SLOVENIAtions and patterns that might not be apparent from tables and charts. If “a pictureis worth a thousand words”, then “a map is worth a thousand numbers”.In our visual era, maps are a powerful <strong>in</strong>formation medium. They serve asvaluable decision-mak<strong>in</strong>g tools for experts, politicians and the general <strong>public</strong>,and meet a grow<strong>in</strong>g demand for <strong>in</strong>formation <strong>in</strong> all parts of society (UNECE,<strong>2009</strong>).Well designed maps are easy to understand. It is typical of many software solutionsthat dur<strong>in</strong>g the development stage a new tool, although easy to use and <strong>in</strong>tuitiveand not requir<strong>in</strong>g specific tra<strong>in</strong><strong>in</strong>g, demands most analysis, <strong>in</strong>tellectual<strong>in</strong>put and thorough test<strong>in</strong>g. Solutions which at first sight seem complex andexact<strong>in</strong>g, perhaps <strong>in</strong>deed support demand<strong>in</strong>g processes, however they usuallyreflect the fact that the implementation was not designed to sufficiently emphasisethe end user’s needs. The same is also true of the content-related preparationof maps on which any data can be displayed. However, the sole display<strong>in</strong>gof data <strong>in</strong> space does not ensure the communication capacity of the map. Inorder to display data on maps, the absolute statistical data must be converted<strong>in</strong>to <strong>in</strong>dicators, as this is the only way to ensure comparability between unitsof various sizes. Thus, the Interactive Statistical Atlas of Slovenia shows <strong>in</strong>dicatorsper 1,000 population <strong>in</strong> a region or municipality, coefficients, <strong>in</strong>dices,averages, various structures (percentages) and also a number of calculationsper municipality surface area. The explanations of the mean<strong>in</strong>g of <strong>in</strong>dividual<strong>in</strong>dicators are displayed below the chart, where users are also offered l<strong>in</strong>ks tomore detailed data published on SORS’s web pages.5 DESIGN AND PROJECT IMPLEMENTATIONIn recent years, SORS has published several pr<strong>in</strong>ted <strong>public</strong>ations for the purposeof present<strong>in</strong>g statistical data at lower territorial levels (e.g. SlovenianRegions <strong>in</strong> Figures and Slovenian Municipalities <strong>in</strong> Figures, published <strong>in</strong> <strong>2009</strong>for the first time). Through cartographic methods of present<strong>in</strong>g statisticaldata we wish to encourage discussions on regional differences <strong>in</strong> Sloveniaand facilitate the appropriate design of regional development strategies. Thepresentation of statistical data has for quite some time been facilitated by theSI-STAT data portal, which is basically <strong>in</strong>tended for more demand<strong>in</strong>g users.In order to effect the map display, the data must first be found <strong>in</strong> the correspond<strong>in</strong>gtable and typed on the monitor. However, more advanced tools fordata display on maps, which have <strong>in</strong> recent years been developed <strong>in</strong>ternationally,provide for the display of pre-produced data suitable for cartographicpresentation. Although the development of such a tool requires a more sophisticatedprocedure of prepar<strong>in</strong>g data and produc<strong>in</strong>g the tool, it qualifiesfor use by a wider circle of users.132
KATJA ŠNUDERLSORS developed the Interactive Statistical Atlas of Slovenia <strong>in</strong> cooperation withthe company Monolit d.o.o., selected by way of a <strong>public</strong> call for tenders. The keytasks <strong>in</strong> develop<strong>in</strong>g this web tool were performed by the Dutch company Mapp<strong>in</strong>gWorld, which had also developed similar tools for the International MonetaryFund (IMF Data Mapper) and the World Bank (Millennium DevelopmentAtlas, World Bank Atlas). The development stage was concluded <strong>in</strong> December2008, while the Atlas has been accessible on the SORS website s<strong>in</strong>ce June <strong>2009</strong>upon the completion of the operational test period. The tool is designed <strong>in</strong> twolanguages, i.e. Slovene and English.The <strong>in</strong>novative web <strong>in</strong>formation solution thus enabled SORS to transfer andadapt <strong>in</strong>ternational <strong>good</strong> <strong>practices</strong> for the benefit of Slovenian statistical datausers. The basic policy <strong>in</strong> produc<strong>in</strong>g the tool was to make it as simple as possible,as well as to ensure flexibility and adaptation to specific characteristics ofthe Slovenian environment. Consequently, the tool facilitates the supplementationof new content, the display of the number and boundaries of municipalities,and presentation of data <strong>in</strong> various time series.We <strong>in</strong>cluded <strong>in</strong> the Interactive Statistical Atlas of Slovenia the <strong>in</strong>itial set of <strong>in</strong>dicatorsprepared accord<strong>in</strong>g to data previously published on SORS’s web pages.When the set of <strong>in</strong>dicators will be expanded, it would be wise to <strong>in</strong>clude dataproduced by other <strong>public</strong> <strong>in</strong>stitutions.The criteria for the selection of <strong>in</strong>dicators and data <strong>in</strong>tended for <strong>public</strong>ation:— socially topical statistical data and/or statistical data of <strong>in</strong>terest to the general<strong>public</strong>;— availability of quality data at the level of municipalities and statistical regions,and— suitability of a phenomenon for cartographic presentation.One of the important functions of web applications is the promotion of nationalstatistics among the general <strong>public</strong> and <strong>in</strong> national <strong>in</strong>stitutions. As thestatistical data entry po<strong>in</strong>t for <strong>in</strong>tegration <strong>in</strong> various websites, we <strong>in</strong>tend to offerthe Interactive Statistical Atlas of Slovenia to other national <strong>in</strong>stitutions, particularlyto <strong>public</strong> sector organisations which operate <strong>in</strong> the area of regionaldevelopment.6 HOW TO USE THE INTERACTIVE STATISTICAL ATLAS OFSLOVENIAThe tool is <strong>in</strong>tended for use <strong>in</strong> a web browser. Its function<strong>in</strong>g was tested withthe two most widely used browsers, i.e. Internet Explorer and Mozilla Firefox.133
INTERACTIVE STATISTICAL ATLAS OF SLOVENIAThe use of the tool requires the user to <strong>in</strong>stall Adobe Flash Player, which is quitea common requirement of modern websites with <strong>in</strong>teractive content.Start<strong>in</strong>g the application br<strong>in</strong>gs up the welcome w<strong>in</strong>dow. To display a map, theuser must select either content or an <strong>in</strong>dicator. Interactivity means that the usercan control <strong>in</strong>dividual functions by us<strong>in</strong>g the mouse. These functions are thefollow<strong>in</strong>g:a) mov<strong>in</strong>g the cursor across the map or chart displays data on the map;b) select<strong>in</strong>g <strong>in</strong>dividual regions on the map or <strong>in</strong> the pull-down menu limits thedisplay to the selected region;c) <strong>in</strong> select<strong>in</strong>g the region, the chart also displays only data for the selectedregion;d) charts facilitate the arrangement of regions or municipalities accord<strong>in</strong>g todata and consequently an easy assessment of the highest or lowest values;e) the field provid<strong>in</strong>g methodological explanations <strong>in</strong>cludes basic def<strong>in</strong>itionsand a l<strong>in</strong>k to more detailed data;f) users can save the displayed image or data for the selected <strong>in</strong>dicator at anytime on their computer.A specific mode of cartographic presentation features so-called “metamorphoses”.In this mode, the surface area of territorial units (regions or municipalities)changes accord<strong>in</strong>g to the size of the selected phenomenon. In terms ofcomprehension, this mode is somewhat more demand<strong>in</strong>g. However, <strong>in</strong> comparisonwith the arrangement of spatial units <strong>in</strong> a limited number of classes, itfacilitates a more attractive illustration of dist<strong>in</strong>ctions.Due to the technical requirements of this type of data display, the metamorphoseswere <strong>in</strong>cluded <strong>in</strong> the <strong>in</strong>itial version of the Interactive Statistical Atlas ofSlovenia only for the last reference year (2007) relat<strong>in</strong>g to the follow<strong>in</strong>g three<strong>in</strong>dicators: number of population, number of persons <strong>in</strong> employment and selfemployedpersons, and number of unemployed persons <strong>in</strong> a region or municipality.The colours used on the map reflect data for the selected content, whilethe size of spatial units reflects the selected metamorphosis.7 SUMMARYStatistical data are an important basis for both the preparation of strategic documentsand a review of the achievement of set objectives. Because of its clearand uncomplicated communication capacity, <strong>in</strong>teractivity and dynamic presentationof phenomena, the Interactive Statistical Atlas of Slovenia is a suitabletool for the widest circle of users. This is an <strong>in</strong>novative solution which imple-134
KATJA ŠNUDERLments <strong>in</strong>ternational examples of <strong>good</strong> practice <strong>in</strong>to the Slovenian environment.It facilitates an easy review of selected statistical data and <strong>in</strong>dicators on <strong>in</strong>teractivemaps, as well as the presentation of time-related types of data at the level ofstatistical regions and municipalities.The Interactive Statistical Atlas of Slovenia is also <strong>in</strong>tended for users with lowerstatistical literacy and persons who do not have their own tools for the cartographicpresentation of data. The tool facilitates an easy review of otherwisecomplex data and phenomena, and the rules of their arrangement <strong>in</strong> space.Quite often, a phenomenon described by statistical data is easier to understandon maps than <strong>in</strong> other forms of presentation. In design<strong>in</strong>g the tool, the needsof various user groups, the pr<strong>in</strong>ciples of cartographic <strong>in</strong>dication of data andmodern web technology were considered. The tool has been accessible to userss<strong>in</strong>ce June <strong>2009</strong> on the SORS website (http://www.stat.si/).8 SOURCES AND BIBLIOGRAPHY1. Grossenbacher, Arm<strong>in</strong>. 2006. The shift from pr<strong>in</strong>t to electronic publish<strong>in</strong>g. Strategy,concepts and daily life <strong>in</strong> dissem<strong>in</strong>ation of statistical <strong>in</strong>formation. IMAODBC, Avila,Spa<strong>in</strong>.2. Medium-term Programme of Statistical Surveys 2008–2012, Uradni list RS (OfficialGazette of the Re<strong>public</strong> of Slovenia), No 119/2007.3. Ponniah, Paulraj. 2001. Data Warehous<strong>in</strong>g Fundamentals: A Comprehensive Guidefor IT Professionals. A Wiley-Interscience Publication. New York / Chichester / We<strong>in</strong>heim/ Brisbane / S<strong>in</strong>gapore / Toronto.4. Rosl<strong>in</strong>g, Hans. 2007. Visual technology unveils the beauty of statistics and swaps policyfrom dissem<strong>in</strong>ation to access. Statistical Journal of the IAOS 24: 103–104.5. Ten Bosch, Olav, De Jonge, Edw<strong>in</strong>. 2008. Visualis<strong>in</strong>g official statistics. Statistical Journalof the International Association for Official Statistics, Special issue: Web 2.0 andOfficial Statistics. Vol. 25, Numbers 3, 4: 103–124.6. Thygesen, Lars, Sundgren, Bo. 2008. Innovative approaches to turn<strong>in</strong>g statistics <strong>in</strong>toknowledge. Statistical Journal of the International Association for Official Statistics,Special issue: Web 2.0 and Official Statistics. Vol. 25, Numbers 3, 4: 93–102.7. UNECE: Mak<strong>in</strong>g Data Mean<strong>in</strong>gful. Part 2. Style guide on the presentation of statistics.F<strong>in</strong>al draft, July <strong>2009</strong>.8. Zakon o državni statistiki (National Statistics Act), Uradni list RS (Official Gazette ofthe Re<strong>public</strong> of Slovenia), Nos 45/1995 and 9/2000.9. Wikipedia, Free Encyclopaedia: Data visuali<strong>za</strong>tion. Internet source: http://sl.wikipedia.org/wiki/Podatkovna_vizuali<strong>za</strong>cija, 18.8.<strong>2009</strong>.135
ADMINISTRATIVE UNIT CELJE: COOPERATIONWITH THE MEDIA FOR A MORE EFFICIENT ANDUSER-FRIENDLY PUBLIC ADMINISTRATIONDamjan VREČKO, Jožica TAMŠE, MSc.Celje Adm<strong>in</strong>istrative Unitue.celje@gov.si1 INTRODUCTIONThe primary goal of any <strong>public</strong> adm<strong>in</strong>istration body should be to provide efficientand user-friendly service. Decreas<strong>in</strong>g differences between adm<strong>in</strong>istrative andservice activities br<strong>in</strong>gs about a sharply different concept of <strong>public</strong> adm<strong>in</strong>istration,which, through a variety of contents and forms, becomes more bus<strong>in</strong>esslike.The Celje Adm<strong>in</strong>istrative Unit has material and territorial jurisdiction over fourmunicipalities: the Urban Municipality of Celje, with 48,991 <strong>in</strong>habitants, the Municipalityof Dobrna, with 2,179 <strong>in</strong>habitants, the Municipality of Vojnik, with8,287 <strong>in</strong>habitants and the Municipality of Štore, with 4,260 <strong>in</strong>habitants. CeljeAdm<strong>in</strong>istrative Unit serves a total of 63,717 <strong>in</strong>habitants 1 and covers an area of230 km 2 . Celje Adm<strong>in</strong>istrative Unit has two local offices, <strong>in</strong> municipal premises<strong>in</strong> Vojnik and Dobrna.2 DESCRIPTION OF THE SOLUTIONIn 2007, Celje Adm<strong>in</strong>istrative Unit, <strong>in</strong> order to enhance its effectiveness and toestablish better communication with its clients, began to publish answers toFAQs <strong>in</strong> the media. These FAQs are collected from three sources: questions putdirectly to the advisor for customer assistance, questions received via email andquestions concern<strong>in</strong>g relevant amendments to legislation. The aim is to make the<strong>public</strong> adm<strong>in</strong>istration more accessible to the general <strong>public</strong> and provide advance<strong>in</strong>formation on topical issues. The <strong>in</strong>formation is broadcast on local television<strong>in</strong> a weekly programme called “UE Celje svetuje” (Celje Adm<strong>in</strong>istrative Unit advises)and published weekly <strong>in</strong> the local newspaper CELJAN, and <strong>in</strong> some otherlocal newspapers. All the answers concern<strong>in</strong>g various adm<strong>in</strong>istrative fields arealso published and available on the Celje Adm<strong>in</strong>istrative Unit website.1Source: Statistične <strong>in</strong>formacije-Prebivalstvo (Statistical <strong>in</strong>formation – Population) of 17.6.<strong>2009</strong>,No. 27.2Situation as per 30 June <strong>2009</strong>.
ADMINISTRATIVE UNIT CELJE: COOPERATION WITH THE MEDIA FOR A MORE ...Table 1: Articles published <strong>in</strong> the media:No. Published <strong>in</strong> no. of articles <strong>in</strong> 2008 no. of articles <strong>in</strong> <strong>2009</strong> 21. DELO, VEČER, NT, Dobro jutro 12 52. CELJAN 52 263. Ogledalo (Vojnik) 2 14. Štorski občan 2 15. Dobrnčan 4 26. Celjska TV 40 emissions 25 emissions7. Press conferences 2 1The head of the Celje Adm<strong>in</strong>istrative Unit answersthe questions personally. This is well acceptedby the general <strong>public</strong>, s<strong>in</strong>ce it shows apositive attitude of the <strong>public</strong> adm<strong>in</strong>istrationtowards its clients.On TV Celje, the programme “Celje Adm<strong>in</strong>istrativeUnit advises and answers your questions”is broadcast every Friday <strong>in</strong> prime time and repeatedon Saturdays and Sundays.Here is a list of the most frequent questions towhich the head of the Adm<strong>in</strong>istrative unit hasalready answered <strong>in</strong> the cited TV programmeand have also been published <strong>in</strong> the local newspapers:— Where do I apply to get an extract from theRegister of Births, Marriages and Deaths, or acitizenship certificate?— How long does it take to obta<strong>in</strong> a new passport,a new identity card? How much does itcost?— Where do I unregister my car?— What documents do I need when apply<strong>in</strong>gfor a visa extension?— What documents must I attach to a letter ofguarantee for a bus<strong>in</strong>ess visit?— When an identity card is delivered to a 9-yearold, must the child be present?— What must I do before start<strong>in</strong>g to repair asupport<strong>in</strong>g wall?Picture 1 Article from thenewspaper “Celjan”138
DAMJAN VREČKO, JOŽICA TAMŠE, MSC— What permits do I need for the construction of a shed?— Where do I get a document attest<strong>in</strong>g that a certa<strong>in</strong> build<strong>in</strong>g was constructedbefore 1968?— We want to modernise a barn. What permits do we need?— What are the requirements to set up a bus<strong>in</strong>ess as an <strong>in</strong>dependent bus<strong>in</strong>essperson?— What are the requirements for obta<strong>in</strong><strong>in</strong>g a change the <strong>in</strong>tended use of an agriculturalplot?— Where do I apply to get a certificate of permanent residence, and on the periodof residence <strong>in</strong> the Urban Municipality of Celje?3 MEETING REQUIREMENTSCelje Adm<strong>in</strong>istrative Unit, from the moment when it decided to provide advisoryassistance also through the media, has become more visible and, consequently,able to offer a more satisfactory service to its clients. This claim is supportedby the results of regular yearly and monthly (barometer) surveys, from entries<strong>in</strong> the book of remarks and commendations, yearly surveys carried out <strong>in</strong> enterprises,yearly surveys among members of the coord<strong>in</strong>at<strong>in</strong>g advisory committee,and surveys carried out by the media.Regular yearly surveys of user satisfaction:The key result evident from these surveys is that the quality of services is constantlyris<strong>in</strong>g. Furthermore, users are aware of the efforts that Celje Adm<strong>in</strong>istrativeUnit has been mak<strong>in</strong>g for the past thirteen years constantly to improve itsservice. The surveys <strong>in</strong>dicate that the quality of service surpasses users’ expectations.Table 2: Quality of service (survey results)Graph 1: Yearly surveys of usersatisfaction2006 2007 2008Celje Adm<strong>in</strong>istrative Unit 4,29 4,44 4,72139
ADMINISTRATIVE UNIT CELJE: COOPERATION WITH THE MEDIA FOR A MORE ...Quality barometerS<strong>in</strong>ce 2006, the Slovenian Public Adm<strong>in</strong>istration has been carry<strong>in</strong>g out surveysof user satisfaction by way of short questionnaires, which are either sent bypost together with documents requested by a customer, or filled <strong>in</strong> at the counter.The table shows average and above average results for Celje Adm<strong>in</strong>istrativeUnit, <strong>in</strong> comparison to the mean value calculated for the whole country, for2006 and 2007, and slightly below average results <strong>in</strong> 2008. However, the averageresult of 4.58 <strong>in</strong>dicates that our users are extremely satisfied with the qualityof services provided, with the attitude of civil servants and with the way thepremises of the Celje Adm<strong>in</strong>istrative Unit are kept.Table 3: Monthly surveys of user satisfaction -BarometerGraph 2: Monthly surveys of user satisfaction– Celje Adm<strong>in</strong>istrative Unit2006 2007 2008Celje Adm<strong>in</strong>istrative Unit 4,46 4,66 4,58Surveys carried out among members of the coord<strong>in</strong>at<strong>in</strong>g advisorycommitteeIn 2008, the third consecutive survey was carried out among members of thecoord<strong>in</strong>at<strong>in</strong>g advisory committee, The survey gathered <strong>in</strong>formation on thefollow<strong>in</strong>g topics: service quality, expertise of civil servants, responsiveness ofcivil servants, assessment of the premises, equipment and environment, availabilityand comprehensibility of <strong>in</strong>formation, time for process<strong>in</strong>g applications,one-stop-shop procedures, level of knowledge of staff, is the service providedas soon as possible, read<strong>in</strong>ess to help the customer, The results are the follow<strong>in</strong>g:Table 4: Surveys among members of thecoord<strong>in</strong>at<strong>in</strong>g advisory committee - resultsGraph 3: Surveys among members of thecoord<strong>in</strong>at<strong>in</strong>g advisory committee - resultsYear 2006 2007 2008Average 4,45 4,77 4,46140
DAMJAN VREČKO, JOŽICA TAMŠE, MSCSurvey of media satisfaction with the quality of communication withCelje Adm<strong>in</strong>istrative UnitA survey <strong>in</strong>quir<strong>in</strong>g about media satisfaction with the quality of communicationwith Celje Adm<strong>in</strong>istrative Unit and the quality of <strong>in</strong>formation provided wasconducted for the first time <strong>in</strong> 2008.Table 5: Media satisfaction survey - resultsQuestionWould you say the work of the Adm<strong>in</strong>istrativeUnit is <strong>in</strong>terest<strong>in</strong>g for your readers?Is <strong>in</strong>formation provided <strong>in</strong> an understandableway?Evaluation3,923,67Is <strong>in</strong>formation provided of a professional level? 4,5Cooperation with Celje Adm<strong>in</strong>istrative Unit 3,83Visibility of Celje Adm<strong>in</strong>istrative Unit <strong>in</strong> the media 4,33Staff attitude 4,67Accessibility and orderl<strong>in</strong>ess of Celje AU premises 4,67Will<strong>in</strong>gness to provide <strong>in</strong>formation 4,5Graph 4: Evaluation of <strong>in</strong>dividualelements of media exposure of CeljeAdm<strong>in</strong>istrative Unit3,67Economic sector satisfaction surveysCelje Adm<strong>in</strong>istrative Unit also evaluates the satisfaction of the economic sectorwith the quality and friendl<strong>in</strong>ess of its services and uses the results as the basisfor further improv<strong>in</strong>g the quality of its services. In January <strong>2009</strong>, the secondenterprise satisfaction survey was carried out. The questionnaire was sent to 86enterprises established with<strong>in</strong> the area of Celje Adm<strong>in</strong>istrative Unit which hadused our services <strong>in</strong> 2008. The survey gathered <strong>in</strong>formation on the follow<strong>in</strong>g topics:service quality, expertise of civil servants, responsiveness of civil servants,assessment of the premises, equipment and environment, availability and comprehensibilityof <strong>in</strong>formation, time for process<strong>in</strong>g applications, one-stop-shopprocedures, level of knowledge of staff, is the service provided as soon as possible,read<strong>in</strong>ess to help the customer. Answers are shown <strong>in</strong> the table below.Table 6: Enterprise satisfactionsurvey resultsGraph 5: Major enterprise satisfactionsurvey resultsYear 2007 2008Average 4,42 4,46141
ADMINISTRATIVE UNIT CELJE: COOPERATION WITH THE MEDIA FOR A MORE ...Entries <strong>in</strong> the book of remarks and commendationsIn order to monitor, analyse and constantly improve our services and <strong>in</strong> orderbetter to appreciate the requirements of our users, we collect and analyse entries<strong>in</strong> the book of remarks and commendations, and remarks sent by eithere-mail or regular mail.The table below shows that the number of entries <strong>in</strong> the book of remarks andcommendations is steadily grow<strong>in</strong>g and that, <strong>in</strong> particular, the number of commendationsis <strong>in</strong>creas<strong>in</strong>g. In 2006, they were 45%, <strong>in</strong> 2007 86% and <strong>in</strong> 2008 97%.Table 7: Entries <strong>in</strong> the book of remarksand commendationsGraph 6: Share of commendations <strong>in</strong>relation to the total number of entries2006 2007 2008Commendation 27 61 71Remark 29 10 1Grievamce 4 1Total 60 71 733.1 INNOVATIONInnovation is no longer a driv<strong>in</strong>g force reserved only for the economic sector; itis also welcome <strong>in</strong> <strong>public</strong> adm<strong>in</strong>istration Such a user-oriented strategy of <strong>public</strong>adm<strong>in</strong>istration bodies has resulted <strong>in</strong> a grow<strong>in</strong>g number of <strong>in</strong>novations with<strong>in</strong>the doma<strong>in</strong>. In the context of its advisory activities, also provided throughcommunication with the media, Celje AU has promoted a series of <strong>in</strong>novativesolutions and <strong>in</strong>troduced them <strong>in</strong> the <strong>public</strong> adm<strong>in</strong>istration environment. Variousactivities have been carried out <strong>in</strong> this doma<strong>in</strong>, such as:— even before e-government was <strong>in</strong>troduced, Celje Adm<strong>in</strong>istrative Unit prepared<strong>in</strong>formation for its users <strong>in</strong> both leaflet 3 and electronic form, conta<strong>in</strong><strong>in</strong>g<strong>in</strong>structions concern<strong>in</strong>g <strong>in</strong>dividual adm<strong>in</strong>istrative procedures and sample applicationforms,— a CD ROM show<strong>in</strong>g the most common mistakes made by candidates for a Bcategory driv<strong>in</strong>g license was published,— electronic documents for the <strong>in</strong>troduction of a quality management systemwere prepared,3Fold-out (presentation of the Celje Adm<strong>in</strong>istrative Unit), Leaflet on the Celje Adm<strong>in</strong>istrative Unit,Guide of the Celje Adm<strong>in</strong>istrative Unit, Collection of sample applications.142
DAMJAN VREČKO, JOŽICA TAMŠE, MSC— and the head of the Unit <strong>in</strong>troduced regular monthly “<strong>in</strong>formal” meet<strong>in</strong>gs withstaff over “morn<strong>in</strong>g coffee”.3.2 RESULTSAdm<strong>in</strong>istrative units, as part of <strong>public</strong> adm<strong>in</strong>istration, provide a variety of servicesto their users, mostly <strong>in</strong> the doma<strong>in</strong> of <strong>in</strong>ternal adm<strong>in</strong>istrative affairs (identitypapers, registration of residence and vehicles, driv<strong>in</strong>g licenses, civil registry),environment and spatial management (build<strong>in</strong>g and operational permits), agricultureand economy (trade <strong>in</strong> agricultural land, reference parcels – GERK, e-vem), labour, family and social affairs (war victims), etc.Through the presentation of our work <strong>in</strong> the media and by provid<strong>in</strong>g answersto the most frequently asked questions <strong>in</strong> local newspapers and TV stations, westrive to raise the quality and effectiveness of our adm<strong>in</strong>istration, and make iteven more transparent, accessible and user-friendly. The goal we have set is toenhance the satisfaction of our customers and employees, and reduce costs.The results of yearly surveys show that this system of <strong>in</strong>teraction is favourablyaccepted by the general <strong>public</strong>, which is satisfied with the answers and <strong>in</strong>formationconcern<strong>in</strong>g <strong>in</strong>novations <strong>in</strong> legislation provided <strong>in</strong> the media.The follow<strong>in</strong>g table shows how the customers evaluated the availability andcomprehensibility of <strong>in</strong>formation (yearly customer satisfaction survey):Table 8: Customers’ evaluation of theavailability and comprehensibilityof <strong>in</strong>formationGraph 7: Customers’ evaluation of theavailability and comprehensibility of<strong>in</strong>formationYear 2006 2007 2008Evaluation 4,32 4,40 4,553.3 COOPERATION AND PARTNERSHIP RELATIONSCelje Adm<strong>in</strong>istrative Unit cooperates with other local <strong>public</strong> adm<strong>in</strong>istrationbodies with<strong>in</strong> its coord<strong>in</strong>ation advisory committee. Cooperation focuses onactivities for solv<strong>in</strong>g problems <strong>in</strong> areas of common <strong>in</strong>terest, such as relations143
ADMINISTRATIVE UNIT CELJE: COOPERATION WITH THE MEDIA FOR A MORE ...with customers and staff, harmonisation of legal ambiguities, and preparationof common answers to FAQs.Specifically, the questions received by the adm<strong>in</strong>istrative unit or by the advisorfor customer assistance – by phone, regular or email, often reach beyond thefield of work of the unit. Such questions are referred to the <strong>in</strong>stitution responsiblefor the relevant area, and the answer is sent to both the customer and tothe media.4 SUMMARYThrough its advisory and assistance operations, Celje Adm<strong>in</strong>istrative Unit ismak<strong>in</strong>g its operation more efficient and rais<strong>in</strong>g its quality, contribut<strong>in</strong>g to theelim<strong>in</strong>ation of adm<strong>in</strong>istrative barriers affect<strong>in</strong>g its clients and employees, andenhanc<strong>in</strong>g the satisfaction of all users of our services. Respond<strong>in</strong>g to FAQs andprovid<strong>in</strong>g <strong>in</strong>formation on legislative <strong>in</strong>novations <strong>in</strong> the media has proven to bean excellent means of shap<strong>in</strong>g a more efficient and user-friendly <strong>public</strong> adm<strong>in</strong>istration.Positive developments may be observed <strong>in</strong> speedier completion ofprocedures, reduced operational costs, reduced costs for users and, <strong>in</strong> particular,<strong>in</strong> greater satisfaction of both users and staff.144
REDUCING THE RESPONSE BURDEN OFREPORTING UNITS THROUGH HARMONISATIONOF ENVIRONMENTAL DATA COLLECTIONMojca ŽITNIK, MScStatistical Office of the Re<strong>public</strong> of Sloveniamojca.zitnik@gov.si1 INTRODUCTION1.1 THE STATISTICAL OFFICE OF THE REPUBLIC OF SLOVENIAThe Statistical Office of the Re<strong>public</strong> of Slovenia (SORS) is an <strong>in</strong>dependent government<strong>in</strong>stitution and the pr<strong>in</strong>ciple provider of national statistics, as well asfacilitator and co-ord<strong>in</strong>ator <strong>in</strong> this area. Its pr<strong>in</strong>ciple tasks are: <strong>in</strong>ternational cooperation,determ<strong>in</strong>ation of methodological and classification standards, anticipationof users’ needs, collection, process<strong>in</strong>g and dissem<strong>in</strong>ation of data, and tak<strong>in</strong>gcare of their confidentiality. The national statistics provides the <strong>public</strong> adm<strong>in</strong>istrationbodies and organisations, the economy and the general <strong>public</strong> with dataon the exist<strong>in</strong>g conditions and trends <strong>in</strong> the economic, demographic and socialfield, as well as <strong>in</strong> the field of the environment and natural resources.In perform<strong>in</strong>g its activities, SORS is, as a matter of priority, advocat<strong>in</strong>g the positionthat the national statistics should be high quality and user friendly. Inthe past, the quality of statistical data was primarily considered <strong>in</strong> connectionwith data accuracy <strong>in</strong> the narrower sense (<strong>in</strong> particular, <strong>in</strong> the balance betweenstatistical data and true values). However, <strong>in</strong> the last decade, the statistical discipl<strong>in</strong>ehas made great progress with regards to the quality of statistical data.1.2 DEPARTMENT FOR ENVIRONMENT AND ENERGY STATISTICSThis department is one of the three departments <strong>in</strong> the Environmental StatisticsSector. Among other tasks, the department collects data on water (<strong>public</strong> water-distributionsystem and <strong>public</strong> sewage system supply, water use <strong>in</strong> <strong>in</strong>dustry,agriculture and construction, and irrigation water use), waste (waste generationand treatment <strong>in</strong> production and service activities, <strong>public</strong> waste removaland landfills), environmental disasters, environmental protection expenditure(<strong>in</strong>vestment and current expenditure for environmental protection), environmentalaccounts (air emissions and material-flow accounts) and energy. Datawhich represents the basis for <strong>in</strong>dividual statistical surveys <strong>in</strong> this area is ob-
REDUCING THE RESPONSE BURDEN OF REPORTING UNITS THROUGH HARMONISATION ...ta<strong>in</strong>ed at report<strong>in</strong>g units, while the results are published once a year <strong>in</strong> the FirstRelease and <strong>in</strong> the SI-Stat database on the web site, <strong>in</strong> the Statistical Yearbook,and partly also <strong>in</strong> the <strong>public</strong>ation entitled Slovenia <strong>in</strong> Figures.1.3 SORS SURVEYS ON WASTESORS carried out a pilot statistical waste survey <strong>in</strong> 1991 and <strong>in</strong> the follow<strong>in</strong>gyear this survey became part of its regular survey activities. Dur<strong>in</strong>g the <strong>in</strong>itialperiod, these surveys were performed every three years (i.e. <strong>in</strong> 1992, 1995, 1998and 2001). Dur<strong>in</strong>g <strong>in</strong>dividual years, the methodology of data collection sawsubstantial changes, developments and supplementations, accompanied bythe expansion and supplementation of the list of report<strong>in</strong>g units. The resultwas that the coverage differed from survey to survey. Therefore, data on wastecannot usually be compared reliably <strong>in</strong> time series. In 2001, SORS decided torevive waste surveys. Tak<strong>in</strong>g account of the Eurostat requirements, it def<strong>in</strong>edthe methodology of waste data-collection, harmonised the waste classificationlist <strong>in</strong> order to br<strong>in</strong>g it <strong>in</strong> l<strong>in</strong>e with all EU Member States, and determ<strong>in</strong>ed thedata-collection threshold, mean<strong>in</strong>g that data acquisition would cover all unitsemploy<strong>in</strong>g 10 or more employee. By consider<strong>in</strong>g these requirements, wastesurveys across EU Member States were harmonised, which also provided themore-detailed data on waste required for biannual report<strong>in</strong>g to Eurostat accord<strong>in</strong>gto the Jo<strong>in</strong>t OECD/EUROSTAT questionnaire. When Slovenia jo<strong>in</strong>edthe EU and adopted the Waste Statistics Regulation, the report<strong>in</strong>g of data onwaste to Eurostat became obligatory.1.4. EARS SURVEYS ON WASTEThe Environmental Agency of the Re<strong>public</strong> of Slovenia (EARS) has <strong>in</strong> the past,and <strong>in</strong>dependently of SORS, also monitored the generation and treatment ofwaste <strong>in</strong> Slovenia. Because EARS is not dependent to Eurostat, it was not obligedto consider Eurostat <strong>in</strong>structions and recommendations. Therefore, it carriedout surveys accord<strong>in</strong>g to its own methodology. It considered its own list ofreport<strong>in</strong>g units and sent the data thus obta<strong>in</strong>ed to the European EnvironmentAgency (EEA). Ow<strong>in</strong>g to the differences <strong>in</strong> the method of data collection, thef<strong>in</strong>al data collected by EARS substantially differ from those obta<strong>in</strong>ed by SORS.2 REASONS FOR ARRANGEMENT WITH EARSOne of the pr<strong>in</strong>ciple tasks of SORS is to collect data <strong>in</strong> various fields, <strong>in</strong>clud<strong>in</strong>g theenvironmental field. SORS has been collect<strong>in</strong>g data on environmental occurrencefor almost 20 years. Almost the same is true of the Environmental Agency of the146
MOJCA ŽITNIK, MSC.Re<strong>public</strong> of Slovenia (EARS), as it has also been collect<strong>in</strong>g environmental datafor a number of years. Every year, the two <strong>in</strong>stitutions <strong>in</strong>vested much time, work,energy and money <strong>in</strong>to the acquisition of this data. Eventually, however, theyhad at their disposal entirely different data on the same matter.The differences between the data of the two <strong>in</strong>stitutions primarily resulted fromdifferent methods of data collection. Due to different collection methodology, <strong>in</strong>particular, alongside a different list of report<strong>in</strong>g units and different process<strong>in</strong>g ofthe data obta<strong>in</strong>ed, the f<strong>in</strong>al data collected at SORS substantially differed from thatcollected by EARS. This was particularly true of data on waste, because the two<strong>in</strong>stitutions collected fully identical data, but us<strong>in</strong>g different methodology andmostly at different report<strong>in</strong>g units. The consequence of these various methodsof data collection was that the two <strong>in</strong>stitutions operated with different data. Thesituation became even more complicated when the two <strong>in</strong>stitutions separatelysent their respective data to various European and domestic databases, SORS toEurostat and EARS to EEA. Both at home and abroad, Slovenia thus presenteddifferent data on waste. An additional difficulty caused by double data collectionwas also a double burden imposed on the same report<strong>in</strong>g units, and, of course,effectively doubled costs for process<strong>in</strong>g the data obta<strong>in</strong>ed.PRIOR to thearrangementEARS− approximately 1,200 units covered bysurvey− data published <strong>in</strong> raw form withoutadditional controls− raw data sent to EEASURS− approximately 3,700 units covered bysurvey− data published <strong>in</strong> consolidated form− consolidated and processed data sentto EurostatAFTER thearrangement− approximately 6,000 units covered by survey− consolidated and processed data published− identical data sent to EEA and EurostatDur<strong>in</strong>g the 1990s, environmental data became <strong>in</strong>creas<strong>in</strong>gly important. This datawas the basis for launch<strong>in</strong>g the design of analysis and forecasts for the future.This, of course, called for a high level of accuracy, credibility and reliability.Environmental data was also the basis for produc<strong>in</strong>g analyses of dr<strong>in</strong>k<strong>in</strong>g water,water pollution, water stocks, environmental pollution caused by excessiveamounts of generated waste and, <strong>in</strong> particular, by the disposal of excessiveamounts of this waste, as well as analyses of the emission of harmful substances<strong>in</strong>to the atmosphere and greenhouse gas emissions, etc.For all these reasons, SORS and EARS began, at the beg<strong>in</strong>n<strong>in</strong>g of 2001, discuss<strong>in</strong>gan agreement on jo<strong>in</strong>t collection of data on waste <strong>in</strong> Slovenia. After<strong>in</strong>itial difficulties, this process saw the design of a common methodology andcommon questionnaires, which have been used for collect<strong>in</strong>g data on wastes<strong>in</strong>ce 2002.147
REDUCING THE RESPONSE BURDEN OF REPORTING UNITS THROUGH HARMONISATION ...The common methodology is founded on the requirements of SORS, which isbound by the requirements of EUROSTAT and the Waste Statistics Regulation(EC 2150/2002), and the requirements of EARS, which is bound by the WasteTreatment Regulation (34/2008).This co-operation and the design of common questionnaires for data collectionresulted <strong>in</strong>:— reduction of adm<strong>in</strong>istrative burden of report<strong>in</strong>g units,— reduction of costs for carry<strong>in</strong>g out surveys and— harmonisation of data.Follow<strong>in</strong>g the successful <strong>in</strong>troduction of co-operation <strong>in</strong> waste statistics, SORSand EARS extended their partnership work to other environmental areas andprecisely def<strong>in</strong>ed/determ<strong>in</strong>ed the transfer of environmental data from one<strong>in</strong>stitution to the other. Thus, they harmonised and legally regulated otherareas of environment statistics, and drafted a legal and formal Agreement onRationalisation of Data Collection <strong>in</strong> Environment Statistics <strong>in</strong> Slovenia.3 AGREEMENT ON RATIONALISATION OF DATA COLLEC-TION IN ENVIRONMENTAL STATISTICSThe idea of an agreement between the two <strong>in</strong>stitutions arose soon after thecommencement of preparations for a common methodology and the <strong>in</strong>troductionof common questionnaires for waste statistics. In 2002, an agreement on cooperation,<strong>in</strong>clud<strong>in</strong>g a detailed def<strong>in</strong>ition of distribution of tasks to be performed<strong>in</strong> the area of waste by the <strong>in</strong>dividual <strong>in</strong>stitutions, was drafted. The tasks havebeen distributed so that EARS primarily attends to the send and receive ofquestionnaires, while SORS is <strong>in</strong> charge of the preparation, process<strong>in</strong>g, analys<strong>in</strong>gand tabulat<strong>in</strong>g of data and results. Upon completion of a survey, both <strong>in</strong>stitutionsuse the obta<strong>in</strong>ed data for <strong>in</strong>ternational and domestic report<strong>in</strong>g. The <strong>in</strong>troductionof the agreement and the distribution of tasks has allowed costs to be reduced<strong>in</strong> the implementation of surveys, eased the response burden on report<strong>in</strong>g unitsand harmonised the presentation of data. So far, the results of the Agreementhave been very positive. Therefore, both <strong>in</strong>stitutions have decided to extendtheir co-operation to the exchange of data on air, biodiversity and environmentaltaxes. In the <strong>in</strong>itial stage, the agreement consisted of four annexes: waste statistics,emission data, biodiversity and environmental taxes. Firstly, it was implementedon a voluntary basis, and then <strong>in</strong> 2007, the two <strong>in</strong>stitutions signed the agreementand thus also formally regulated their co-operation.In view of the positive experience ga<strong>in</strong>ed on the basis of the officiallyconcluded and signed agreement, co-operation was subsequently extended148
MOJCA ŽITNIK, MSC.to an additional three environmental areas. SORS and EARS supplementedthe exist<strong>in</strong>g agreement with annexes cover<strong>in</strong>g the exchange of data <strong>in</strong> waterstatistics, environmental taxes and the quantity and content of liquid fuels, andbiofuels and other renewable fuels for motor vehicle propulsion <strong>in</strong> road traffic.Although the supplement to the agreement has been <strong>in</strong> effect s<strong>in</strong>ce 2007 (waterand environmental taxes) and 2008 (fuels), respectively, it has not yet beenofficially signed. It is expected that the sign<strong>in</strong>g will still take place <strong>in</strong> this year.4 SORS – EARS CO-OPERATION RESULTSBy establish<strong>in</strong>g co-operation and sign<strong>in</strong>g the agreement on jo<strong>in</strong>t collection ofenvironment statistics, SORS and EARS:— established close partner relations,— harmonised data <strong>in</strong> the environmental area,— reduced the operational costs of both <strong>in</strong>stitutions and costs for carry<strong>in</strong>g out<strong>in</strong>dividual surveys,— did away with confusion among data users and— <strong>in</strong> particular, eased the response burden of report<strong>in</strong>g units.The positive effects of co-operation can also be observed <strong>in</strong> the light of<strong>in</strong>novation and susta<strong>in</strong>able data quality, and also as a contribution to meet<strong>in</strong>gthe objectives of the Lisbon strategy.— InnovationThe <strong>in</strong>novative nature of the described solution is particularly emphasisedby a higher level of harmonisation between the two <strong>in</strong>stitutions, which havedifferent databases at their disposal cover<strong>in</strong>g the same area. A <strong>good</strong> exampleis air or greenhouse gas emissions: as the body <strong>in</strong> charge of the calculation ofgreenhouse gas emissions, EARS is us<strong>in</strong>g the exist<strong>in</strong>g energy sector databases,which, on the other hand, are updated with data collected and entered bySORS. The calculations of greenhouse gas emissions made by EARS are takenover by SORS and used to calculate emissions of harmful substances <strong>in</strong>to theair. Consequently, both <strong>in</strong>stitutions use the same databases, enhance their cooperationand lessen the burden on report<strong>in</strong>g units.— Susta<strong>in</strong>able qualityBy sign<strong>in</strong>g the Agreement on Rationalisation of Data Collection Harmonisation <strong>in</strong>Environmental Statistics <strong>in</strong> Slovenia, SORS and EARS harmonised the collectionand process<strong>in</strong>g of environmental data, thus ensur<strong>in</strong>g a susta<strong>in</strong>able quality offuture data. By apply<strong>in</strong>g this harmonised data, Slovenia can, accord<strong>in</strong>gly, presentitself both at home and abroad with confidence and a s<strong>in</strong>gle approach.149
REDUCING THE RESPONSE BURDEN OF REPORTING UNITS THROUGH HARMONISATION ...— Contribution to implementation of the Lisbon strategy objectivesAmong other th<strong>in</strong>gs, the objectives of the Lisbon strategy aim at <strong>in</strong>creas<strong>in</strong>gthe efficiency of national <strong>public</strong> adm<strong>in</strong>istration, improv<strong>in</strong>g the quality ofits services and strengthen<strong>in</strong>g its advisory function. The establishment ofco-operation between SORS and EARS <strong>in</strong>deed raised the efficiency of the<strong>public</strong> adm<strong>in</strong>istration, as it contributed to the reduction of the costs of surveyimplementation and eased the burden on companies. This, of course, wasalso accompanied by an <strong>in</strong>crease <strong>in</strong> quality, as environmental data requiredfor future analyses, projects and plans were harmonised and correspond<strong>in</strong>glyimproved. The advisory role of the two <strong>in</strong>stitutions thus acquired added valueresult<strong>in</strong>g from their s<strong>in</strong>gle appearance and the s<strong>in</strong>gle approach to advisoryservices provided for users and reporters of these data.5 CONCLUSIONBy sign<strong>in</strong>g the Agreement on Rationalisation of Data Collection andHarmonisation <strong>in</strong> Environment Statistics <strong>in</strong> Slovenia, SORS and EARS madea major step towards the reduction of response burden on report<strong>in</strong>g units.A detailed distribution of work <strong>in</strong> carry<strong>in</strong>g out surveys and determ<strong>in</strong>ationof procedures, as to what and when was <strong>in</strong>volved, and how, simplified theexchange of adm<strong>in</strong>istrative data between the two <strong>in</strong>stitutions, reduced thecosts of collect<strong>in</strong>g and process<strong>in</strong>g data, eased the burden on report<strong>in</strong>g units,over-burdened as they already are, and, of course, harmonised environmentalstatistics and data represent<strong>in</strong>g Slovenia both at home and abroad.6 SUMMARYIn a time characterised by lack of time, which is particularly true of report<strong>in</strong>gunits, and the further need for cost reduction, all progress is welcome. Somefive years ago, SORS and EARS followed current trends and tried to <strong>in</strong>troducejo<strong>in</strong>t surveys <strong>in</strong> the field of waste statistics. By harmonis<strong>in</strong>g surveys, the two<strong>in</strong>stitutions reduced the response burden on report<strong>in</strong>g units and survey implementationcosts, and, <strong>in</strong> particular, harmonised the results or data that are requiredfor environment-related national and <strong>in</strong>ternational report<strong>in</strong>g purposes.In the light of <strong>good</strong> results <strong>in</strong> the area of waste statistics, SORS and EARS extendedtheir co-operation to other environmental areas, such as water, air (air emissions),biodiversity and environmental taxes earmarked for environmental protection.At the beg<strong>in</strong>n<strong>in</strong>g of 2007, they signed the Agreement on Rationalisationof Data Collection and Harmonisation <strong>in</strong> Environment Statistics <strong>in</strong> the Re<strong>public</strong>of Slovenia, thus f<strong>in</strong>alis<strong>in</strong>g the establishment of their jo<strong>in</strong>t co-operation.150