Student Activity Piggy Bank - Project Maths
Student Activity Piggy Bank - Project Maths
Student Activity Piggy Bank - Project Maths

You also want an ePaper? Increase the reach of your titles
YUMPU automatically turns print PDFs into web optimized ePapers that Google loves.
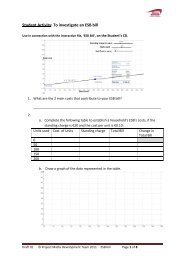
2.a. Peter has €25 in his piggy bank and every day after that he spends €3.Complete the following table:DayMoney left in the <strong>Piggy</strong> <strong>Bank</strong>01234567825b. Represent the information contained in the table in part a in the graph belowtaking day 0 to be the start of the month:.c. Assuming Peter has no other source of income, what happens after day 9?______________________________________________________________________________________________________________________________d. Why are dots more appropriate in the graph, rather than a continuous line torepresent the data?_______________________________________________________________e. Is the rate of change of this graph positive or negative? i.e. is the graphincreasing or decreasing? Explain your answer.Draft 01 © <strong>Project</strong> <strong>Maths</strong> Development Team 2011 <strong>Piggy</strong> <strong>Bank</strong> Page 3 of 5
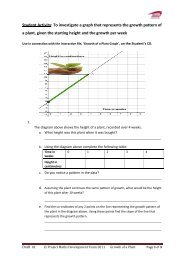
_______________________________________________________________f. Take any two points on the diagram and find the slope of the line that wouldpass through both these points. Repeat for another set of points.______________________________________________________________________________________________________________________________g. How does the answer for the slope of the line between any two points relateto the story about the piggy bank at the start?_______________________________________________________________h. Where on the graph does the starting amount appear? Explain your answer.______________________________________________________________________________________________________________________________3. Assuming the diagram below represents a money box:a. How much money had this student at the beginning of the month (i.e at day0)? Explain your answer.______________________________________________________________________________________________________________________________b. How much money did this student spend per day? Explain your answer._______________________________________________________________4. Assuming the graph below represents the money in of another student’s piggy bank,can you explain what is happening to the money in this student’s piggy bank startingat the beginning of the month?Draft 01 © <strong>Project</strong> <strong>Maths</strong> Development Team 2011 <strong>Piggy</strong> <strong>Bank</strong> Page 4 of 5
__________________________________________________________________________________________________________________________________________5. Assuming the graph below represents the spending pattern of another student canyou explain what is happening to the money in this student’s piggy bank? Explainyour answer.__________________________________________________________________________________________________________________________________________6. What would you suggest happened on day 4 and day 9 to this student’s money?Draft 01 © <strong>Project</strong> <strong>Maths</strong> Development Team 2011 <strong>Piggy</strong> <strong>Bank</strong> Page 5 of 5