Powering growth - Aztech Group Ltd - Investor Relations
Powering growth - Aztech Group Ltd - Investor Relations Powering growth - Aztech Group Ltd - Investor Relations
82a z t e c h a n n u a l r e p o r t 2 0 0 9F i n a n c i a l S t a t e m e n t s14 INVESTMENT PROPERTIES (cont’d)(a)Major properties of the Group are as follows:AreaDescription Location Existing use (in sq metres) Tenure of lease Fair value2009 2008$’000 $’000Investment Unit B to H, For rental 1,497 50 years with 10,173 9,348Property Level 20 effect fromFortune Building June 26, 2000Junction of JintianRoad and Fuhua3rd Road, FutianDistrict, ShenzhenGuangdongProvince, PRCUnit A Self-occupied 192 50 years with - 1,208Level 20effect fromFortune Building June 26, 2000Junction of JintianRoad and Fuhua3rd Road, FutianDistrict, ShenzhenGuangdongProvince, PRCInvestment ACE Building For rental 545 Freehold 2,150 2,100Property (5th Storey) 146BPaya Lebar RoadSingapore 40901712,323 12,656During the year, the above mentioned Unit A, Level 20 in Fortune Building was transferred out at its fair value from investment propertiesto property, plant and equipment at the date of change in use to owner occupied property.
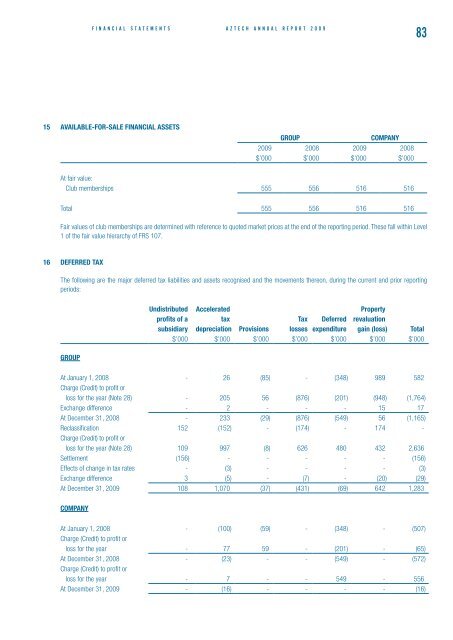
F i n a n c i a l S t a t e m e n t sa z t e c h a n n u a l r e p o r t 2 0 0 98315 AVAILABLE-FOR-SALE FINANCIAL ASSETSGROUPCOMPANY2009 2008 2009 2008$’000 $’000 $’000 $’000At fair value:Club memberships 555 556 516 516Total 555 556 516 516Fair values of club memberships are determined with reference to quoted market prices at the end of the reporting period. These fall within Level1 of the fair value hierarchy of FRS 107.16 DEFERRED TAXThe following are the major deferred tax liabilities and assets recognised and the movements thereon, during the current and prior reportingperiods:Undistributed Accelerated Propertyprofits of a tax Tax Deferred revaluationsubsidiary depreciation Provisions losses expenditure gain (loss) Total$’000 $’000 $’000 $’000 $’000 $’000 $’000GROUPAt January 1, 2008 - 26 (85) - (348) 989 582Charge (Credit) to profit orloss for the year (Note 28) - 205 56 (876) (201) (948) (1,764)Exchange difference - 2 - - - 15 17At December 31, 2008 - 233 (29) (876) (549) 56 (1,165)Reclassification 152 (152) - (174) - 174 -Charge (Credit) to profit orloss for the year (Note 28) 109 997 (8) 626 480 432 2,636Settlement (156) - - - - - (156)Effects of change in tax rates - (3) - - - - (3)Exchange difference 3 (5) - (7) - (20) (29)At December 31, 2009 108 1,070 (37) (431) (69) 642 1,283COMPANYAt January 1, 2008 - (100) (59) - (348) - (507)Charge (Credit) to profit orloss for the year - 77 59 - (201) - (65)At December 31, 2008 - (23) - - (549) - (572)Charge (Credit) to profit orloss for the year - 7 - - 549 - 556At December 31, 2009 - (16) - - - - (16)
- Page 33 and 34: C o r p o r a t e G o v e r n a n c
- Page 35 and 36: F i n a n c i a l S t a t e m e n t
- Page 37 and 38: F i n a n c i a l S t a t e m e n t
- Page 39 and 40: F i n a n c i a l S t a t e m e n t
- Page 41 and 42: F i n a n c i a l S t a t e m e n t
- Page 43 and 44: F i n a n c i a l S t a t e m e n t
- Page 45 and 46: F i n a n c i a l S t a t e m e n t
- Page 47 and 48: F i n a n c i a l S t a t e m e n t
- Page 49 and 50: F i n a n c i a l S t a t e m e n t
- Page 51 and 52: F i n a n c i a l S t a t e m e n t
- Page 53 and 54: F i n a n c i a l S t a t e m e n t
- Page 55 and 56: F i n a n c i a l S t a t e m e n t
- Page 57 and 58: F i n a n c i a l S t a t e m e n t
- Page 59 and 60: F i n a n c i a l S t a t e m e n t
- Page 61 and 62: F i n a n c i a l S t a t e m e n t
- Page 63 and 64: F i n a n c i a l S t a t e m e n t
- Page 65 and 66: F i n a n c i a l S t a t e m e n t
- Page 67 and 68: F i n a n c i a l S t a t e m e n t
- Page 69 and 70: F i n a n c i a l S t a t e m e n t
- Page 71 and 72: F i n a n c i a l S t a t e m e n t
- Page 73 and 74: F i n a n c i a l S t a t e m e n t
- Page 75 and 76: F i n a n c i a l S t a t e m e n t
- Page 77 and 78: F i n a n c i a l S t a t e m e n t
- Page 79 and 80: F i n a n c i a l S t a t e m e n t
- Page 81 and 82: F i n a n c i a l S t a t e m e n t
- Page 83: F i n a n c i a l S t a t e m e n t
- Page 87 and 88: F i n a n c i a l S t a t e m e n t
- Page 89 and 90: F i n a n c i a l S t a t e m e n t
- Page 91 and 92: F i n a n c i a l S t a t e m e n t
- Page 93 and 94: F i n a n c i a l S t a t e m e n t
- Page 95 and 96: F i n a n c i a l S t a t e m e n t
- Page 97 and 98: F i n a n c i a l S t a t e m e n t
- Page 99 and 100: F i n a n c i a l S t a t e m e n t
- Page 101 and 102: F i n a n c i a l S t a t e m e n t
- Page 103 and 104: F i n a n c i a l S t a t e m e n t
- Page 105 and 106: F i n a n c i a l S t a t e m e n t
- Page 107 and 108: F i n a n c i a l S t a t e m e n t
- Page 109 and 110: F i n a n c i a l S t a t e m e n t
- Page 111 and 112: F i n a n c i a l S t a t e m e n t
- Page 113 and 114: F i n a n c i a l S t a t e m e n t
- Page 115 and 116: F i n a n c i a l S t a t e m e n t
- Page 117 and 118: F i n a n c i a l S t a t e m e n t
- Page 119 and 120: F i n a n c i a l S t a t e m e n t
- Page 121 and 122: F i n a n c i a l S t a t e m e n t
- Page 123: HEAD OFFICEAZTECH GROUP LTD31 Ubi R
F i n a n c i a l S t a t e m e n t sa z t e c h a n n u a l r e p o r t 2 0 0 98315 AVAILABLE-FOR-SALE FINANCIAL ASSETSGROUPCOMPANY2009 2008 2009 2008$’000 $’000 $’000 $’000At fair value:Club memberships 555 556 516 516Total 555 556 516 516Fair values of club memberships are determined with reference to quoted market prices at the end of the reporting period. These fall within Level1 of the fair value hierarchy of FRS 107.16 DEFERRED TAXThe following are the major deferred tax liabilities and assets recognised and the movements thereon, during the current and prior reportingperiods:Undistributed Accelerated Propertyprofits of a tax Tax Deferred revaluationsubsidiary depreciation Provisions losses expenditure gain (loss) Total$’000 $’000 $’000 $’000 $’000 $’000 $’000GROUPAt January 1, 2008 - 26 (85) - (348) 989 582Charge (Credit) to profit orloss for the year (Note 28) - 205 56 (876) (201) (948) (1,764)Exchange difference - 2 - - - 15 17At December 31, 2008 - 233 (29) (876) (549) 56 (1,165)Reclassification 152 (152) - (174) - 174 -Charge (Credit) to profit orloss for the year (Note 28) 109 997 (8) 626 480 432 2,636Settlement (156) - - - - - (156)Effects of change in tax rates - (3) - - - - (3)Exchange difference 3 (5) - (7) - (20) (29)At December 31, 2009 108 1,070 (37) (431) (69) 642 1,283COMPANYAt January 1, 2008 - (100) (59) - (348) - (507)Charge (Credit) to profit orloss for the year - 77 59 - (201) - (65)At December 31, 2008 - (23) - - (549) - (572)Charge (Credit) to profit orloss for the year - 7 - - 549 - 556At December 31, 2009 - (16) - - - - (16)


